 Wei Zhang
 Kaiyi Yu
 Yingying Fang
- School of Economics, Beijing Technology and Business University, Beijing, China
Focusing on the components of both solar photovoltaic technology and wind energy technology and using the gravity model approach with panel data, this study empirically investigated the determinants of bilateral trade in renewable energy goods among ASEAN countries as well as with China, Japan, and South Korea for the period 2012–2019, and also identified China’s export efficiency and export potential. The results showed that the economic sizes of both the exporting and importing countries, the economic freedom of the exporter, and trade agreements and membership of common trade areas significantly encouraged bilateral trade, while geographical distance exerted a significantly negative influence. In general, it was found that China had great potential to export renewable energy goods. We propose that the ASEAN Plus Three region needs to formulate and implement a comprehensive and carefully coordinated renewable energy policy package. We also suggest that China should promote joint efforts with ASEAN, Japan and South Korea to further deepen cooperation on the low-carbon economy and tap the great potential for trade in renewable energy goods.
1 Introduction
Optimizing the energy structure of countries’ economies is an important component of the 17 Sustainable Development Goals (SDGs) proposed by the United Nations in 2015. The region encompassed by the Association of Southeast Asian Nations (Brunei, Cambodia, Indonesia, Laos, Malaysia, Myanmar, Singapore, Thailand, the Philippines, and Vietnam) plus China, Japan, and South Korea—more commonly known as ASEAN Plus Three (APT), which, in 2019, comprised 29.2% of the global population and 27.7% of global gross domestic product (GDP), is one of the most dynamic and rapidly growing regions in the world. However, along with its rapid economic development in recent decades, the APT region has become a dominant energy consumer (Cabalu et al., 2010). Its energy consumption has increased massively, especially the consumption of primary energy sources such as oil, gas, coal, and electricity, leading to a sharp rise in greenhouse gas (GHG) emissions. International Energy Agency (IEA) data show that, from 1990 to 2019, regional emissions of carbon dioxide—the primary GHG emitted through human activities—almost quadrupled, from 3.91 gigatons in 1990 to 13.13 gigatons in 2019, growing at more than twice the global average rate of 1.72% and accounting for 39% of global emissions in 2019. Expanding economic activity and continuously growing energy consumption have exacerbated the region’s energy stresses, making the region as a whole heavily dependent on external energy supplies—mostly fossil fuel energy.
The APT economies face severe challenges with regard to the adverse impacts of fossil fuel use, including the growth of carbon emissions, environment pollution, and energy price volatility (Zhao et al., 2020), as well as energy security, an issue of great importance, given the region’s strong dependence on external energy supply. Addressing these issues is therefore vital for economies in the region if they wish to strive for sustainable “green” development. Some progress has been made in recent years in respect of coordinated climate and energy policies. A regional renewable energy goods (REG) trade perspective offers a way forward for reducing environment degradation and climate change, improving regional energy security, and strengthening sustainable economic development.
Renewable energy sources—such as solar, wind, tidal, hydro, and geothermal heat—can offer energy independence, reduce carbon dioxide emissions, and mitigate climate change (Algieri et al., 2011). Although characterized by abundant endowments of solar, wind, hydro, and geothermal resources, many APT countries are often hindered by multidimensional constraints that prevent access to these new energy resources, among which the lack of the necessary technological and engineering solutions, as well as the power generation facilities for developing energy generation, transmission, and distribution capacities, are acknowledged to be the major barriers. The promotion of green trading of cost-effective and efficient REG is crucial for the development of a low-carbon economy (Sawhney and Kahn, 2012; Kalirajan and Liu, 2016) because it can relieve the aforementioned technical barriers by accelerating the deployment of REG and the dissemination of low-carbon technologies, stimulate additional investment, and develop local industries producing renewable energy systems and components to meet demand (Lewis and Wiser, 2007; Matsumura, 2021). This will lead overall decarbonization and help to attain goal 7 of the SDGs (affordable and clean energy) by substituting conventional fossil fuels with renewable energy (Yu, 2003; Algieri et al., 2011; Zaman and Kalirajan, 2019; Qadir and Dosmagambet, 2020). For these reasons, it is crucially important to explore the dynamics of REG trade. Using gravity models of international trade, Costantini and Crespi (2008) and Costantini and Mazzanti (2012) concluded that the stringency of environmental regulation, supplemented by the strength of the national innovation system, had a significant positive effect on the export of a broad category of environmental goods. Algieri et al. (2011) analyzed the determinants of exports of photovoltaic (PV) panels by the United States (US), finding a positive impact of foreign income and a negative impact of relative prices. Sawhney and Kahn (2012) examined the determinants of US imports of a total of 13 wind and solar power generation equipment products classified according to six-digit harmonized system (HS) codes, demonstrating that US sector-specific foreign direct investment (FDI) and the exporting country’s domestic renewable power generation were significant drivers. Jomit (2014) showed that the GDP of the importing countries, the common colonizer, and membership of bilateral trade agreements were all positive determinants of India’s exports of environmental goods. Groba (2014) provided evidence that regulatory policies and import tariffs determined the exports of solar thermal and solar PV energy systems and their components (solar PV). Cantore and Cheng (2018) concluded that a substitution effect exists between environmental regulation stringency and trading of environmental goods; increased capacity to innovate, cultural ties, geographical proximity, and financial uncertainty also play a role. Kuik et al. (2019) clarified the positive effects of renewable energy support policies on exports of wind energy technology systems and their components (WETC) and solar PV goods. Matsumura (2021) concluded that regional integration accelerates trade in regional environmental goods, while bilateral tariff rates discourage regional trade.
The APT countries share a common environment, and the promotion of intraregional “clean trade” has aroused great interest among both policymakers and academics. Not only can it improve this region’s energy security in terms of energy availability, accessibility, acceptability, and affordability, it can also foster a well-interconnected and integrated market and closer economic ties, as well as more harmonious bilateral relations (Sattich et al., 2021). The Renewable Energy Policy Network for the 21st Century (REN21) Renewables 2012 Global Status Report showed that considerable progress has been made in global investment in renewables in 2011: it rose 17% to a new record USD 257 billion, more than six times the figure for 2004 and almost twice the total investment in 2007, the year before the global financial crisis. Since then, most APT countries have stepped up their ambitions for and actions aimed at decarbonization and sustainability, and the intraregional trading of REG and related technologies has assumed a growing share in the overall trade of the APT region. The United Nations Conference on Trade and Development (UNCTAD) Comtrade (https://comtrade.un.org) statistics show that the value of intraregional trade in solar PV and WETC goods in APT countries increased between 2012 and 2019, rising from USD 36.46 billion in 2012 to USD 47.85 billion in 2019, an average growth rate of 3.93%. Among the APT countries, China has a major role to play in intraregional REG trade. Although rated as the largest energy consumer in the world, China is also the largest producer and consumer of renewable energy, laying a solid foundation for China’s participation in renewable energy cooperation with ASEAN plus Japan and South Korea (Zhao et al., 2020; Shuai et al., 2022; Zhao et al., 2022). Since 2007, the total international trade volume of REG in China has grown rapidly, from USD 139.447 billion in 2007 to USD 202.908 billion in 2017 (Shuai et al., 2020). More specifically, China ranks among the world’s leading producers and exporters of solar PV and WETC products, which have shown significant growth and considerable trading opportunities (Algieri et al., 2011; Sawhney and Kahn, 2012). In the early 2000s, China accounted for only 10% of the global market share of WETC trade and 15% of global trade in solar PV, but it had doubled its share by 2011 (Kuik et al., 2019). The REN21 Renewables Global Status Reports indicate that China has dominated the world market for these products, as well as for their manufacture. In particular, China plays an important role in promoting REG trade among emerging and developing countries (Steenblik, 2005). With China’s continually increasing economic ties with ASEAN members, Japan, and South Korea, these countries have become important markets for China’s exports of REG. The different resource endowments and development stages of the renewable energy industry of the APT countries have made them highly complementary and deeply integrated into the REG industrial and value chains and increased the potential of their cooperation in producing renewable energy. In September 2020, at the 75th session of the UN General Assembly, China announced its commitment to realizing a carbon emissions peak by 2030 and achieving carbon neutrality by 2060, which is important for energy transformation, low-carbon development, and REG trade in the APT region because the setting of renewable energy targets and climate commitments in one country may spur similar efforts in others (Sattich et al., 2021).
Given the enormous potential for the development and utilization of renewable energy and intraregional trade in REG, as well as China’s status as an important REG exporter, the traditional focus on the REG trade of European Union (EU) and Organisation for Economic Co-operation and Development (OECD) countries is no longer warranted (Kuik et al., 2019). However, the dynamics of REG trade in the APT region remains under-investigated, and, in general, earlier studies did not account for the potential for trade between China and ASEAN plus Japan and South Korea, which is important for promoting regional energy cooperation. Several earlier studies examined other country groupings, including some of the APT countries, but they reached mixed conclusions regarding the factors affecting the potentials for trade. Zaman and Kalirajan (2019) used a gravity model extended with the determinants of efficiency models in order to analyze the trade in 16 low-carbon REG with six-digit HS codes in South and East Asia. Their results demonstrated that, for most countries, intraregional exports of REG are positively influenced by the GDP of the trading pairs and the regional trade agreements (RTAs) between them, and negatively related to tariffs and geographic distance. They further defined export efficiency as the ratio of exports under the impacts of country-specific infrastructural and institutional factors to those without those impacts, and they found that China and Japan are the most efficient in respect of renewable energy exports, while Bangladesh remains the least efficient. Focusing on three solar PV products and seven WETC products with six-digit HS codes, Groba and Cao (2015) empirically identified the determining factors of China’s REG exports to 43 developed and developing economies between 1996 and 2008 by conducting maximum likelihood estimation using a gravity model. They found that bilateral income, renewable energy market size, and demand-side policy support schemes, as well as trade costs (i.e., tariffs applied to imports from China) are all important. Leng et al. (2020) selected 19 wind energy-related products for the period 2007–2017 and measured China’s potential exports to 65 “Belt and Road” countries by adopting a gravity model. Their results revealed that the GDP and energy consumption of the importing country, as well as China’s wind power generation capacity, both have positive impacts on China’s exports, while the distance between the country capitals has a negative effect. Moreover, the traditional ASEAN and Central and Eastern European markets for China’s exports have become increasingly saturated, i.e., China’s wind energy products have been overtraded in these regions, while countries in the Commonwealth of Independent States (CIS), West Asia, and East Asia (Mongolia) have untapped or growing potential. Shuai et al. (2020) adopted a gravity model and the data for 81 REG from 2007 to 2017 in order to examine China’s REG trade potential in the 65 “Belt and Road” countries. Their findings indicated that the GDP and renewable power generation capacity of the “Belt and Road” countries and the total energy consumption of the two trading parties are the main factors promoting China’s REG exports, while distance has significant negative influence. China has great exporting potential in Central and Eastern Europe and the CIS, and a certain (growing) potential in East Asia (Mongolia), West Asia, South Asia, and ASEAN; its trade potentials for REG increased year on year for 2007–2017 in the 16 countries in Central and Eastern Europe and fluctuated in other regions.
The motivation to undertake this study arose from the unsatisfactory nature of the abovementioned mixed findings. We focused on the bilateral trade in solar PV and WETC products—which are the most frequently discussed REG in the framework of clean energy adoption (Groba and Cao, 2015)—and employed a gravity model using cross-country panel data for the period 2012–2019 to investigate the drivers of bilateral REG trade flows among APT countries, identify China’s export efficiency and export potential, and explored how this trend may evolve with time.
The aims of this study were threefold. First, we wanted to quantify the drivers of bilateral trade in solar PV and WETC goods among APT countries and estimate China’s export efficiency and export potential, both of which have been underemphasized in the literature. Second, our equipment studied in the analysis, corresponding to 16 solar PV-related products and 29 WETC-related products with six-digit HS codes, represented a good approximation of trade in the solar PV and WETC sectors (Kuik et al., 2019). Third, in addition to the traditional components of the generalized gravity model, such as economic size, distance, population, exchange rate, trade agreements, and common trade unions, we incorporated the renewable energy generation capacity of the importing country, the energy consumption of the exporting country, and, particularly, the economic freedom indices of the trading pairs that reflected their policy and institutional settings—which has seldom been investigated in such an analysis—into our gravity equation as factors that had a direct bearing on trade in REG.
The remainder of this paper is organized as follows: Section 2 develops the specification of the gravity model, describes the data, and discusses the estimation methods; Section 3 presents the main estimated results, applies the estimated parameters to derive China’s potential exports to ASEAN plus Japan and South Korea and assess China’s export efficiency and export potential; and Section 4 presents our conclusions, policy implications, study limitations, and future research directions.
2 Methodology and Data
2.1 Model Specification
The gravity model has been widely applied to formulating bilateral trade flows among countries. Using the metaphor of the law of universal gravitation, the gravity model simply predicts that the bilateral trade between two economies is directly proportional to the product of their respective market sizes (e.g., GDP) and inversely related to their trade costs (e.g., geographical distance) (Tinbergen, 1962).
Owing to its considerable robustness and explanatory power, the gravity model has been used by a large number of studies to examine the trade flow effects of a wide variety of real or dummy explanatory variables, including country-specific characteristics (e.g., GDP, population, and income) and bilateral characteristics (e.g., the geographical distance between exporter and importer), and variables incorporating the drivers of and barriers to trade (e.g., geographical contiguity, ethnic ties, linguistic identity, colonial links, island or landlocked status, exchange rates, tariff and non-tariff barriers, currency unions, trade agreements, and common trade unions) (Anderson and Wincoop, 2003; Martinez-Zarzoso, 2003; Baier and Bergstrand, 2007; Novy, 2013; Narayan and Nguyen, 2016; Yotov et al., 2016; Matsumura, 2021). In addition, the gravity model is used to measure trade efficiency or trade potential by calculating the differences between predicted and observed trade flows (Egger, 2001; Papazoglou, 2007; Zaman and Kalirajan, 2019; Leng et al., 2020; Shuai et al., 2020).
The basic form of the gravity model has the following structure:
where
To accurately measure the trade flows of solar PV and WETC goods among the APT countries, we built a gravity equation based on recent developments in the literature. In addition to the fundamental determinants that explain the size of bilateral trade flows, such as GDP, geographical distance, population, common language(s) shared by the trading pair, real exchange rates, and membership of RTAs and common trade areas, we incorporated into our model other factors that may affect bilateral trade flows: the solar and wind power generation capacity of the importer, the energy consumption of the exporter, and, specifically, the economic freedom indices of the exporting and importing countries, making a total of 13 independent variables.
The specification that transforms the general form of the gravity model with a greater number of variables into a linear relationship for the empirical computation is given by:
where the
In order to reduce aggregation biases, and following Anderson and Yotov (2012), we subdivided Eq. 2 into Eqs 3, 4, in which the export volumes of solar PV (
where
According to the theoretical framework of the gravity model, increasing GDP for each country is expected to encourage bilateral trade. On the supply side, an increase in the GDP of the exporting country indicates more resources available as inputs and greater domestic production available for exports. By contrast, on the demand side, an increase in the GDP of the importing country indicates a sufficiently large market, which would stimulate more imports (Edmonds et al., 2008).
Using the results obtained by the gravity model, we can identify China’s potential exports and compare them with its actual exports in order to examine the efficiency or potential of China’s exports to ASEAN plus Japan and South Korea. We use the ratio of actual export flows to estimated export flows in order to measure export efficiency:
where
The analysis period ran from 2012 to 2019. The global financial crisis of 2008–09 and the post-crisis period, as well as the COVID-19 period, were excluded, and thus we analyzed trade in a “normal” economic environment. In the empirical analysis, we first used a balanced dataset representing annual bilateral solar PV and WETC trade among APT countries in order to capture the trade patterns of APT countries. The estimated parameters were then used to generate China’s potential exports to ASEAN plus Japan and South Korea. Export efficiency and export potential were estimated by comparing the estimated export volume with the existing volume. We first conducted the analysis using solar PV and WETC together, and then repeated the tests for solar PV and WETC separately.
2.2 Data
We used cross-country panel data for the bilateral trade of solar PV and WETC goods for the period 2012–2019 in order to investigate results for the gravity model. Solar PV and WETC are defined as the investment goods and associated products required in solar PV energy systems and their components and in wind energy technology systems and their components, respectively. The six-digit HS classification is a commonly used and globally harmonized classification system for distinguishing between internationally traded goods (Kuik et al., 2019). The solar PV and WETC product groups based on the six-digit HS product category codes identified by the International Centre for Trade and Sustainable Development (ICTSD) were constructed as suggested by Kuik et al. (2019). Table 1 lists the HS codes.

TABLE 1. HS codes used for the solar PV and WETC goods (Sourced from Kuik et al., 2019).
The bilateral trade data for the solar PV and WETC goods were extracted from the UNCTAD Comtrade database (https://comtrade.un.org). The annual nominal GDP and population data, as well as the official exchange rate (local currency unit (LCU) per USD, period average) data and CPI data, which were used to convert the nominal exchange rates into real exchange rates, were obtained from the World Bank (https://databank.worldbank.org). The data for geographical distances and common language(s) were retrieved from the Centre d’étude prospectives et d’informations internationales (CEPPII; http://www.cepii.fr) in Paris. The annual data for solar and wind power generation, as well as energy consumption, were obtained from the IEA (https://www.iea.org). RTAs were as according to the WTO (https://www.wto.org). APEC membership statuses were obtained from the APEC website (https://www.apec.org). The data for the EFW index (2012–2019) were extracted from the annual Economic Freedom of the World report (2014–2021) issued by the Frazer Institute (https://www.fraserinstitute.org).
All the time-variant series were transformed into natural logarithms to render them close to the normal distribution for the statistical tests. Some zeros appeared in the bilateral trade flows. However, as the logarithm of zero does not exist, and dropping zero observations from the sample might have led to biased estimates (Kuik et al., 2019), we therefore replaced the zeros with an arbitrarily small number, 0.025, when taking the logs, as suggested by McCallum (1995) and Raballand (2003). In addition, we replaced the missing values for Laos in 2012 and 2013 with their average EFW index values for the previous 6 years.
3 Results and Discussion
3.1 Gravity Model Results for the Sum of Solar PV and WETC Goods
Table 2 lists the summary statistics for the variables used in this study. First, the Fisher-ADF test, a frequently used panel unit root test, was employed. The results indicated that all the variables were stationary at the level and integrated of order zero. This suggested that the panel data could be used for the regressions, with no need to test the co-integration relationship among the time series variables.
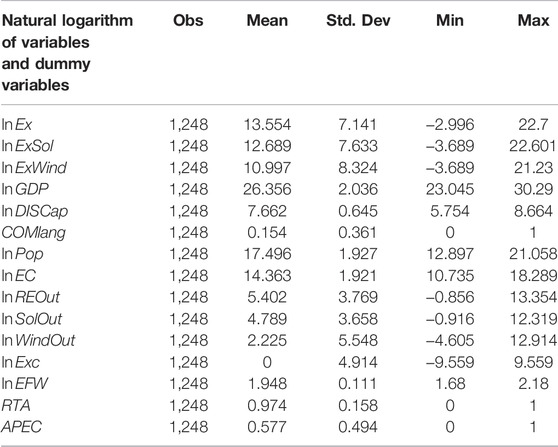
TABLE 2. Descriptive statistics.
To examine the determinants of the bilateral trade flows within our gravity model framework, three estimation approaches were employed: pooled ordinary least squares (OLS), fixed effects, and random effects (RE) models. Because fixed effects estimation does not allow for time-invariant variables in a gravity model (Prehn et al., 2016), we conducted a Lagrange multiplier (LM) test to select the preferred regression model. The results were significant, and the reported p-value was 0, suggesting that the RE model was to be preferred to the pooled OLS model. Hence, we selected the RE model for further empirical analysis. The pooled OLS estimation was also applied to the robustness check analysis. Table 3 presents the results.
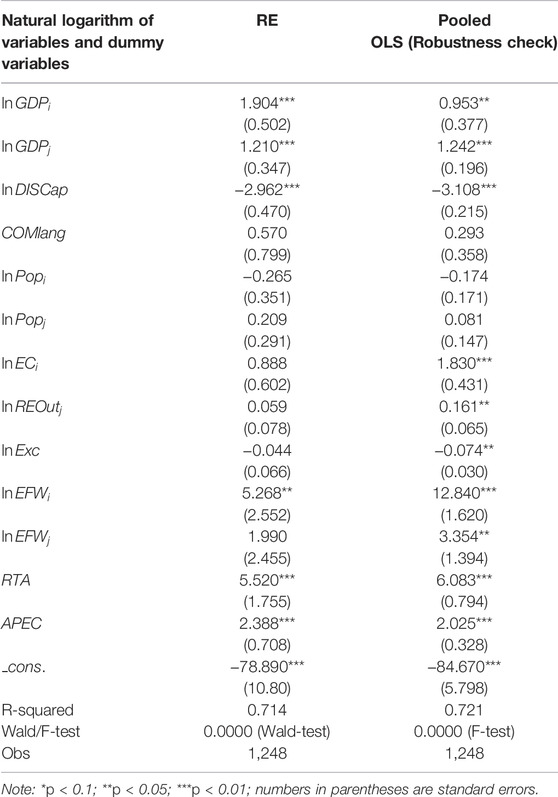
TABLE 3. Estimated results for the sum of solar PV and WETC goods.
The first column in Table 3 reports the RE results. The estimated coefficients of all the variables had the expected signs in the RE regression. The economic sizes of both the exporting and importing countries, measured by GDP, exerted significantly positive effects on a country’s exports. These results were consistent with the predictions of the generalized gravity model. By contrast, geographical distance was found to be a natural impediment to REG trade. The effect of economic freedom, which is concentrated solely on the exporter, was positive and statistically significant. As expected, the coefficients of the
The results estimated for the robustness check using the pooled OLS model in column 2 confirmed that
3.2 Export Efficiency and Export Potential Estimates for the Sum of Solar PV and WETC Goods
To accurately measure China’s export efficiency and export potential, we removed the insignificant variables in Table 3 stepwise, keeping only the explanatory variables that were significant at the level above 10%, namely,
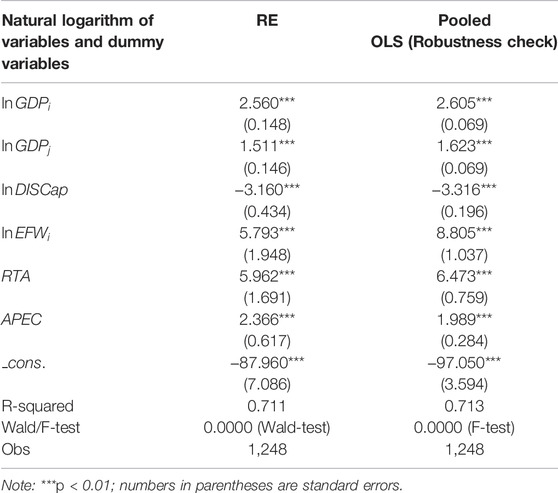
TABLE 4. Export efficiency and export potential estimates for the sum of solar PV and WETC goods.
The economic freedom of the exporting country and mutual memberships of RTAs had relatively large impacts on REG exports. A 1% increase in economic freedom of the exporter increased energy trade by 5.79% on average, and countries tended to increase trade by 5.96% when they entered a bilateral or multilateral trade agreement with each other. By contrast, the GDP of paired countries had relatively small impacts. Economic growth of 1% in either the exporting or importing country increased REG trade between partners by 2.56 and 1.51%, respectively. Furthermore, a 1% increase in the physical distance between the two trading countries reduced REG trade by 3.16% on average. Additionally, mutual memberships of RTAs were revealed to be more important than those of APEC. The estimates revealed that trading partners within an RTA traded 152% more than country pairs within APEC.
Using the parameters estimated by the RE approach and calculating export efficiency, we tested China’s potential exports to ASEAN plus Japan and South Korea for the period 2012–2019 and compared them with its actual exports in order to obtain its export efficiency, and thus export potential.
Table 5 demonstrates the evolution of trade efficiency (trade potential) over time and across countries, from which we made the following observations.
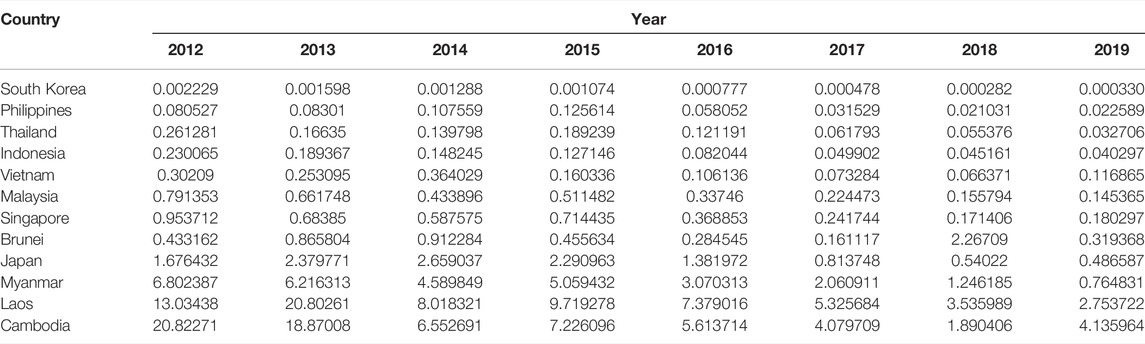
TABLE 5. Time trend of the export efficiency values of China’s exports to ASEAN plus Japan and South Korea.
First, in 2019, other than Cambodia and Laos, to which China’s actual exports substantially exceeded its potential exports, ASEAN plus Japan and South Korea were found to have huge trade potentials with China (i.e., China’s actual exports to these countries fell substantially below the estimated levels). China’s export efficiency (export potential) with respect to ASEAN plus Japan and South Korea was, in descending (ascending) order: Cambodia, Laos, Myanmar, Japan, Brunei, Singapore, Malaysia, Vietnam, Indonesia, Thailand, the Philippines, and South Korea. The UNCTAD Comtrade statistics show that, over the period 2012–2019, China was the largest intraregional exporter of solar PV and WETC goods, with an average annual export value of USD 12.70 billion. It was also the leading importer, followed by Japan, South Korea, Thailand, and Vietnam, with annual average imports of USD 8.63, 6.65, 3.64, 2.87, and 2.80 billion, respectively. The imports of Singapore, Malaysia, and Myanmar were approximately USD 2 billion. Brunei, Laos, and Cambodia were the smallest intraregional importers, with annual average imports of USD 42.91, 83.44, and 89.67 million, respectively. Moreover, IEA data show that over the period 2000–2019, Brunei and Laos were net energy exporters. Due to their small market size, the potential export market opportunities for China’s REG to these three countries were relatively small. Both the regression results and trade statistics indicated that ASEAN plus Japan and South Korea other than Brunei, Laos, and Cambodia are potentially important markets for China’s future exports of REG.
Second, between 2012 and 2019, China’s export efficiency (export potential) with respect to ASEAN plus Japan and South Korea showed a downward (upward) trend. This finding indicated that the tendency for China to export at levels lower than the theoretically estimated ones has generally increased over time. This may be due to the rapid economic development of the APT region, China’s widening and deepening economic reform and open door policy, and its signing of key trade agreements at the bilateral, sub-regional, regional, and multilateral levels, which can all raise the theoretically estimated values of China’s exports. By contrast, the high dependence on fossil fuels might limit the imports of ASEAN plus Japan and South Korea, thus increasing the difference between China’s actual and potential exports.
Third, China’s export efficiency and export potential differed markedly by partner countries. The export efficiency values of China’s exports to South Korea, the Philippines, Thailand, and Indonesia were relatively stable and low between 2012 and 2019, indicating untapped trade potential between China and these countries. By contrast, the potential to trade with Cambodia and Laos remained limited over this period. Moreover, China’s export efficiency values to Cambodia, Laos, Myanmar, and Singapore fluctuated greatly, dropping from 20.82271, 13.03438, 6.802387, and 0.953712 in 2012 to 4.135964, 2.753722, 0.764831, and 0.180297 in 2019, respectively. Hence, Myanmar changed from having limited potential to huge potential, while Japan and Singapore evolved from having growing potential to huge potential. China’s REG have many competitors in the global market, including developed countries such as the United States, Germany, the United Kingdom (UK), and Japan, newly industrialized countries such as South Korea, and emerging countries such as India. It is worth noting that, between 2012 and 2019, following China, both Japan and South Korea were the leading intraregional exporters of solar PV and WETC goods, with average annual export values of USD 8.18 and 5.03 billion, respectively. China should readjust and optimize the product structure of its renewable REG trade in a targeted manner and enhance the quality of its REG in order to appeal more to the market demand of importing countries (Shuai et al., 2022).
It should be noted that the finding that China has a huge REG trade potential differs from that obtained by Shuai et al. (2020), who concluded that China has a certain (growing) potential in ASEAN. There are two possible reasons. First, Shuai et al. (2020) used data of 81 products of solar energy, wind energy, hydro energy, bio-energy, geo-thermal energy and marine energy from 2007 to 2017 to examine China’s REG trade potential in the 65 “Belt and Road” countries and finally, five explanatory variables entered their equation for obtaining trade potential: foreign GDP, foreign renewable power generation, China’s energy consumption, foreign energy consumption, and the distances between capitals of China and the importing countries. This leads to the differences in the predictions of theoretical trade flows, and therefore trade potentials in their model from ours. Second, the examination of aggregate data in Shuai et al. (2020) may include bias and hide useful information about the behavior of a sub-region and individual industries (Choi, 2021).
3.3 Separate Regression Results for Solar PV and WETC Goods
Table 6 summarizes the results for the estimation of solar PV and WETC goods separately.
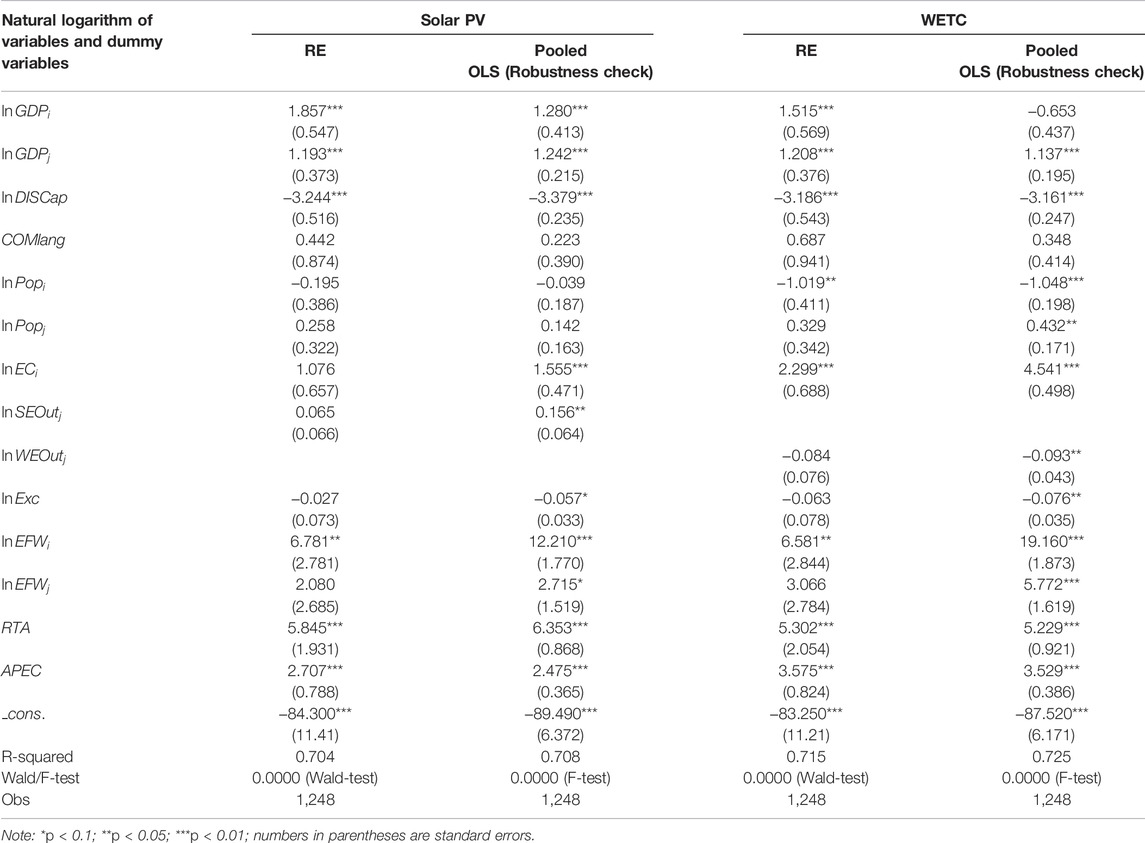
TABLE 6. Separately estimated results for solar PV and WETC goods.
The key results for the RE regressions were consistent with those for the full sample, except that the insignificant effects of
3.4 Separate Export Efficiency and Export Potential Estimates for Solar PV and WETC Goods
We eliminated the insignificant variables in Table 6 stepwise and retained the explanatory variables significant at the 1% or 5% level. The pooled OLS estimation results were found to be consistent with the findings of the RE regression. We then estimated China’s potential exports of solar PV and WETC goods separately using the RE regression (Table 7). Tables 8, 9 list the time series of the export efficiency values of China’s exports of solar PV and WETC goods, respectively, to its 12 trading partners.
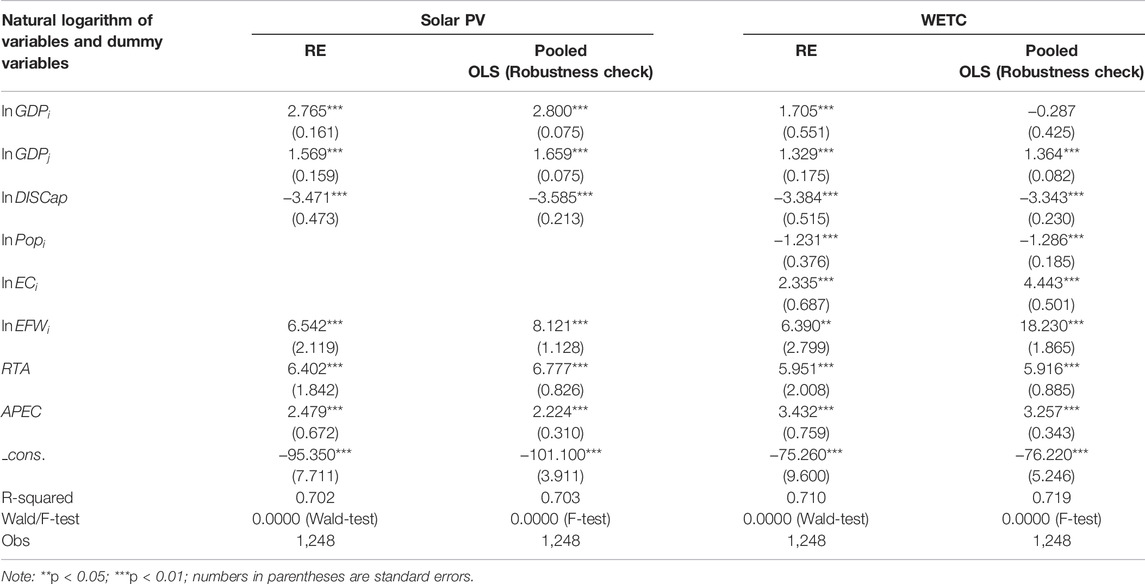
TABLE 7. Separate regression results for estimating export efficiency and export potential of solar PV and WETC goods.
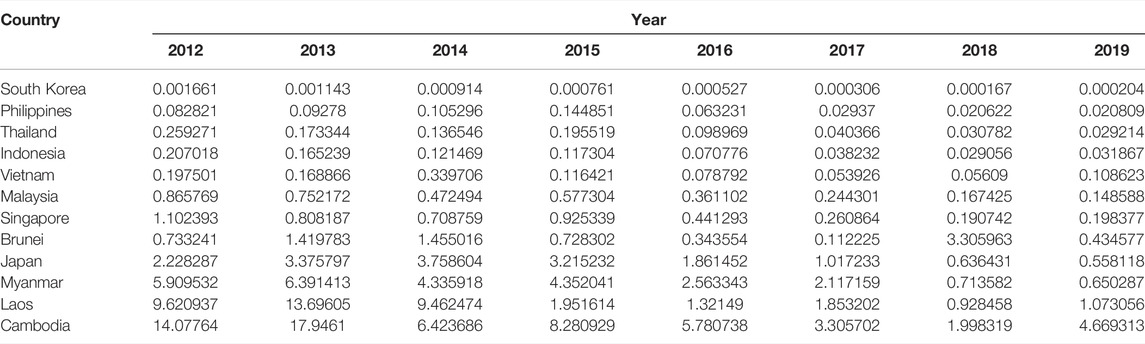
TABLE 8. Time trend of the export efficiency values of China’s solar PV exports to ASEAN plus Japan and South Korea.

TABLE 9. Time trend of the export efficiency values of China’s WETC exports to ASEAN plus Japan and South Korea.
In 2019, the efficiency (potential) values of China’s exports of solar PV goods to ASEAN plus Japan and South Korea were, in descending (ascending) order: Cambodia, Laos, Myanmar, Japan, Brunei, Singapore, Malaysia, Vietnam, Indonesia, Thailand, the Philippines, and South Korea—the same as in the full sample analysis. Cambodia had limited potential, Laos had growing potential, and the other 10 countries had huge potential. The efficiency (potential) values of China’s exports of WETC goods in 2019 were, in descending (ascending) order: Laos, Cambodia, Myanmar, Japan, Malaysia, Singapore, Brunei, Indonesia, Vietnam, Thailand, the Philippines, and South Korea, among which Laos, Cambodia, and Myanmar had limited potential and the rest had huge potential.
In general, the separate trends of China’s potential exports of solar PV and WETC goods to ASEAN plus Japan and South Korea were similar to those of the full sample, indicating that China and ASEAN plus Japan and South Korea had tremendous potential for REG trade in the period 2012–19. ASEAN plus Japan and South Korea may be important markets in the future, with huge growth opportunities for China’s solar PV and WETC exports, given their urgent need to mitigate climate change, promote transition to renewable energy systems, and improve energy security.
In summary, there were untapped potentials in China’s solar PV exports to South Korea, the Philippines, Thailand, Indonesia, Vietnam, Malaysia, and Singapore, particularly the first four countries. The potential for China’s WETC exports to South Korea, the Philippines, Thailand, Vietnam, Indonesia, Brunei, Singapore, and Malaysia were also extremely large, particularly to South Korea, the Philippines, and Thailand. The finding on WETC exports differed from that obtained by Leng et al. (2020), as they showed that the traditional ASEAN markets for China’s exports of WETC goods had become increasingly saturated, and China’s wind energy products had been overtraded in those countries. This can be attributed multiple factors such as number of countries involved, categories of WETC adopted and the impacting factors in the models of Leng et al. (2020) and this study are different, which leads to different theoretical and actual trade values, and therefore different trade potentials.
4 Conclusion, Policy Implications, Limitations, and Future Research Directions
Most APT countries rely heavily on imports of fossil fuels to meet their energy demands. Intraregional REG trade plays a crucial role in strengthening energy security and low-carbon growth in this region (Zaman and Kalirajan, 2019). Focusing on solar PV and WETC goods, this study estimated the determinants of bilateral trade flows in REG among the APT countries for the period 2012–2019 using a gravity model and cross-country panel data. We found that the GDP of both exporting and importing countries, the economic freedom of the exporter, trade agreements, and membership of trade associations all significantly stimulated bilateral trade, while geographical distance between trading partners had a significantly negative effect. A comparison of China’s potential exports to ASEAN plus Japan and South Korea with its actual exports revealed that there is great potential for increasing China’s future exports of REG.
We believe that the findings of this study will be useful from a policy perspective. In this respect, the APT countries could facilitate intraregional REG trade by exerting policy efforts focusing on the key factors determining bilateral REG trade, for example, promoting economic development, creating and maintaining a market-based economy, and reducing transportation costs by improving cross-border transportation systems and distribution networks. Developing close economic relationships and strengthening regional integration are also likely to contribute to regional REG trade because the promotion of effective cross-border trade requires regional cooperation among countries (Ratnayake et al., 2011). In this sense, there are grounds for optimism about the growth prospects for REG trade among APT countries ever since the 15 Asia-Pacific nations (APT countries, Australia, and New Zealand), which account for nearly one-third of global GDP, signed the Regional Comprehensive Economic Partnership (RECP) agreement in 2020. The resulting strengthening of economic ties, enhancement of trade and investment-related activities, and RECP-induced reductions or elimination of tariffs, may all contribute to a strong boost in the REG trade of the APT countries.
Along with the urgent need to meet GHG emission reduction targets, the increasing awareness of environmental protection, and the need to improve regional energy security, the APT countries are showing a keen interest in making renewable energy more affordable, accessible, and locally sourced. To this end, the APT region needs to formulate and implement a comprehensive and carefully coordinated renewable energy policy package, consisting of general policies that improve the infrastructural and institutional frameworks for facilitating the investment, production, and trading of REG; trade policies that are conducive to the establishment of a well-interconnected and integrated regional market and promote trade in REG and discourage trade in relatively carbon-intensive goods; investment policies that promote domestic and foreign investment in the development and production of REG; financial policies that put a cost on carbon and support trade, investment, and the utilization of REG; industrial policies that provide support for research and development of renewable energy technologies and encourage enterprises to adopt “green” technologies, and hence gain competitive advantages in international trade; and, finally, policies to strengthen regional cooperation in support of REG trade and investment, technology transfer, adoption and diffusion, harmonization of the many different sets of national-level policies, and the formulation of common principles, rules, and standards (Ratnayake et al., 2011).
China, while known for its very large energy consumption and GHG emissions associated with its rapid economic growth, has taken a global lead in the development, investment, utilization, and export of solar PV and WETC goods, mainly as a result of its awareness of the environmental costs of development and the urgent need to address these costs (Ratnayake et al., 2011). The results of our study show that there is much scope for China to expand REG trade with ASEAN plus Japan and South Korea. China should promote joint efforts with these countries in order to further deepen cooperation on the low-carbon economy, tap the great potential for trade in REG, and strive for a win-win outcome.
Our study had some limitations, however. The bilateral trade flows of solar PV and WETC goods may have been affected by factors not captured in this study. Thus, further research needs to consider technological and infrastructural development, supportive policies on renewable energy, global energy market conditions, geopolitical concerns, trade barriers arising from regulatory and policy regimes, and other macro- and micro-level factors in order to fully comprehend the determinants of REG trade flows. In addition, the classification of REG in cross-border trade is a technical issue. Using the common six-digit HS codes cannot sufficiently differentiate whether a product is used for renewable energy systems. Thus, the categories of solar PV and WETC goods used in this study were relatively broad and the HS classification only partially reflected the true trade in these goods. Future studies need to subdivide the product categories that are most likely to contain renewable energy supply technologies to better match the six-digit HS codes for renewable energy technologies.
Data Availability Statement
The original contributions presented in the study are included in the article/Supplementary Material, further inquiries can be directed to the corresponding author.
Author Contributions
WZ undertook the formal analysis and was a major contributor to writing the article. KY contributed to data curation and methodology. YF revised the article. All authors read and approved the final manuscript.
Conflict of Interest
The authors declare that the research was conducted in the absence of any commercial or financial relationships that could be construed as a potential conflict of interest.
Publisher’s Note
All claims expressed in this article are solely those of the authors and do not necessarily represent those of their affiliated organizations, or those of the publisher, the editors and the reviewers. Any product that may be evaluated in this article, or claim that may be made by its manufacturer, is not guaranteed or endorsed by the publisher.
References
Algieri, B., Aquino, A., and Succurro, M. (2011). Going “Green”: Trade Specialisation Dynamics in the Solar Photovoltaic Sector. Energy Policy 39, 7275–7283. doi:10.1016/j.enpol.2011.08.049
Anderson, J. E., and Wincoop, E. V. (2003). Gravity with Gravitas: A Solution to the Border Puzzle. Am. Econ. Rev. 93, 170–192. doi:10.1257/000282803321455214
Anderson, J. E., and Yotov, Y. V. (2012). Gold Standard Gravity. NBER Working Paper 17835. doi:10.3386/w17835
Baier, S. L., and Bergstrand, J. H. (2007). Do Free Trade Agreements Actually Increase Members' International Trade? J. Int. Econ. 71, 72–95. doi:10.1016/j.jinteco.2006.02.005
Baldwin, R., and Taglioni, D. (2006). Gravity for Dummies and Dummies for Gravity Equations. NBER Working Paper 12516. doi:10.3386/w12516
Bussière, M., and Schnatz, B. (2009). Evaluating China’s Integration in World Trade with a Gravity Model Based Benchmark. Open. Econ. Rev. 20, 85–111. doi:10.1007/s11079-007-9061-5
Cabalu, H., Alfonso, C., and Manuhutu, C. (2010). The Role of Regional Cooperation in Energy Security: The Case of the ASEAN+3. Int. J. Glob. Energy Issues 33, 56–72. doi:10.1504/IJGEI.2010.033015
Cantore, N., and Cheng, C. F. C. (2018). International Trade of Environmental Goods in Gravity Models. J. Environ. Manag. 223, 1047–1060. doi:10.1016/j.jenvman.2018.05.036
Choi, S-Y. (2021). Analysis of Stock Market Efficiency during Crisis Periods in the US Stock Market: Differences between the Global Financial Crisis and COVID-19 Pandemic. Phys. A Stat. Mech. Appl. 574 (3), 125988. doi:10.1016/j.physa.2021.125988
Costantini, V., and Crespi, F. (2008). Environmental Regulation and the Export Dynamics of Energy Technologies. Ecol. Econ. 66, 447–460. doi:10.1016/j.ecolecon.2007.10.008
Costantini, V., and Mazzanti, M. (2012). On the Green and Innovative Side of Trade Competitiveness? The Impact of Environmental Policies and Innovation on EU Exports. Res. Policy. 41, 132–153. doi:10.1016/j.respol.2011.08.004
Edmonds, C., La Croix, S., and Li, Y. (2008). China Trade: Busting Gravity's Bounds. J. Asian Econ. 19, 455–466. doi:10.1016/j.asieco.2008.09.013
Egger, P. (2001). An Econometric View on the Estimation of Gravity Models and the Calculation of Trade Potentials. World. Econ. 25, 297–312. doi:10.1111/1467-9701.00432
Groba, F., and Cao, J. (2015). Chinese Renewable Energy Technology Exports: The Role of Policy, Innovation and Markets. Environ. Resour. Econ. 60, 243–283. doi:10.1007/s10640-014-9766-z
Groba, F. (2014). Determinants of Trade with Solar Energy Technology Components: Evidence on the Porter Hypothesis? Appl. Econ. 46, 503–526. doi:10.1080/00036846.2013.857005
Jomit, C. P. (2014). Export Potential of Environmental Goods in India: A Gravity Model Analysis. Transnatl. Corp. Rev. 6, 115–131. doi:10.1080/19186444.2014.11658386
Kalirajan, K., and Liu, Y. (2016). “Regional Cooperation in Renewable Energy Trade: Prospects and Constraints,” in Globalization of Low-Carbon Technologies: The Impact of the Paris Agreement. Editors V. Anbumozhi, and K. Kalirajan (Singapore: Springer and ERIA), 459–478. doi:10.1007/978-981-10-4901-9_14
Kuik, O., Branger, F., and Quirion, P. (2019). Competitive Advantage in the Renewable Energy Industry: Evidence from a Gravity Model. Renew. Energy 131, 472–481. doi:10.1016/j.renene.2018.07.046
Leng, Z., Shuai, J., Sun, H., Shi, Z., and Wang, Z. (2020). Do China's Wind Energy Products Have Potentials for Trade with the "Belt and Road" Countries? -- A Gravity Model Approach. Energy Policy 137, 111172. doi:10.1016/j.enpol.2019.111172
Lewis, J. I., and Wiser, R. H. (2007). Fostering a Renewable Energy Technology Industry: An International Comparison of Wind Industry Policy Support Mechanisms. Energy Policy 35, 1844–1857. doi:10.1016/j.enpol.2006.06.005
Martinez-Zarzoso, I. (2003). Gravity Model: An Application to Trade between Regional Blocs. Atl. Econ. J. 31, 174–187. doi:10.1007/bf02319869
Matsumura, A. (2021). Gravity Analysis of Trade for Environmental Goods Focusing on Bilateral Tariff Rates and Regional Integration. Asia-Pac. J. Reg. Sci. 5, 477–511. doi:10.1007/s41685-020-00189-x
McCallum, J. (1995). National Borders Matter: Canada-U.S. Regional Trade Patterns. Am. Econ. Rev. 85, 615–623.
Narayan, S., and Nguyen, T. T. (2016). Does the Trade Gravity Model Depend on Trading Partners? Some Evidence from Vietnam and Her 54 Trading Partners. Int. Rev. Econ. Finance 41, 220–237. doi:10.1016/j.iref.2015.08.010
Novy, D. (2013). International Trade without CES: Estimating Translog Gravity. J. Int. Econ. 89, 271–282. doi:10.1016/j.jinteco.2012.08.010
Papazoglou, C. (2007). Greece's Potential Trade Flows: A Gravity Model Approach. Int. Adv. Econ. Res. 13, 403–414. doi:10.1007/s11294-007-9107-x
Prehn, S., Brümmer, , B., and Glauben, T. (2016). Gravity Model Estimation: Fixed Effects vs. Random Intercept Poisson Pseudo-Maximum Likelihood. Appl. Econ. Lett. 23, 761–764. doi:10.1080/13504851.2015.1105916
Qadir, S., and Dosmagambet, Y. (2020). CAREC Energy Corridor: Opportunities, Challenges, and Impact of Regional Energy Trade Integration on Carbon Emissions and Energy Access. Energy Policy 147, 111427. doi:10.1016/j.enpol.2020.111427
Raballand, G. (2003). Determinants of the Negative Impact of Being Landlocked on Trade: An Empirical Investigation through the Central Asian Case. Comp. Econ. Stud. 45, 520–536. doi:10.1057/palgrave.ces.8100031
Ratnayake, R., Proksch, M., and Mikic, M. (2011). Climate-smart Trade and Investment in Asia and the Pacific towards a Triple-Win Outcome. New York: United Nations Publications.
Sattich, T., Freeman, D., Scholten, D., and Yan, S. (2021). Renewable Energy in EU-China Relations: Policy Interdependence and its Geopolitical Implications. Energy Policy 156, 112456. doi:10.1016/j.enpol.2021.112456
Sawhney, A., and Kahn, M. E. (2012). Understanding Cross-National Trends in High-Tech Renewable Power Equipment Exports to the United States. Energy Policy 46, 308–318. doi:10.1016/j.enpol.2012.03.066
Shepherd, B. (2013). The Gravity Model of International Trade: A User Guide. New York: United Nations Publications.
Shuai, J., Leng, Z., Cheng, J., and Shi, Z. (2020). China’s Renewable Energy Trade Potential in the “Belt-and-Road” Countries: A Gravity Model Analysis. Renew. Energy 161, 1025–1035. doi:10.1016/j.renene.2020.06.134
Shuai, J., Zhao, Y., Wang, Y., and Cheng, J. (2022). Renewable Energy Product Competitiveness: Evidence from the United States, China and India. Energy 249, 123614. doi:10.1016/j.energy.2022.123614
Steenblik, R. (2005). Liberalisation of Trade in Renewable-Energy Products and Associated Goods: Charcoal, Solar Photovoltaic Systems, and Wind Pumps and Turbines. OECD Trade and Environment Working Paper No. 2005-07. doi:10.1787/216364843321
Tinbergen, T. (1962). Shaping the World Economy: Suggestions for an International Economic Policy. New York: The Twentieth Century Fund.
Yotov, Y. V., Piermartini, R., Monteiro, J-A., and Larch, M. (2016). An Advanced Guide to Trade Policy Analysis: The Structural Gravity Model. New York: United Nations Publications.
Yu, X. (2003). Regional Cooperation and Energy Development in the Greater Mekong Sub-Region. Energy Policy 31, 1221–1234. doi:10.1016/s0301-4215(02)00182-9
Zaman, K. A. U., and Kalirajan, K. (2019). Strengthening of Energy Security & Low-Carbon Growth in Asia: Role of Regional Energy Cooperation through Trade. Energy Policy 133, 110873. doi:10.1016/j.enpol.2019.07.009
Zhao, P., Lu, Z., Fang, J., Paramati, S. R., and Jiang, K. (2020). Determinants of Renewable and Non-Renewable Energy Demand in China. Struct. Change. Econ. D. 54, 202–209. doi:10.1016/j.strueco.2020.05.002
Keywords: renewable energy goods, solar photovoltaic technology, wind energy technology, trade efficiency, trade potential, gravity model
Citation: Zhang W, Yu K and Fang Y (2022) A Gravity Model Analysis of China’s Trade in Renewable Energy Goods With ASEAN Countries as Well as Japan and South Korea. Front. Environ. Sci. 10:953005. doi: 10.3389/fenvs.2022.953005
Received: 25 May 2022; Accepted: 13 June 2022;
Published: 07 July 2022.
Edited by:
Fuzhong Chen, University of International Business and Economics, ChinaReviewed by:
Junfang Sun, Soochow University, ChinaWensheng Zhang, Tianjin University of Science and Technology, China
Copyright © 2022 Zhang, Yu and Fang. This is an open-access article distributed under the terms of the Creative Commons Attribution License (CC BY). The use, distribution or reproduction in other forums is permitted, provided the original author(s) and the copyright owner(s) are credited and that the original publication in this journal is cited, in accordance with accepted academic practice. No use, distribution or reproduction is permitted which does not comply with these terms.
*Correspondence: Wei Zhang, emhhbmd3ZWlAdGguYnRidS5lZHUuY24=