 John D. Graham
 Eva Brungard
- O’Neill School of Public and Environmental Affairs, Indiana University, Bloomington, IN, United States
The United States government established a national goal of 50% plug-in vehicle penetration of the new light-duty vehicle fleet by 2030. Achievement of this goal is required to satisfy the country’s commitments to greenhouse-gas control under the 2015 Paris climate accords. Based on a market analysis of historical sales patterns, current and planned plug-in vehicle offerings, and sales forecasts for 2030, this article concludes that the US is unlikely to meet the 2030 goal without rapid commercialization of affordable plug-in vehicles, where affordable is defined as a price less than $45,000 per vehicle. Public policies are reviewed, in part based on European experience, that can accelerate the commercialization of affordable plug-in vehicles in the United States.
1 Introduction
At the international climate talks in Glasgow, Scotland in 2021, US President Joe Biden pledged that the United States--the world’s biggest emitter of greenhouse gas emissions in historical terms--would cut its emissions 50–52% percent below 2005 levels by 2030. Biden also pledged to achieve net zero emissions economy-wide by 2050. The commitments are now part of the Nationally Determined Contribution (NDC) of the United States, a formal submission under the 2015 Paris Accords of the United Nations Framework Convention on Climate Change (The White House, 2022).
For President Biden’s pledges to be achieved, dramatic progress in the transportation sector is crucial. Transportation is the largest sectoral contributor to US GHG emissions at 27% (US Environmental Protection Agency, 2022). See Figure 1. Within the transport sector, the majority (58%) of emissions comes from the light-duty passenger vehicle sector (cars and light trucks).
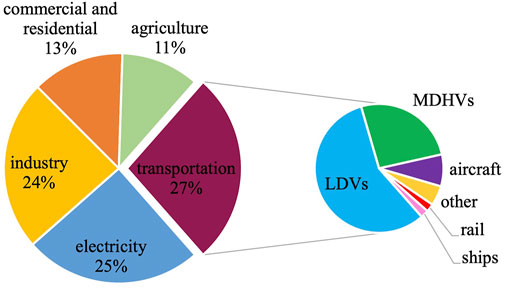
FIGURE 1. A breakdown of U.S. GHG emissions shares by industry sector, 2020.
Over the last 30 years (1990–2019), overall GHG emissions from light-duty passenger vehicles increased in the US by 12%. In 2003, the US revived the Corporate Average Fuel Economy (CAFÉ) program, which had been dormant since the early 1990s (Graham, 2010). Under Presidents George W. Bush and Barack Obama, standards were raised from model years 2005–2025 for light trucks and from 2011 to the 2025 for passenger cars. See Figure 2. Since 2011, EPA has issued CO2 performance standards that are largely harmonized with the CAFÉ standards. President Trump relaxed the Obama-era standards for model years 2022–2026, but several large manufacturers agreed to voluntarily implement stricter CO2 standards in line with California. President Biden reversed the Trump-era rollback from 2024 to 2026 and the Biden administration is working on a new round of standards, at least through 2030.
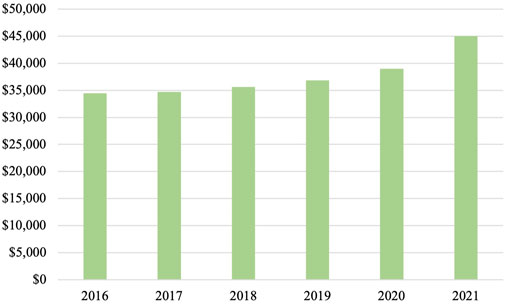
FIGURE 2. Historical and future U.S. Fuel economy standards 1978–2025 (US Environmental Protection Agency, 2022).
To comply with the tightening standards, vehicle manufacturers have introduced a wide range of new fuel-saving technologies, including changes to engines, transmissions, tires, vehicle aerodynamics, and the weight of materials. Despite these efforts, from 2005 to 2019, GHG emissions from light-duty vehicles declined by only 12%. The growth of vehicle miles traveled (VMT) and the market shift from cars to SUVs and other light trucks offset some of the gains from technological progress and stricter standards. Moreover, since the average vehicle life is almost 15 years and since the standards cover only new vehicles, it takes a long time for stricter standards to have their full impact on overall fleetwide emissions. Most recently, a decline in GHG emissions occurred (2020–2021) due to the COVID-19 travel restrictions and a sharp spike in fuel prices. Those factors may have only a temporary influence on long-term trends in the US (US Environmental Protection Agency, 2017; US Environmental Protection Agency, 2022).
To achieve President Biden’s climate commitments, a rapid transition from internal combustion engine vehicles (ICEVs) to “zero emission vehicles” (ZEVs) will be required. The term “zero emission” refers to emissions from the tailpipe and evaporative emissions from the fuel tank. In 1990, the State of California began to spur limited commercialization of plug-in electric vehicles (PEVs) and hydrogen fuel cell electric vehicles (FCEVs) through their ZEV mandate. California also permitted plug-in hybrid electric vehicles (PHEVs) to earn some compliance credits. The ZEV mandate required any automaker selling in California to produce an increasing number of ZEVs (California Air Resources Board, 2022). Although FCEVs may have significant market penetration in the heavy-duty sector prior to 2030, the light-duty sector will be dominated by PEVs, at least through 2030.
The objectives of the paper are to 1) illustrate why the U.S. is unlikely to achieve the 50% EV-share goal, without significant EV penetration in the affordable end of the vehicle market; 2) assess whether the U.S. is likely to achieve significant EV penetration of the affordable vehicle market by 2030, given current offerings, trends and policies, and 3) explore what steps might be taken to accelerate the pace of commercialization of affordable EVs. The methods used include 1) a market analysis of EV sales in the US, with emphasis on market-leader Tesla’s portfolio of products, 2) a description of the affordable EVs currently on the market and those announced for introduction in the years ahead, 3) a survey of recent market forecasts of PEV share in 2030, and 4) an inventory of policies to accelerate EV deployment, in part based on European experience.
Five independent modeling exercises examined whether President Biden’s 2030 and 2050 pledges are technically feasible. The models incorporated information about technological progress in all sectors of the US economy. They each concluded that Biden’s goals are feasible, provided that key technologies are accompanied by sufficient public policy support. Table 1 summarizes what each modeling exercise assumed about the penetration of zero-emission vehicles in the new-vehicle market in 2030 and 2050.
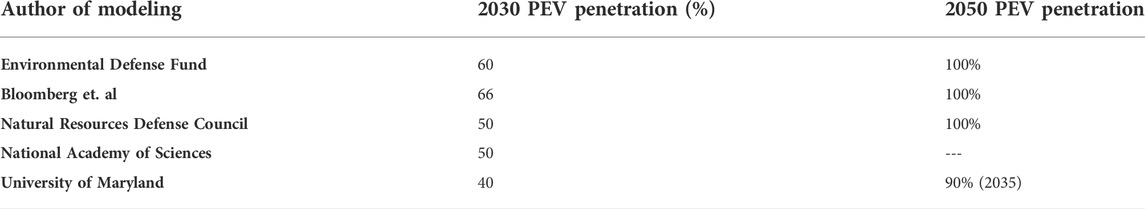
TABLE 1. Assumed deployment rate of plug-in electric vehicles in 2030 and 2050 in recent independent modeling exercises (Environmental Defense Fund, 2011; Bloomberg et al., 2021; Fakhry & Yeh, 2021; Hultman et al., 2021; National Academy of Sciences, 2021).
The pattern of findings is similar: PEVs need to account for 40–66% of new light-duty sales by 2030 and for virtually 100% of sales by 2050 for Biden’s goals to be achieved. Accordingly, President.
Biden announced his goal of 50% PEV sales by 2030 in August of 2021 (Shepardson, 2021). Biden refrained from setting a date for the termination of gasoline-vehicle sales, though the State of California has an official target of 2035 for the phase-out of ICEVs (Shepardson, 2021).
The modeling exercises also assume rapid decarbonization of the electricity sector during the same time frame. When owners of PEVs connect to the grid to charge their vehicles, they are assumed to access low-carbon electricity systems. If electricity systems are not decarbonized, then the climate-policy appeal of PEVs diminishes substantially since accessing the grid for energy will simply shift emissions from the tailpipe to the electric powerplant. From a lifecycle perspective, the climate benefits of PEVs depend heavily on the assumed electricity mix (Martz et al., 2021). Regions that are highly dependent on fossil fuel powered plants may not benefit at all from introducing EVs and may be better served by conventional hybrid-electric vehicles; PEVs in areas with decarbonized grids can accomplish impressive environmental and economic benefits (Buekers et al., 2014).
In this article, we examine the feasibility of commercializing PEVs in the “affordable” end of the new vehicle market, where affordable is defined as a price below the midpoint of the prices of all new vehicles sold in the US, roughly $45,000 in 2021 (see below).
2 Materials and methods
2.1 Analytic approach
A market analysis is performed to determine the historical pace of penetration of PEVs in the US new vehicle market, as well as forecasts of future EV sales in 2030. The number of affordable PEV offerings made in different segments of the market are analyzed for recent model years. The commercialization potential of current affordable models is analyzed qualitatively. Public announcements by manufacturers of future affordable models and production are also examined. The US PEV market is compared to the PEV market in Europe, where PEV penetration rates are larger, to gain insight into the deployment of affordable PEVs. An inventory of public policies, including published evaluation studies, are accessed to determine their potential promise for success in deploying affordable PEVs.
2.2 Sources of data
List and transactions prices and sales volumes for PEVs are obtained from Kelly Blue Book, manufacturer websites, the US Department of Energy, and other published sources. Information on the characteristics of specific PEV models is obtained from consumer-facing publications that review specific models. Data about PEV penetration rates in Europe are obtained from publicly available sources. Reports from the International Energy Agency and recent studies of PEV deployment are tapped to populate the inventory of PEV deployment policies.
2.3 Definition of an affordable vehicle
In the early 1900s, there were only two classes of vehicles: those mass produced (and thus cheaper) and the low-volume luxury ones made to the specifications of the customer. Then came the concept of the “premium” vehicle; it was mass produced but came standard with high-quality materials, special comfort and safety features, and upgraded propulsion systems with superior performance (The Motor Muse, 2018). The premium vehicle was a middle ground between affordable and luxury, though an added complexity was the status of the brand, which influences whether consumers might perceive a vehicle to be premium (Infiniti) or luxury (Lamborghini) (Swansway Motor Group, 2021).
The distinctions between affordable, premium, and luxury vehicles became blurred. Since virtually all new vehicles are now mass produced, an affordable vehicle is not self-defining (Quora, 2021).
The light-duty vehicle market is quite complex. According to standard industry classifications, there are 20 + market segments. There are cars of different sizes (micro car, mini compact, subcompact, compact, mid-size, full-size), vans (mini-multi purpose vehicle, compact multi-purpose vehicle, and minivan), pickup trucks (classes 1 through 8 defined by weight), sports/performance cars (cars, sedans, supercars), sport utility vehicles (off-road, regular SUV, cross-over SUV), and luxury vehicles (premium compact, luxury compact, mid-size luxury, full-size luxury). PEVs were added as a separate segment even though PEVs also compete in traditional segments.
The classifications are meaningful: a consumer searching for a subcompact car is highly unlikely to come home from the dealer with a class 2 pickup truck or a minivan. Nonetheless, the classifications are somewhat of a mish mash because they somewhat selectively and arbitrarily invoke factors such as size, weight, performance, premium content, luxury content and so forth. Moreover, the US government definitions of some of the segments differ somewhat from the industry definitions, illustrating the murkiness. And the standard classification system in Europe is different from the US systems.
In this article, we deploy a gross simplification for analytic purposes: we distinguish an affordable versus non-affordable vehicle based on the average transactions price. This is a statistic commonly used in the industry, especially by Kelley Blue Book (KBB). If the average transactions price is not available, we consult the manufacturer’s suggested retail price (MSRP) for a base model, even though that is an imperfect surrogate for the average transactions price. Unlike the base MSRP, the average transactions price is influenced by optional upgrades, higher trim models, and near-term supply/demand conditions that affect the extent of price discounting. For new PEV models with no sales experience, where transactions prices are unavailable, we utilize the MSRP and compare them to MSRPs for established PEV models.
The pricing of EVs needs to come down substantially to approach equivalence with gasoline-powered vehicles. Table 2 supplies the 2021 MSRP for those EV models that sold more than 10,000 units in 2021 (i.e., the best selling EVs in the US market). It compares them to the MSRP of a highly rated, good selling gasoline vehicle in the same size class. The EVs are consistently $10,000-$20,000 pricier in each size class, although a deeper comparison would need to look at the vehicle and performance characteristics of the base models. The MSRPs do not account for the availability of federal tax credits for EVs and state EV rebates. The Tesla and GM (Chevy) products are no longer eligible for the $7,500 federal tax credit. Nissan products will soon lose the credit as well. For a more detailed study showing that EVs continue to need subsidies in order to be competitive, see Breetz and Salon (2018).
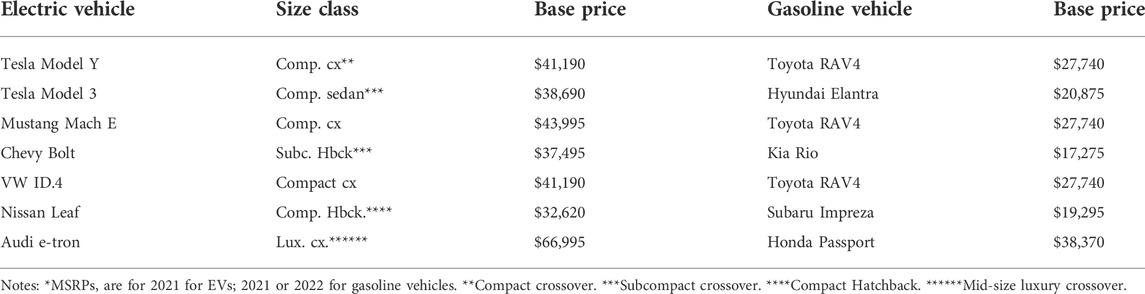
TABLE 2. 2021 base price of top-selling EVs versus base-price of highly rated gasoline-powered vehicle in the same size class, using MSRPs* (White, 2022).
For September 2021, KBB reported an average transaction price of $45,031 for light-duty passenger vehicles in the US. The average price has been steadily rising in recent years. A surge occurred in 2021 due to the semi-conductor chip shortage and other factors. See Figure 3.
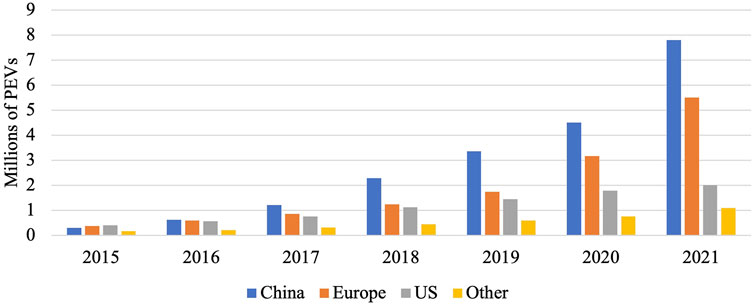
FIGURE 3. Average Transactions Prices for New Light-Duty Passenger Vehicles, United States, 2016–2021 (Carlier, 2022). Prices are not adjusted for inflation.
The early adopters of PEVs in the US tend to be middle-aged white men who are well-educated, wealthy, and own multiple vehicles. They purchase a PEV out of environmental concern and/or to satisfy their hunger for the most innovative automotive technology (Graham, 2021). In contrast to early adopters, the majority of vehicle buyers is simply searching for the best value, whether that is the least expensive vehicle in their desired segment or a vehicle with the combination of features that they desire. Affordable PEVs can move the PEV market beyond the early adopters and allow the environmental and public health benefits and operational cost-savings of PEVs to reach all facets of society.
2.4 Affordable vehicles, their manufacturers, and vehicle segments
Vehicle manufacturers vary in how much their product mix focuses on the affordable end of the market. Of the fifteen manufacturers listed by KBB, seven have average transactions prices below the industry average: Mitsubishi ($26,609), Mazda ($31,563), Kia ($31,793), Nissan ($32,735), Honda ($33,064), Subaru ($35,219), Toyota ($38,467). Of the 23 market segments analyzed by KBB in September 2021, only seven (subcompact car, compact car, mid-sized car, subcompact SUV/cross over, mid-sized pickup truck, and luxury subcompact SUV/crossover) had average prices lower than the overall average vehicle price (Kelley Blue Book, 2021).
The tyranny of averages is that they conceal the spread and extremes. Nissan offers numerous affordable vehicles, but its premium brand (Infiniti) offers compelling vehicles with above-average prices. Ford, once the champion of cheap, mass-produced cars, is shifting from selling passenger cars to vehicles with off-road capability such as pickup trucks and SUVs (Ferris, 2018). Ford does currently offer a few car models with below-average prices (e.g., the Ford EcoSport subcompact crossover and the Ford Fusion mid-sized sedan) (Brandt, 2020).
2.5 Inventory of plug-in electric vehicle-Related policies
Table 3 provides an abbreviated inventory of the major national and subnational PEV policies in the US, EU, and China based on information reported by the International Energy Agency (IEA, 2021a).
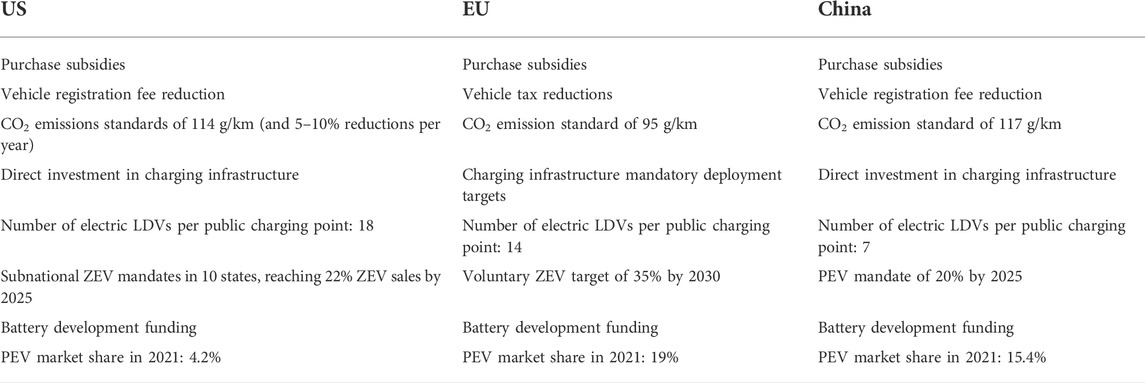
TABLE 3. Summary of inventory of public policies to promote light-duty passenger electric vehicle sales in the US, EU, and China, with 2021 PEV market shares (IEA, 2021b).
The last row of the table reports the last full-year figures for PEV share in the new vehicle market.
2.5.1 Purchase subsidies
The specific policy designs in each jurisdiction vary significantly, but similar approaches have been adopted. One of the most common policies is the PEV purchase subsidy, which is intended to reduce the price gap between PEVs and gasoline vehicles.
In the U.S., the federal subsidy can be as large as a $7,500 tax credit for a qualifying PEV, assuming the buyer has income tax liability equal to or greater than the credit. Manufacturers start to lose access to credits for their PEVs once the volume threshold of 200,000 units is surpassed. Tesla, GM, and Toyota have already exhausted their credit eligibility; Nissan is expected to soon lose their eligibility in 2023 (Bierenkoven, 2022).
The subsidies in China are structured as producer grants; they are in the process of being phased out and were expected to end in 2022. They are being replaced by subsidies for public charging networks and a California-style zero emission vehicle mandate (Graham, 2021).
The EU’s purchase subsidies are consumer rebates that vary by member state. Germany has one of the most generous incentives: 9,000 EUR (10,647 USD) per PEV. The purchase incentives for PEVs in France, the United Kingdom, Netherlands, Sweden, and Norway are also generous (Mock, 2021).
The US tax credits are available for buyers at all income levels and for PEVs offered at any price. In Europe, a common practice (e.g., in Germany) is to restrict the availability of PEV rebates based on the price of the PEV (e.g., vehicles with MSRP lower than 65,000 Euro). Germany offers larger purchase subsidies for PEVs priced below 40,000 Euro than for PEVs priced between 40,000 and 65,000 Euro. The State of California has a small PEV rebate program—up to $2,000 per PEV—that excludes high-priced PEVs (>$60,000) and buyers with high income levels (>$150,000 for single filers and >$300,000 for couples). In China the PEV production grants apply only to vehicles priced below $45,700 unless the PEV has innovative battery-swapping capability.
Consumers in the market for a new affordable PEV include both moderate-income households looking for a single vehicle for their household and higher-income households looking for second or third vehicles. Lower-income buyers are more responsive to PEV purchase incentives than higher-income buyers (Jenn et al., 2020). If governments seek to maximize the commercialization impact of purchase subsidies for a limited budget, adding income ceilings is a plausible strategy (Bauer, Hsu, and Lutsey, 2021).
The differences in how purchase subsidies are distributed affects their impacts on PEV commercialization. To have the greatest effect on PEV purchases, a “point-of-purchase” rebate is generally preferred because the tax credit, which is claimed upon filing of the annual tax return, may not occur until many months after the PEV purchase. A point-of-sale rebate allows the consumer to apply the rebate at the dealership. China’s production subsidies for PEVs have the same effect as a point-of-purchase rebate only if the manufacturer passes on the amount of the subsidy in a lower price to the consumer. For lower-income individuals, reducing the point-of-sale burden allows the buyer to purchase the PEV with less upfront capital and may make acquisition of a car loan marginally easier.
In the US, more than 70% of passenger vehicles are sold used (Carlier, 2021). Used PEVs are not currently eligible for a tax credit. Increasing the stock of new PEVs on the road will eventually result in more PEVs entering the used car market. Making PEV purchase subsidies available in the used vehicle market is another tool to increase the affordability of PEVs. No jurisdiction has yet moved in this direction though both Germany and China are considering the idea. A key aspect of the Biden administration’s vision is the Justice40 initiative, which calls for at least 40% of the benefits of federal investments in climate and clean energy to be in disadvantaged communities (White House, 2022). The current federal tax credits for PEVs, which were authorized in 2009, do not satisfy this vision because the credits are only for new PEVs and many of the PEVs eligible for credits have high MSRPs that most members of disadvantaged communities cannot afford. The State of California offers a higher PEV subsidy level ($4,500) for buyers of new PEVs with incomes less than 300% of the official poverty level (about $30,000 for a family of four). The larger subsidy is not accessed frequently because families in that income range typically purchase used cars (Graham, 2021).
2.5.2 Performance standards for emissions and fuel economy and zero emission vehicle mandates/incentives
The US, EU, and China have all adopted increasingly stringent CO2 emissions standards. The US and China also have fuel-economy standards. Since compliance with such standards is performance based, manufacturers are free to comply with PEVs or other vehicle propulsion systems and technologies. The more stringent the performance standards are, the more likely vehicle manufacturers are to comply with PEVs because PEVs achieve the maximum compliance credit per vehicle. The European Union’s CO2 performance standards for 2025 and 2030 are so stringent that they compel automakers to commercialize a substantial volume of PEVs. The EU has proposed a 100% CO2 emissions reduction target for 2035, which would be a de facto PEV mandate unless FCEVs are ready for commercialization in the light-duty passenger fleet.
China and the state of California also have zero-emission vehicle mandates that effectively require automakers to sell a minimum number of PEVs to earn sufficient compliance credits. The China ZEV mandate is nationwide while the California ZEV mandate covers about 30% of the US vehicle market (as twelve US states have elected to join the California ZEV program). As ZEV mandates become more stringent, auto makers are compelled to sell more PEVs to achieve compliance.
2.5.3 Public investment in charging infrastructure and swapping stations
Public investment in charging infrastructure is an important tool in increasing the feasibility of PEV ownership for lower-income households and city-dwellers. Many live in multi-unit dwellings (i.e., apartments) that lack garages or reserved spots to charge a PEV. In addition, increasing public charging points sends a signal to vehicle manufactures that the necessary infrastructure is in place to facilitate consumer adoption of PEVs, thereby encouraging more offerings of affordable PEVs.
The US lags behind Europe in terms of charging station build-out. This can pose a significant burden to EV adoption, with 50% of dealers saying lack of public charging stations is one of the major barriers to sales (Cox Automotive, 2019). Figure 4 shows the ratio of passenger PEVs per charging points in the US, Europe, and the global average. As of 2021, there were over 18 vehicles per charging point in the US, despite a relatively low EV uptake in the country. Such a high ratio can lead to long queuing times at stations and an unfavorable PEV experience for drivers.
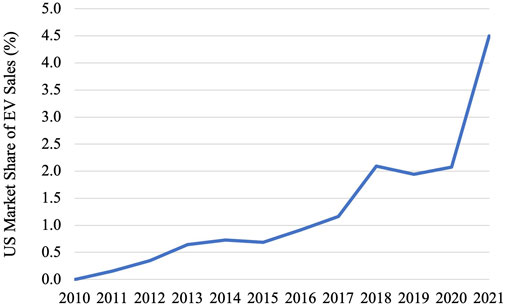
FIGURE 4. The number of PEVs per public charging points in the U.S., europe, and the world, 2021 (IEA, 2022b).
The US has made a recent push for charging infrastructure build-out with the announced $7.5 billion in funding from the Infrastructure Investments and Jobs Act in 2021. This program allocates funds for charging station installation along interstate corridors, with $2.5 billion set aside for disadvantaged communities. This is in addition to the $2 billion in funding for charging infrastructure included in Volkswagen’s ‘Dieselgate’ scandal settlement (Eisenstein, 2019). Electrify America--Volkswagen’s charging station subsidiary—has installed over 2,300 charging ports across the country since their inception in 2016. The Electrify America stations are available to all PEV owners. These investments will make considerable additions to the nation’s charging infrastructure.
Several states have also taken the initiative to invest in charging infrastructure. The largest subsidies for charging stations are those of state-owned public utility companies (Graham, 2021). For example, California, New Jersey, and New York, have all instituted rate hikes across all ratepayers to fund $1.048B, $300 million, and $250 million in infrastructure, respectively.
While the US and Europe are investing primarily in public charging infrastructure, China—with its heavy dependence on high-rise apartment living in crowded urban areas--is also encouraging battery swapping. Designated swapping stations use robots to replace a depleted battery pack with a fully-charged battery pack. The start-up NIO’s entire product line has battery-swapping capability. In July 2020, China’s central government announced standards, subsidies, and battery-swapping pilot projects in eleven cities (Lienert, Carey, Shirouzu, 2022). Whether swapping spills over from China to Europe and the United States remains to be seen.
Not included in this policy inventory are the new proposed policies to invest in enlarged PEV supply chains. China has long invested in the supply chain for lithium-ion batteries and electric motors; Europe and the US are now trying to catch up. Given the recent explosion in the prices of key materials (e.g., lithium, cobalt, nickel), a strong supply response is required from the mining sector if declines in the cost of producing PEVs are expected to continue. The supply-chain issues are beyond the scope of this article.
3 Results
3.1 Finding #1: The US plug-in electric vehicle market currently has a small selection of affordable models, but the number of affordable offerings is increasing
The total number of PEV models offered to US consumers grew from two in 2010 to 21 in 2015, 62 in 2021, and to a projected 108 in 2022 (EPRI Journal, 2018; Jenkins, 2021). Table 4 provides an inventory of each affordable PEV, its rated driving range, its classification, and its 2022 list price. There is only one startup on the list (Polestar of Sweden). Global automakers that traditionally focus on affordable gasoline-powered products (Nissan, Mazda, Hyundai, Kia, Toyota, and Mitsubishi) account for ten of the seventeen offerings.
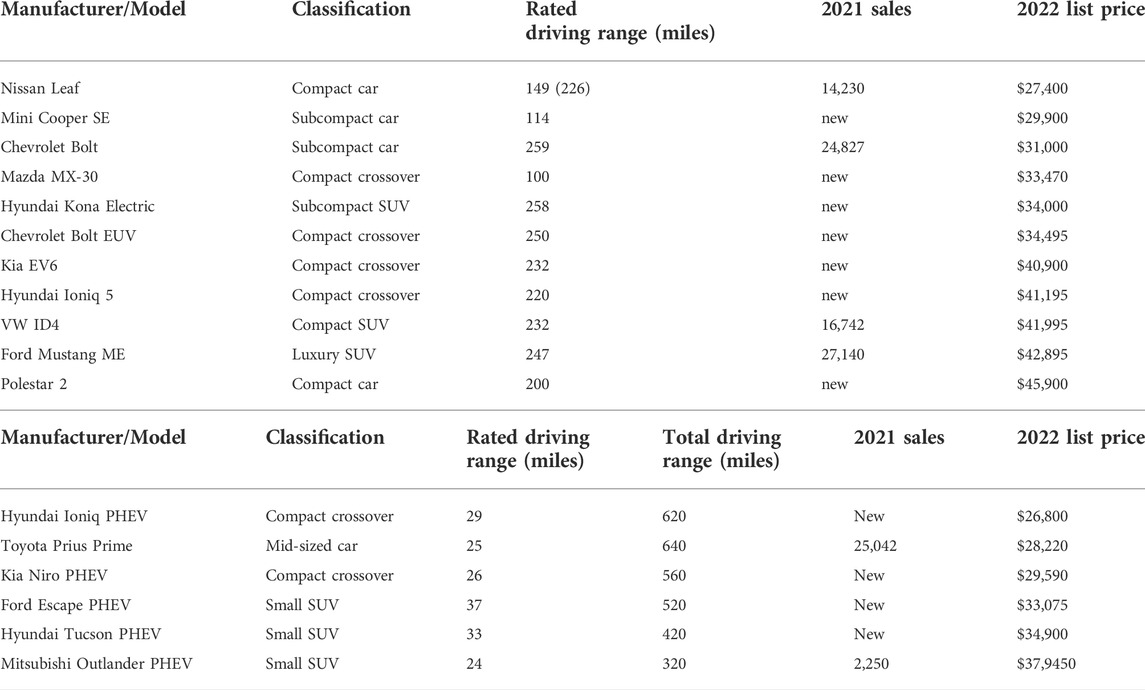
TABLE 4. Affordable electric vehicles on the US market ranked by 2022 list price; model year 2022 battery-electric vehicles and plug-in hybrid electric vehicles (Edmunds.com, 2022).
Most (84%) of the 108 plug-in models available in 2022 are not affordable. In model year 2022, vehicle manufacturers offered only seventeen PEVs with a base price below $46,000. Of these, eleven were all-electric vehicles and six were plug-in hybrid models (Edmunds.com, 2022).
Eleven of the seventeen affordable offerings started in model year 2022. There were only six affordable PEVs offered in both 2021 and 2022. The three largest in 2021 sales volume were the Ford Mach E, the Toyota Prius Prime PHEV, and the Chevrolet Bolt.
Four of the offerings (the Nissan Leaf, the Chevrolet Bolt, the Toyota Prius Prime and the Mitsubishi Outlander PHEV) have been commercialized for at least 4 years. None of these models has yet achieved a sales volume of greater than 30,000 units in a year in the US market. Such low-volume offerings are typically unsustainable for automakers. To achieve maximum economies of scale at the assembly phase, a manufacturer typically needs to produce at least 100,000 units of an affordable model and usually somewhere between 100,000 and 400,000 units (Holmes, 2012). Tesla’s production capacity for Model 3s and Model Ys (combined) at its California and Shanghai plants is about 500,000 PEVs per year, or roughly 250,000 per model (Kane, 2020).
Most of the affordable PEVs offered in the US market during the 2010–2021 period had low sales volumes and are no longer offered. They include the Fiat 500e, the Ford Focus Electric, the Chevrolet Spark EV, the Chevrolet Volt, the Smart Fortwo Electric Drive, the Mitsubishi i-MiEV, and the Volkswagen e-Golf. Some of these offerings continue to sell well in Europe. Hyundai has announced that the Ioniq Electric will be terminated after the 2021 model year.
The Leaf has the longest history of commercialization (2010–2022) but sales volumes in the US have consistently fallen short of the production plans set by Nissan (Graham, 2021). Cumulative global sales of the Leaf were only 470,000 of Nissan’s 1,500,000 PEV goal for the 2010–2017 period. In Europe, Nissan officials state publicly that the Leaf will soon be discontinued in favor of an all-electric SUV (Szymkowski, 2022).
The Chevrolet Bolt has encountered battery defects and temporary production shutdowns; some industry analysts believe the Bolt will be terminated in the next year or two since it is not using GM’s updated battery technology and the plant where the Bolt is produced is being repurposed for rollout of all-electric pickup trucks in 2024 (Isidore, 2022).
Near-term, the most commercially promising, affordable PEVs appear to be the Ford Mustang Mach-E--which is off to a strong start--and the imported VW ID.4--which is selling strongly in Europe and starts US production in June 2022. Also encouraging are the new affordable PEVs offered by Hyundai and Kia, though these same imported models are in high demand in Europe and Asia.
Hyundai Motor Group, which includes Hyundai and Kia, has announced a $7.4 billion plan to begin producing PEVs and hydrogen vehicles in the US from 2022 to 2025; the announcement noted that the company will “monitor the market conditions and U.S. government EV policy to finalize its plan to enhance its U.S. production facilities and gradually expand its local EV production” (Kane, 2021a).
An innovative alliance of Honda and General Motors has publicly pledged to produce affordable all-electric vehicles—with base prices under $30,000 for all-electric compact crossovers -- using GM’s new Ultium battery technology for sale in North America (Lutz, 2022). Production is not scheduled to begin until 2027; for most of this decade, Honda—like Toyota -- plans to give emphasis to conventional hybrid-electric vehicles in the US, since it will take many years for the US to build out public charging infrastructure to support plug-in vehicles (Sugiuro, 2022).
3.2 Finding #2: The dominant US producer of plug-in electric vehicles, tesla, is not yet giving priority to affordable plug-in electric vehicle models
In September 2021, KBB reports that the average transactions price for a PEV was $56,612. This figure is dominated by the products sold by Tesla, which accounted for 75% of the PEVs sold in the US. Table 5 describes each of Tesla’s four products, their segment classifications, their rated driving range per charge, and their recent list prices. Tesla does not report average transactions prices for individual models. Based on their list prices for base models, none of the Tesla’s four products (the Model 3, the Model Q, the Model S and the Model X) are affordable vehicles (Supercars.net, 2022).
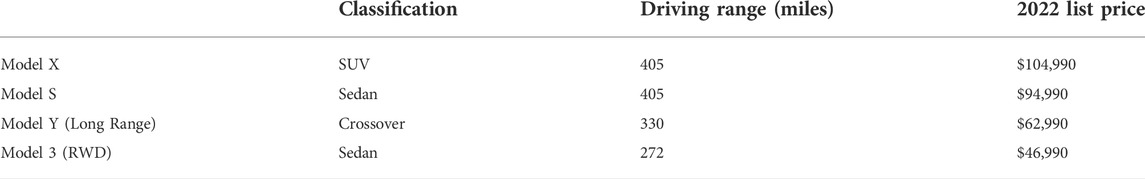
TABLE 5. Comparison of Tesla’s four products (Supercars.net, 2022).
As the least expensive of Tesla’s offerings, the Model 3 is also the company’s most popular model and the top-selling EV in 24 countries (Loveday, 2021). Tesla products are no longer eligible for the $7,500 tax credit in the U.S., which detracts from their affordability.
In 2011, Tesla pledged to bring an affordable PEV to the market by 2015, defined as roughly $30,000 (Gordon-Bloomfield, 2011). As the launch of the Model 3 approached, Tesla talked instead about a $35,000 version. When launched in 2016, the Model 3 was offered for $43,000 to $58,000, though Tesla indicated that a $35,000 version would be offered later. In February 2019, Tesla began offering the $35,000 version; it came only with black paint and 18-inch wheels and without Tesla’s self-driving Auto-Pilot feature. Tesla did not promote this version on the company’s website and required a special order to obtain it. Tesla acknowledged publicly that it could not make a profit by selling a base version of the Model 3 for $35,000. Three years later, after several price increases, the base price of the Tesla Model 3 exceeded $46,000, over KBB’s average transaction price of all passenger vehicles of $45,031 (Plungis, 2019).
Tesla has also discussed offering a $25,000 PEV, possibly for Europe. Recently, however, Tesla acknowledged that those plans had been shelved (Hull, 2022). If Tesla enters the affordable PEV market in the US, the company will have to compete with manufacturers (e.g., Hyundai/Kia, Mazda, Mitsubishi, and Honda) that remain eligible for the $7,500 tax credit for PEVs. For a passenger vehicle priced under $45,000, a $7,500 subsidy advantage is difficult for a competitor to overcome.
3.3 Finding #3: Without plug-in electric vehicle penetration into the affordable end of the new vehicle market, it will be difficult (by 2030) and impossible (by 2050) to achieve President Biden’s goals
In 2021, the market penetration of PEVs—both plug-in battery-electric vehicles and plug-in hybrid-electric vehicles—was 4.8%, a more than doubling of the shares recorded in 2018, 2019 and 2020. Figure 5 illustrates the recent pick-up in EV adoption in the US.
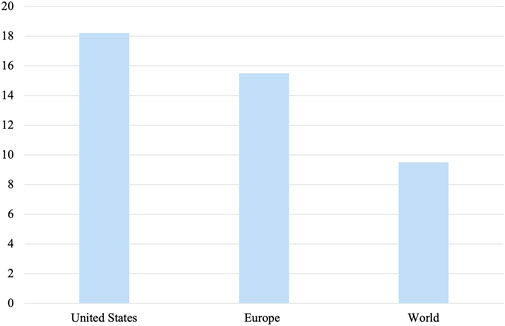
FIGURE 5. US EV market penetration over time, 2010–2021 (IEA, 2022a).
The early months of 2022 have witnessed additional growth (US Department of Energy, 2022). However, the PEV penetration rate in the US remains relatively low compared to the penetration rates of over 19% in Europe and more than 15% in China. For the US to achieve 50% PEV penetration by 2030 would require significant and rapid changes in automaker offerings, consumer behavior, and public policy.
The State of California, which has worked diligently on PEV deployment since 1990, reported 12.8% PEV penetration in 2021 compared to 8.4% in 2020. Tesla’s introduction of the new Model Y SUV helped increase California’s PEV share in 2021 compared to 2020. Since the Model Y is a high-end offering, there is not yet any strong evidence of affordable PEVs succeeding in the California market.
Numerous organizations have made forecasts for the US of EV market share in 2030 under various assumptions about factors such as the costs of producing EVs, the availability of public charging stations, electricity and gasoline prices, and prevailing public policies that might support or hinder EV sales (Fisher, 2022). By focusing on vehicle selling price rather than other factors (e.g., public charging networks or operating costs), we do not suggest that other factors are unimportant. Multiple factors will be important in determining the pace of EV commercialization. Graham (2021) provides a review of the evidence that vehicle selling price is quite important and that total cost of vehicle ownership (which includes vehicle operating cost) is less important to consumers.
Table 6 summarizes nine forecasts the are technically independent of the Biden administration and the automotive industry.
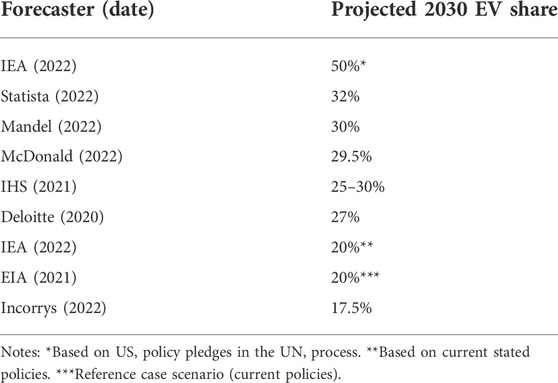
TABLE 6. 2030 forecasts of EV market share in the US.
The forecasts range widely from 17.5 to 50%. IEA has an optimistic forecast of 50% based on the Biden administration delivering on its policy pledges in the UN process. One of those pledges is renewal of the $7,500 tax credit, a pledge that the US Congress appears unlikely to honor in the forseeable future. IEA, like EIA, has a 20% forecast based on current policies.
A central question is how much progress California will make by 2030. One of the mid-range forecasts (McDonald, 2022) is explicit about its assumption that California will achieve 56.6% penetration of all-electric vehicles by 2030 (PHEVs may provide additional penetration). For the 56.6% projection to occur, automakers must sell a significant percentage of affordable PEVs in California. Yet, there is no evidence yet of a surge in affordable electric vehicle sales in California.
One could argue that California regulators will simply mandate this outcome, through the zero-emission vehicle mandates for 2022 through 2030, on the path to a ban of the internal combustion engine by 2035. Much depends how consumers react to the affordable PEVs offered by automakers between now and 2030. If the reception is unfavorable, California regulators may need to relax the zero-emission vehicle requirements, as they have done numerous times since the 1990 launch of the program (Graham, 2021).
A technical weakness of these forecasts is that they do not make separate forecasts for luxury, premium, and affordable vehicles. Given Tesla’s impressive progress penetrating the luxury and premium markets, it is not implausible to believe that Tesla -- in conjunction with mimicking competitors -- could capture at least 67% of the luxury and premium markets by 2030. Since Tesla is not pressuring the market with affordable offerings, it is difficult to have confidence that the EVs will make significant penetration into the affordable market by 2030.
In theory, President Biden’s 2030 goal could be accomplished by 100% PEV penetration of the non-affordable market and 0% penetration of the affordable market. Since the pace of commercialization of PEVs in the markets for large SUVs and large pickups is slow, significant PEV deployments in the more affordable vehicle segments (e.g., sedans and small crossovers) will be required by 2030 to achieve Biden’s goal.
No all-electric large SUVs have been offered in the US market to date. All-electric pickup truck offerings are beginning such as the Rivian RIT and the Ford F150 Lightning. GM’s all-electric pickup trucks are scheduled for 2023–2024. Tesla’s Cybertruck is slated for rollout in 2023 but will be a high-end offering. Under current law, the Tesla and GM trucks will not be eligible for federal tax credits. At a base price of $39,974 (before purchase subsidies), the Lightning is the first affordable pick-up truck in the PEV market (Ford, 2022).
3.4 Finding #4: The experience from europe suggests that commercialization of affordable plug-in electric vehicles is feasible, if public policies are sufficiently favorable to plug-in electric vehicles
Since commercialization of PEVs is further along in Europe than in the US, comparisons are worthwhile to gain possible insights into how deployment of affordable PEVs in the US might be accelerated. Comparisons of national vehicle markers must be done with caution because there are substantial differences in the types of vehicles that European and US consumers demand. We also acknowledge that EV penetration varies enormously throughout Europe, with most recent European EV sales concentrated in Germany, France, the United Kingdom and Scandinavia.
The average price of a new car in Europe is significantly lower than in the US, primarily because of the numerous tiny city cars and superminis that are sold in cities throughout Europe. In the more prosperous countries of Europe (France, Germany, United Kingdom, Netherlands, and Norway), the average price paid for a new car (31,059 Euro in 2019, or 34,786 USD) is only slightly less than it was in the US ($35,970 in 2019) (Felipe, 2019). Most (74% in 2021) PEVs sold in Europe’s 28 countries are to consumers in those five countries (Car Sales Statistics, 2022a). In Europe, SUVs and crossovers are becoming more popular, following the strong trends in this direction observed in the US.
In 2021 PEVs captured 19.1% of the European market for new passenger vehicles, up from 11.3% in 2020 (GreenCars, 2021). In 2021 European consumers had 74 PEV models to choose from, up from 57 in 2020, 33 in 2019. Volkswagen’s six brands account for 25% of the market; Stellantis is second at 13.9% and Tesla products are third at 14.5%. Tesla’s large new Berlin facility may allow it to expand rapidly its European market share from 2022 and the future. By way of contrast, Tesla products captured 75% of the PEV market in the US in 2021.
Table 7 provides a rank ordering of PEV models in Europe according to 2021 sales volume coupled with information on vehicle type, and base price information (before purchase incentives). Europe’s success with deployment of tiny PEVs is unlikely to be replicated in the US, where city cars and superminis have not been commercially successful. The subcompact car share of the US market is less than 1.5% and has declined 50% since 2016 (Cain, 2020). Subcompacts in the US are significantly larger than Europe’s city cars and superminis.
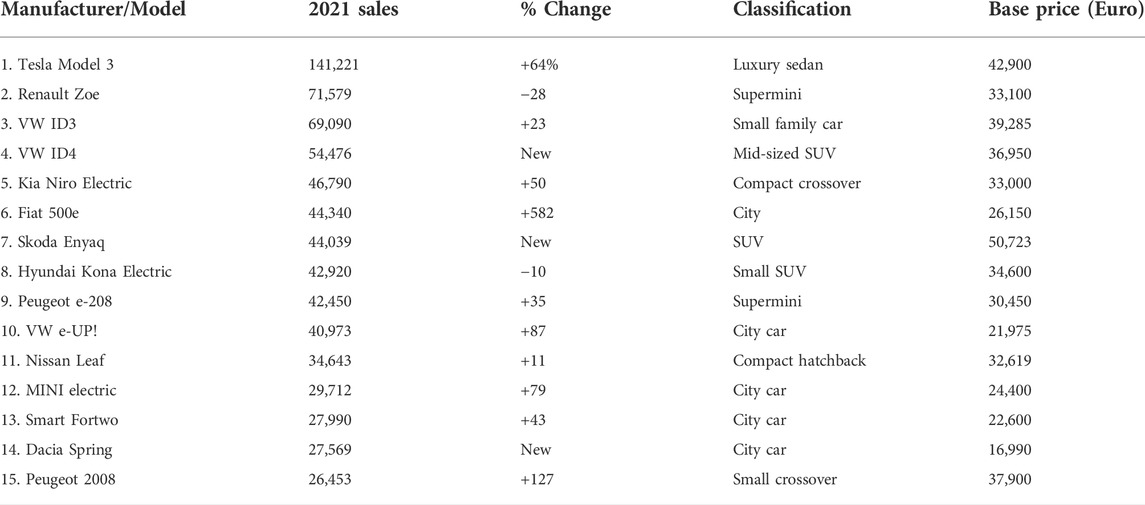
TABLE 7. Top 15 PEV models in Europe-28 By 2021 sales volume, plus % change in sales volume over 2020 and selected vehicle characteristics (Car Sales Statistics, 2022b; WattEV2Buy, 2017).
What is relevant to the US from the European experience is the rapid penetration of PEVs into the markets for crossovers and small- and mid-sized SUVs. The 2021 sales experiences of the VW ID.4, Kia Niro Electric, Soka Enyaq, Hyundai Kona Electric, and Peugeot e-208 are especially instructive.
If PHEV models had also been included in Table 8, six models would have been listed as in Table 7 below.
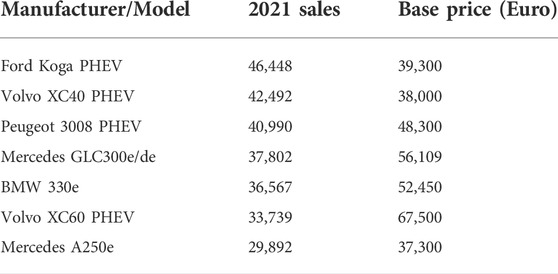
TABLE 8. Rank ordering of PHEV models in europe based on 2021 sales volume.
Those figures suggest that affordable PHEVs may also have commercial promise in the US. However, the affordable Mitsubishi Outlander PHEV, which has sold 270,000 units globally from 2013 to 2021 (over 200,000 of them in Europe), has not been commercially successful in the US since it was offered in 2017 (Kane, 2021b). Since affordable PHEVs may be appealing to single-vehicle households with moderate incomes, US policy makers need to consider the promise of affordable PHEVs, at least as a transition technology until 2030 when the public charging infrastructure is more fully deployed. Currently, PHEVs account for 46% of PEV sales in Europe but only 20% in the United States, as both federal purchase subsidies and California’s compliance credits and subsidies for PHEVs are lower than for all-electric vehicles.
Several other features of the European market for PEVs may be relevant to US policy makers. Auto makers doing business in Europe are highly motivated to sell PEVs because of the European Union’s stringent performance standards for CO2 emissions. If the average CO2 emissions of a manufacturer’s fleet exceed its specific emission target in a given year, the manufacturer has to pay—for each of its vehicles newly registered in that year—an excess emissions premium of €95 per g/km of target exceedance (European Commission, 2022). Volkswagen alone paid $120 million to the EU for a slight exceedance in model year 2020 (Reuters, 2021). The US EPA is now redoing its CO2 performance standards for model years 2027 and beyond.
Some EU member states are going beyond purchase subsidies to encourage PEV sales. They are adding incentives such as financial rewards for scrapping an old ICEV and replacing it with a PEV, heavy taxation of ICEVs based on CO2 emission rates, and sales tax or VAT concessions for PEVs (Winton, 2021). In Norway, the CO2 tax on ICEVs is so large that is significantly cheaper for a consumer to purchase a PEV than a comparably-sized ICEV (ACEA - European Automobile Manufacturers’ Association, 2020).
Electricity prices in Europe are 50–90% larger in Europe than the US, which would seem to discourage PEV sales in Europe (Kulkarni, 2016). However, gasoline and diesel fuel prices are almost twice as large in European countries compared to the US average, due to the higher fuel taxes imposed by EU member states (Buchholz, 2022). Thus, the operating-cost advantage of a PEV over a traditional vehicle is somewhat larger in Europe than in the United States, though there is considerable price variability across European countries and across US states. The total cost of ownership of PEVs is less central to commercialization in the US than the original purchase price, since new vehicle purchasers in the US are more sensitive to purchase price than operating costs (Allcott and Wozny, 2014).
4 Discussion
Our main finding is that the United States is unlikely to meet the 2030 national goal of 50% PEV market share without rapid commercialization of affordable plug-in electric vehicles. We found that only 17% of the 108 PEV models on the US market in 2022 are affordable, and eight affordable models offered between 2010 and 2021 are no longer available in the US. The affordable models that have at least 4 years of sales experience have not yet sold more than 30,000 units per year. Low-volume affordable models are not sustainable in an industry where optimal production volumes of affordable vehicles are in the range from 100,000–500,000 units per year.
There are some signs of progress. Eleven of the 17 affordable PEV models are new to the market in 2022. Some relatively new models (the Ford Mustang Mach E, the Volkswagen ID.4, and the Toyota Prius Prime PHEV) have already attracted 10,000–30,000 customers during their early stage of commercialization. Volkswagen, Honda, GM, and Hyundai/Kia also have plans for high-volume production of affordable models in the US later in this decade, assuming U.S. market conditions and public policies are supportive.
The rate of PEV deployment in Europe from 2015 to 2022 has outpaced the deployment rate in the US as a whole and even the rate in California, which has been promoting PEV deployment since 1990. See Figure 6 for a comparison of PEV penetration in China, Europe, and the US, which depicts the US significantly behind other regions. Some of the affordable deployment in Europe is not relevant to the US market (e.g., tiny city cars). Europe’s progress with PEVs in the cross-over and SUV markets is highly relevant to the US market. Moreover, Europe’s relatively equal market emphasis on PHEVs and all-electric plug-in vehicles is also worthy of consideration by US policy makers.
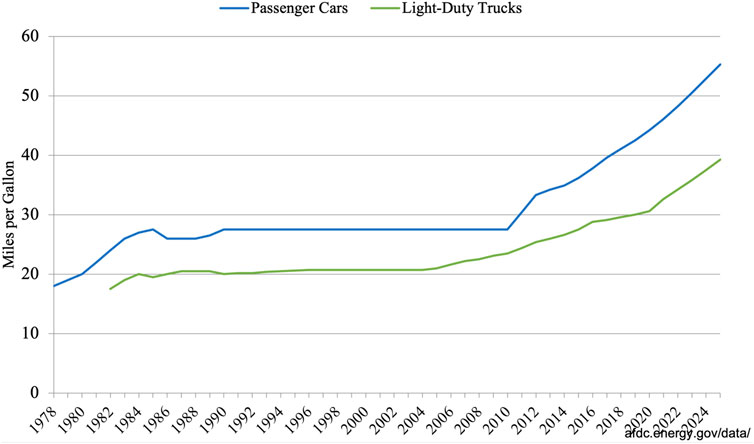
FIGURE 6. Global PEV penetration by region 2015–2021 (IEA, 2022a).
The major differences in policy push we found between the US and Europe can be summarized succinctly. First, the EU’s CO2 performance standards are more demanding and have a longer time horizon than the US standards, thereby providing strong motivation for the European market to shift toward affordable PEVs as well as premium/luxury PEVs. The Biden administration, through EPA and NHTSA rulemakings, could provide a similar degree of regulatory certainty in the forthcoming rulemaking for model years 2027 and beyond. Second, the PEV purchase incentives in the prosperous EU member states are larger, more widely available for all manufacturers, and targeted to affordable PEVs than the US tax-credit program for PEVs. The US Congress has been considering proposals to reform the PEV tax credits for several years; legislative progress is slow. In August 2022 the US Congress passed the “Inflation Reduction Act” to renew for ten years the $7,500 EV incentive as a point-of-sale rebate. However, the legislation has complex supply-chain requirements that could limit the number of EV models eligible for the incentive. It remains to be seen whether this legislation will help or hinder the development of more affordable EV models. Finally, the US has made significant recent commitments to public investments in charging infrastructure, though the deployment of public charging stations is further along in Europe than the US. Since the push for PEVs is crucial to the US plan to meet its international commitments on climate policy, we recommend that US policy makers focus on policies that will accelerate the deployment of affordable PEVs.
Data availability statement
The original contributions presented in the study are included in the article/Supplementary Material, further inquiries can be directed to the corresponding author.
Author contributions
EB prepared the inventory of PEV policies and assisted in the market analysis and manuscript preparation. JG gathered the market information on PEVs, collaborated with EB on the market analysis, and prepared the first draft of the manuscript for editing by EB.
Funding
The funding is from unrestricted funds at Indiana University, Bloomington.
Conflict of interest
The authors declare that the research was conducted in the absence of any commercial or financial relationships that could be construed as a potential conflict of interest.
Publisher’s note
All claims expressed in this article are solely those of the authors and do not necessarily represent those of their affiliated organizations, or those of the publisher, the editors and the reviewers. Any product that may be evaluated in this article, or claim that may be made by its manufacturer, is not guaranteed or endorsed by the publisher.
References
ACEA - European Automobile Manufacturers’ Association (2020). Overview - electric vehicles: Tax benefits & purchase incentives in the European union (2020). Available at: https://www.acea.auto/fact/overview-electric-vehicles-tax-benefits-purchase-incentives-in-the-european-union/.
Allcott, H., and Wozny, N. (2014). Gasoline prices, fuel economy, and the energy paradox. Rev. Econ. Statistics 96 (5), 779–795. doi:10.1162/rest_a_00419
Bauer, G., Hsu, C-W., and Lutsey, N. (2021). When might lower-income drivers benefit from electric vehicles? Working paper. Washington D.C.: International Council on Clean Transportation. Available at: https://theicct.org/sites/default/files/publications/EV-equity-feb2021.pdf.
Bierenkoven, C. (2022). Act fast if you want tax credits on Toyota and nissan EVs. CarBuzz. Available at: https://carbuzz.com/news/act-fast-if-you-want-tax-credits-on-toyota-and-nissan-evs.
Bloomberg, M. R., Inslee, J., Lyles, D., and Dean, L. (2021). Blueprint for 2030: An all-in climate strategy for faster, more durable emissions reductions. New York City: America is All-In. Available at: https://www.americaisallin.com/wp-content/uploads/2021/11/all-in-blueprint-2030.pdf.
Brandt, E. (2020). 7 most affordable fords for 2020. Autotrader. Available at: https://www.autotrader.com/best-cars/most-affordable-fords-for-2020.
Breetz, H. L., and Salon, D. (2018). Do electric vehicles need subsidies? Ownership costs for conventional hybrid and electric vehicles in 14 US cities. Energy Policy 120, 238–249. doi:10.1016/j.enpol.2018.05.038
Buchholz, K. (2022). How gas prices compare around the world [infographic]. New York City: Forbes. Available at: https://www.forbes.com/sites/katharinabuchholz/2022/03/11/how-gas-prices-compare-around-the-world-infographic/(Accessed May 30, 2022).
Buekers, J., Van Holderbeke, M., Bierkens, J., and Panis, L. (2014). Health and environmental benefits related to electric vehicle introduction in EU countries. Transp. Res. Part D Transp. Environ. 33, 26–38. doi:10.1016/j.trd.2014.09.002
Cain, T. (2020). U.S. Subcompact car market share fell by half since 2016; subcompact crossover segment tripled since 2013. The Truth About Cars. Available at: https://www.thetruthaboutcars.com/2020/08/u-s-subcompact-car-market-share-fell-by-half-since-2016-subcompact-crossover-segment-tripled-since-2013/.
California Air Resources Board (2022). Zero-emission vehicle program | California Air Resources board. Available at: https://ww2.arb.ca.gov/our-work/programs/zero-emission-vehicle-program/about (Accessed May 30, 2022).
Car Sales Statistics (2022a). 2021 (full year) Europe: Battery electric and plug-in hybrid car sales per EU, UK, and EFTA country. Available at: https://www.best-selling-cars.com/electric/2021-full-year-europe-battery-electric-and-plug-in-hybrid-car-sales-per-eu-uk-and-efta-country/(Accessed February 2, 2022).
Car Sales Statistics (2022b). 2021 (full year) Europe: Best-selling electric car models and brands. Available at: https://www.best-selling-cars.com/electric/2021-full-year-europe-best-selling-electric-car-models-and-brands/(Accessed February 25, 2022).
Carlier, M. (2022). U.S.: Average selling price of new vehicles 2021. Hamburg, Germany: Statista. Available at: https://www.statista.com/statistics/274927/new-vehicle-average-selling-price-in-the-united-states/(Accessed May 30, 2022).
Carlier, M. (2021). U.S. new and used car sales 2010-2020. Hamburg, Germany: Statista. Available at: https://www.statista.com/statistics/183713/value-of-us-passenger-cas-sales-and-leases-since-1990/.
Cox Automotive (2019). Evolution of mobility: The path to electric vehicle adoption study. Available at: https://d2n8sg27e5659d.cloudfront.net/wp-content/uploads/2019/08/2019-COX-AUTOMOTIVE-EVOLUTION-OF-MOBILITY-THE-PATH-TO-ELECTRIC-VEHICLE-ADOPTION-STUDY.pdf.
Deloitte (2020). Electric vehicles: Setting a course for 2030. New York City: Deloitte.com. Available at: https://www2.deloitte.com/content/dam/insights/us/articles/22869-electric-vehicles/DI_Electric-Vehicles.pdf.
Edmunds.com (2022). Cheapest electric cars - most affordable EVs for 2022 | edmunds. Available at: https://www.edmunds.com/electric-car/articles/cheapest-electric-cars/(Accessed May 30, 2022).
Eisenstein, P. (2019). VW’s $2 billion penalty for diesel scam, Electrify America, builds electric charging network across US to boost EV market. Detroit: CNBC. Available at: https://www.cnbc.com/2019/05/10/vws-2-billion-penalty-for-diesel-scam-builds-ev-charging-network-across-us.html.
Energy Information Administration (2021). Energy information outlook. Available at: https://iea.blob.core.windows.net/assets/ad8fb04c-4f75-42fc-973a-6e54c8a4449a/GlobalElectricVehicleOutlook2022.pdf.
Environmental Defense Fund (2011). Recapturing US leadership on climate: Setting an ambitious and credible nationally determined contribution. Available at: https://www.edf.org/sites/default/files/documents/Recapturing%20U.S.%20Leadership%20on%20Climate.pdf.
EPRI Journal (2018). Market indicators for electric vehicles are up across the board. Available at: https://eprijournal.com/electric-vehicle-market-revs-up/.
European Commission (2022). CO2 emission performance standards for cars and vans. Brussels: European Union. Available at: https://ec.europa.eu/clima/eu-action/transport-emissions/road-transport-reducing-co2-emissions-vehicles/co2-emission-performance-standards-cars-and-vans_en (Accessed May 24, 2022).
Fakhry, R., and Yeh, S. (2021). The biden administration must swiftly commit to cutting climate pollution at least cost by 2030. Natural Resources Defense Council. Available at: https://www.nrdc.org/sites/default/files/2030-biden-climate-pollution-ib.pdf.
Felipe, M. (2019). EV prices have been growing during the last 8 years. Italy: JATO. Available at: https://www.jato.com/ev-prices-have-been-growing-during-the-last-8-years/.
Ferris, R. (2018). Ford is basically giving up on US car business, and GM is not far behind. Detroit: CNBC. Available at: https://www.cnbc.com/2018/04/26/ford-is-basically-giving-up-on-us-car-business-and-gm-is-not-far-behind.html.
Fisher, J. (2022). How quickly are electric vehicles taking over? EV sales and forecasts paint the picture. Available at: https://joinyaa.com/guides/ev-sales-forecasts-2030-2050/.
Ford (2022). Ford F-150 lightning. Detroit: Ford Motors. Available at: https://www.ford.com/trucks/f150/f150-lightning/(Accessed January 20, 2011).
Gordon-Bloomfield, N. (2011). Tesla’s challenge: Build $30k mainstream electric car by 2015. Bristol, UK: Green Car Reports. Available at: https://www.greencarreports.com/news/1053971_teslas-challenge-build-30k-mainstream-electric-car-by-2015 (Accessed May 30, 2022).
Graham, J. D. (2010). Bush on the home front: Domestic policy triumphs and setbacks. Bloomington, Indiana: Indiana University Press.
GreenCars (2021). How many electric vehicles sold in 2021? | GreenCars. Available at: https://www.greencars.com/post/how-many-electric-vehicles-sold-in-2021 (Accessed May 30, 2022).
Holmes, J. (2012). The 15 top-producing US car plants. Los Angeles: Motor Trend. Available at: https://www.motortrend.com/news/the-15-top-producing-american-car-plants-151801/.
Hull, D. (2022). Will Tesla make cheaper electric cars? $35,000 model 3 feels like a fever dream - Bloomberg. Available at: https://www.bloomberg.com/news/articles/2022-03-16/tesla-s-35-000-model-3-feels-like-a-fever-dream (Accessed May 30, 2022).
Hultman, N., Clarke, L., McJeon, H., Cui, R., Hansel, P., McGlynn, E., et al. (2021). Working paper: Charting an ambitious U.S. NDC of 51% reductions by 2030.” center for global sustainability. College Park, MD: University of Maryland Center for Global Sustainability. Available at: https://cgs.umd.edu/research-impact/publications/working-paper-charting-ambitious-us-ndc-51-reductions-2030 (Accessed May 30, 2022).
IEA (2022b). Charging points per EV and kW per electric LDV in selected countries, 2021. Paris: International Energy Agency. Available at: https://www.iea.org/data-and-statistics/charts/charging-points-per-ev-and-kw-per-electric-ldv-in-selected-countries-2021.
IEA (2021a). Global EV outlook 2021. Paris: IEA. Available at: https://www.iea.org/reports/global-ev-outlook-2021.
IEA (2022a). Global EV policy explorer. Paris: IEA. Available at: https://www.iea.org/articles/global-ev-policy-Explorer.
IEA (2021b). Global EV sales by scenario, 2020-2030. Available at: https://www.iea.org/data-and-statistics/charts/global-ev-sales-by-scenario-2020-2030.
IHS (2021). Pivoting to an electrified future: The automotive industry amps up. Available at: https://cdn.ihsmarkit.com/www/prot/pdf/0721/675485260-0421-CU-AUT-ZEV-Whitepaper-Final-HiRes.pdf.
Incorrys (2022). Annual sales of electric vehicles in 2030. Available at: https://incorrys.com/technology-data-and-forecasts/electric-vehicles/annual-sales-of-electric-vehicles-in-2030/.
Isidore, C. (2022). GM signals it could soon pull the plug on chevy Bolt, its once breakthrough EV | CNN business. Available at: https://www.cnn.com/2022/01/26/cars/gm-bolt-future/index.html (Accessed May 30, 2022).
Jenkins, L. (2021). Morning consult. “The coming electric vehicle wave: In 2022. Consumers Get Options. Available at: https://morningconsult.com/2021/12/22/electric-vehicles-consumers-2022/(Accessed December 22, 2021).
Jenn, A., Lee, J. H., Hardman, S., and Tal, G. (2020). An in-depth examination of electric vehicle incentives: Consumer heterogeneity and changing response over time. Transp. Res. Part A Policy Pract. 132, 97–109. doi:10.1016/j.tra.2019.11.004
Kane, M. (2021a). InsideEVs. “Europe: Mitsubishi outlander PHEV was best- selling plug-in hybrid SUV in 2020. Available at: https://insideevs.com/news/488918/europe-mitsubishi-outlander-phev-sales-suv-2020/(Accessed May 30, 2022).
Kane, M. (2021b). InsideEVs. “Hyundai and Kia to produce electric cars in the US. Available at: https://insideevs.com/news/507192/hyundai-kia-produce-evs-us/(Accessed June 1, 2022).
Kane, M. (2020). Tesla production sites by model assignment, capacity: July 2020. InsideEVs. Available at: https://insideevs.com/news/435448/tesla-production-sites-assignment-capacity-july-2020/.
Kelley Blue Book (2021). Average new-vehicle transaction prices top $45,000 for first time, according to Kelley Blue Book. Los Angeles: MediaRoom. Available at: https://mediaroom.kbb.com/2021-10-13-Average-New-Vehicle-Transaction-Prices-Top-45,000-for-First-Time,-According-to-Kelley-Blue-Book (Accessed May 30, 2022).
Kulkarni, V. (2016). Why European electricity prices rose more than US prices. Market Realist. Available at: https://marketrealist.com/2016/06/european-electricity-prices-increased-much-us/.
Lienert, P., Nick, C., and Norihiko, S. (2022). Inside China’s electric drive for 628 swappable batteries. Detroit: Reuters. Available at: https://www.reuters.com/business/autos-transportation/inside-chinas-electric-drive-swappable-car-batteries-2022-03-24/.
Loveday, S. (2021). Top-selling EVs across the globe: Tesla dominates, model 3 leads. Available at: https://insideevs.com/news/556356/top-selling-evs-world-tesla/.
Mandel, S. (2022). One in two cars sold will have an electric powertrain by 2030. Available at: https://www.counterpointresearch.com/electric-vehicles-forecast-2030/.
Martz, A., Plotz, P., and Jochem, P. (2021). Global Perspective on CO2 emissions of electric vehicles. Environ. Res. Lett. 16, 054043. doi:10.1088/1748-9326/abf8e1
McDonald, L. (2022). EV sales forecasts. Available at: https://evadoption.com/ev-sales/ev-sales-forecasts/#:∼:text=ev%20sales%20Below%20is%20our%20latest%20long-term%20forecast,2030%20from%20an%20expect%20roughly%203.4%25%20in%202021 (Accessed July 19, 2022).
Mock, P. (2021). Charged up, ready to go!. Washington D. C.: ICCT. Available at: https://theicct.org/charged-up-ready-to-go-after-some-delays-how-it-is-to-buy-an-electric-car-these-days/.
National Academy of Sciences (2021). Medicine and engineering. Accelerating decarbonization of the United States. Washington, DC: National Academy Press. Available at: https://nap.nationalacademies.org/resource/25932/RH-decarbonization.pdf.
Plungis, J. (2019). Consumer reports. “Tesla finally starts selling $35,000 model 3”. Available at: https://www.consumerreports.org/hybrids-evs/tesla-finally-starts-selling-35000-model-3-a3330889617/(Accessed May 30, 2022).
Quora (2021). What is the difference between a premium car and a luxury car? Available at: https://www.quora.com/What-is-the-difference-between-a-premium-car-and-a-luxury-car (Accessed May 30, 2022).
Reuters (2021). Volkswagen faces $121 million fine for missing EU emissions targets. Berlin: Autoblog. Available at: https://www.autoblog.com/2021/01/22/vw-fined-misses-eu-co2-emissions-targets/(Accessed May 30, 2022).
Shepardson, D. (2021). Biden to set target for 50% EVs by 2030; industry backs goal. Available at: https://www.reuters.com/article/usa-autos-biden-idCNL1N2PC05W (Accessed August 5, 2021).
Statista (2022). Projected electric vehicle market share between 2030 and 2035. Available at: https://www.statista.com/statistics/744946/us-electric-vehicle-market-growth/(Accessed July 19, 2022).
SuperCars.net (2022). Tesla 2022 model list: Current lineup, prices & reviews. Available at: https://www.supercars.net/blog/all-brands/tesla/tesla-current-models/(Accessed May 30, 2022).
Swansway Motor Group (2021). What’s the difference between premium & luxury cars? Torque Tips. Available at: https://blog.swanswaygarages.com/premium-luxury-cars-whats-the-difference (Accessed August 4, 2021).
Szymkowski, S. (2022). Nissan Leaf will die, but return as electric SUV, report says. CNET. Available at: https://www.cnet.com/roadshow/news/nissan-leaf-electric-suv/(Accessed May 30, 2022).
The Motor Muse (2018). What is a premium car? And what is its future? Available at: http://themotormuse.com/2018/08/24/the-origin-and-future-of-premium-cars/.
The White House (2021a). Fact sheet: President biden sets 2030 greenhouse gas pollution reduction target aimed at creating good-paying union Jobs and securing U.S. Leadership on clean energy technologies. Available at: https://www.whitehouse.gov/briefing-room/statements-releases/2021/04/22/fact-sheet-president-biden-sets-2030-greenhouse-gas-pollution-reduction-target-aimed-at-creating-good-paying-union-jobs-and-securing-u-s-leadership-on-clean-energy-technologies/.
US Department of Energy (2022). Light-duty plug-in electric vehicle sales in the United States nearly doubled from 2020 to 2021. Washington D. C.: CleanTechnica. Available at: https://cleantechnica.com/2022/03/04/light-duty-plug-in-electric-vehicle-sales-in-the-united-states-nearly-doubled-from-2020-to-2021/(Accessed May 30, 2022).
US Environmental Protection Agency (2022). Fast facts on transportation greenhouse gas emissions. US: EPA. Available at: https://www.epa.gov/greenvehicles/fast-facts-transportation-greenhouse-gas-emissions (Accessed May 30, 2022).
US Environmental Protection Agency (2017). The EPA automotive trends report. Data and Tools. Available at: https://www.epa.gov/automotive-trends.
WattEV2Buy (2017). European EV price list | price list of electric cars in Europe | WattEV2Buy. Available at: https://wattev2buy.com/european-ev-market-price-list-electric-cars-eu/.
White, A. (2022). 12 best-selling electric vehicles of 2021. Available at: https://www.caranddriver.com/features/g36278968/best-selling-evs-of-2021/.
White House (2022). Justice40: A whole-of-government initiative. Available at: https://www.whitehouse.gov/environmentaljustice/justice40/.
Winton, N. (2021). Where are the affordable cars required to accelerate Europe’s electric vehicle revolution? Forbes. Available at: https://www.wintonsworld.com/where-are-the-affordable-cars-required-to-accelerate-electric-revolution/.
Keywords: PEVs, electric vehicles, charging infrastructure, emissions, climate Change, equity, consumer adoption, affordable
Citation: Graham JD and Brungard E (2022) Affordable Electric Vehicles: Their Role in Meeting the U.S. Contribution to the Paris Climate Goals. Front. Environ. Sci. 10:962942. doi: 10.3389/fenvs.2022.962942
Received: 06 June 2022; Accepted: 05 August 2022;
Published: 07 September 2022.
Edited by:
Saba Siddiki, Syracuse University, United StatesReviewed by:
Bradley Lane, University of Kansas, United StatesGiangiacomo Bravo, Linnaeus University, Sweden
Copyright © 2022 Graham and Brungard. This is an open-access article distributed under the terms of the Creative Commons Attribution License (CC BY). The use, distribution or reproduction in other forums is permitted, provided the original author(s) and the copyright owner(s) are credited and that the original publication in this journal is cited, in accordance with accepted academic practice. No use, distribution or reproduction is permitted which does not comply with these terms.
*Correspondence: Eva Brungard, ZXZhYnJ1bmdAaXUuZWR1