 Xijun Liu1,2†
 Ranyang Zhang
- 1Construction Management Department, Guangzhou Expressway Co., Ltd., Guangzhou, China
- 2Highway Academy, Chang’an University, Xi’an, China
A good air environment and smooth traffic environment are important for smart city building and sustainable development. However, with the increase of urban population and traffic volume, traditional intersections often face serious congestion problems, which makes vehicle emissions increase greatly and seriously threatens urban air quality. To alleviate this problem, the unconventional design with an outside left turn lane on the right side of the through lanes has been widely used in China. However, there is little research and guidance on the location of unconventional outside left-turn lane settings. Therefore, this paper collects traffic data from a signalized intersection with unconventional outside left-turn lane design in Xi’an, and evaluates and analyzes the outside left-turn lane design at different locations using the entropy weight method (EWM). The simulation of the outside left-turn lane with different setting locations is performed in VISSIM and six indexes are analyzed. Finally, EWM is innovatively used to calculate the weights of the adopted indexes to achieve a comprehensive evaluation of different location schemes under different traffic scenarios. It was found that the differences in vehicle emissions were as high as 54.7% with different locations of the outside left-turn lane design, and the vehicles operated with different efficiencies. The unconventional design with the outside left-turn lane in the sub-outermost lane is suitable for most traffic conditions, while the design with the outside left-turn lane in the outermost lane performs better at high traffic volumes. The conventional outside left turn lane design is suitable for light traffic.
1 Introduction
With the introduction and expansion of the concept of smart cities, sustainable development, and carbon neutrality (GLIC SKA, 2016; SzymaD ska et al., 2021; Shi et al., 2022.), good urban air quality and transportation environment have become crucial components of the city’s image (GliD ska, 2010). However, due to China’s accelerated urbanization, the urban population and the number of motor vehicles have grown significantly, and the urban congestion problem has become increasingly severe (Map, 2021). Urban intersections, as nodes of urban road networks, have also become bottleneck sections of urban road networks (Wang et al., 2017; Stevanovic and Mitrovic, 2019). The severe congestion issue not only affects residents’ travel efficiency and life satisfaction but also increases the emission of automotive pollutants (Zhang et al., 2013), exposing pedestrians around intersections to a high level of pollution (Franklin et al., 2019) and having a significant impact on residents’ health and environmental protection. Therefore, alleviating the intersection congestion is vital for ensuring urban air quality and smart city development.
Researchers and policymakers in the transportation field have discussed various strategies to reduce the pressure and improve the efficiency of urban intersection traffic for many years. Currently, many cities adopt traffic restriction policies to decrease urban congestion, which can also harm citizens and regional economic development (Zhang et al., 2019). Some scholars proposed various intersection timing optimization models based on different algorithms and models and achieved positive results in increasing intersection capacity and reducing travel delays (Krzysztofi, 2016; Cruv-Piris et al., 2019; Chen et al., 2020). Several studies analyzed the impact of parking on intersection capacity (Kurek and Macioszek, 2021), and others investigated residents’ preferences in choosing alternative, environmentally friendly modes of transportation (Cieśla and Orzech, 2019). In addition, some researchers suggested unconventional intersection designs that are different from conventional intersections in order to maximize the potential of intersections. Common designs for unconventional intersections include median U-turn intersections (MUTI) (Carter et al., 2005; Liu et al., 2007), cross-displacement left-turn intersections (Sayed et al., 2006; Esawey and Sayed, 2011), and continuous flow intersections (CFI) (You et al., 2013; Wu et al., 2016; Gao et al., 2020). The main idea of these designs is to optimize the left-turning traffic flow by establishing dynamic lanes or downstream median openings to adjust the traffic organization of left-turning vehicles, thereby eliminating the traffic conflicts between left-turning and through traffic, reducing vehicle delays, and enhancing the intersection capacity.
A signal intersection with an unconventional outside left-turn lane design is widely used on major arterial road segments in many cities in China (Liu et al., 2011; Liu et al., 2013). Unlike conventional signal intersections, this unconventional left-turn lane design permits the left-turn lane to be set to the right of the through lane with a dedicated left-turn phase, as shown in Figure 1. When the terminal of an urban interchange ramp or a right-side street is located near the functional area of the signal intersection, and many vehicles from the side street or the ramp terminal need to turn left at the signal intersection, the unconventional outside left-turn lane is typically set. The unconventional outside left-turn lane located to the right of the through lane provides a larger turning radius than a conventional signalized intersection for buses and large passenger vehicles. In addition, left-turning vehicles from the upstream right-side side street or ramp terminal do not need to move into the leftmost lane to make a left turn, which reduces conflicts with the through traffic and simplifies the driver’s operation.

FIGURE 1. Unconventional outside left-turn lane design at signalized intersections.
Although intersections with unconventional outside left-turn lane designs are increasingly used in urban areas in China, there is very little research and guidance on the location of unconventional outside left-turn lane settings. In addition, the unconventional outside left-turn lane settings are inconsistent with drivers’ expectations, which can increase safety risks of through traffic pulling into the outside left-turn lane by mistake and being forced to merge back into the through lane.
Therefore, it is necessary to analyze the effects of unconventional outside left-turn lane setting locations on traffic operation and safety. This study investigates the operational characteristics of intersections with different unconventional outside left-turn lane setting locations and the morphological choices under different traffic volumes using the entropy weight method (EWM) approach. Traffic flow and geometric data were collected and analyzed at a signalized intersection with a typical unconventional outside left-turn lane in Xi’an and calibrated and simulated in VISSIM software. The intersection is then analyzed in VISSIM for four typical outside left-turn lane setting locations, including four locations placed at the most outside lane, the sub-outside lane, the middle lane, and the innermost lane. Finally, to accurately evaluate the different options, six indices were selected and synthesized by the EWM: number of vehicles, delays, number of stops, queue length, CO emissions, and number of conflicts. As one of the multiple index decision methods, the EWM can calculate the weights of the different indices and perform a total score (Shao et al., 2019; Pan et al., 2021a; Pan et al., 2021c). This paper uses this method to evaluate unconventional outside left-turn lane schemes under different traffic volumes.
The remaining sections of the paper are organized as follows. Section 2 reviews the relevant literature. Section 3 conducts the problem statement and describes the case data collection. Section 4 models, calibrates, and analyzes the safety of intersections with different unconventional outside left-turn lane settings locations. In Section 5, sensitivity analysis is conducted for four schemes with different traffic volumes. Section 6 presents the EWM and uses it for the comprehensive evaluation of the four schemes and calculates and describes the final selection matrix. Finally, the conclusions are drawn in Section 7. Figure 2 depicts the paper’s outline and the specific content of the proposed model.
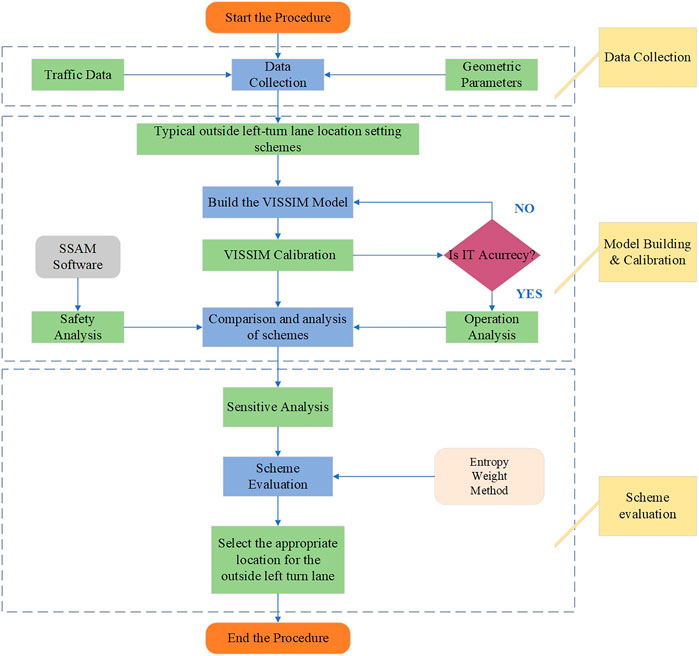
FIGURE 2. The flowchart of the evaluation and analysis model based on EWM for design process.
2 Literature review
2.1 Unconventional outside left-turn lane
Although unconventional outside left-turn lanes have been widely used in urban areas in China, guidance and studies on the design of such outside left-turn lanes are still scarce. Liu et al. (2011) compared the turning speeds and saturation flow rates of left-turning vehicles in conventional inside left-turn lanes and unconventional outside left-turn lanes by analyzing traffic data from five unconventional outside left-turn lane design intersections. It was found that the left-turn speeds of large buses in the unconventional outside left-turn lane are significantly higher than those of turning vehicles in the inside left-turn lane. However, the higher turning speed did not result in higher left-turn capacity, and the saturation flow rate of the unconventional outside left-turn lane was relatively low compared to the conventional inside left-turn lane.
In a follow-up study by Liu et al. (2013), factors influencing drivers’ choice of unconventional outside left-turn lanes were evaluated. A binary logit model was developed to analyze the factors of drivers’ left-turn lane choice quantitatively. The study’s results showed that the probability of drivers choosing the unconventional outside left-turn lane increased with increasing traffic volume on the main road and queue length in the inside left-turn lane but decreased with increasing distance from the upstream right-side slip road to the intersection. In addition, large buses and vehicles from the upstream right-side side street are more likely to choose the unconventional outside left-turn lane for left-turns. Finally, based on the results of the data analysis, Liu et al. (2013) proposed a judgment procedure for determining whether a signalized intersection with specified traffic conditions and geometric characteristics requires an unconventional outside left-turn lane.
Guo et al. (2016) evaluated the impact of installing unconventional left-turn lanes at signalized intersections on traffic safety using a video-based automatic traffic conflict technique. The study detected traffic conflicts and calculated collision times by analyzing the positions of vehicles at different spaces and times. Moreover, the researchers compared the frequency and severity of conflicts between left-turning vehicles in the inner left-turn lane and the unconventional outside left-turn lane. It was found that the unconventional left-turn lane setup would cause more traffic conflicts and higher conflict severity than the conventional signalized intersection left-turn lane.
Zhu et al. (2019) conducted data collection for signal intersections with unconventional outside left-turn lanes. They proposed a safe distance range between turning vehicles in the inside left-turn lane and the outside left-turn lane based on the analysis of mutual interference between vehicles in the inside turning lane and the outside left-turn lane and the quantitative model of force and relative position. Finally, the study developed a method for setting the left-turn vehicle guidelines in unconventional outside left-turn lane intersections.
2.2 Entropy weight method
The entropy weight method (EWM) is a comprehensive evaluation method in which the weights of different indices are calculated and scored (Abhishek et al., 2017). EWM is a common method for studying the search for optimal solutions in complex situations and is often applied to compare multiple solutions comprehensively. In this method, it is possible to avoid the subjectivity and one-sidedness of evaluation results and achieve a comprehensive ranking of multiple solutions by selecting multiple indices and determining the weights based on entropy theory (Han and Gao, 2014; Liu et al., 2015; He et al., 2020).
With the introduction and deepening of the sustainable development concept, EWM has become increasingly popular in environmental protection (Chen et al., 2018; Lamas et al., 2020; Marković et al., 2020) and social development (Feng et al., 2014; Chi and Qian, 2015). Typically, a sustainable development potential model through EWM can evaluate whether a country or place is sustainable and obtain key indicators that affect sustainable development by selecting factors such as social benefits, ecological benefits, and energy access. In addition, EWM has been widely used in statistics (Dávalos et al., 2019), finance (Zhao et al., 2019), and medicine (Lu et al., 2020).
In recent years, the entropy method has also been increasingly applied in traffic engineering. Tu et al. (2011) applied entropy-based TOPIS for safety evaluation in urban traffic signal systems and obtained safety sequence preferences for all failure modes. Pan et al. (2021a), Pan et al. (2021c) simulated different traffic models with VISSIM software and evaluated them by EWM to assess various traffic models in different traffic environments. Shao et al. (2020) evaluated two improvement schemes for non-linear intersections affected by work zones based on the entropy value method and derived the applicability under different conditions.
The literature review shows that the current research mainly focuses on the influence of unconventional left-turn lane settings on the traffic operation of signalized intersections and drivers’ choice of the left-turn lane. On the other hand, there is little research on the location of unconventional left-turn lane settings. In practice, there is a lack of regulations and guidance on the location of unconventional left-turn lane settings in signalized intersections. In addition, EWM, as one of the schemes of multi-indicator evaluation, has been fully applied and validated in the transportation field. Therefore, in this paper, four typical outside left-turn lane setting locations are studied and analyzed, several indices are selected, and the considered schemes are comprehensively evaluated using EWM.
3 Problem statement and data collection
3.1 Problem statement
Typically, the left-turn lane of a signalized intersection is located on the left side of the intersection’s through lanes. However, in many urban areas, an unconventional design of signalized intersections with the left-turn lane on the right side of the through lane is widely used because the urban interchange ramp terminal or the right-side side street of the urban arterial is too close to the intersection. This design simplifies operations for drivers of left-turning vehicles coming from the terminal of urban interchange ramps or upstream side streets and reduces conflicts between the left-turning vehicles and the traffic. On the other hand, the design of unconventional outside left-turn lanes is not consistent with driver expectations, which may cause confusion and traffic safety hazards for drivers on the road.
Xi’an, the capital city of Shaanxi Province, is one of the most populous cities in China. With the continuous increase in population and urban motor vehicle ownership in Xi’an, the major arterial roads and intersections often suffer from serious congestion problems during the morning and evening peak hours. As a result, signalized intersections with unconventional outside left-turn lane designs are increasingly used. Therefore, this paper takes a typical intersection with an unconventional outside left-turn lane design in Xi’an city as an example to study the influence of different outside left-turn lane locations on traffic and give a calculation method that guides the selection of a suitable solution. The intersection is located at the point between two major urban arterials, Kechuang eighth Road and Tai Bai South Road, as shown in Figure 3.
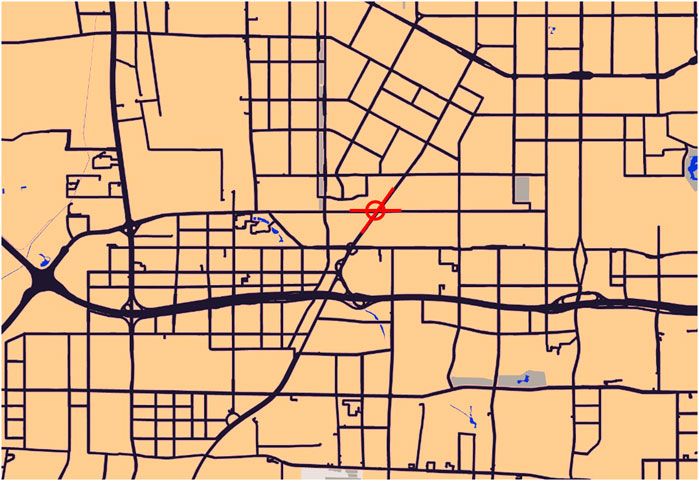
FIGURE 3. The investigated intersection location scheme. The investigation section intersection is a four-legged intersection with unconventional outside left-turn lanes, located in the center of Xi’an.
The number of lanes at this intersection is four in the westbound entrance, three in the eastbound entrance, which tapers to five lanes near the intersection, five in the northbound entrance, which tapers to six lanes near the intersection, and four in the southbound entrance, which tapers to six lanes near the intersection. The southbound unconventional outside left-turn lane is set on the fourth lane, and the rest of the directions are conventional left-turn lanes. There is an unsignalized side street on the right-side 210 m upstream of the intersection’s southbound entrance. The intersection has a speed limit of 60 km/h for both the North-South and East-West major arterials, and both are set up with protected left-turn phases (Figure 4).
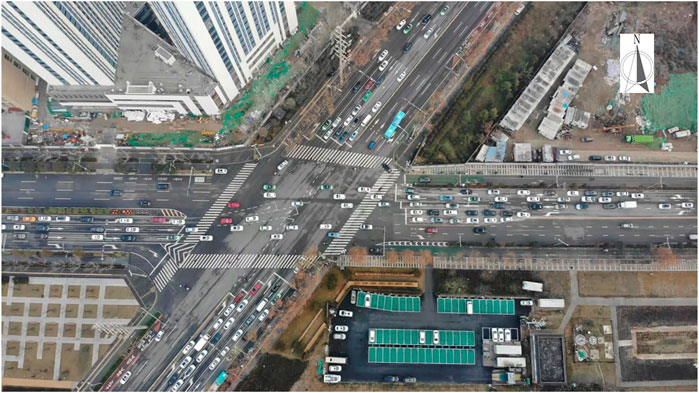
FIGURE 4. The present situation of the signalized intersection. An unconventional outside left-turn lane is located in the fourth lane of the South entrance direction of the intersection. Coordinates: 108.896818, 34.206657.
3.2 Data collection
Typically, real measurements of traffic data are required for model calibration and microsimulation in VISSIM. Based on AutoNaviTraffic’s statistical data, the traffic congestion index in Xi’an is at its peak from 7 to 9 a.m. and 5 to 7 p.m. (Big-data, 2020). The traffic congestion index is a conceptual metric that comprehensively reflects the road network’s smoothness or congestion, and the higher its value indicates, the more serious traffic congestion (Wang et al., 2018). Therefore, the corresponding peak hours were selected to collect traffic data at the intersection of Kechuang eighth Road and Tai Bai South Road. During the data collection date, the weather and road conditions were good, and there were no construction areas or traffic accidents.
The method of collecting traffic volume in this paper mainly adopts the method of aerial photography by UAV, and the collected data include:
1. The traffic volume in each direction at level crossings during peak hours.
2. The type and proportion of vehicles turning at each entrance.
3. The intersection geometry and width of the entrance and exit lanes.
After data collection and processing, the morning peak hour intersection traffic volume was 6,457 veh/h, and the evening peak hour traffic volume was 7,616 veh/h. Thus, the evening peak hour traffic volume was chosen as a representative. Table 1 shows the evening peak hourly traffic volume data.

TABLE 1. Collected data during one peak hour (6:30 p.m.–7:30 p.m.) on 3.12.2021.
The collected traffic data show the following characteristics.
1. The signalized intersection has an obvious primary and secondary relationship between the two arterial roads, and the traffic volume in the North-South direction is significantly larger than that in the East-West direction.
2. The traffic volumes in the east-west direction at the signalized intersection are basically the same, and the traffic volumes in the north-south direction are basically the same.
3. The signalized intersection and the north direction traffic left-turn ratio (9.87%) is small, and the remaining direction traffic flow left-turn ratio is about 20%.
4. Most of the vehicles from the side streets are left-turning vehicles.
5. The vehicles from the southbound arterial road to the side streets are all classified as passenger cars.
6. The proportion of new energy vehicles in Xi’an is not high (Feng et al., 2014). Therefore, the vehicles studied in this paper are only conventional vehicles.
4 Establishment and simulation of the model in VISSIM
4.1 Establishing the model
VISSIM is one of the most commonly used simulation software in traffic engineering analysis and research. The accuracy of this software has been validated in previous studies (Li et al., 2020; Pan et al., 2021a; Pan et al., 2021c). Therefore, to investigate the effects of different unconventional outside left-turn lane locations on traffic operations, four different setup locations, such as the middle lane, the inner lane, the sub-outermost lane, and the outermost lane, are considered in this study based on the measured data. Figure 5 shows the model layout of each scheme. Scheme 1 is the original design of the signal intersection, where the outside left-turn lane is set at the fourth lane of the South entrance direction of the intersection. The outside left-turn lane in Scheme 2 is set at the inner lane of the through lanes’ left side, representing a traditional left-turn lane setting. The outside left-turn lane in Scheme 3 is set at the sub-outside lane, which is a common unconventional way of setting. Finally, Scheme 4 sets the outside left-turn lane on the rightmost side of all lanes, which is the opposite of the conventional left-turn lane setting.
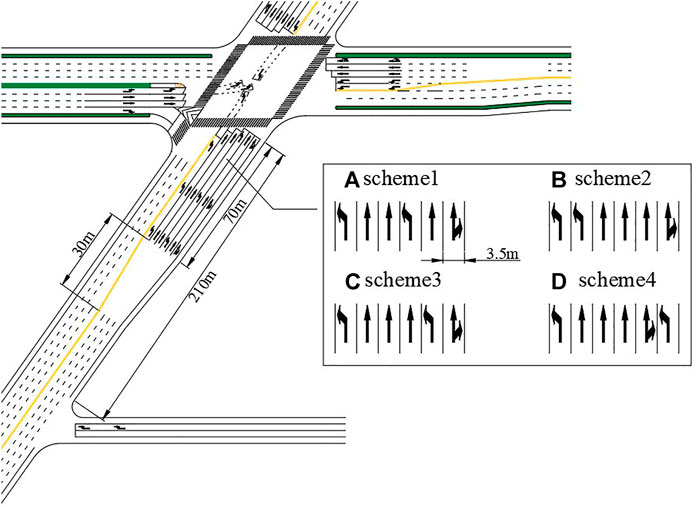
FIGURE 5. Typical outside left-turn lane location setting scheme. (A) Scheme1: The outside left-turn lane is located in the middle lane, (B) Scheme2: The outer left-turn lane is located in the inner lane, (C) Scheme3: The outer left-turn lane is located in the sub-outermost lane, (D) Scheme4: The outer left-turn lane is located in the outermost lane.
The Wiedemann74 following model was selected in VISSIM7 to simulate the four schemes (AG, 2018). Since the intersection is located within the city, most parameters were set to default values when conducting the simulation. However, to obtain more accurate simulation results, some lane change parameters were fixed according to the field survey and suggestions from the local traffic department to ensure that the driving behavior during the simulation is in line with Chinese drivers, as follows:
1. The maximum deceleration (trailing vehicle) is set to −4 m/s2.
2. The accepted deceleration (own and trailing vehicle) is set to 2 m/s2.
3. The safety-distance reduction factor is set to 0.5.
4. The maximum deceleration for the cooperative is set to −4 m/s2.
4.2 Calibration of the simulation model
In order to ensure the simulation results’ reliability, the model parameters were calibrated so that the outcomes were verified against the actual traffic parameters. This study follows the common model calibration procedure used in previous investigations (Shao et al., 2019; Pan et al., 2021a; Pan et al., 2021b) to calibrate the VISSIM simulation model using capacity indicators. The absolute percentage error (MAPE) between the measured capacity in each traffic direction at the intersection and the capacity in each direction in the simulation model is calculated, and the model is considered valid when the MAPE is less than 15%. The MAPE was calculated using Eq. 1.
where i denotes the traffic flow, n denotes the total number of traffic flows, Csi denotes the simulated capacity of VISSIM (veh/h), and Cci denotes the collected capacity (veh/h).
The calculation results of the MAPE are shown in Table 2. It can be seen that the total error between the VISSIM simulation model and the actual traffic is −2.7%, which indicates, as discussed in previous studies (Shao et al., 2019; Pan et al., 2021a; Pan et al., 2021b), that the proposed model meets the accuracy requirements of the actual project.
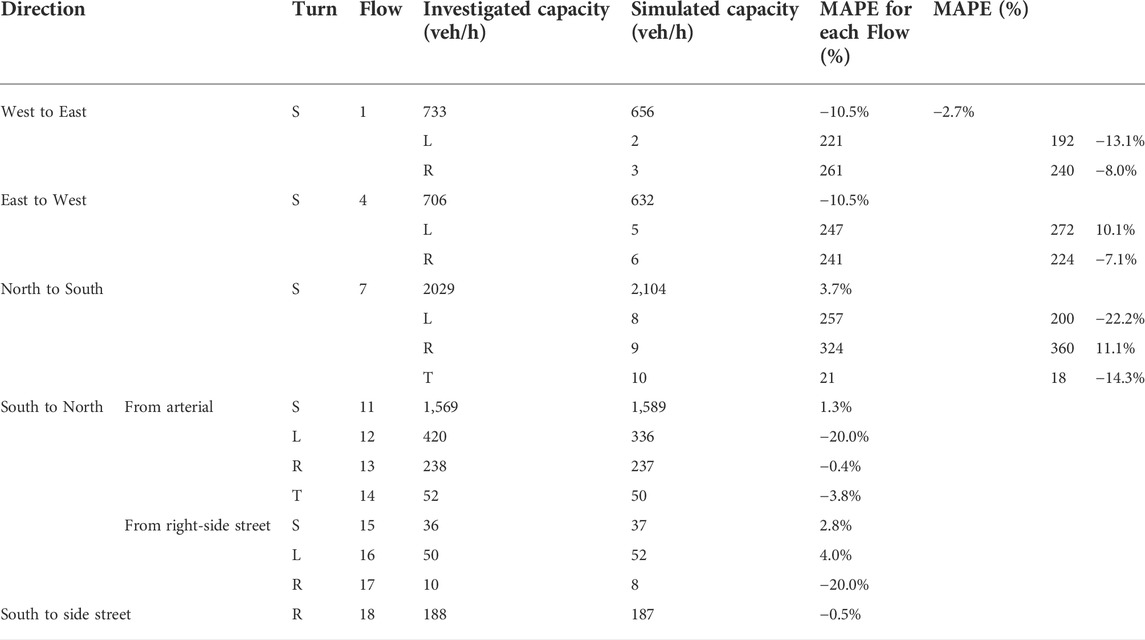
TABLE 2. VISSIM simulation calibration results with collected data.
4.3 Simulation results
Since the outside left-turn lane at different setup locations of this signal intersection only affects the traffic operation in the South direction, the traffic operation efficiency in the South direction was evaluated for the different schemes. Usually, delays and stops are the most commonly used indices to evaluate the intersection operation efficiency (Henclewood et al., 2017). However, in this paper, the vehicle queue length and the number of vehicles are also used as evaluation indices for a more comprehensive evaluation of the schemes. In addition, based on the consideration of environmental protection, it is necessary to select emission-related parameters in VISSIM as the evaluation indices of the schemes. Since all emission indices have the same trend in VISSIM, CO emission is selected as an evaluation index in this paper (AG, 2018).
Table 3 shows the results of the four schemes’ evaluations under the actual traffic volume. It can be seen that under the current traffic volume, the number of Scheme 1 vehicles is slightly higher than other schemes, whereas its performance in the remaining indices is not as good as the other schemes, indicating that the outside left-turn lane is located in the middle of the straight lane, which is more likely to cause confusion among drivers of through traffic and cause traffic congestion. On the other hand, Schemes 2 and 4 do not differ much in the performance of each index, which may be due to the fact that the through lanes of both schemes are located in the middle lane and have similar vehicle operating characteristics. Finally, Scheme 3 performs better than other schemes in all indices with a slightly lower number of vehicles. Since the four models are simulated under the current traffic volume, and each scheme shows various advantages and disadvantages among different indices, a more comprehensive analysis is required to judge the cases’ performance accurately.
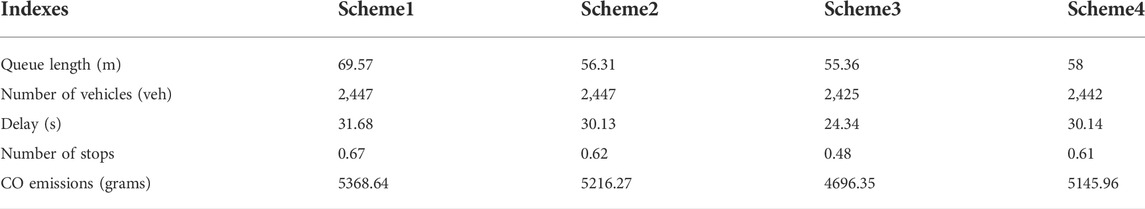
TABLE 3. Simulation results of four schemes.
4.4 Safety evaluation
In addition to the traffic operations evaluation, a complete simulation analysis should include a safety assessment. The Surrogate Safety Assessment Model (SSAM) is a simulation and analysis program proposed by the Federal Highway Administration (FHWA) for predicting road safety before traffic accidents (Lili and Rahul, 2008). The program validity has been fully checked in previous studies (Lili and Rahul, 2008; Al-Ghandour et al., 2011; Guo et al., 2019). Moreover, the SSAM is compatible with the vehicle trajectory files obtained from VISSIM simulations.
In this paper, the vehicle trajectory files generated from the simulations of the four scenarios are input into the SSAM software based on previous studies (Pan et al., 2021a; Pan et al., 2021b). The conflict threshold of the maximum time to collision (TTC) is set to 1.5 s (i.e., the traffic conflict is considered to exist when the ratio of the distance between two vehicles and the relative speed of two vehicles is less than 1.5 s). The post-encroachment time (PET) threshold is set to 5 s, which means that the traffic conflict is considered to exist when the time interval between the front vehicle leaving the designated area and the rear vehicle entering the same area is less than 5 s. Moreover, based on the angle between the bodies of the two vehicles when the conflict occurs, the conflicts are classified into rear-end conflicts (0°–30°), lane change conflicts (30°–85°), and crossing conflicts (85°–180°) (Lili and Rahul, 2008). Based on the judging criteria, the conflict analysis results of the four schemes are listed in Table 4, and the locations of the vehicles in conflict are shown in Figure 6.
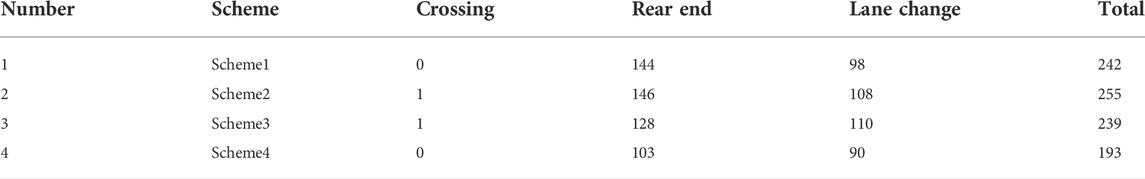
TABLE 4. Safety analysis of four simulations by SSAM.
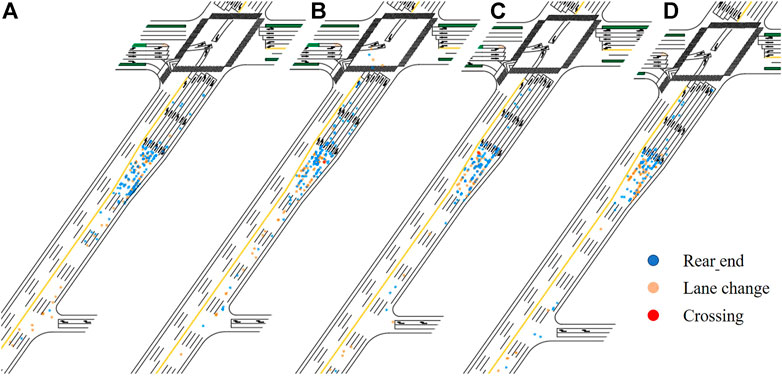
FIGURE 6. Conflict location distribution. (A) Scheme1, (B) scheme2, (C) scheme3, (D) scheme4.
The results show that when the side street on the urban arterial’s right side is closer to the intersection, the unconventional outer left-turn lane setting schemes (Scheme 1, Scheme 3, and Scheme 4) have fewer conflicts than the conventional scheme (Scheme 2) with the left-turn lane being set on the left side. Moreover, the closer the unconventional left-turn lane location is to the outside, the more obvious the reduction in the number of conflicts. In addition, the conflict location distribution diagram in Figure 8 shows that the conflict location of Scheme 1 is concentrated in the middle lanes. Moreover, the conflict location of Scheme 2 is concentrated in the left-side lanes, the turning vehicles in the inside and outside left-turn lanes conflict, and the conflict range is also larger compared with other schemes. The conflict point locations of Schemes 3 and 4 are evenly distributed with a small range.
5 Sensitivity analysis of operational performance
5.1 Sensitivity factor determination and different traffic scenarios establishment
The congestion at signalized intersections is mainly affected by the traffic volume, and the analysis in the previous section only focused on the performance of each scheme during the peak hour, which cannot reflect other traffic conditions. When the traffic volume of urban arterial or side streets decreases, the interference between the through traffic and the left-turning vehicles on the side streets decreases, and the advantage of the unconventionally set outside left-turn lane reduces. Conversely, when the traffic volume increases, the conflict between the left-turning vehicles and the through traffic increases, and the location of the outside left-turn lane will have more influence on the traffic operation. Therefore, it is necessary to select the traffic volume of the urban major arterial and side streets as a sensitive factor to study the influence of the location of outside left-turn lane settings on traffic under different traffic conditions.
Based on the collected traffic data and the capacity manual, the maximum service traffic volume for the current design speed is taken as 3,560 veh/h for the four-lane arterial road and 180 veh/h for the single-lane side street. Therefore, in the sensitivity analysis, the range of traffic volume for the arterial road is from 0.3 V/C to the maximum traffic volume of 1.0 V/C, while the side street traffic volume is from 1/6 V/C to the maximum traffic volume of 1.0 V/C. The traffic in the sensitivity analysis combinations is shown in Table 5. Since the setting of the outside left-turn lane at this intersection only affects the traffic operation in the South direction, the entrance traffic volumes in the rest of the intersection directions are kept constant throughout the sensitivity analysis. The signal timing for different traffic combinations was obtained by SYNCHRO7 software (Sayed et al., 2006; Pan et al., 2021a).
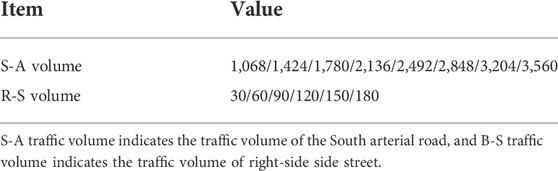
TABLE 5. VISSIM volume in sensitivity analysis.
5.2 Sensitivity analysis
Five indices (queue length, number of vehicles, delays, number of stops, and CO emissions) from the VISSIM simulation were selected as operational indices in the sensitivity analysis, and the number of conflicts in SSAM was selected as a safety index. Figures 7–9 show the degree of superiority of Schemes 2, 3, and 4 with respect to the control case (Scheme 1) at the intersection in terms of six indices for 48 traffic combinations, with positive indicating better relative to the original scheme and negative indicating inferior to the original scheme.
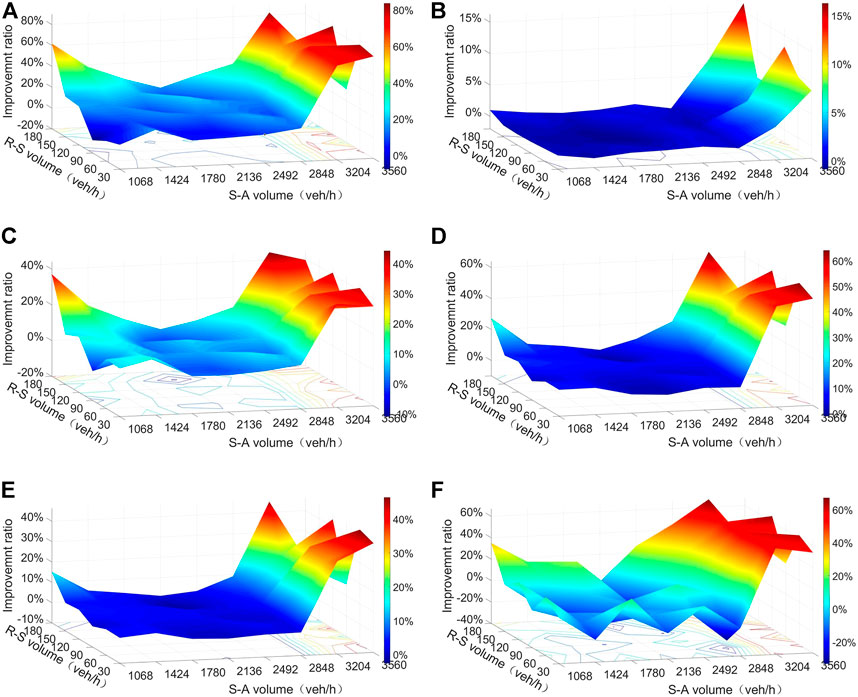
FIGURE 7. Improvement ratio of scheme2, compared with scheme1. (A) Queue length, (B) number of vehicles, (C) delay, (D) number of stops, (E) CO emissions, (F) number of conflicts.
As shown in Figure 7A, in terms of queue length, when the traffic volume on the arterial road is high, Scheme 2 performs better than Scheme 1 at the intersection, with a maximum improvement of 82.6%, and when the traffic volume on the arterial road tends to the median, the two schemes achieve similar results with less improvement. On the other hand, when the traffic volume on the arterial is low, the degree of improvement increases with the increase of traffic volume on the side streets.
Figures 7C–E show the degree of improvement of Scheme 2 compared to Scheme 1 in terms of delay, number of stops, and CO emissions, respectively, and the trend is similar to that of queue length. Moreover, when the traffic volume on the arterial road is high, Scheme 2 performs significantly better than Scheme 1, with the maximum improvement reaching 44.3%, 64.1%, and 45.0%, for the delay, the number of stops, and CO emissions, respectively, and when the traffic volume on the arterial road tends to the median value, the two perform similarly. Figure 7B shows the performance of Scheme 2 relative to Scheme 1 in terms of the number of vehicles. It can be seen that the two perform similarly overall, but when the traffic volume on the arterial road is larger (greater than 0.8 V/C), Scheme 2 has a significant advantage over Scheme 1, and the advantage becomes more obvious as the traffic volume on the side streets increases, with a maximum improvement of 16.2%.
Figure 7F compares the number of conflicts between the two schemes. It can be seen that there is no obvious pattern in their changes. On the whole, when the traffic volume of the arterial road is larger, Scheme 2 is better compared to Scheme 1, and the maximum degree of improvement is 67.2%. When the traffic volume on the arterial road tends to the median, Scheme 2 is inferior to Scheme 1, with the worst increase of 33% in the number of conflicts.
The sensitivity analysis results show that the unconventional scheme with the outside left-turn lane in the middle of the through lanes (Scheme 1) does not perform well compared to the conventional outside left-turn lane setting scheme (Scheme 2) under most traffic conditions. This shows that although the outside left-turn lane set in the middle of the through lanes can facilitate the turning of left-turning vehicles from the side street, the negative impact on the traffic is greater than its positive impact, especially when the traffic volume of the arterial road is high (greater than 0.8 V/C).
Figure 8A compares Scheme 3 and Scheme 1. It can be seen that under most traffic combinations, Scheme 3 performs better than scheme 1, with a maximum increase of 81.2%. However, when the traffic volume of the arterial road is small (less than 0.4 V/C), Scheme 3 performs significantly worse than Scheme 1, and the most unfavorable will increase the queue length by three times.
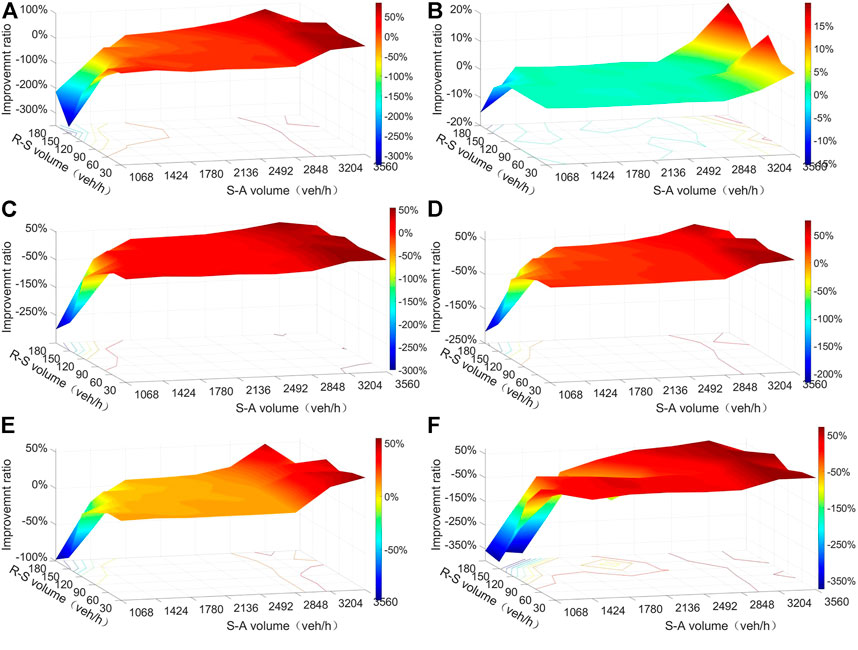
FIGURE 8. Improvement ratio of scheme3, compared with scheme1. (A) Queue length, (B) number of vehicles, (C) delay, (D) number of stops, (E) CO emissions, (F) number of conflicts.
Figures 8C–F indicate the improvement degree of Scheme 3 relative to the original Scheme 1 in the four indices of delay, number of stops, CO emissions, and number of conflicts, respectively, and the trend is similar to that of queue length. Under most traffic combinations, Scheme 3 performs well with Scheme 1, and the maximum improvement degree can reach 53.0%, 70.2%, 54.7%, and 71.0%, respectively, but when the traffic volume on the arterial road is low, the performance is significantly worse than that of Scheme 1.
Figure 8B compares the number of vehicles between the two schemes. It can be seen that Scheme 3 is similar to Scheme 1 under most traffic volume. Nevertheless, when the traffic volume of the arterial road is large (greater than 0.6 V/C), Scheme 3 has obvious advantages over Scheme 1 with an increase in the traffic volume of the side street and can increase the number of vehicles by up to 20.0%.
The sensitivity results show that the unconventional left-turn lane set in the sub-outermost lane (Scheme 3) has an advantage over the middle lane (Scheme 1) for most traffic combinations, but when the traffic volume on the arterial road is low and the traffic volume on the side street is high, the performance is significantly inferior to that of Scheme 1. This can be attributed to the fact that when the queue length of left-turning vehicles in the sub-outside lane is long, it will form a barrier to interfere with right-turning vehicles changing lanes from the middle lane to the outermost lane, and the longer the queue length in the sub-outermost left-turning lane, the more obvious the interference.
Figures 9A,C–E show the performance of Scheme 4 relative to Scheme 1 in terms of four indices of queue length, delay, number of stops, and CO emission under various traffic combinations. As can be seen from the figure, the difference in performance between the two schemes is not significant under most traffic combinations. When the traffic volume on the arterial road is large (greater than 0.8 V/C), Scheme 4 has a clear advantage over Scheme 1, and the advantage becomes more obvious as the traffic volume on the arterial road increases.
FIGURE 9. Improvement ratio of scheme4, compared with scheme1. (A) Queue length, (B) number of vehicles, (C) delay, (D) number of stops, (E) CO emissions, (F) number of conflicts.
Figure 9B compares Scheme 4 and Scheme 1 in terms of the number of vehicles. It can be seen that when the traffic volume on the arterial road is greater than 0.6 V/C, Scheme 4 shows a maximum increase of 25.4% in the traffic volume compared to Scheme 1. Figure 9F shows the comparison of the two schemes in terms of the number of conflicts. It can be observed that there no obvious pattern in their changes, but overall, Scheme 4 is better relative to Scheme 1, with a maximum improvement of 77.8%, and under certain traffic combinations, Scheme 2 is inferior to Scheme 1, with a 60% increase in the number of conflicts.
The sensitivity results show that there is no significant advantage or disadvantage of setting the unconventional outside left-turn lane in the outermost lane (Scheme 4) versus setting it in the middle lane (Scheme 1) for most traffic combinations, but when the traffic volume on the main road is high (greater than 0.8 V/C), setting the outside left-turn lane in the outermost lane has a considerable advantage relative to setting it in the middle lane.
6 Analysis of the results based on the EWM method
The performance of different outside left-turn lane setting schemes with respect to the original case at this signalized intersection under 48 traffic combinations is discussed through sensitivity analysis. The results show that each scheme exhibits its advantages in different indices under different traffic combinations. Therefore, a feasible approach is proposed to obtain the optimal solution for each set of traffic volumes. The six evaluation indices under each traffic volume scenario are weighted, and the solution with the highest score is calculated as the optimal solution under that traffic combination. The EWM calculates the weights and scores of the six indices.
6.1 Calculation of weighting of indices
In the sensitivity analysis, four outside left-turn lane location schemes were simulated with 48 traffic combinations, and six indices were selected for the analysis. Thus, for each set of traffic combinations, a set of simulation results was obtained for the traffic organization schemes.
First, the combination of simulation results for each index under the 48 traffic combinations is transposed into a matrix Xi with 48 rows and six columns, as shown in matrix Xi Eq. 2:
where i denotes the scheme’s number, i.e., i = 1, 2, 3, 4, n represents 48 traffic combinations (n = 1–48), D denotes delay, Q denotes queue length, S denotes the number of stops, V denotes the number of vehicles, E denotes CO emissions, and C denotes the number of conflicts.
For example, the simulation results for Scheme 1 with 48 traffic combinations are shown in matrix X1.
In the matrix X1,
Second, the four matrices, X1, X2, X3, and X4, are split and reorganized to compare the differences between the schemes over 48 traffic combinations. In each traffic combination, the simulation results of the four schemes are combined into matrix An Eq. 5.
where X1(n, ·) is the nth row of X1, which represents the simulation result of Scheme 1 under the nth traffic combination.
Thus, An is a matrix of four rows and six columns:
Third, the weights of each index are calculated. For each traffic combination, the weights of the six indices are not the same. Accordingly, each An is calculated once, making up a total of 48 sets of weights. The EWM is used to calculate the weights of the six indices, and the calculation process is as follows:
(1) The matrix M is developed, where M denotes the An matrix, and each element in An is denoted by mjk for which j denotes the jth scheme, e denotes the total number of schemes (e = 4), k denotes the kth evaluation index, and f denotes the total number of evaluation indices (f = 6).
In the matrix M,
The six indices selected in the sensitivity analysis (delay, queue length, number of stops, number of vehicles, CO emissions, and number of conflicts) are denoted by k = 1–6, respectively. Among these six indicators, except for the number of vehicles, the smaller the value of the index, the better the scheme. Therefore, to unify the evaluation methods, the six indices need to be normalized as shown in Eq. 9.
The processed matrix M′ can be obtained as follows:
where m1′ = m4.
(2) These six indices have different units of measurement. Thus, they need to be standardized to calculate the composite index (i.e., the absolute indices are converted into relative indices). The formula for the standardization process is as follows:
The newly obtained elements are combined into the matrix M''.
(3) The weight of index k at the nth traffic combination is calculated as follows:
The entropy value of index k is calculated as follows:
where λ = 1/ln(n) and satisfies ek ≥ 0.
The redundancy of information entropy is then calculated as follows:
The weights for each index are calculated using Eq. 15.
The weights of all evaluation indices in the nth traffic combination are denoted as:
Finally, the weights of the 48 traffic combinations are combined in matrix form as follows:
6.2 Evaluation of schemes
Based on the weights of the six indices calculated in the previous section, the design schemes under the 48 traffic combinations are scored together. For the nth group of traffic combinations, the scores are determined as follows:
(1) The ratio of the jth scheme value to the values of all schemes in the simulation results of the kth index is calculated as follows:
(2) The score of index k in scheme j is defined as:
(3) The total score of the jth scheme is calculated using:
(4) The scores of the four schemes under the nth traffic combination are recorded in Zn as follows:
Finally, the scores of the schemes for all traffic combinations are summarized in matrix Z.
A comparison of the scores for each scheme is shown in Figure 10. It can be seen that when the traffic volume of the arterial road is close to the maximum service value and the side street traffic is also high, Scheme 4 has the highest overall score, followed by Scheme 3, and Scheme 1 has almost no score. This indicates that when the side street on the right side of the urban arterial road is close to the intersection and the road traffic volume is high, the setting of an unconventional outside left-turn lane can facilitate the intersection traffic operation. In addition, the unconventional outside left-turn lane has a negative impact, with its peak occurring when the outside left-turn lane is located in the middle of the through lanes.
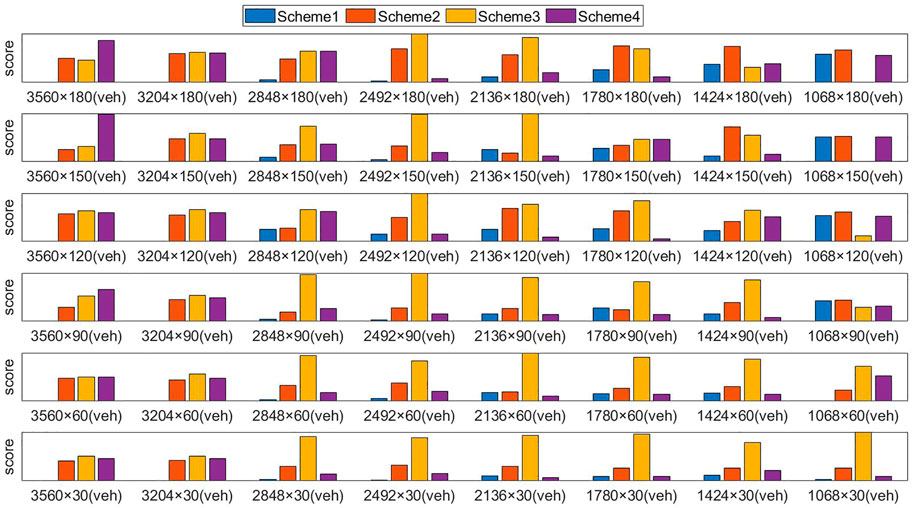
FIGURE 10. Comparison of the scores of each scheme under different traffic combinations.
Furthermore, Scheme 3 has the highest overall score for most traffic combinations, indicating that the unconventional outside left-turn lane set in the sub-outermost lane brings convenience to side-street turning vehicles and facilitates intersection traffic operations while it brings the least negative impact.
Finally, when the traffic volume on the arterial road is low, and that on the side streets is high, Scheme 2 has a higher score. This is because when the traffic volume on the arterial road is low, the turning traffic on the side streets is also affected slightly by the traffic on the arterial road, and the left-turn lane setting on the left is more in line with drivers’ psychological expectations.
Overall, Scheme 4 in the upper left corner of the figure has the highest score, indicating that the unconventional outside left-turn lane is located in the outermost lane to accommodate the situation where the traffic volume of both the arterial road and the side street is high. Scheme 3 has the highest score for most options, meaning that the unconventional outside left-turn lane is located in the sub-outermost lane for most traffic conditions. Scheme 2 in the upper right corner of the figure has the highest score, which indicates that the conventional outside left-turn lane is suitable for the case of low traffic volume on the arterial road.
7 Conclusion
Urban signal intersections, as important nodes of urban road networks, often face serious congestion problems. In the built-up areas of some cities, signal intersections are usually close to the upstream right-side driveways or side streets, and vehicles from the upstream right-side driveways or side streets merge into the inner lane for left-turns in the limited space. As the traffic volume increases, it may cause serious traffic congestion and increase vehicle emissions. Therefore, to relieve the traffic pressure in this situation, an unconventional design where the outside left-turn lane is located on the right side of the through lanes was developed at the signalized intersection. This study uses a unique multi-objective decision-making approach to evaluate the impact of unconventional outside left-turn lane setting locations on signalized intersection traffic operations. In order to ensure the accuracy and comprehensiveness of the results, five typical operational efficiency indices with one safety Index were selected for simulation modeling. Then, the schemes with different outside left-turn lane locations were evaluated by the EWM. The following conclusions were drawn based on the data analysis results.
1. There are differences in vehicle emissions at intersections with different locations of outside left-turn lane designs, up to 54.7%.
2. When the side street is close to the signal intersection, the design of an unconventional outside left-turn lane is beneficial to the traffic operation of the signal intersection. However, this design negatively impacts the intersection’s traffic operation due to its interference with the through traffic, and the closer the location of the unconventional outside left-turn lane is to the middle lanes, the more serious the negative impact is.
3. The EWM analysis results show that the unconventional design with the outside left-turn lane in the sub-outer lane is suitable for most traffic conditions, whereas that in the outermost lane is suitable for higher traffic volumes. In addition, the conventional design with the outside left-turn lane on the through lane’s left side is suitable for lower traffic volumes.
4. The conventional outside left-turn approach shows advantages at lower traffic volumes, proving that the unconventional left-turn lane design is not applicable when there is no side street traffic interference.
The study provides quantitative results on the impact of unconventional design on traffic operations for different outside left-turn lane locations at different traffic volumes. The study results can directly reflect the advantages and disadvantages of the outside left-turn lane design at different locations. The entropy evaluation method model developed in this study can quantify the impact of outside left-turn lane locations on intersection traffic operations at different traffic volumes. Indeed, the model can directly help traffic engineers to decide when and where to locate the outside left-turn lane at an intersection. For example, when traffic volumes are high, and the overall score of the design with the outside left-turn lane in the sub-outermost lane is higher than that of the conventional design, then an outside left-turn lane in the sub-outermost lane of the intersection can be considered.
The unconventional outside left-turn lane design has been used quite extensively in China. On the other hand, it is believed that this design can apply to other countries or regions. In these countries, signalized intersections are located in built-up areas in urban centers where widening or modification is difficult. Moreover, the distance between the signal intersection and the upstream right lanes or side streets is small, and the conventional left-turn lane design may cause severe traffic congestion as the traffic volume in the city increases. In this case, setting up an outside left-turn lane at the signalized intersection to facilitate vehicles to make left-turns can be considered. Thus, it is possible to relieve traffic congestion, reduce vehicle emissions and promote smart city construction and sustainable development.
At present, studies on unconventional outside left-turn lane designs have focused on analyzing their safety performance, with little research and guidance on their setting locations. By modeling and analyzing the signal intersections of unconventional outside left-turn lane designs with different setting locations and comprehensive scoring, this study can help designers select outside left-turn lane design locations. The limitations of this study are mainly attributed to not considering the effect of different turning rate traffic, which may affect the final evaluation results. Furthermore, the distance of the signal intersection from the upstream right-side driveways or side streets was not taken into consideration. Thus, future studies should focus on extending the highlighted conclusion to account for these factors.
Data availability statement
The raw data supporting the conclusion of this article will be made available by the authors, without undue reservation.
Author contributions
Conceptualization, XL, CS, and BP; Methodology, XL and BP; Data collection, XL, CS, SY, and RZ; Formal analysis, XL and RZ; VISSIM simulation, CS and RZ; Visualization, SY and RZ; Writing—review and editing, RZ and CS.
Funding
This work was supported by scientific research program funded by Shaanxi provincial education department with file No. 21JK0908.
Acknowledgments
The authors would like to acknowledge scientific research program funded by Shaanxi provincial education department for partially funding this work.
Conflict of interest
Author XL, CS, and SY are employed by the company Guangzhou Expressway Co., Ltd.
The remaining authors declare that the research was conducted in the absence of any commercial or financial relationships that could be construed as a potential conflict of interest.
Publisher’s note
All claims expressed in this article are solely those of the authors and do not necessarily represent those of their affiliated organizations, or those of the publisher, the editors and the reviewers. Any product that may be evaluated in this article, or claim that may be made by its manufacturer, is not guaranteed or endorsed by the publisher.
References
Abhishek, K., Bikash, S., Arvind, R., Deng, Y., He, X., Kumar, P., et al. (2017). A review of multi criteria decision making (MCDM) towards sustainable renewable energy development. Renew. Sustain. Energy Rev. 69, 596–609. doi:10.1016/j.rser.2016.11.191 |
Al-Ghandour, Majed, Schroeder, Bastian, Williams, Billy, and Rasdorf, W. J. (2011). Conflict models for single-lane roundabout slip lanes from microsimulation. Transp. Res. Rec. 2236, 92–101. doi:10.3141/2236-11 |
Big-data, A. T. (2020). Traffic analysis reports for major cities in China. Available: https://report.amap.com/share.do?id=a187b9ae753f219a01755470efdc6127.
Carter, D., Hummer, J. E., Foyle, R. S., and Phillips, S. (2005). Operational and safety effects of U-turns at signalized intersections. Transp. Res. Rec. 1912 (1912), 11–18. doi:10.1177/0361198105191200102 |
Chen, K., Zhao, J., Knoop, V. L., and Gao, X. (2020). Robust signal control of exit lanes for left-turn intersections with the consideration of traffic fluctuation. IEEE Access 8, 42071–42081. doi:10.1109/access.2020.2977134 |
Chen, W., Li, H., Hou, E., Wang, S., Wang, G., Panahi, M., et al. (2018). GIS-based groundwater potential analysis using novel ensemble weights-of-evidence with logistic regression and functional tree models. Sci. Total Environ. 634, 853–867. doi:10.1016/j.scitotenv.2018.04.055 | |
Chi, H., and Qian, J. (2015). The application of analytic hierarchy process and neural network in the sustainability analysis of country. New Jersey, United States: IEEE, 1308–1311.
Cieśla, M., and Orzech, P. (2019). Impact of alternative individual means of transport development on decisions of urban residents among travel planning. Autobusy Tech. Eksploat. Syst. Transp. 235 (12), 229–232.
Cruz-Piris, L., Lopez-Carmona, M. A., and Marsa-Maestre, I. (2019). Automated optimization of intersections using a genetic algorithm. IEEE Access 7, 15452–15468. doi:10.1109/access.2019.2895370 |
Dávalos, A., Jabloun, M., Ravier, P., and Buttelli, O. (2019). On the statistical properties of multiscale permutation entropy: Characterization of the estimator's variance. Entropy 21 (5), 450. doi:10.3390/e21050450 |
Esawey, M. E., and Sayed, T. (2011). Unconventional USC intersection corridors: Evaluation of potential implementation in doha, Qatar. J. Adv. Transp. 45 (1), 38–53. doi:10.1002/atr.131 |
Feng, H., Chen, X., Heck, P., and Miao, H. (2014). An entropy-perspective study on the sustainable development potential of tourism destination ecosystem in dunhuang, China. Sustainability 6 (12), 8980–9006. doi:10.3390/su6128980 |
Franklin, M., Yin, X., Urman, R., Fruin, S., and Mcconnell, R. (2019). Environmental factors affecting stress in children: Interrelationships between traffic-related noise, air pollution, and the built environment. Environ. Epidemiol. 3, 126–127. doi:10.1097/01.EE9.0000607128.42195.ce |
Gao, X., Zhao, J., and Wang, M. (2020). Modelling the saturation flow rate for continuous flow intersections based on field collected data. PLOS ONE 15, e0236922. doi:10.1371/journal.pone.0236922 | |
GliD ska, E. (2010). Place satisfaction as a component of city's image among its residents (in the light of student's opinion survey in BiaH" Çystok-the capital of North-Eastern Poland) %/Louvain-la-Neuve. European Regional Science Association (ERSA).
Guo, Y., Sayed, T., Zaki, M. H., and Liu, P. (2016). Safety evaluation of unconventional outside left-turn lane using automated traffic conflict techniques. Can. J. Civ. Eng. 43, 631–642. doi:10.1139/cjce-2015-0478 |
Guo, Y., Essa, M., Sayed, T., Haque, M. M., and Washington, S. (2019). A comparison between simulated and field-measured conflicts for safety assessment of signalized intersections in Australia. Transp. Res. Part C Emerg. Technol. 101, 96–110. doi:10.1016/j.trc.2019.02.009 |
Han, R., and Gao, X. K. (2014). Bidding decision based on the multi-objective weight gray target model. Appl. Mech. Mater. 638, 2397–2401. doi:10.4028/www.scientific.net/AMM.638-640.2397 |
He, S., Zhi, J., and Xiang, Z. (2020). Satisfaction evaluation of the passenger interface design of high-speed train based on G1-entropy weight method. Berlin, Germany: Springer, 110–117. |
Henclewood, D., Suh, W., Rodgers, M. O., Fujimoto, R., and Hunter, M. P. (2017). A calibration procedure for increasing the accuracy of microscopic traffic simulation models. Simulation 93 (1), 35–47. doi:10.1177/0037549716673723 |
Krzysztofi, M. (2016). The importance of automatic traffic lights time algorithms to reduce the negative impact of transport on the urban environment. Transp. Res. Procedia 16, 329–342. doi:10.1016/j.trpro.2016.11.032 |
Kurek, A., and Macioszek, E. (2021). Impact of parking maneuvers on the capacity of the inlets of intersections with traffic lights for road traffic conditions in Poland. Sustainability 14 (1), 432. doi:10.3390/su14010432 |
Lamas, M. I., Castrosantos, L., and Rodriguez, C. G. (2020). optimization of a multiple injection system in a marine diesel engine through a multiple-criteria decision-making approach. Mariane Sci. Eng. 8, 946. doi:10.3390/jmse8110946 |
Li, H., Huang, Z., Zou, X., Zheng, S., and Yang, Y. (2020). VISSIM-based simulation and analysis of upstream segments in ramp areas for optimizing vehicle group lane-changing behaviors. J. Adv. Transp. 2020, 1–11. doi:10.1155/2020/5983161 |
Lili, P., and Rahul, J. (2008). Surrogate safety assessment model (SSAM)-SOFTWARE USER MANUAL. Washiton, DC, USA: Federal Highway Administration.
Liu, D. X., Zhang, J. H., and Cao, B. (2015). Assessment on power system black-start schemes based on entropy-weighted and improved analytic hierarchy process algorithm. Trans Tech Publ, 651–656.
Liu, P., Hu, F., and Lu, J. J. (2007). Operational effects of right turns followed by U-turns at signalized intersections as alternatives to direct left-turns from driveways. Adv. Transp. Stud. 11.
Liu, P., Wan, J., Wang, W., and Li, Z. (2011). Evaluating the impacts of unconventional outside left-turn lane design on traffic operations at signalized intersections. Transp. Res. Rec. 2257 (1), 62–70. doi:10.3141/2257-07 |
Liu, P., Xu, C., Wang, W., and Wan, J. (2013). Identifying factors affecting drivers' selection of unconventional outside left-turn lanes at signallised intersections. IET Intell. Transp. Syst. 7 (4), 396–403. doi:10.1049/iet-its.2011.0229 |
Lu, S., Tang, J., Liu, F., Qin, S., Chen, L., and Lei, C. (2020). Analysis and processing of misdiagnosis data for depression based on modified entropy weight method. E3S Web Conf. 214 (5), 03033. doi:10.1051/e3sconf/202021403033 |
Map, B. (2021). China urban transport report. Available: https://jiaotong.baidu.com/cms/reports/traffic/2020annualtrafficreport/index.html.
Marković, V., Stajić, L., Stević, Ž., Mitrović, G., Novarlić, B., and Radojičić, Z. (2020). A novel integrated subjective-objective MCDM model for alternative ranking in order to achieve business excellence and sustainability. Symmetry 12 (1), 164. doi:10.3390/sym12010164 |
Pan, B. H., Xie, Z. J., Liu, S. R., Shao, Y., and Cai, J. J. (2021c). Evaluating designs of a three-lane exit ramp based on the entropy method. IEEE Access 9, 53436–53451. doi:10.1109/access.2021.3070465 |
Pan, B., Liu, S., Xie, Z., Shao, Y., Li, X., and Ge, R. (2021a). Evaluating operational features of three unconventional intersections under heavy traffic based on CRITIC method. Sustainability 13, 4098. doi:10.3390/su13084098 |
Pan, B., Luo, S., Ying, J., Shao, Y., Lei, J., Li, X., et al. (2021b). Evaluation and analysis of CFI schemes with different length of displaced left-turn lanes with entropy method. Sustainability 13 (12), 6917. doi:10.3390/su13126917 |
Sayed, T., Storer, P., and Wong, G. (2006). Upstream signalized crossover intersection: Optimization and performance issues. Transp. Res. Rec. 1961 (1961), 44–54. doi:10.1177/0361198106196100106 |
Shao, Y., Han, X., Wu, H., and Claudel, C. G. (2019). Evaluating signalization and channelization selections at intersections based on an entropy method. Entropy 21 (8), 808. doi:10.3390/e21080808 | |
Shao, Y., Luo, Z., Wu, H., Han, X., Pan, B., Liu, S., et al. (2020). Evaluation of two improved schemes at non-aligned intersections affected by a work zone with an entropy method. Sustainability 12, 5494. doi:10.3390/su12145494 |
Shi, X., Zhang, J., Lu, S., Wang, T., and Zhang, X. (2022). China carbon neutralization research status and research frontier tracking. Front. Environ. Sci. 507. doi:10.3389/fenvs.2022.896524 |
Stevanovic, A., and Mitrovic, N. (2019). Traffic microsimulation for flexible utilization of urban roadways. Transp. Res. Rec. J. Transp. Res. Board TBD(TBD), TBD 2673, 92–104. doi:10.1177/0361198119848407 |
SzymaD ska, E., bietaPanfiluk, E., and Kiryluk, H. (2021). Innovative solutions for the development of sustainable transport and improvement of the tourist accessibility of peripheral areas: The case of the BiaB owie| a forest region. Sustainability 13 (4), 2381. doi:10.3390/su13042381 |
Tu, J., Tao, Q., and Deng, Q. (2011). Safety evaluation of urban transit signal system based on the improved TOPIS. Procedia Eng. 15, 4558–4562. doi:10.1016/j.proeng.2011.08.856 |
Wang, H., Luo, S., and Luo, T. (2017). Fractal characteristics of urban surface transit and road networks: Case study of Strasbourg, France. Adv. Mech. Eng. 9 (2), 168781401769228. doi:10.1177/1687814017692289 |
Wang, W. X., Guo, R. J., and Yu, J. (2018). Research on road traffic congestion index based on comprehensive parameters: Taking Dalian city as an example. Adv. Mech. Eng. 10 (6), 168781401878148. doi:10.1177/1687814018781482 |
Wu, J., Liu, P., Tian, Z. Z., and Xu, C. (2016). Operational analysis of the contraflow left-turn lane design at signalized intersections in China. Transportation research: Part C. Emerging technologies.
You, X., Li, L., and Ma, W. (2013). Coordinated optimization model for signal timings of full continuous flow intersections. Transp. Res. Rec. 2366 (1), 23–33. doi:10.3141/2356-04 |
Zhang, L., Long, R., and Chen, H. (2019). Do car restriction policies effectively promote the development of public transport? World Dev. 119, 100–110. doi:10.1016/j.worlddev.2019.03.007 |
Zhang, L., Yin, Y., and Chen, S. (2013). Robust signal timing optimization with environmental concerns. Transp. Res. Part C Emerg. Technol. 29, 55–71. doi:10.1016/j.trc.2013.01.003 |
Zhao, X., Liang, C., Zhang, N., and Shang, P. (2019). Quantifying the multiscale predictability of financial time series by an information-theoretic approach. Entropy 21 (7), 684. doi:10.3390/e21070684 | |
Keywords: unconventional outside left-turn lane, signalized intersections, operational features, VISSIM, entropy weight method (EWM)
Citation: Liu X, Shao C, Yang S, Zhang R and Pan B (2022) Study on the location of unconventional outside left-turn lane at signalized intersections based on an entropy method. Front. Environ. Sci. 10:970836. doi: 10.3389/fenvs.2022.970836
Received: 16 June 2022; Accepted: 29 August 2022;
Published: 16 September 2022.
Edited by:
Grigorios Fountas, Aristotle University of Thessaloniki, GreeceReviewed by:
Athanasios Theofilatos, University of Thessaly, GreeceSocrates Basbas, Aristotle University of Thessaloniki, Greece
Copyright © 2022 Liu, Shao, Yang, Zhang and Pan. This is an open-access article distributed under the terms of the Creative Commons Attribution License (CC BY). The use, distribution or reproduction in other forums is permitted, provided the original author(s) and the copyright owner(s) are credited and that the original publication in this journal is cited, in accordance with accepted academic practice. No use, distribution or reproduction is permitted which does not comply with these terms.
*Correspondence: Binhong Pan, cGFuYmhAY2hkLmVkdS5jbg==
†These authors share first authorship