 Weixuan Song1
 Xing Yi
- 1Nanjing Institute of Geography and Limnology, Key Laboratory of Watershed Geographic Sciences, CAS, Nanjing, China
- 2College of Geography and Environmental Science, Zhejiang Normal University, Jinhua, China
- 3The Center for Economic Research, Shandong University, Ji’nan, China
- 4School of Management, Shandong University, Jinan, China
As the key object of carbon emission reduction, resource-based cities’ carbon emission problems are related to the achievement of China’s goals to peak carbon emission and achieve carbon neutrality. In this paper, 115 resource-based cities with abundant natural resources in China were studied, and spatial analysis techniques such as LISA (Local Indicators of Spatial Association) time path and spatial-temporal transition were used to explore their spatial divergence pattern and spatio-temporal evolution characteristics of carbon emission intensity from 2000 to 2019, while geodetector model was used further to reveal their drivers and impacts on the environment. It is found that 1) the carbon emission intensity of resource-based cities shows a significant decreasing trend, with significant differences in carbon emission intensity and its decreasing rate in different development stages and resource-type cities. The overall trend of growing cities, declining cities, mature cities and regenerating cities decreases in order. The carbon emission intensity of cities in the energy, forest industry, general, metal and non-metal categories gradually decrease. The spatial pattern of carbon emission intensity has strong stability, with an overall spatial distribution of high in the north and low in the south. 2) The spatial structure of carbon emission intensity in resource-based cities has strong stability, dependence and integration, with the stability gradually increasing from north to south and the path dependence and locking characteristics of the carbon emission intensity pattern slightly weakened. 3) The spatial divergence of carbon emission intensity in resource-based cities is the result of the action of multiple factors, among which the level of financial investment, urban economic density, urban population density, urban investment intensity and energy use efficiency are the dominant factors. 4) The leading drivers of carbon emission intensity are different in cities at different development stages and with various resources, and grasping the characteristics of carbon emission intensity changes and drivers of various resource-based cities can better provide targeted countermeasures for resource-based cities to achieve carbon emission reduction targets and sustainable development.
1 Introduction
Since the 21st century, China’s economy has maintained rapid development, and by 2010, China’s GDP surpassed Japan to become the world’s second largest economy, while as early as 2006, China’s carbon emissions surpassed the United States to become the world’s largest carbon emitter (Dong, 2017; Zhang W et al., 2020). While China’s GDP accounted for about 16.34% of the world economy in 2019, its carbon emissions occupied 28.76%1, reflecting the grim reality that China’s carbon emissions per unit of GDP are much higher than the world average. At the 75th session of the UN General Assembly in September 2020, China proposed that CO2 emissions strive to peak by 2030 and work towards carbon neutrality by 2060 and at the Climate Ambition Summit in December 2020, it proposed that carbon emissions per unit of GDP decreased by more than 65% compared with the 2005 target (Jiang et al., 2022; Sun et al., 2022). As China’s economy enters a stage of high-quality development, how to maintain sustained economic growth while reducing carbon emissions is a critical issue for the future, and may affect the sustainable development of China’s economy and society in the 14th Five-Year Plan and beyond.
Resource-based cities are cities with the mining and processing of natural resources such as minerals and forests in the region as their leading industry. The development of these cities is mainly dependent on resource-based industries such as natural resource extraction and processing, which are typically high-energy-consuming, high-polluting and high-emission industries, and they have serious impacts on China’s carbon emission reduction process (Wang W et al., 2022). There are 262 resource-based cities in China, accounting for 40% of the total number of cities in China (Hui et al., 2022), and these resource-based cities play important roles in the implementation of the national climate change strategy (Jia et al., 2021). Whether resource-based cities can achieve a low-carbon development transition is crucial to the process of China’s carbon emissions and the goal of peak carbon dioxide emissions and carbon neutrality. Therefore, exploring the spatial-temporal evolution characteristics of carbon emission intensity in resource-based cities and analyzing the drivers of their carbon emission intensity can not only provide a basis for resource-based cities to formulate scientific and reasonable emission reduction policies, but also offer theoretical and practical guidance to promote the low-carbon transition of cities, peak carbon dioxide emissions, and carbon neutrality.
Carbon emission intensity is the carbon dioxide emissions per unit of GDP, which is mainly used to measure the relationship between regional economic development and carbon emissions. The research on carbon emission intensity has attracted the attention of many scholars, and the research results are abundant, mainly focusing on the spatial distribution pattern of carbon emission intensity (Bai et al., 2020a; Liu et al., 2021; Liang et al., 2019; Wei et al., 2021; Wang et al., 2017), spatial correlation characteristics of carbon emission intensity (Liang et al., 2019; Song et al., 2020; Wang et al., 2019), the convergence of carbon emission intensity (Bai et al., 2020b; Huang et al., 2019; Yu et al., 2018), factors influencing carbon emission intensity (Shen et al., 2018; Wang et al., 2017; Wei et al., 2020; Zhou et al., 2019), and other aspects. In terms of the distribution pattern and correlation characteristics of carbon emission intensity, spatial autocorrelation and Markov chain are mainly used to analyze the spatial characteristics of carbon emission intensity (Wang et al., 2019; Wang et al., 2020), and Thiel index and coefficient of variation are used to explore the regional differences of carbon emission intensity (Zheng et al., 2018; Shi et al., 2022). For example, Bai et al. used social network analysis to explore the spatial structure characteristics of inter-provincial transportation carbon emissions in China from 2005 to 2015 (Bai et al., 2020a); Zhou et al. combined spatial econometrics to construct a Geo-tree model to reveal the evolution pattern of carbon emission intensity in China from 1990 to 2016 (Zhou et al., 2021).
In terms of the factors influencing carbon emission intensity, the structural decomposition method is used to decompose the factors influencing the change in carbon emission intensity (Dong et al., 2018; Fang and Yang., 2021), and the spatial econometric model is used to explore the effect of different factors on carbon emission intensity (Liang et al., 2019; Huang et al., 2020) with geodetector to identify the dominant drivers of carbon emission intensity (Jiang et al., 2018), etc. For example, Dong et al. used structural decomposition and quantile regression to explore the influencing factors of carbon emission intensity in China (Dong et al., 2018); Liu et al. used STIRPAT and GTWR models to reveal the influence of individual drivers on carbon emission intensity from a spatial-temporal perspective (Liu et al., 2021). At the scale of China’s carbon emission studies, due to the difficulty of obtaining and extrapolating carbon emission data at the urban scale in the early years, most of the existing studies have focused on the provincial scale, mainly exploring the provincial differences in carbon emissions at the national level or the evolution pattern of carbon emissions in individual provinces (Bai et al., 2020b; Liang et al., 2019; Wang and Zheng, 2021; Zhang Y et al. et al., 2020), and with the development of big data technology and the improvement of analysis techniques, the focus of carbon emission research gradually shifts to the municipal scale, analyzing the distribution characteristics and regional differences of carbon emissions at the national level or at the municipal scale in hotspot regions (Chen et al., 2019; Chuai and Feng., 2019; Ren et al., 2019; Wang et al., 2020).
The main shortcomings of the existing studies are as follows: 1) The existing studies mainly focus on the investigation of carbon emission intensity patterns in specific regional cities, and there are few studies focus on the carbon emission intensity of resource-based cities. However, as resource-based cities are the important targets of carbon emission reduction in China, it is necessary to deeply analyze the patterns and influencing factors of carbon emission in these cities. 2) There are many existing studies focus on the evolution of carbon emission intensity patterns. However, few studies focus on the spatial and temporal evolution of carbon emission intensity in resource-based cities from the perspective of specific city types in China. 3) Among the existing studies on the carbon emission intensity of resource-based cities, there are few studies that compare the two types of resource-based cities, namely comprehensive planning classification and resource type classification, and further investigate the factors influencing the carbon emission intensity of resource-based cities.
Based on this, this paper will expand the existing studies from the following aspects: first, the key area of carbon emission reduction, i.e., resource-based cities, is selected as the study area, and resource-based cities are studied separately according to two classification methods, namely, comprehensive planning classification and resource type classification, in order to investigate the evolution of carbon emission intensity in resource-based cities in depth. Second, on the basis of exploring the characteristics of carbon emission intensity of resource-based cities in time and space, exploratory spatial-temporal data analysis techniques are used to reveal the spatial-temporal evolution of carbon emission intensity of resource-based cities, which expands the research tools of carbon emission intensity. Third, on the basis of exploring the factors influencing the carbon emission intensity of resource-based cities, the differences in the influencing factors of carbon emission intensity in different types of resource-based cities are investigated from the perspective of comprehensive planning classification and resource type classification respectively. Fourth, this paper proposes more targeted policy implications based on the carbon emission intensity and influencing factors of different types of resource-based cities, respectively.
The chapters of this paper are organized as follows: Part 2 presents the data sources and related research methods of this paper, Part 3 analyzes the temporal-spatial variation patterns of carbon emission intensity in resource-based cities in China, Part 4 explores the drivers of intensity in resource-based cities in China, and Part 5 concludes the whole paper and presents the policies and insights of the study.
2 Data sources and research methods
2.1 Data sources
2.1.1 Data sources on resource-based cities and carbon emission intensity
By the planning scope of 262 resource-based cities in the National Sustainable Development Plan for Resource-based Cities (2013–2020), including 126 prefecture-level administrative regions, 62 county-level cities, 58 counties, and 16 municipal districts, this paper takes prefecture-level cities in prefecture-level administrative regions as the research objects (excluding prefecture-level cities established after 2000), i.e., 115 research units (as shown in Figure 1). The plan classifies resource-based cities into four categories: mature, growing, declining, and regenerating and the 115 prefecture-level cities include 63 mature cities, 14 growing cities, 23 declining cities, and 15 regenerating cities (hereinafter referred to as “comprehensive planning classification”). With reference to the existing literature (Li et al., 2017; Yan et al., 2019), the resource-based cities are classified into five categories: comprehensive, energy, metal, non-metal, and forest industry, including 24 comprehensive cities, 54 energy cities, 21 metal cities, 10 non-metal cities, and six forest industry cities.
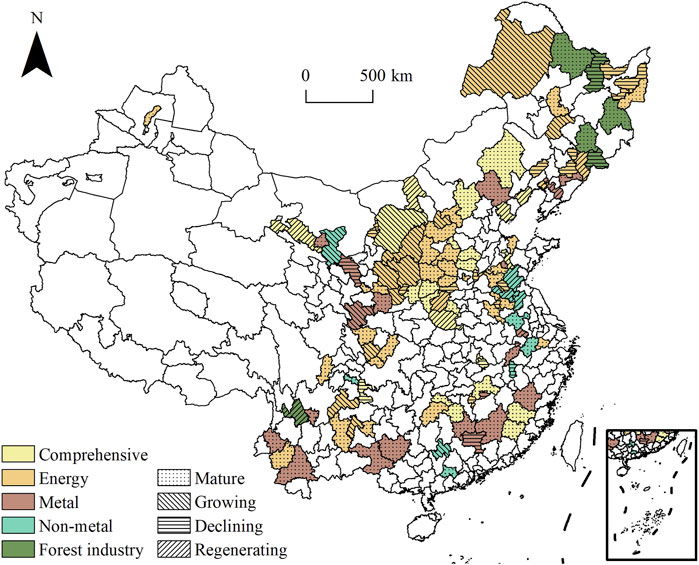
FIGURE 1. Spatial distribution of resource-based cities and their types.
The research period of the paper is 2000–2019, and the city carbon emission data are obtained from the research results (Chen et al., 2020), which uses the particle swarm optimization back propagation (PSO-BP) algorithm to invert the DMSP/OLS and NPP/VIIRS two sets of nighttime lighting data to accurately estimate the county carbon emission data. The carbon emission data of prefecture-level cities were obtained by combining the carbon emissions of counties. The socio-economic data of cities were obtained from the 2001–2020 provincial and municipal statistical yearbooks, the China City Statistical Yearbook, the China Regional Economic Statistical Yearbook and the China Urban Construction Statistical Yearbook.
2.1.2 Drivers of carbon emission intensity in resource-based cities and data sources
Based on the theories related to regional economics and urban geography, combined with the studies of many scholars (Wang et al., 2018; Wang et al., 2019; Wang X et al., 2022; Yin et al., 2022), it is found that economic and social development indicators play a major role in influencing carbon emissions. Therefore, based on the principles of objectivity, scientificity and accessibility of the index factors, we selected ten indicators, namely, urban economic density, industrial development level, financial investment level, urban investment intensity, science and technology development level, town development level, urban population density, transportation development level, openness level and energy utilization efficiency, to construct a system of drivers for carbon emission intensity in resource-based cities (as shown in Table 1).
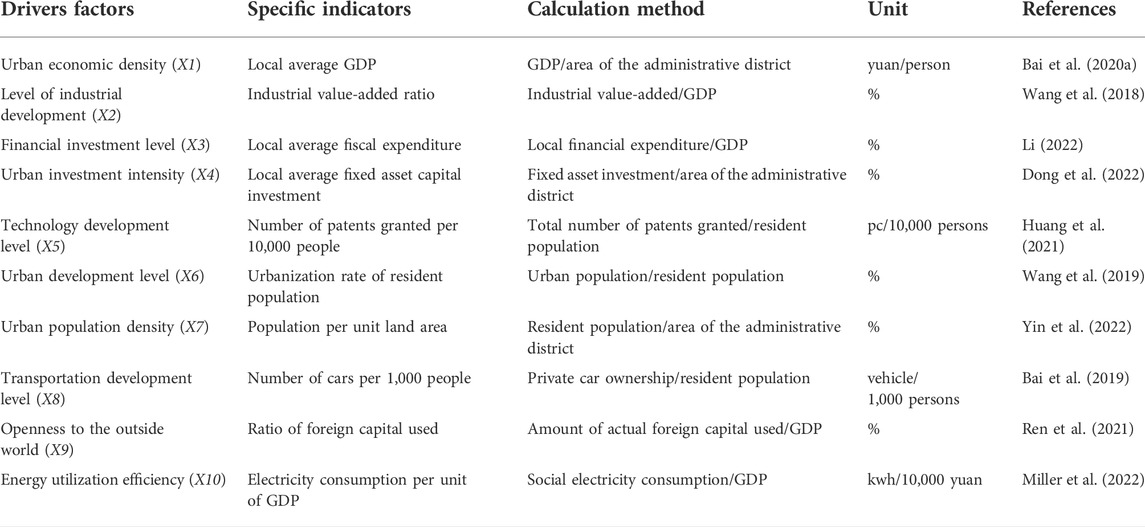
TABLE 1. Driving factors of carbon emission intensity in resource-based cities.
2.2 Research method
2.2.1 Exploratory spatial-temporal data analysis
Exploratory Spatial Data Analysis (ESDA) is a collection of techniques and methods for spatial data analysis. It is used to describe and visualize the spatial distribution patterns of data, explore the spatial structure of data, and explore spatial interaction mechanisms. ESTDA (Exploratory Spatial Temporal Data Analysis) was further introduced to reveal the spatial-temporal structural characteristics of carbon emission intensity in resource-based cities, and to systematically analyze spatial interaction characteristics and temporal evolution patterns of carbon emission intensity during the spatial and temporal evolution. ESTDA effectively bridges the shortage of ESDA (Exploratory Spatial Data Analysis) detection in the temporal dimension and realizes the benign coupling of temporal-spatial measures (Zhang et al., 2021), which mainly includes analysis techniques such as LISA time path and LISA spatial-temporal transition.
1) LISA time path. The evolution characteristics of LISA in the Moran scatter plot were observed for each cell in the time dimension to make the static LISA more dynamic (Munibah and Widiatmaka, 2018). By visualizing the pairwise movement of carbon emission intensity and its spatial lag term in resource-based cities, the spatio-temporal synergistic evolution of carbon emission intensity in resource-based cities can be explained and the spatio-temporal dynamics of local spatial differences and carbon emission intensity changes can be reflected. The indicators of the LISA time path include path relative length, curvature and transition direction, etc. LISA time path relative length can reflect the dynamic characteristics of the local spatial structure of carbon emission intensity, curvature reflects the fluctuation characteristics of the local spatial structure of carbon emission intensity, and transition direction reflects the integration characteristics of the evolution of the local spatial structure of carbon emission intensity. The expressions are as follows (Murray et al., 2012):
Where:
2) LISA spatial-temporal transition, which can reveal the spatial relationship between local neighborhoods of spatial units in terms of temporal changes (Rey et al., 2011), is divided into four types (as shown in Table 2): Type I indicates that transitions of the city itself and the neighboring cities are stable; Type II indicates that the city itself is stable and transitions of the neighboring cities. Type III indicates that both the city itself and the neighboring city transition; it is Type IIIA if the city itself and the neighboring cities transition in the same direction, and it is type IIIB if the city itself and the neighboring cities transition in opposite directions. Type IV indicates that both the city itself and the neighboring cities are stable (Rey and Janikas, 2010). define the spatio-temporal flow and convergence in a regional system as the ratio of the number of a certain type of transition to the total number of transitions in the study time period, i.e., it can be expressed as follows:
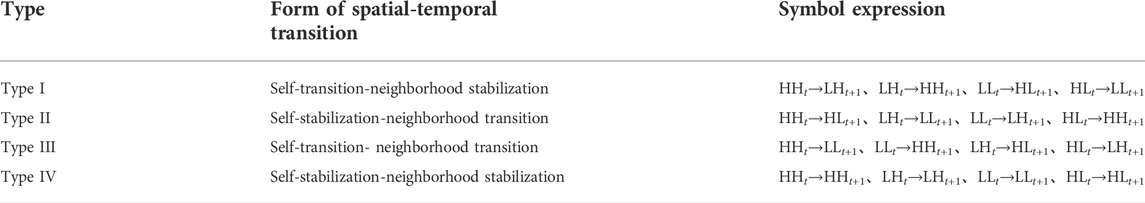
TABLE 2. Type of spatial-temporal transition.
Spatio-temporal flow (SF):
Spatio-temporal convergence (SC):
Where:
2.2.2 Geodetector
Geodetector is a statistical analysis method to identify geospatial heterogeneity and reveal the influence of driving forces behind it (Zhang and Zhoa, 2018), and it can effectively detect the consistency and causality of the spatial distribution of two variables independently (Wang et al., 2010). The core idea is that the relevant characteristic factors affecting the change of carbon emission intensity are spatially heterogeneous, and if the intensity of a factor is significantly consistent or similar to the carbon emission intensity in spatial distribution, it can indicate that this characteristic factor has a decisive role in carbon emission intensity. Geodetectors can detect both numerical and qualitative data and can also perform two-factor interaction detection. The Geodetector principle ensures that it avoids the problem of multiple independent variable covariance. So, the Geodetector requires fewer assumptions and does not need to consider multiple covariances in multiple independent variables, which can effectively overcome the limitations of traditional econometric models. The geographic detector model equation is (Gao et al., 2021):
Where:
3 Spatial-temporal evolution characteristics of carbon emission intensity in resource-based cities
3.1 Temporal change characteristics of carbon emission intensity in resource-based cities
1) The changes of carbon emission intensity of mature, growing, declining and regenerating cities are counted separately (as shown in Figure 2), and the carbon emission intensity of all types of resource-based cities has decreased significantly, and the carbon emission intensity decreased faster before 2009, and the carbon emission intensity changed more steadily and decreased relatively less after 2009. Before 2009, the proportion of industrial added value to GDP in resource-based cities was on an upward trend, but after 2009, it was on a downward trend. Industry is an important area of carbon emissions, and as the green and low-carbon transformation of China’s industrial structure and production methods has achieved remarkable results, carbon emissions intensity has gradually shown a decreasing trend. After 2009, the proportion of industrial added value declined, so the growth rate of total carbon emissions slowed down. In addition, the gradual completion of industrial transformation and upgrading in resource-based cities led to a gradual slowdown in carbon emissions intensity. From the average value of resource-based cities, carbon emission intensity declined from 5.52 t/10,000 yuan in 2000 to 1.76 t/10,000 yuan in 2019, a decrease of 68.06%, including a decrease of 44.71% from 2000 to 2009 and a decrease of 36.50% from 2010 to 2019. In terms of each type of cities, the carbon emission intensity of mature, growing, declining and regenerating cities dropped from 5.21 t/10,000 yuan, 7.36 t/10,000 yuan, 6.17 t/10,000 yuan and 4.12 t/10,000 yuan in 2000 to 1.56 t/10,000 yuan, 2.18 t/10,000 yuan, 2.14 t/10,000 yuan and 1.59 t/10,000 yuan in 2019, respectively, with a decrease of 70.03, 70.38, 65.34 and 61.31%. The overall carbon emission intensity of growing and declining cities is higher than the average value of resource-based cities, while the overall carbon emission intensity of mature and regenerating cities is lower than the average value of resource-based cities, and the decrease of carbon emission intensity of growing and mature cities is higher than that of resource-based cities as a whole, while the decrease of carbon emission intensity of regenerating and declining cities is lower than that of resource-based cities as a whole. Overall, the carbon emission intensity of growing cities is the highest and decreases the most, the carbon emission intensity of declining cities is higher and decreases less, the carbon emission intensity of mature cities is lower and decreases more, and the carbon emission intensity of regenerating cities is the lowest and decreases the least.
2) The changes of carbon emission intensity in cities of comprehensive, energy, metal, non-metal and forest industry categories (as shown in Figure 3), respectively, show a significant decrease in carbon emission intensity in cities of each resource type. The carbon emission intensity of comprehensive, energy and metal cities decrease faster before 2009 and decrease relatively less after 2009, while the carbon emission intensity of non-metal and forest industry cities changes more steadily and decrease slowly before 2006 and decrease relatively faster after 2006. Specifically, the carbon emission intensity of comprehensive, energy, metal, non-metal and forest industry cities declined from 4.73 t/10,000 yuan, 6.89 t/10,000 yuan, 4.15 t/10,000 yuan, 2.97 t/10,000 yuan and 5.47 t/10,000 yuan to 1.64 t/10,000 yuan, 2.08 t/10,000 yuan, 1.32 t/10,000 yuan, 0.99 t/10,000 yuan and 2.23 t/10,000 yuan in 2019, a decrease of 65.29, 69.75, 68.27, 66.56 and 59.28%, respectively. The overall carbon emission intensity of energy and forest industry cities is higher than the average value of resource-based cities, while the carbon emission intensity of comprehensive, metal and non-metal cities is lower than the average value of resource-based cities, and the decrease of carbon emission intensity of comprehensive, non-metal and forest industry cities is lower than that of resource-based cities as a whole, while the decrease of carbon emission intensity of energy and metal cities is higher than that of resource-based cities as a whole. In general, the carbon emission intensity of energy cities is the highest with the biggest decrease, the carbon emission intensity of forest industry cities is higher with the smallest decrease. The carbon emission intensity of comprehensive cities is lower with the smaller decrease, the carbon emission intensity of metal cities is lower with the larger decrease and the carbon emission intensity of non-metal cities is the lowest with the smaller decrease.
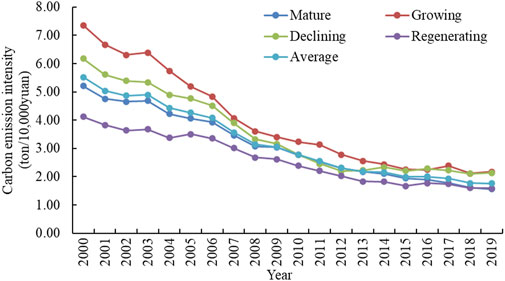
FIGURE 2. Temporal change of carbon emission intensity of resource-based cities during 2000–2019 (Group division based on comprehensive planning classification).
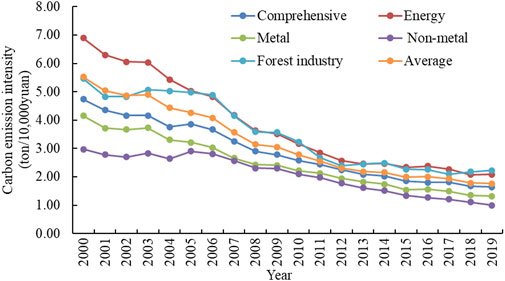
FIGURE 3. Temporal change of carbon emission intensity of resource-based cities during 2000–2019 (Group division based on resource types).
3.2 Spatial distribution pattern of carbon emission intensity in resource-based cities
According to the temporal variation characteristics of carbon emission intensity, carbon emission intensity of various types of resource-based cities and the resource-baced cities as whole changed significantly before and after 2009, so the spatial distribution of carbon emission intensity in 2009 is extracted separately. The spatial visualization of carbon emission intensity of resource-based cities in China in 2000, 2009 and 2019 was carried out using the natural intermittent point grading method (Jenks) of ArcGIS software (as shown in Figure 4).
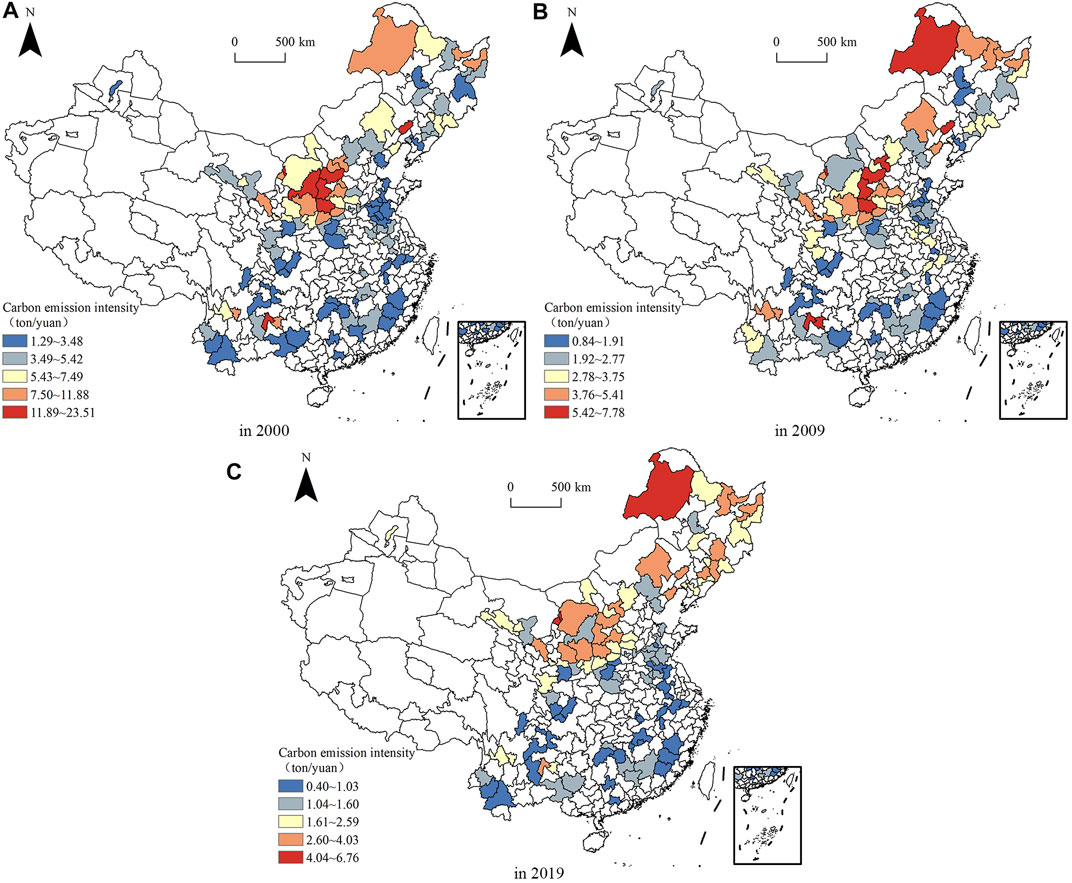
FIGURE 4. Space distribution pattern of carbon emission intensity of resource-based cities during 2000–2019. (A) in 2000. (B) in 2009. (C) in 2019.
In 2000, the high carbon emission intensity area is “locally concentrated, but overall scattered”, i.e., mainly concentrated in Shanxi and northern Shaanxi, such as Lvliang, Linfen, Xinzhou, Yulin, etc., but also scattered in Fuxin, Wuhai and Liupanshui, etc. The development stages are mostly mature, growing and declining, and the resource types are all energy-based. Coal is the main resource in these places, and coal, with its low calorific value and high carbon emissions per unit, is the fossil energy source with the highest carbon content. In 2000, the low carbon emission intensity areas are more numerous and widely distributed, mainly concentrated in the southern regions and Henan and Shandong, etc. The development stages are mostly mature, regenerating and declining, and the resource types are mostly energy, metal and non-metal (Yan et al., 2019). In 2009, the high carbon emission intensity areas were concentrated in Xinzhou, Linfen, Lvliang and Datong in Shanxi, and scattered in Hulun Buir, Wuhai, Fuxin, Liupanshui and Anshun, etc. The secondary high-value areas were mainly distributed in Shanxi and Heilongjiang, etc. The development stages of the high and secondary high-value areas were mostly mature and declining, and the resource types were mainly energy. The low-value areas of carbon emission intensity were mainly distributed in Fujian, Sichuan, Shandong and other regions. The development stage was mainly mature, and the resource type was mostly energy and metal. High-value areas of carbon emission intensity were significantly reduced in 2019, only distributed in Hulun Buir, Wuhai and Shizuishan, and the secondary high-value areas were mainly distributed in Shanxi, Heilongjiang and Liaoning, etc. The development stage of high-value areas and secondary high-value areas were mostly regenerating and mature type, and the resource type was mainly energy. The low-value carbon emission intensity areas are mainly distributed in southern regions, mostly concentrated in Fujian, Anhui, Jiangxi, Sichuan and Yunnan, etc. The development stage is mainly mature, and the resource types are mostly energy, metal and non-metal.
In general, the spatial pattern of carbon emission intensity has strong stability. That is, with the gradual decline of the absolute value of carbon emission intensity, the distribution pattern of carbon emission intensity is high in the north and low in the south. From the development stage, the high value areas of carbon emission intensity are concentrated in mature and declining type, and the low value areas are mostly mature and regenerating type. From the resource type, the high-value areas of carbon emission intensity are mostly energy, and the low-value areas are mainly energy, metal and comprehensive type. The above analysis shows that the high carbon emission intensity area is dominated by energy cities, and most of them are coal cities, and there are more cities in the mature and declining stage of resource development, and fewer regenerating and growing cities, reflecting that coal-based energy cities have a greater impact on the ecological environment in the economic development, which affects the sustainable development of the economy. The problem of resource depletion will become a serious challenge for most resource-based cities, and exploring transformation and urban regeneration development is the necessary path for the high-quality development of resource-based cities.
3.3 Local indicators of spatial association time path analysis of carbon emission intensity in resource-based cities
The relative length, curvature and movement direction of the LISA time path of carbon emission intensity in resource-based cities are calculated and spatially visualized using ArcGIS software (as shown in Figure 5).
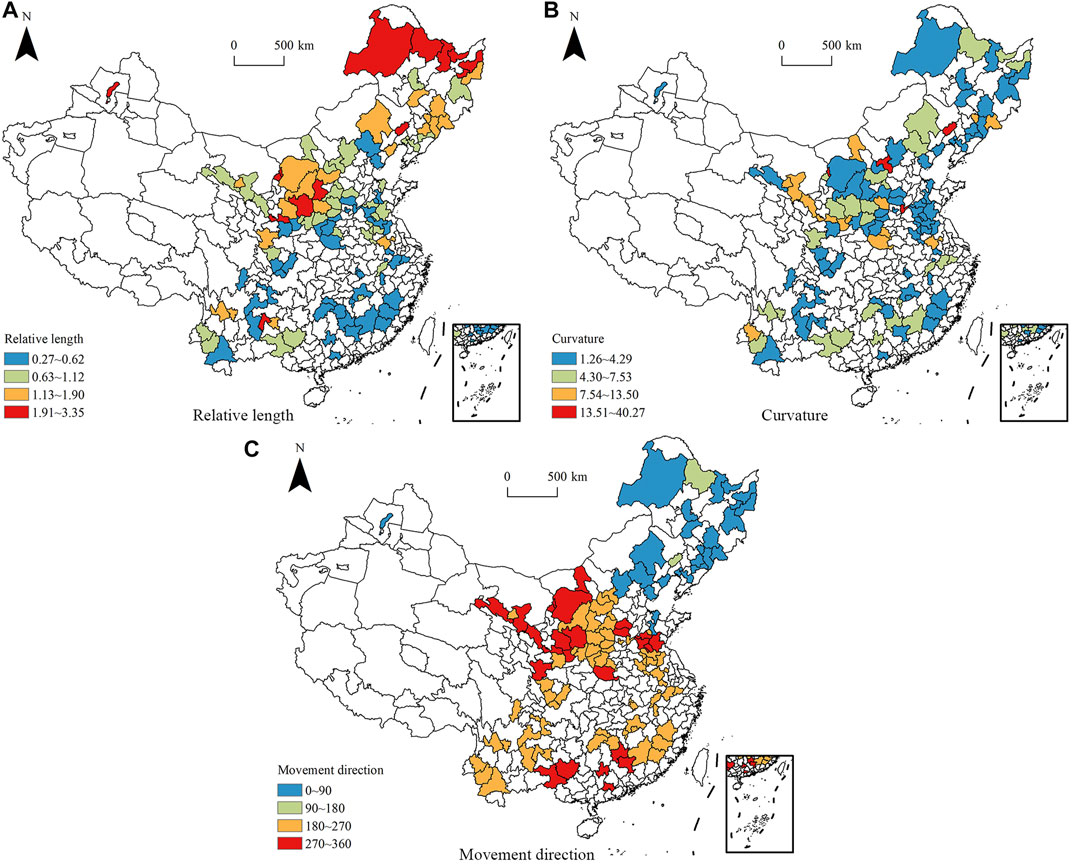
FIGURE 5. The spatial distribution of LISA time path of carbon emission intensity in resource-based cities. (A) Relative length. (B) Curvature. (C) Movement direction.
The regions with a higher relative length of LISA time path are distributed in northern Heilongjiang, eastern Inner Mongolia, western Shanxi, and northern Shaanxi, which are basically consistent with the distribution of high-value areas of carbon emission intensity, indicating that the change of carbon emission intensity in these regions is larger, i.e., the decrease of carbon emission intensity is more. The regions with lower relative lengths are distributed in western Fujian, south-central Hunan, eastern Sichuan, and western Henan, indicating that the carbon emission intensity changes less in these regions. The relative length of the LISA time path of carbon emission intensity in resource-based cities is lower than the average in 75 cities, accounting for 65.22% of the study area, reflecting that the spatial structure of carbon emission intensity in resource-based cities has strong stability, and the stability gradually increases from north to south.
The number of cities with a high value of LISA time path curvature is small and scattered, such as Datong, Wuhai, Puyang, Fuxin, etc. The curvature of these cities exceeds 20, among which Datong has the highest curvature of 40.27. In addition, Jinchang, Pingliang, Pingdingshan, Tongchuan and Liaoyuan have curvature over 10, which reflects the strong variability of local spatial dependence direction of carbon emission intensity in these regions. The cities with lower curvatures are more numerous and widely distributed in Fujian, Jiangxi, Hunan, Sichuan, Shandong, and Liaoning, where the fluctuation of carbon emission intensity is smaller. Overall, the overall low curvature of carbon emission intensity in resource-based cities indicates that the evolution of carbon emission intensity in resource-based cities shows a more stable spatial dependence, i.e., a strong spatial locking effect.
In the direction of movement, 88 cities of resource-based cities with synergistic growth of carbon emission intensity (0°–90° and 180°–270°) occupy 76.52% of the study area, reflecting a strong spatial integration of the spatial evolution of carbon emission intensity in resource-based cities. The 25 cities with positive synergistic growth (0°–90°) are concentrated in northern Hebei, Liaoning, Jilin and Heilongjiang, and the carbon emission intensity in these areas shows a synergistic low rate of decline. There are 63 cities with negative synergistic growth (180°–270°), mainly in Anhui, Jiangxi, western Fujian, eastern Sichuan, Yunnan, northwestern Henan, and Shanxi, and the carbon emission intensity in these regions shows a synergistic high-speed decline.
3.4 Local indicators of spatial association spatial-temporal transition analysis of carbon emission intensity in resource-based cities
The LISA time path reveals the trend of each city in the Moran scatter plot, and the probability shift matrix and spatial-temporal transition proposed by Rey are used to explore the shift characteristics and evolution process of local spatial association types of carbon emission intensity in resource-based cities (as shown in Table 3).

TABLE 3. Local Moran’s I transition probability matrix of carbon emission intensity in resource-based cities.
The probability of Moran’s I scatter plot staying in the same quadrant (type IV) for the three time periods of 2000–2009, 2009–2019 and 2000–2019 are all around 90%, indicating that there is a strong transfer inertia of carbon emission intensity in resource-based cities, and it is more difficult to change the type of carbon emission intensity in each city, and the pattern of carbon emission intensity has a strong path-dependent and spatially locked characteristics. The probability of type I is less than 4%, type II is less than 7%, and type III is less than 1% in the above three time periods, which indicates that the possibility of transferring carbon emission intensity between local spatial and temporal correlation categories in resource-based cities is low. In type I, the probability of HLt→LLt+1and LHt→HHt+1 migration is below 4%, and the probability of HLt→LLt+1 and LHt→HHt+1 migration is mostly below 6% (except for LHt→HHt+1 type 8.14% in 2009–2019). In type II, the migration probability of LHt→LLt+1 is high, over 13%, HHt→HLt+1 migration probability is around 9%, and the migration probability of HLt→HHt+1 and LLt→LHt+1 is low, not exceeding 5%. In type III, both LLt→HHt+1 and LHt→HLt+1 migration probabilities are less than 1%, and there are no HHt→LLt+1 nor HLt→LHt+1 migration types, indicating that the probability of carbon emission intensity jump migration in resource-based cities is extremely low.
As shown in Table 3, the spatio-temporal flow values are lower than 0.1 and the spatio-temporal convergence values are higher than 0.9 in the foresaid three time periods, further indicating that the carbon emission intensity of resource-based cities is all in a strong transfer inertia. 2009–2019 spatio-temporal flow values are higher than that in 2000–2009, and spatio-temporal convergence values are lower than that of 2000–2009, i.e., the path dependence and lock-in characteristics of carbon emission intensity in resource-based cities have weakened over time.
4 Analysis of the drivers of carbon emission intensity in resource-based cities
4.1 Overall factor detection results for resource-based cities
Using the geographical detector model factor detection tool, the degree of influence of each driver on the carbon emission intensity in resource-based cities in 2000, 2009 and 2019 was explored (as shown in Table 4).
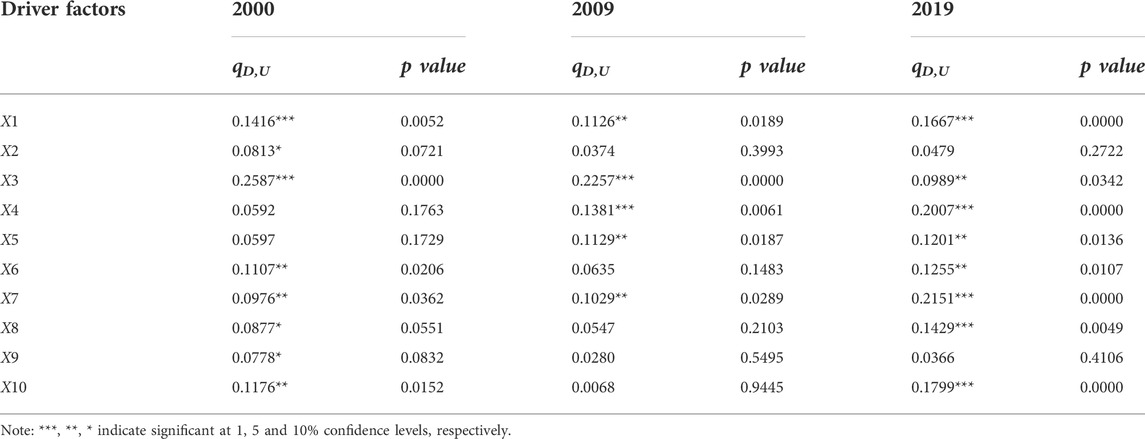
TABLE 4. Detection results of drivers of carbon emission intensity in resource-based cities.
As can be seen from Table 4, the influence of urban economic density on carbon emission intensity tends to increase in general, and passes the significance test in all 3 years. The urban economic density characterizes the efficiency of economic activities and the intensity of land use, and the higher value reflects the higher level of urban development. Therefore, the influence on carbon emission intensity tends to strengthen. The influence of industrial development level on carbon emission intensity is decreasing and then increasing, and only in 2000, it passed the significance test, mainly because the proportion of industrial value-added in resource-based cities increases and then decreases, i.e., the higher the industrial development level, the weaker the influence on carbon emission intensity. The influence of financial investment level on carbon emission intensity is decreasing, and all 3 years are significant at 1% confidence level, that is, the influence of financial investment level on carbon emission intensity is maintained at a high level, and this influence tends to weaken over time. Investment in fixed assets is the primary means of reproducing fixed assets in society. Through the construction and acquisition of fixed assets, cities continuously adopt advanced technology and equipment in the national economy, thus further adjusting and optimizing the economic structure and enhancing the strength of urban economic development. The impact of the level of scientific and technological development on carbon emission intensity is on the rise, and the improvement of the level of scientific and technological development promotes the transformation of the economic development model, the transformation of growth momentum and the optimization of economic structure, and the development of innovative low-carbon technologies to better promote green development.
The influence of urban development level on carbon emission intensity first decreases and then increases, and gradually increases in general. Urbanization and industrialization go hand in hand and develop together, and the agglomeration effect generated by urbanization will promote industrialization, which in turn promotes economic development, and its influence on carbon emission intensity strengthens as the urbanization process steadily advances. The influence of urban population density on carbon emission intensity gradually increases, and the significance level also gradually increases, i.e., the influence of increasing population density on carbon emission intensity is getting stronger. The impact of transportation development level on carbon emission intensity first decreases and then increases. The increase in car ownership, on the one hand, reflects the faster development of the automobile industry and the higher income level of residents, which also indicates the rapid economic development from the side, and on the other hand, the carbon emissions from car exhaust aggravate the deterioration of regional air quality and cause damage to the ecological environment. The impact of openness to the outside world on carbon emission intensity is decreasing and then increasing. The level of openness to the outside world reflects a city’s openness to the outside world and its ability to absorb foreign capital, which can promote the improvement of technology and industrial structure, increase jobs and residents’ income, and improve the quality of urban economic development. The influence of energy utilization efficiency on carbon emission intensity decreases first and then rises, the current economic development of resource-based cities mainly relies on resource-consuming production, which needs to consume a large amount of electricity and other energy, and a large amount of energy consumption also brings more serious environmental pollution (such as water pollution, air pollution, soil pollution, etc.) and a large amount of carbon emission, while the gradual improvement of energy utilization efficiency (the gradual decrease of electricity consumption per unit of GDP) reflects the decrease of carbon emission intensity.
Comparing the differences in the influence of each driver in 2000, 2009 and 2019, the influence of urban economic density, industrial development level, urban development level, transportation development level, openness level and energy utilization efficiency on carbon emission intensity first decreases and then increases, the influence of financial investment level on carbon emission intensity gradually weakens, and the influence of urban investment intensity, science and technology development level and urban population density on carbon emission gradually increases. In the ranking of the influence intensity of each factor, the level of financial investment, urban economic density, urban population density, urban investment intensity, and energy utilization efficiency rank in the top five in terms of the 3-year average explanatory power, i.e., these factors are the dominant factors affecting carbon emission intensity.
4.2 Planning a comprehensive classification of drivers and emission reduction initiatives for each city
The drivers of carbon emission intensity of mature, growing, declining and regenerating cities are detected, respectively, and the top five drivers of explanatory power in 2000, 2009, 2019 and the mean values of the 3 years are counted (as shown in Table 5).
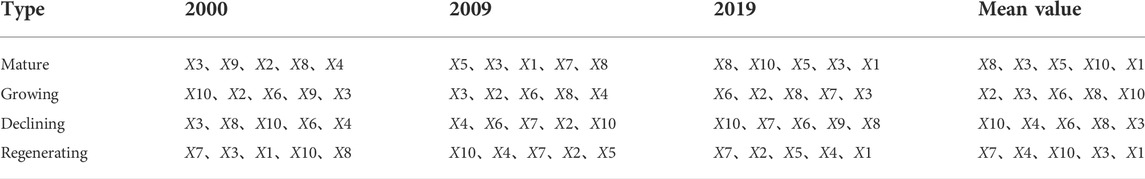
TABLE 5. Detection results of drivers of carbon emission intensity in different resource-based cities (Group division based on comprehensive planning classification).
As can be seen from Table 5, mature cities have a high level of economic and social development and relatively low carbon emission intensity because they are in the stable period of resource exploitation, which is mainly influenced by factors such as transportation development level, financial investment level, science and technology development level, energy utilization efficiency and urban economic density. Hence, mature cities should increase investment in science and technology innovation, promote the optimization and upgrading of industrial structure, improve resource utilization efficiency, establish a green and low-carbon industrial system, and advance the green transformation of economy and society.
Growing cities are in the rising period of resource development and rapid industrialization. Therefore, their carbon emission intensity is higher, which is mainly influenced by factors such as industrial development level, financial investment level, urban development level, transportation development level and energy utilization efficiency. Growing cities should pay attention to the protection of the ecological environment in resource development, improve the level of resource processing and utilization, coordinate the relationship between resource development and urban development, and promote the synergistic development of new industrialization and new urbanization.
Declining cities are at the end of resource development, with resources tending to be exhausted, relatively lagging economic development and high carbon emission intensity, which are mainly influenced by factors such as energy utilization efficiency, urban investment intensity, urban development level, transportation development level and financial investment level. The declining cities should timely change their economic development model, seek new economic growth points, strengthen policy support, cultivate new industries, improve the level of basic public services, actively promote ecological environment restoration, and improve the quality of urban development.
Regenerating cities have basically gotten rid of resource dependence and their economic development has gradually entered a healthy development track, so their carbon emission intensity is the lowest among the four types of cities, and is mainly influenced by factors such as urban population density, urban investment intensity, energy utilization efficiency, financial investment level and urban economic density. Regenerating cities should further optimize their economic structure, rely on scientific and technological innovation to promote industrial restructuring, actively cultivate green and low-carbon strategic emerging industries, and improve the quality and efficiency of urban economic development.
In addition, different types of resource-based cities should actively learn from and introduce advanced technologies and successful experiences in energy conservation and emission reduction both in and outside of China, strengthen cooperation and exchange in key areas and industries such as efficient utilization of resources, development and utilization of new energy, and low-carbon transformation of traditional industries, and establish cooperation mechanisms for low-carbon development.
4.3 Resource type classification of each city’s drivers and development path
The drivers of carbon emission intensity in cities of comprehensive, energy, metal, non-metal and forest industry categories are detected, respectively, and the top five drivers in terms of explanatory power in 2000, 2009, and 2019, and the mean values of the 3 years are counted (as shown in Table 6).
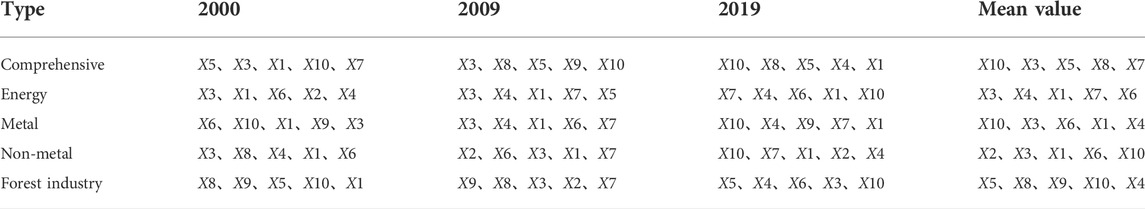
TABLE 6. Detection results of drivers of carbon emission intensity in different resource-based cities (Group division based on resource types).
As can be seen from Table 6, integrated cities are mostly mature and regenerating cities due to the more balanced resources of each type, and such cities are either in the stable stage of resource development or basically free from resource dependence, and their economic development level is relatively high. Therefore, their carbon emission intensity is low, and is mainly affected by factors such as energy utilization efficiency, financial investment level, science and technology development level, transportation development level and urban population density. Comprehensive cities should adhere to the drive of scientific and technological innovation, transform and upgrade traditional industries, promote the optimization and upgrading of industrial structure, and actively cultivate new industries with high technological content, high added value and strong driving effect; implement green development strategies, strengthen ecological restoration and treatment of mining areas, explore the establishment of market-oriented and diversified ecological compensation mechanisms, enhance urban environmental protection and pollution control, and improve the sustainable development and utilization of resources.
Energy cities mainly focus on coal, oil and gas and other fossil energy extraction, and most of them are mature and declining cities. These cities are mostly in the stable or end-stage of resource development, and their economic and social development levels are relatively lagging behind, and their carbon emission intensity is the highest, which is mainly influenced by the level of financial investment, urban investment intensity, urban economic density, urban population density and urban development level. Energy cities take the energy revolution as an opportunity to promote the coordinated development of energy development and utilization and ecological environment, support the green and sustainable development of the city and even the regional economy and society, improve the added value of the energy industry, enhance the efficiency of the energy system, and reduce the pressure on the environment and other systems; they should also increase financial investment and technology research and development, develop multi-energy complementary technologies, promote clean energy consumption, and promote the diversified development of urban energy.
Metal cities mainly focus on ferrous and nonferrous metal mining and metal cities are mostly mature resource cities; most of these cities are in the stable period of resource development, with relatively high level of economic and social development and low carbon emission intensity, and are mainly influenced by factors such as energy utilization efficiency, financial investment level, urban development level, urban economic density and urban investment intensity. Metal cities should accelerate the formation of the clustering effect of subsequent alternative industrial clusters with characteristics and cultivate and grow new economic growth points according to the characteristics and advantageous combinations of urban industries and national development goals (Yan et al., 2019); continue to increase investment in scientific research and innovation, drive the upstream and downstream extension of industrial chains through technology integration and innovation, make up the shortcomings of industrial chains, gather industrial development elements, and form a whole industrial chain competitive advantage.
Non-metal cities are mainly based on non-metallic mineral resources, and non-metal cities are mostly mature and regenerating cities, which are mostly in the stable period of resource development or basically free from resource dependence, and maintain good development momentum in economic and social development, with the lowest carbon emission intensity, and are mainly influenced by factors such as industrial development level, financial investment level, urban economic density, town development level and energy utilization efficiency. The impact of non-metal cities should promote the development of the non-metal mining industry toward intensification and scale through market-oriented means, establish a perfect R&D system around key minerals, products and application fields, build industrial clusters based on the development and utilization of non-metal minerals according to resource characteristics, and form a more comprehensive industrial chain; increase the management of environmental pollution in mineral development, comprehensively improve the ecological environment, and strive to achieve “Green Mine Construction”.
Forest industry cities mainly focus on developing and processing natural resources such as forests. Most of the cities in the forest industry category are mature and declining cities, which are mostly in the stabilization period or the end of resource development, facing severe challenges in economic and social development and high carbon emission intensity, mainly influenced by factors such as the level of scientific and technological development, the level of transportation development, the level of opening to the outside world, energy utilization efficiency and urban investment intensity. Cities in the forest industry category should strengthen forest management and protection in key forest areas of cities, completely ban commercial logging of natural forests, comprehensively improve the quantity and quality of forest resources, enhance the supply capacity of timber production, and build a national reserve base of strategic timber resources; in addition, cities should explore leading industries suitable for their own development, accelerate the cultivation of successive alternative industries, extend industrial chains, increase innovation investment, and provide new impetus for industrial diversification.
5 Conclusions and implications
5.1 Conclusion
This paper explores the spatial and temporal evolution characteristics of carbon emission intensity in resource-based cities in China, using panel data of prefecture-level cities from 2000–2019, and analyzes the drivers of spatial divergence in carbon emission intensity the geographic detector model to obtain the following main conclusions.
1) The carbon emission intensity of resource-based cities in China shows an obvious decreasing trend overall, but there are some differences between different types of resource-based cities. The overall trend of growth, decline, maturity and regeneration of cities in order on the comprehensive planning classification, and the classification of resource types basically shows a gradually decreasing trend of energy, forest industry, comprehensive, metal and non-metal cities, and the decrease of carbon emission intensity of each type of cities is negatively correlated with carbon emission intensity. In terms of spatial distribution, the high-value areas of carbon emission intensity are mainly concentrated in energy cities in Shanxi, Shaanxi and Heilongjiang, while the low-value areas are located in Fujian, Sichuan and Shandong, showing a spatial trend of high in the north and low in the south, and the spatial pattern has strong stability.
2) The spatial structure of carbon emission intensity of resource-based cities in China has strong stability, dependence and integration. Stability gradually increases from north to south, and dependency reflects a strong spatial locking effect, with positive synergistic growth cities concentrated in northern Hebei and northeastern provinces, and negative synergistic growth cities are more numerous and scattered. There is strong transfer inertia of carbon emission intensity in resource-based cities, with a low probability of transfer between local spatial and temporal correlation categories and a very low probability of jump migration, and the path dependence and locking characteristics of carbon emission intensity patterns slightly weaken over time.
3) There are significant temporal differences in the drivers of carbon emission intensity in resource-based cities. The impact of urban economic density, industrial development level, urban development level, transportation development level, openness level and energy utilization efficiency on resource-based cities first decreases and then increases, while the impact of financial input level gradually decreases, and the impact of urban investment intensity, science and technology development level and urban population density gradually increases. The level of financial investment, urban economic density, urban population density, urban investment intensity and energy utilization efficiency is the dominant factors influencing the carbon emission intensity of resource-based cities.
4) There are significant differences in the drivers of different types of resource-based cities. Mature, growing, declining and regenerating cities have different dominant factors affecting their carbon emission intensity because they are in different resource development periods and have large differences in their economic and social development levels. Comprehensive, energy, metal, non-metal and forest industry cities have different carbon emissions in the process of resource utilization and development due to the differences in the dominant resource types, and there are large differences in the degree of impact on the ecological environment. Therefore, the dominant drivers of their carbon emission intensity are different.
5.2 Policy implications
As China’s economic growth gradually changes from a high growth rate to high quality, the contradiction between economic development and carbon emissions still exists and affects sustainable development of the economy and society. The problem of “one industry only” or “one mine only” and the deformed industrial structure of resource-based cities have squeezed the development of other industries and restricted the sustainable development of cities, which seriously impacts the goals of peaking carbon dioxide emissions, and carbon neutrality. In view of the above situation, this paper draws the following policy inspirations.
Firstly, get rid of “one industry alone”, strengthen technological innovation and promote industrial upgrading. Resource-based cities must get rid of the development pattern of “one industry only” or “one mine only” in the process of development in order to effectively reduce carbon emissions and attain sustainable development. This requires resource-based cities to actively strengthen the research and development and utilization of renewable energy technologies, build a diversified and clean energy supply system, and promote changes in energy consumption patterns, so as to accelerate the industrial transformation and upgrading of resource-based cities and improve their energy utilization efficiency.
Secondly, for different types of resource-based cities, carbon emission reduction strategies should be formulated according to local conditions to promote sustainable development. As for mature, growing, declining and regenerating cities, mature cities are in the stable stage of resource development, so they should pay more attention to the optimization of industrial structure and invest more in green technology innovation; growing cities are in the rising stage of carbon emission, so they should pay more attention to the protection of the ecological environment and improve energy utilization efficiency; declining cities are at the end of resource development, so they need to strengthen ecological restoration and cultivate new industries; while for regenerating cities, they need to further take advantage of their technology and industrial structure to expand the proportion of green industries. In addition, for comprehensive energy, metal, non-metal and forest industry resource cities, comprehensive cities should insist on science and technology innovation to transform and upgrade traditional industries, improve energy utilization efficiency, and develop green and sustainable industries at multiple levels; energy cities are constrained by the “one industry only” and need to get rid of reliance on fossil energy and open up the new green industry to lighten the pressure from carbon emissions. For metal and non-metal cities, the situation is similar, and both need to increase investment in scientific research, extend the industrial chain, make up the short board of the industrial chain, and promote industrial gathering; for forest industry cities, it is necessary to strengthen forest management and protection in key forest areas to ensure the quantity and quality of forest resources.
Thirdly, the government needs to optimise top-level design, and regional and society cooperation needs to be strengthened. In terms of top-level design, the government level should formulate carbon emission reduction plans, policies and regulations, coordinate the relationship between sustainable economic and social development and carbon emission reduction, systematically coordinate carbon emission reduction efforts in various regions and industries, and establish a sound carbon emission monitoring, reporting and accounting system. With regard to regional and society cooperation, resource-based cities are characterized by strong path dependence and spatial locking. In order to break this path of dependence, it is necessary to rely on industrial assistance from neighboring regions, the support of international and domestic innovative technologies, and national, regional and society cooperation and support to promote green growth in the economy, and upgrade the transformation of resource-based cities into low-carbon sustainable cities.
Data availability statement
The raw data supporting the conclusions of this article will be made available by the authors, without undue reservation.
Author contributions
WS, SY, and XY conceived the ideas and designed the research framework; WS performed the literature research; SY, YZ, and XY performed the data collection and result calculation; WS, YZ, and LQ led the writing of the manuscript; All authors read and approved the final manuscript.
Funding
The research is supported by the Natural Science Foundation of Shandong Province (Grant No. ZR2021QG062).
Conflict of interest
The authors declare that the research was conducted in the absence of any commercial or financial relationships that could be construed as a potential conflict of interest.
Publisher’s note
All claims expressed in this article are solely those of the authors and do not necessarily represent those of their affiliated organizations, or those of the publisher, the editors and the reviewers. Any product that may be evaluated in this article, or claim that may be made by its manufacturer, is not guaranteed or endorsed by the publisher.
Footnotes
1Data from Statistical Review of World Energy, which is available at: https://www.bp.com/en/global/corporate/energy-economics/statistical-review-of-world-energy.html.
References
Bai, C., Chen, Y., Yi, X., and Feng, C. (2019). Decoupling and decomposition analysis of transportation carbon emissions at the provincial level in China: Perspective from the 11th and 12th five-year plan periods. Environ. Sci. Pollut. Res. 26 (15), 15039–15056. doi:10.1007/s11356-019-04774-2
Bai, C., Feng, C., Du, K., Wang, Y., and Gong, Y. (2020a). Understanding spatial-temporal evolution of renewable energy technology innovation in China: Evidence from convergence analysis. Energy Policy 143, 111570. doi:10.1016/j.enpol.2020.111570
Bai, C., Zhou, L., Xia, M., and Feng, C. (2020b). Analysis of the spatial association network structure of China's transportation carbon emissions and its driving factors. J. Environ. Manag. 253, 109765. doi:10.1016/j.jenvman.2019.109765
Chen, J., Gao, M., Cheng, S., Hou, W., Song, M., Liu, X., et al. (2020). County-level CO2 emissions and sequestration in China during 1997–2017. Sci. Data 7 (1), 391–412. doi:10.1038/s41597-020-00736-3
Chen, L., Xu, L., and Yang, Z. (2019). Inequality of industrial carbon emissions of the urban agglomeration and its peripheral cities: A case in the pearl river delta, China. Renew. Sustain. Energy Rev. 109, 438–447. doi:10.1016/j.rser.2019.04.010
Chuai, X., and Feng, J. (2019). High resolution carbon emissions simulation and spatial heterogeneity analysis based on big data in Nanjing City, China. Sci. Total Environ. 686, 828–837. doi:10.1016/j.scitotenv.2019.05.138
Dong, F., Yu, B., Hadachin, T., Dai, Y., Wang, Y., Zhang, S., et al. (2018). Drivers of carbon emission intensity change in China. Resour. Conservation Recycl. 129, 187–201. doi:10.1016/j.resconrec.2017.10.035
Dong, H., Liu, W., Liu, Y., and Xiong, Z. (2022). Fixed asset changes with carbon regulation: The cases of China. J. Environ. Manag. 306, 114494. doi:10.1016/j.jenvman.2022.114494
Dong, L. (2017). Bound to lead? Rethinking China’s role after paris in UNFCCC negotiations. Chin. J. Popul. Resour. Environ. 15 (1), 32–38. doi:10.1080/10042857.2017.1286144
Fang, D., and Yang, J. (2021). Drivers and critical supply chain paths of black carbon emission: A structural path decomposition. J. Environ. Manag. 278, 111514. doi:10.1016/j.jenvman.2020.111514
Gao, F., Li, S., Tan, Z., Wu, Z., Zhang, X., Huang, G., et al. (2021). Understanding the modifiable areal unit problem in dockless bike sharing usage and exploring the interactive effects of built environment factors. Int. J. Geogr. Inf. Sci. 35 (9), 1905–1925. doi:10.1080/13658816.2020.1863410
Huang, J., Li, X., Wang, Y., and Lei, H. (2021). The effect of energy patents on China's carbon emissions: Evidence from the STIRPAT model. Technol. Forecast. Soc. Change 173, 121110. doi:10.1016/j.techfore.2021.121110
Huang, J., Liu, C., Chen, S., Huang, X., and Hao, Y. (2019). The convergence characteristics of China's carbon intensity: Evidence from a dynamic spatial panel approach. Sci. Total Environ. 668, 685–695. doi:10.1016/j.scitotenv.2019.02.413
Huang, Y., Zhu, H., and Zhang, Z. (2020). The heterogeneous effect of driving factors on carbon emission intensity in the Chinese transport sector: Evidence from dynamic panel quantile regression. Sci. Total Environ. 727, 138578. doi:10.1016/j.scitotenv.2020.138578
Hui, C., Shen, F., Tong, L., Zhang, J., and Liu, B. (2022). Fiscal pressure and air pollution in resource-dependent cities: Evidence from China. Front. Environ. Sci., 10, 672. doi:10.3389/fenvs.2022.908490
Jia, R., Shao, S., and Yang, L. (2021). High-speed rail and CO2 emissions in urban China: A spatial difference-in-differences approach. Energy Econ. 99, 105271. doi:10.1016/j.eneco.2021.105271
Jiang, T., Yu, Y., Jahanger, A., and Balsalobre-Lorente, D. (2022). Structural emissions reduction of China's power and heating industry under the goal of “double carbon”: A perspective from input-output analysis. Sustain. Prod. Consum. 31, 346–356. doi:10.1016/j.spc.2022.03.003
Jiang, X., Wang, Q., and Li, R. (2018). Investigating factors affecting carbon emission in China and the USA: A perspective of stratified heterogeneity. J. Clean. Prod. 199, 85–92. doi:10.1016/j.jclepro.2018.07.160
Li, J., Wang, X., and Miao, C. (2017). Comparison of development efficiency evaluation in resource-based cities based on DEA model. Econ. Geogr. 37 (4), 99–106. doi:10.15957/j.cnki.jjdl.2017.04.013
Li, X. (2022). Local government decision-making competition and regional carbon emissions: Experience evidence and emission reduction measures. Sustain. Energy Technol. Assessments 50, 101800. doi:10.1016/j.seta.2021.101800
Liang, S., Zhao, J., He, S., Xu, Q., and Ma, X. (2019). Spatial econometric analysis of carbon emission intensity in Chinese provinces from the perspective of innovation-driven. Environ. Sci. Pollut. Res. 26 (14), 13878–13895. doi:10.1007/s11356-019-04131-3
Liu, J., Li, S., and Ji, Q. (2021). Regional differences and driving factors analysis of carbon emission intensity from transport sector in China. Energy 224, 120178. doi:10.1016/j.energy.2021.120178
Miller, G. J., Novan, K., and Jenn, A. (2022). Hourly accounting of carbon emissions from electricity consumption. Environ. Res. Lett. 17 (4), 044073. doi:10.1088/1748-9326/ac6147
Munibah, K., Widiatmaka, W., and Widjaja, H. (2018). Spatial autocorrelation on public facility availability index with neighborhoods weight difference. jrcp. 29 (1), 18–31. doi:10.5614/jrcp.2018.29.1.2
Murray, A. T., Liu, Y., Rey, S. J., and Anselin, L. (2012). Exploring movement object patterns. Ann. Reg. Sci. 49 (2), 471–484. doi:10.1007/s00168-011-0459-z
Ren, Y., Ren, X., and Hu, J. (2019). Driving factors of China’s city-level carbon emissions from the perspective of spatial spillover effect. Carbon Manag. 10 (6), 551–566. doi:10.1080/17583004.2019.1676096
Ren, Y. S., Apergis, N., Ma, C., Baltas, K., Jiang, Y., and Liu, J. L. (2021). FDI, economic growth, and carbon emissions of the Chinese steel industry: New evidence from a 3SLS model. Environ. Sci. Pollut. Res. 28 (37), 52547–52564. doi:10.1007/s11356-021-14445-w
Rey, S. J., Murray, A. T., and Anselin, L. (2011). Visualizing regional income distribution dynamics. Lett. Spat. Resour. Sci. 4 (1), 81–90. doi:10.1007/s12076-010-0048-2
Rey, S. J., and Janikas, M. V. (2010). “STARS: Space-time analysis of regional systems,” in Handbook of applied spatial analysis. Editors M. Fischer, and A. Getis (Berlin, Heidelberg: Springer).
Shen, L., Wu, Y., Lou, Y., Zeng, D., Shuai, C., and Song, X. (2018). What drives the carbon emission in the Chinese cities?—a case of pilot low carbon city of beijing. J. Clean. Prod. 174, 343–354. doi:10.1016/j.jclepro.2017.10.333
Shi, R., Irfan, M., Liu, G., Yang, X., Su, X., et al. (2022). Analysis of the impact of livestock structure on carbon emissions of animal husbandry: A sustainable way to improving public health and green environment. Front. Public Health, 10, 145. doi:10.3389/fpubh.2022.835210
Song, M., Wu, J., Song, M., Zhang, L., and Zhu, Y. (2020). Spatiotemporal regularity and spillover effects of carbon emission intensity in China's Bohai Economic Rim. Sci. Total Environ. 740, 140184. doi:10.1016/j.scitotenv.2020.140184
Sun, L., Cui, H., and Ge, Q. (2022). Will China achieve its 2060 carbon neutral commitment from the provincial perspective?. Adv. Clim. Change Res. 13 (2), 169–178. doi:10.1016/j.accre.2022.02.002
Wang, C., Wang, F., Zhang, X., Yang, Y., Su, Y., Ye, Y., et al. (2017). Examining the driving factors of energy related carbon emissions using the extended STIRPAT model based on IPAT identity in Xinjiang. Renew. Sustain. Energy Rev. 67, 51–61. doi:10.1016/j.rser.2016.09.006
Wang, J. F., Li, X. H., Christakos, G., Liao, Y., Zhang, T., Gu, X., et al. (2010). Geographical detectors‐based health risk assessment and its application in the neural tube defects study of the heshun region, China. Int. J. Geogr. Inf. Sci. 24 (1), 107–127. doi:10.1080/13658810802443457
Wang, Q., Su, M., and Li, R. (2018). Toward to economic growth without emission growth: The role of urbanization and industrialization in China and India. J. Clean. Prod. 205, 499–511. doi:10.1016/j.jclepro.2018.09.034
Wang, S., Gao, S., Huang, Y., and Shi, C. (2020). Spatiotemporal evolution of urban carbon emission performance in China and prediction of future trends. J. Geogr. Sci. 30 (5), 757–774. doi:10.1007/s11442-020-1754-3
Wang, S., Huang, Y., and Zhou, Y. (2019). Spatial spillover effect and driving forces of carbon emission intensity at the city level in China. J. Geogr. Sci. 29 (2), 231–252. doi:10.1007/s11442-019-1594-1
Wang W, W., Xiao, W., and Bai, C. (2022). Can renewable energy technology innovation alleviate energy poverty? Perspective from the marketization level. Technol. Soc. 68, 101933. doi:10.1016/j.techsoc.2022.101933
Wang X, X., Liu, H., and Chen, Z. (2022). Transformation of resource-based cities: The case of Benxi. Front. Environ. Sci., 482. doi:10.3389/fenvs.2022.903178
Wang, Y., and Zheng, Y. (2021). Spatial effects of carbon emission intensity and regional development in China. Environ. Sci. Pollut. Res. 28 (11), 14131–14143. doi:10.1007/s11356-020-11557-7
Wei, W., Li, J., Chen, B., Wang, M., Zhang, P., Guan, D., et al. (2021). Embodied greenhouse gas emissions from building China’s large-scale power transmission infrastructure. Nat. Sustain. 4 (8), 739–747. doi:10.1038/s41893-021-00704-8
Wei, W., Wang, M., Zhang, P., Chen, B., Guan, D., Shao, S., et al. (2020). A 2015 inventory of embodied carbon emissions for Chinese power transmission infrastructure projects. Sci. Data 7 (1), 318–326. doi:10.1038/s41597-020-00662-4
Yan, D., Kong, Y., Ye, B., Shi, Y., and Zeng, X. (2019). Spatial variation of energy efficiency based on a Super-Slack-Based Measure: Evidence from 104 resource-based cities. J. Clean. Prod. 240, 117669. doi:10.1016/j.jclepro.2019.117669
Yin, Q., Wang, Y., Xu, Z., Wan, K., and Wang, D. (2022). Factors influencing green transformation efficiency in China's mineral resource-based cities: Method analysis based on IPAT-E and PLS-SEM. J. Clean. Prod. 330, 129783. doi:10.1016/j.jclepro.2021.129783
Yu, S., Hu, X., Fan, J., and Cheng, J. (2018). Convergence of carbon emissions intensity across Chinese industrial sectors. J. Clean. Prod. 194, 179–192. doi:10.1016/j.jclepro.2018.05.121
Zhang W, W., Li, G., Uddin, M. K., and Guo, S. (2020). Environmental regulation, Foreign investment behavior, and carbon emissions for 30 provinces in China. J. Clean. Prod. 248, 119208. doi:10.1016/j.jclepro.2019.119208
Zhang, X., and Zhao, Y. (2018). Identification of the driving factors’ influences on regional energy-related carbon emissions in China based on geographical detector method. Environ. Sci. Pollut. Res. 25 (10), 9626–9635. doi:10.1007/s11356-018-1237-6
Zhang, Y., Pan, J., Zhang, Y., and Xu, J. (2021). Spatial-temporal characteristics and decoupling effects of China’s carbon footprint based on multi-source data. J. Geogr. Sci. 31 (3), 327–349. doi:10.1007/s11442-021-1839-7
Zhang Y, Y. J., Liu, J. Y., and Su, B. (2020). Carbon congestion effects in China's industry: Evidence from provincial and sectoral levels. Energy Econ. 86, 104635. doi:10.1016/j.eneco.2019.104635
Zheng, B., Zhang, Q., Davis, S. J., Ciais, P., Hong, C., Li, M., et al. (2018). Infrastructure shapes differences in the carbon intensities of Chinese cities. Environ. Sci. Technol. 52 (10), 6032–6041. doi:10.1021/acs.est.7b05654
Zhou, S., Wei, W., Chen, L., Zhang, Z., Liu, Z., Wang, Y., et al. (2019). Impact of a coal-fired power plant shutdown campaign on heavy metal emissions in China. Environ. Sci. Technol. 53 (23), 14063–14069. doi:10.1021/acs.est.9b04683
Keywords: resource-based cities, carbon emission intensity, carbon neutrality, spatial-temporal evolution, sustainable development
Citation: Song W, Yin S, Zhang Y, Qi L and Yi X (2022) Spatial-temporal evolution characteristics and drivers of carbon emission intensity of resource-based cities in china. Front. Environ. Sci. 10:972563. doi: 10.3389/fenvs.2022.972563
Received: 18 June 2022; Accepted: 19 July 2022;
Published: 11 August 2022.
Edited by:
Wendong Wei, Shanghai Jiao Tong University, ChinaReviewed by:
Ying She, Nanchang Hangkong University, ChinaYuanyuan Zhu, Central China Normal University, China
Huaxi Yuan, Zhongnan University of Economics and Law, China
Copyright © 2022 Song, Yin, Zhang, Qi and Yi. This is an open-access article distributed under the terms of the Creative Commons Attribution License (CC BY). The use, distribution or reproduction in other forums is permitted, provided the original author(s) and the copyright owner(s) are credited and that the original publication in this journal is cited, in accordance with accepted academic practice. No use, distribution or reproduction is permitted which does not comply with these terms.
*Correspondence: Xing Yi, eWl4aW5nMDExMUBtYWlsLnNkdS5lZHUuY24=; Shanggang Yin, eWluc2hhbmdnYW5nQG5qbnUuZWR1LmNu