- 1School of Economics, Harbin University of Commerce, Harbin, China
- 2Faculty of Business and Economics, University of Malaya, Kuala Lumpur, Malaysia
Accelerating the green transformation of manufacturing industry is the way to the sustainable development of China’s economy and an inevitable requirement for realizing the great vision of carbon peaking and carbon neutrality. This paper employs the global Malmquist-Luenberger productivity index based on the SBM-DEA method to calculate the green total factor productivity covering manufacturing industry of 30 Chinese provinces between 2006 and 2019. A difference-in-difference model is constructed to empirically study the direct impact and mechanism assessment of carbon emission trading policy on the green total factor productivity. The results show that the green total factor productivity of China’s manufacturing industry generally showed a dynamic trend of rising during this period. Critically, the implementation of the carbon emissions trading policy has a significant effect on promoting the green total factor productivity of China’s manufacturing industry. Interestingly, this promoting effect will be enhanced by higher technical levels, a cleaner energy structure, and a greener industrial structure. Additionally, our evidence also shows that the positive impact of carbon emission trading policies on green total factor productivity will be improved by higher carbon emission trading prices and a more active carbon emission trading market, thereby accelerating the green transformation process of manufacturing industry. Therefore, taking carbon emissions trading policy as a long-term strategy and improving its effectiveness is crucial to ensuring the green and sustainable development of China’s manufacturing industry.
1 Introduction
Global climate change caused by greenhouse gases is one of the most serious environmental problems facing human beings and has a huge adverse impact on the sustainable development of the economy, which has also received extensive attention from scholars (Arto and Dietzenbacher, 2014; Mi et al., 2017; Andrew, 2018). China is the largest carbon emitter in the world, and this unfavorable emission situation may be because China’s energy consumption is mainly dependent on coal (Govindaraju and Tang, 2013), more than two-thirds of China’s power generation comes from coal-fired power generation, which shows that China’s energy consumption structure is too monotonous and mainly depends on fossil energy. In addition, the continuous increase in per capita carbon dioxide emissions over the years also reflect the further deterioration of China’s environmental problems.
Economic activities are closely related to environmental issues, and economic activities can have good or bad effects on environmental quality, so environmental protection and sustainable development involve all aspects of human economic activities (Yu et al., 2020; Yu et al., 2021; Ye, 2022). The reason why this study chooses the manufacturing sector as the research object of this paper is due to the following considerations. China has become the world’s second-largest economy. During the “13th Five-Year Plan” period, China’s industrial added value increased from 23.5 trillion to 31.3 trillion (CSY, 2021). Meanwhile, the added value of manufacturing industry accounts for nearly 30% of the global share, making it the world’s largest manufacturing industry country. However, China’s extensive manufacturing industry development model has brought serious environmental and energy problems, it consumes as much as 2,885.36 million tons of standard coal in 2020, accounting for 57.90% of China’s total energy consumption, which produces more than 50% of total CO2 emissions (CESY, 2021) and shows that China’s manufacturing industry presents the characteristics of high input and pollution, low efficiency and output. In March 2021, China’s “14th Five-Year Plan” pointed out that it needs to speed up the green transformation of economic development mode, vigorously promote green technology innovation, and improve the efficiency of resource utilization in core industries1, which indicates that it must accelerate the green transformation of China’s manufacturing industry to achieve the optimal allocation of social resources and ensure sustainable economic development in China.
As the world’s largest developing country with the largest total carbon dioxide emissions, China has undertaken the international responsibility for addressing climate issues. In October 2021, China issued the “Opinions on Completely Accurately Implementing the New Development Concept and Doing a Good Job in Carbon Neutralization”, which put forward the “dual carbon” goal, striving to achieve the peak of carbon dioxide emissions in 2030 and carbon neutrality in 20602. To achieve environmental goals, China has designated several policies, such as natural resource capitalization (Ye et al., 2022), energy intensity constraint policy (Shao et al., 2019) and ecological red line policy (Ye, 2022), etc., including carbon emissions trading (CET) policy.
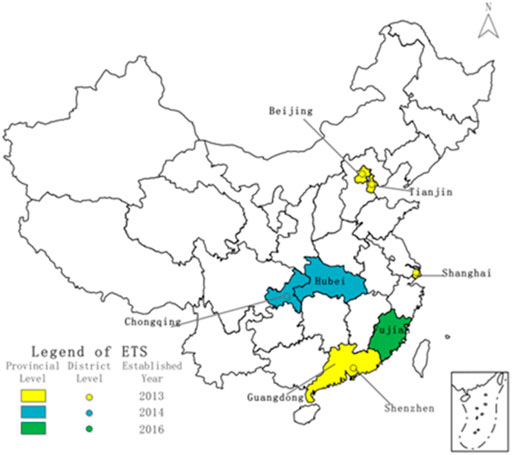
As a market-based environmental regulation tool, carbon emission trading policy relies on the market means to balance economic growth and carbon emission reduction to make up for the lack of government intervention, which has the characteristics of low cost and high efficiency. The carbon emission trading system in developed regions has been proved to be effective in carbon emission reduction, The European Union Emissions Trading System (EU-ETS) started trial operation on 1 January 2005, and officially started operation in 2008, Bayer and Aklin (2020) found that the EU-ETS achieved a total CO2 emission reduction of about 1.2 billion tons from 2008 to 2016. Therefore, is the carbon emissions trading system equally applicable to developing countries? In 2011, China issued the “Notice on Carrying out the Pilot Work of Carbon Emissions Trading”, Meanwhile, seven provinces (autonomous regions, municipalities)3 including Beijing, Tianjin, Shanghai, Shenzhen, Chongqing, Guangdong, and Hubei were identified as pilot regions for carbon emission trading, and then Fujian voluntarily joined the pilot region and became the eighth pilot region. The pilot covered more than 1.2 billion tons of CO2, making it the second largest carbon emissions trading system in the world, second only to EU-ETS (Munnings et al., 2016), and since 2013, the pilot provinces have successively launched online trading. In December 2017, the National Development and Reform Commission issued the “National Carbon Emissions Trading Market Construction Plan (Power Industry)", which means that the overall design of the national CET system has been completed and the construction has officially started. On 16 July 2021, the national CET market officially launched online trading, and the power generation industry has become the first industry in China to be included. The CET market has been developing in China for nearly a decade from 2011 to 2021, which has played an important positive role in carbon reduction (Gao et al., 2020), Li and Jia (2016) speculated that China’s carbon emissions trading system will reduce CO2 emissions by nearly 20 billion tons by 2030. The implementation of the carbon emissions trading pilot policy is shown in the Figure 1 below.
Given this, promoting the green transformation and upgrading of China’s manufacturing industry under the “dual carbon” goal is an effective way to achieve high-quality economic development. In this process, whether China’s CET policy has played a core role in promoting the green transformation of manufacturing industry urgently needs theoretical verification. Additionally, the analysis of its mechanism has important theoretical and practical significance for achieving high-quality economic development and achieving carbon peaking and carbon neutrality goals as scheduled. The purpose of this paper as following. 1) To determine whether China’s carbon emissions trading pilot policy can promote the green transition of manufacturing. 2) Analyze the mechanism of this policy to promote the green transformation of manufacturing industry. Analyzing the mechanism of carbon trading policy on the green transformation of manufacturing industry will help enrich the research on the construction of market-based environmental regulation policies, and can also provide a realistic basis for improving China’s carbon market. 3) Explore the impact of carbon emission trading policies on the operation of the carbon market. At present, the development of China’s carbon market is not perfect, which may lead to the lack of functionality of the market mechanism. Therefore, the green transformation of manufacturing industry in the pilot areas may not be completely caused by carbon trading. Therefore, it is necessary to examine the extent to which the market mechanism affects the green transformation of manufacturing industry.
The study uses data from 2006 to 2019 to analyze the CET policy effect mechanism on green total factor productivity (GTFP) using the DID method, which is useful to verify whether CET policy can become an effective means for China to achieve “carbon peaking” and “carbon neutrality” goals by significantly realizing industrial productivity ecology productivity. The contributions of this paper are as follows, first, this study focuses on the CET policy, adopts the DID method to explore the impact of the CET policy on the green transformation of manufacturing industry, and uses a variety of methods to test its robustness. Second, this study further analyzes the role of the carbon market based on the traditional mechanism analysis, clarifies the various impact mechanisms of the CET policy on the green transition of manufacturing, and enriches the research on the CET policy. Third, targeted policy recommendations are provided to provide policy references for the Chinese government to achieve ambitious carbon reduction goals.
The study is further organized as follows. Section 2 discusses the literature on the CET policy and green transformation of manufacturing industry to form a theoretical basis for the study. Section 3 describes the research methodology. Section 4 discusses the findings of the study, while Section 5 provides further mechanism analysis of the study. The final section concludes the study.
2 Literature review
2.1 Theoretical connotation and impact of the carbon emissions trading policy
The CET policy is a market-based environmental regulation tool, the government sets the emission cap and allocates the emission allowance to each enterprise according to the emission cap. Existing studies have conducted various studies on the CET policy, and some of them have proved the effectiveness of the CET policy in energy saving and emission reduction. Martin et al. (2014) found that the European carbon emissions trading system resulted in a significant reduction in CO2 emissions from the regulated sector without a strong negative impact on economic efficiency. By contrast, China’s CET market had a certain negative impact on China’s overall economy, which is related to the initial allocation of carbon allowances and corporate ownership. The higher the proportion of free allowances in the initial allocation, the greater the negative impact on GDP (Li et al., 2018), and the carbon emissions and carbon intensity of public-owned enterprises are lower than those of privately-owned enterprises (Clò et al., 2017). Most of the existing literature affirms the contribution of the CET market to carbon emission reduction, but this contribution may be overestimated. From 2005 to 2012, the total emission reduction of the European carbon emission trading system ranged from 33.78 million tons to 40.76 million tons, which is far less than the total emission reduction of 294.5 million tons of the 25 EU member countries. In addition, the emission reduction of the European carbon emission trading system is much lower than the predicted of the literature before the economic crisis, which shows that the economic recession after the 2008 economic crisis is an important factor in carbon emission reduction (Bel and Joseph, 2015).
Some studies have found that CET policy has had an impact on enterprises. For example, the CET policy will increase the prices of commodities in the areas covered by the policies, Lin and Jia (2017) found that the prices of commodities in industries that are included in the CET system are higher compared to those that are excluded. Moreover, CET policy has also had an impact on energy-intensive industries, Smale et al. (2006) argued that although most of the industries included in the CET system are still profitable, the market share of the steel, cement, and aluminum industries is decreasing. However, Anger (2010) argued that the CET policy will contribute to carbon emission reductions in the aviation industry, with less impact on air traffic volume and the macro economy. In addition, Borghesi et al. (2015) found that the CET policy has a promoting effect on environmental innovation, which cooperates with the structural adjustment of the industrial structure and will become the driving force to achieve carbon emission reduction (Hu et al., 2020). China’s carbon emission trading market is in the stage of continuous improvement and development.
2.2 The evaluation and drives of manufacturing industry green transformation
The essence of green transformation is to achieve coordinated development of the economy and the ecological environment, and manufacturing industry will play an important role in this process (Speck and Zoboli, 2017). There are many different evaluation methods for green transformation, most of them are mainly single-factor or multi-factor evaluation indicators. The former mainly reflects the relationship between energy consumption and economic output, which commonly include energy intensity, unit output improvement, energy efficiency improvement, and pollution emission reduction. Zhai and An (2020) used single-factor evaluation indicators to measure the performance of green transformation and analyze the factors that affect green transformation, they found that human capital investment, technological innovation, corporate financing capacity, and government behavior have a significant positive impact on green transformation. The latter uses GTFP to evaluate green transformation performance and generally calculated it through the data envelopment analysis (DEA) method, which can measure the relative efficiency of decision-making units (DMUs) with multiple desired and undesired input or outputs. Therefore, the Malmquist-Luenberger (ML) productivity index based on the DEA method is often used to investigate GTFP. Chen and Golley (2014) used this method to calculate China’s industrial GTFP and found that China’s industry has not yet achieved sustainable development. While Xie et al. (2017) argued that there is a nonlinear relationship between the intensity of environmental regulation and industrial GTFP, some degree of environmental regulation has a significant impact on GTFP (Wang et al., 2019). However, the ML index uses the same base period leading to different periods that are not comparable. So, the global-Malmquist-Luenberger (GML) productivity index was proposed (Oh, 2010). Pan et al. (2019) adopted this method evaluates the development of China’s low-carbon economy and analyzes its influencing factors, they found that technological progress helps promote the development of a low-carbon economy, while the impact of industrial and energy structure change on the green economy is short.
The driving factors of green transition are technological innovation, industrial structure, energy structure, foreign trade level, etc. Zhao et al. (2021) found that technological innovation can improve production methods, increase the output level and promote energy conservation and emission reduction, while scientific research investment has not brought the corresponding improvement of technological innovation. Therefore, larger-scale promotion of low-carbon technologies, elimination of outdated production capacity, and reduction of excess capacity are critical to green development (Li and Lin, 2016). Moreover, Liu et al. (2015) and Yu et al. (2018) found that pollution emissions and energy consumption are significantly related to the economic structure, so adjusting the industrial structure of energy-intensive can reduce carbon emissions and promote green transformation. The emission of greenhouse gases mainly comes from the combustion of fossil fuels. While the technology of China’s industrial sector is more inclined to labor and fossil energy rather than capital and non-fossil energy. Yang et al. (2018) argued that the energy structure of most industrial sub-sectors in China has great space for improvement, Then, Feng et al. (2009) found that reducing the proportion of coal consumption in energy will help reduce energy intensity and promote economic structural upgrading. Energy sustainability also has an impact on the environment, and renewable energy is more environmentally sustainable than non-renewable energy (Usman and Makhdum, 2021; Usman et al., 2021; Usman et al., 2022a). Additionally, Tian et al. (2018) and Wu and Guo (2021) argued that the trade will also affect the green transformation of manufacturing industry, the carbon emissions of “chemical industry”, “non-metallic mineral product manufacturing industry”, and other industrial sectors are mainly caused by export.
2.3 Environmental policies and the green transformation of manufacturing industry
The stringency of China’s 2030 energy and climate targets and policies is highly debated. The good news is China’s incremental CO2 emissions show a steady downward trend, and the decoupling between economic growth and carbon emissions growth is becoming more and more serious, which is also a necessary condition for carbon peaking (Li and Qin, 2019). However, the future development situation is highly uncertain, and if no further measures are taken, the probability of achieving the carbon peaking target as scheduled is low (Duan et al., 2018). The challenge of carbon neutrality, China needs to further increase the share of non-fossil energy, promote emission reduction technologies, promote regional low-carbon development, and establish a national green market, all of which require the support of technological development and policy (Liu et al., 2022). Many scholars have analyzed the policy effects of China’s existing environmental policies. For example, Shao et al. (2019) used double-difference and triple-difference models to analyze the impact of China’s Energy Constraint Policy (EPIC) and Carbon Intensity Constraint Policies (CPIC). The impact of Total Factor Energy Efficiency Growth (TFEEG) in the industrial sector, the study found that energy constraint policies have promoted the decline of total factor energy efficiency growth in the industrial sector, and the introduction of more market-based policies will help the green transition of the industry. Ren et al. (2020) used a double-difference model to examine the policy effects of China’s emissions trading pilot policy. The study found that the policy reduced SO2 emissions and promoted industrial growth in the pilot area. In addition, regulated companies’ patents and environmental patents have increased, and the policies in areas with a higher level of environmental law enforcement are more effective.
Energy conservation and emission reduction strategies are important to promote the green transformation of manufacturing industry (Cai et al., 2019). On the one hand, scholars have different views on the relationship between environmental policies and the green transformation of manufacturing industry. Some scholars believe that command-and-control and market-based policies have a significant impact on reducing pollution emissions than environmental information disclosure (Huang and Chen, 2015). However, environmental policies have negative impacts on the economy, Wang et al. (2017) found that the cost of carbon abatement tends to rise with the reduction in emissions. Further, Yuan and Xiang (2018) argued that although environmental regulation improves energy efficiency, it declines labor efficiency. Therefore, carbon policies that rely too heavily on administrative measures and ignore market mechanisms are unsustainable (Mi et al., 2017; Yang et al., 2018). On the other hand, some scholars affirmed the role of market-based environmental policies in green transformation (Feng and Chen, 2018). The implementation of CET can promote innovation in corporate emission reduction without crowding out other innovations, and improving environmental law enforcement will increase the effectiveness of the CET policy (Calel and Dechezleprêtre, 2016; Ren et al., 2020). In addition, more scholars affirmed the positive impact of environmental regulation on technological innovation and improving total factor productivity (Hamamoto, 2006; Cai et al., 2020).
Based on the above literature analysis, we can find that although some studies have studied the impact of carbon emission trading policies on carbon emission reduction and economic development, few studies have paid attention to the regulatory effect of carbon emission trading policies on the green transformation of manufacturing. In addition, although some scholars have analyzed traditional mechanisms, such as technological innovation and industrial structure. However, further mechanistic identification is lacking. Based on this, this paper explores the impact of carbon emissions trading policies on the green transition of manufacturing and further analyzes the moderating effects of carbon emissions trading prices and market activity on policy effects. Different from previous studies that divide the industrial structure into three industries, this paper pays more attention to the changes in each sub-industry within manufacturing industry. This paper enriches the relevant research on environmental policy and provides a more precise discussion for China to achieve the “dual carbon” goal and promote green economic development.
3 Theoretical Analysis
3.1 The direct impact of carbon emissions trading on the green transition of manufacturing industry
Carbon emissions have obvious externalities, which are difficult to evaluate. The construction of the CET market has realized the market-based evaluation of external environmental costs and created the basic conditions for the internalization of external costs. The Coase theorem holds that when property rights are determined and transaction costs are zero or small, the market-based policies can achieve Pareto efficiency. Zhang and Zhang (2019) argued that compared with command-and-control policies, market-based environmental policies will bring higher economic and energy-saving. The CET market can guide enterprises to make choices on production and operation methods by directly affecting the production cost, circulation cost, trade fee, and income. Specifically, the government first sets the total amount of carbon emissions and distributes it to lower-level governments layer by layer, and then conducts transactions among enterprises that are included in the carbon market. When the CO2 emissions of enterprises exceed their quota emissions, they need to buy more carbon emissions permits from the government or other enterprises. Instead, they will sell carbon permits, which can directly change the overall green transformation of manufacturing industry.
3.2 The role of technological innovation
According to Porter’s hypothesis and profit maximization theory, CET policy has a role in promoting technological innovation. Ren et al. (2019) found that the CET policy promotes total factors productivity by promoting technological innovation and improving the efficiency of resource allocation. On the one hand, from the perspective of increasing cost pressure, CET policy, as a market-based environmental regulation tool, has a certain restraint effect on the carbon emissions of enterprises. If the enterprise maintains the original production technology, scale, and process when the enterprise’s carbon emissions exceed the free permit issued by the government, it is necessary to enter the carbon trading market to purchase more carbon emission permits, which increases the production cost; Instead, if the enterprise reduces the production to reduce the carbon emission, it will reduce the income and competitiveness. Therefore, the CET policy makes enterprises with relatively higher carbon emission costs or lower resource utilization efficiency face greater production pressure. On the other hand, from the perspective of improving innovation benefits, when companies carry out technological innovation to reduce CO2 emissions, they can obtain economic profits by selling redundant permits, which means that the benefits of technological innovation are increased and the expectations for innovation risks are reduced, prompting companies to increase investment in technological innovation.
The role of technological innovation in promoting the green transformation of manufacturing industry can be reflected in the following aspects: First, the innovation of production technology can effectively shorten the product development and production cycle, and improve the value-added of products. Meanwhile, the information spillover effect brought by technological innovation improves information technology, which can provide more information to both the supply and demand sides, effectively reducing the information search and transaction costs caused by information asymmetry, and thus improving the decision-making and transaction efficiency of enterprises, and then promote the economic growth of manufacturing industry. Second, the knowledge spillover effect brought by technological innovation is conducive to improving the human capital quality and technical level of manufacturing industry, thereby improving the total factor productivity of manufacturing industry. Third, through the knowledge spillover effect of technological innovation, it is conducive to promoting the diffusion of technological innovation achievements of high-tech industries to traditional industries, and promoting the transformation of traditional industries to intelligence, digitization, and high-end.
3.3 The role of industrial structure
The optimization and upgrading of the industrial structure include two aspects: the rationalization of horizontal matching of factors and the advanced vertical replacement of leading industries. The former refers to the strengthening of inter-industry coordination ability and the improvement of the level of association, and the various industrial departments serve and promote each other in input and output, thereby improving the efficiency of resource utilization. The latter is mainly manifested in the development of efficient modern manufacturing industry, the improvement of the dominant position of knowledge-intensive and technology-intensive industries, the decline in the proportion of resource-intensive and pollution-intensive industries, and the evolution of low-value-added industries to high-value-added industries. Industrial structure plays an important role in the process of CET policy promoting GTFP. On the one hand, it internalized the external effects. Excessive emission of pollutants in the production process will increase the company’s additional compliance costs, leading to production materials flow into enterprises and industries with higher factor productivity. On the other hand, the CET policy has also released a signal to society, which has spawned consumer demand for green high-tech products, to promote the development of technology-intensive and knowledge-intensive industries, thereby promoting the greening of the industrial structure. Shen and Gong (2011) found that the production efficiency of China’s high-energy-consuming industries is relatively low when considering energy and environmental pollution. Therefore, the meaning of optimization and upgrading of industrial structure coincides with the green transformation of manufacturing industry, which can provide favorable conditions for the green transformation of manufacturing industry from a macro level.
3.4 The role of energy structure
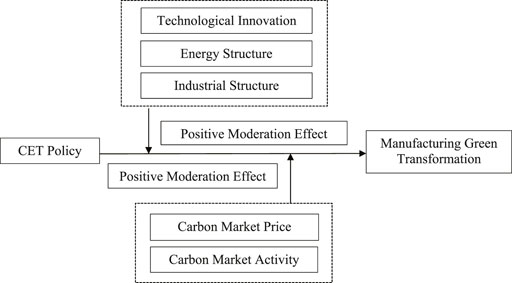
The endowment hypothesis holds that energy or pollution-intensive products are generally capital-intensive products, and developed regions often have a comparative advantage in producing them, and the CET policy will offset this comparative advantage and realize the rational use of fossil energy by adjusting the factor endowment structure. The main source of CO2 is the combustion of fossil fuels. Coal is the energy with the highest proportion of consumption in China. The CET policy will increase the consumption cost of fossil energy, which will affect the proportion of coal consumption, thereby controlling the excessive composition of the energy consumption proportion of enterprises. The energy structure is closely related to regional pollution (Ma and Zhang, 2014), the optimization of energy structure means the improvement of energy utilization efficiency, and the development of clean energy will also promote economic growth and CO2 emission reduction (Xu et al., 2019). The green adjustment of energy structure plays an important role in the influence of CET policy on the green transition of manufacturing industry, mainly because of the following reasons: First, the improvement of energy efficiency is an effective solution to the high energy consumption and high emissions of the traditional manufacturing industry. China’s traditional manufacturing industry still occupies a large proportion, which is highly dependent on energy and causes huge damage to the environment. However, it is difficult to completely transform the traditional manufacturing industry, mainly because of the employment and economic development issues. Therefore, improving the energy efficiency of the traditional manufacturing industry can reduce energy consumption and pollution emissions, and provide a transition and foundation for the transformation of traditional manufacturing industries. Second, the development and utilization of new energy and clean energy itself belong to the development of high-tech industries, which can effectively promote the advanced development of the overall industry. Further, the development and utilization of new energy and clean energy can also provide effective relief for the current energy demand of other industries, break the resource constraints of the optimization and upgrading of the industrial structure in the current economic operation, and play a good role in environmental protection. Therefore, the mechanism of CET policy for the green transformation of the manufacturing industry is shown in Figure 2.
4 Methodology
4.1 Measurement of green total factor productivity in manufacturing industry
The data envelopment analysis (DEA) proposed by Charnes et al. (1978) is mostly used to evaluate the relative efficiency of decision-making units (DMUs) with multiple inputs and outputs. The traditional DEA model does not consider the slackness of input and output. To solve this problem, Tone (2001) proposed a non-radial DEA model based on slack variables, namely the SBM model. Further, Tone (2002) proposed an SBM model with undesired outputs. However, the SBM model cannot sort multiple effective DMUs, so Tone (2002) proposed a super-efficient SBM model to solve the efficiency values of all DMUs. This paper uses the super-efficiency SBM model with the undesired output because it needs to consider pollution emissions. The specific equation is as follows,
In Eq. 1,
To better measure the changes in the green transformation of manufacturing industry, this paper combines the Global Malmquist-Luenberger (GML) productivity index based on the super-efficiency SBM model. Since the industrial enterprises in each province are quite different, it is assumed that the returns to scale are variable. The specific equation is as
where
The GML productivity index indicates the change of GTFP. The GML productivity index greater than one indicates that the GTFP has increased, which means the green transition of manufacturing is on the rise. On the contrary, the GML productivity index is less than one indicating that the GTFP has declined, which means that the green transformation of manufacturing industry has not been successful.
4.2 Policy evaluation model
Difference-in-differences (DID) are mainly used to evaluate policy effects. The rationale is based on a counterfactual framework to assess changes in the observed factor y when the policy occurs and when it does not. For each individual i, its corresponding index y can be expressed by the following formula:
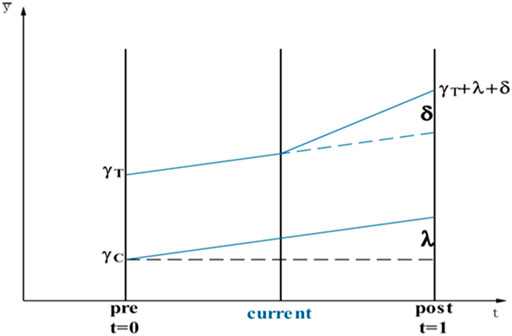
where t represents the time s (i) represents the group, namely the treatment group and the control group, γs (i) represents the magnitude before the policy intervention, λt represents the natural change before and after the intervention, and δ represents the change brought by policy intervention, I(…) is the indicator function. Meanwhile, DID can be expressed as the following equation:
Figures 3, 4 reports the principle of the DID model, where γT and γC represent the initial magnitudes of the treatment group and the control group before policy interference, the λ represents the part of the increment that is not generated by only changing with time and not by policy interference, the δ represents the increment caused by policy interference. Before policy interference, the magnitudes of the treatment group and the control group have the same trend, so satisfying the parallel trend assumption is a necessary condition for using the DID model.
The DID method is one of the most commonly used methods for evaluating policy effects. On the premise that the treatment group and the control group satisfy the parallel trend assumption, it can measure the average treatment effect of the treatment group before and after the policy. Since China’s CET markets in the eight pilot areas were officially launched at different times4, this paper adopts the multi-period DID method to evaluate the impact of the CET policy on the green transition of manufacturing industry. The specific equation is as follows,
In Eq. 6, Yit is the GTFP representing the degree of green transformation of manufacturing industry in region i in period t, Xit is the control variable, including the trade dependence (TD), transportation infrastructure level (TI), environmental protection investment (EPI) and logistics level (LL); ui represents the regional fixed effect, vt represents the time-fixed effect; εit represents the error term; didit is a dummy variable that is 1 when the region is a pilot province and has implemented the CET policy, and 0 otherwise. The β1 is the core coefficient that represents the effect of CET policy. If the β1 is positive, which means that the CET policy will help promote the green transformation of manufacturing industry, otherwise, it will slow down the green transformation of manufacturing industry.
4.3 Variable selection and data
This paper uses GTFP as the dependent variable, which is calculated by MATLAB software through the global Malmquist-Luenberger (GML) productivity index based on the SBM-DEA method. The selection of indicators is as follows:
Input indicators: capital, labor, and energy. Firstly, the net value of fixed assets investment in manufacturing industry to measure capital, which is calculated using the perpetual inventory method with 2006 as the base period. Secondly, the average annual number of workers in manufacturing industry to measure labor input. Thirdly, the converted standard coal consumption is used to measure the energy input.
Output indicators: including desired and undesired output. Referring to the research results of Du et al. (2019), the desired output is measured by the business revenue (deflated by the ex-factory price index for industrial products with 2006 as the base period) of industrial enterprises above state-designated scale. The undesired outputs include industrial CO2 emissions, Chemical Oxygen Demand (COD) emissions, and solid waste emissions, among them, CO2 emissions are estimated regarding the research of Chen (2009).
The selection and measurement indicators of each variable in this paper are as Table 1:
This paper constructs panel data of 30 provinces in China from 2006 to 2019, which excludes Tibet, Hong Kong, Macao, and Taiwan because of the lack of data. The data from the “China Energy Statistical Yearbook”, “China Environmental Statistical Yearbook”, “China Industrial Statistical Yearbook”, and “China Statistical Yearbook”. The missing data were filled using the linear interpolation method. To reduce the influence of heteroscedasticity, this paper adopts logarithmic processing for all non-dummy variables. Additionally, since the “China Industrial Statistical Yearbook” changed its statistical caliber in 2008, considering the availability of data and the consistency of the statistical caliber, this paper selects 21 industrial sub-sectors to represent various indicators of manufacturing industry and divides them into high-energy-consuming industries and low-energy-consuming industries5. In addition, to narrow the absolute difference between the data and avoid the possibility of insignificant due to some variables changing around 0, referring to the research of Ren et al. (2020) and Xie et al. (2017), the control variables were all natural logarithmic.
5 Results and discussion
5.1 Regression results
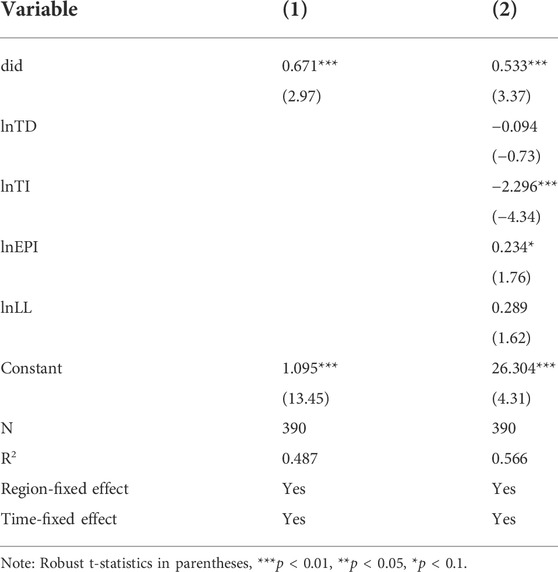
Table 2 reports the regression results for the policy evaluation, which shows that the coefficient of did is significantly positive at the 1% level regardless of controlling other variables, indicating the implementation of the CET policy is conducive to improving the degree of green transformation of manufacturing industry in the pilot area. In control variables, the coefficient of TD is negative but not significant, indicating that trade may hurt the green transformation of manufacturing industry. The reason is that China’s labor-intensive manufacturing industry has still not gotten rid of the characteristics of low technology, and has formed a low-price competitive advantage in exports, which is not conducive to the green technology innovation and production model optimization of manufacturing industry, and thus is not conducive to the green transformation of manufacturing industry (Peng and Li, 2015), and although the proportion of carbon-intensive products in manufacturing exports has declined, the embedded carbon of exported products has increased (Wu and Guo, 2021), which may also lead to adverse effects on the green transition of manufacturing. The coefficient of the TI is significantly negative, indicating that the construction of transportation infrastructure harms the green transformation of manufacturing industry. The traditional infrastructure construction cost and resource consumption are high. The production industry of building materials based on steel bars and concrete is often high in energy consumption and pollution. Large-scale traditional infrastructure will increase the demand for highly polluting manufacturing products, which will adversely affect the green transformation of manufacturing (Andrew, 2018). The coefficient of EPI is significantly positive, indicating that the government’s emphasis on energy conservation and environmental protection has a positive impact on manufacturing industry’s green transformation. The coefficient of LL is positive but not significant, which does not indicate that the logistics level has had a positive impact on the green transformation of manufacturing industry.
5.2 Parallel trend test
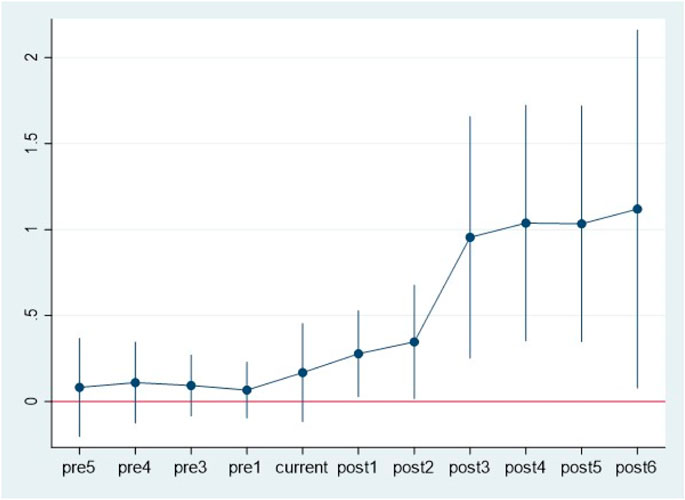
Satisfying the parallel trend condition is the premise of using the DID model to estimate, that is, the trends of the treatment and the control group are similar before the implementation of the CET policy. This paper uses the interaction term of the year dummy variable and the treatment group dummy variable as the independent variable to construct the model as follows, referring to the research of Gao et al. (2020), this study constructs the following model to test the parallel trends,
In Eq. 5, D is the interaction term of the year dummy variable and the policy dummy variable, in which Dpre_i, Dcurrent, and Dpost_i represent the interaction term of the policy dummy variable before, during, and after the CET policy is officially launched. βpre_i, βcurrent, and βpost_i are the corresponding coefficients. When β is not significant, indicating the trend of the degree of green transition in manufacturing industry is similar before the implementation of CET policy, so the DID model satisfies the parallel trend assumption. Figures 3, 4 reports the results of the parallel trend test, which shows that the estimated coefficient of the dummy variable D is around 0 before the implementation of the CET, and the confidence interval of the coefficient includes 0, which is not significant at a 5% significance level. The coefficient of the dummy variable D in the later period of the CET policy is significantly positive at the 5% significance level and increased significantly, which indicates that the CET policy has a significant role in promoting the green transformation of manufacturing industry. Further, the CET policy has significantly improved the promotion effect of the green transformation of manufacturing industry after the third year, which may be related to the gradual improvement of the market construction level in the pilot areas.
5.3 Robustness test
5.3.1 Placebo test
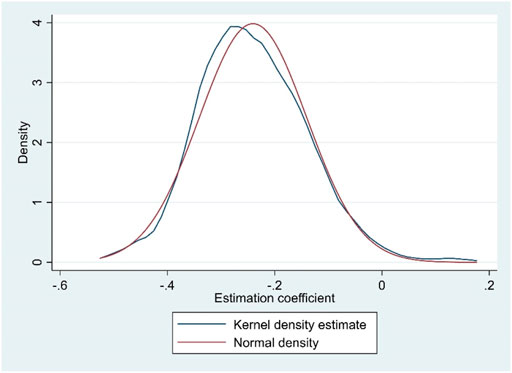
To enhance the robustness of the estimated result, a placebo test was also performed in this paper, which is conducted by randomly shuffling the existing treatment and the control group to determine whether the impact of CET policy on the degree of green transition in manufacturing industry is caused by other random factors (Gao et al., 2020). This paper randomly selects seven treatment groups from 30 provinces, and the remaining provinces are used as control groups. Then, re-estimate by Eq. 6 and repeat the process 500 times. Figure 5 reports the results of the placebo test, which shows that the coefficient of did is mainly distributed around −0.2, which is significantly different from the actual regression coefficient (0.533), indicating that the CET policy can improve the degree of green transformation of manufacturing industry, excluding the influence of other random factors on the empirical results.
5.3.2 Propensity score matching-difference-in-differences
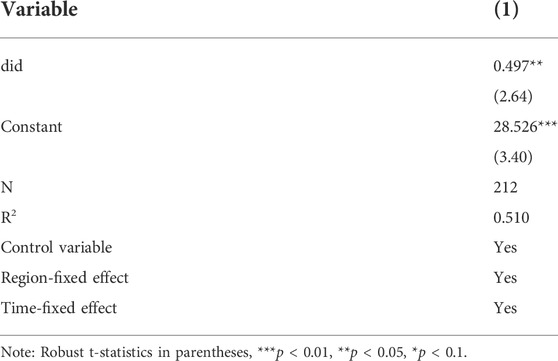
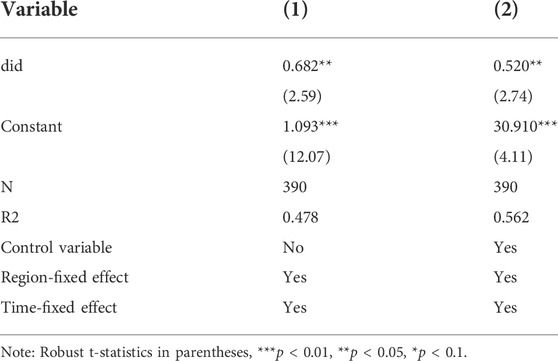
Although the carbon trading policy can significantly promote the green transformation of manufacturing, the effect of this policy may be affected by the choice of pilot areas. For example, the level of carbon emissions in a province may have an impact on the final result, so we choose to use the propensity score matching method to reduce the impact of data bias and confounding variables (Hu et al., 2020). This paper adopts the propensity score matching (PSM) method to match the control variables in Eq. 6 year by year and exclude samples outside the common value range to enhance the similarity between the treatment and control groups. The remaining sample is re-estimated by Eq. 6. Table 3 reports the results of PSM-DID, which shows that the coefficient of the did is still positive at the 5% significance level, indicating the robustness of the results in this paper is further strengthened.
5.3.3 Exclude other concurrent policies interference
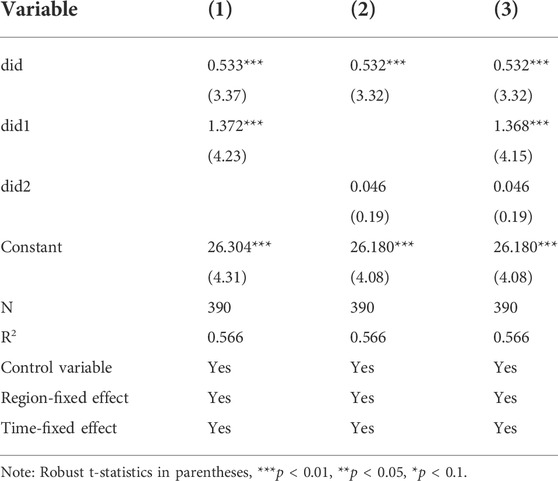
Referring to the study by Hu et al. (2020), we discuss two factors that may have an impact on the effectiveness of the carbon CET policy. Other related concurrent policies may also have an impact on the green transformation of manufacturing industry in the pilot area, thereby disrupting the policy effect of the CET policy. For example, the environmental protection negotiation policy started in 2014 and the energy use rights trading pilot policy started in 2017 may all affect the green transformation level of manufacturing industry in the pilot areas. This paper uses the following model based on Eq. 6 to exclude the interference of the above policies,
In Eq. 6, did1it and did2it are the dummy variable that represents the environmental protection interview policy and the energy-use rights trading pilot policy, respectively. If region i is affected by the policy in year t, the corresponding dummy variable is 1. Otherwise, the value is 0. Table 4 reports the results of excluding other concurrent policies interference, which shows that the CET policy still has a significant promoting effect on the green transformation of manufacturing industry in the pilot areas. Therefore, the effect of the CET policy is further verified.
5.3.4 Change the timing of carbon emissions trading policy implementation
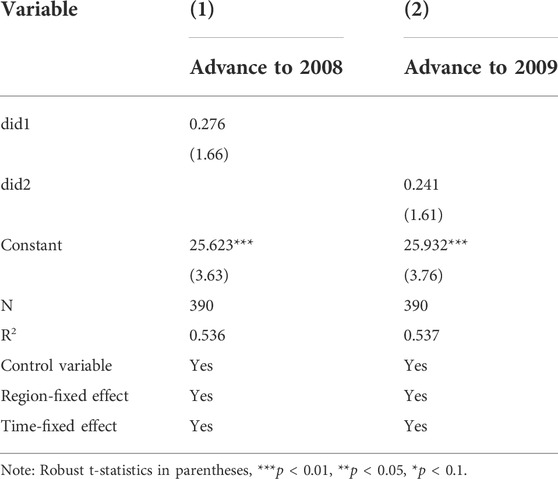
Referring to the study by Shao et al. (2019), we adopt the counterfactual experiments for the robustness test. Specifically, this paper advances the implementation of CET policy to 2008 and 2009 as a counterfactual experiment and re-estimated by Eq. 6. Table 5 reports the results of changing the timing of policy implementation, which shows that whether the policy is advanced to 2008 or 2009, the coefficient of the did is not significant, indicating the fictitious policy does not have an impact on the green transformation of manufacturing industry in the pilot areas, which proves the robustness of the basic regression results.
5.3.5 Surrogate index test
Referring to the research of Cai et al. (2020) and Xie et al. (2017), this paper adopts another method to measure green total factor productivity. Specifically, changing the assumption that returns to scale are variable to constant, this paper again This paper uses the Global Malmquist-Luenberger (GML) productivity index based on the super-efficiency SBM model to recalculate GTFP, and re-estimate the results by Eq. 6. Tables 6, 7 reports the results of the surrogate index test, which show that the CET policy has had an impact on the green transition of manufacturing industry, indicating the conclusions of this paper are robust.
6 Mechanism analysis
6.1 Traditional mechanism analysis
This paper will explore the mechanism by which the CET policy has contributed to the green transition of manufacturing. Traditionally, technological innovation, energy structure, and industrial structure will play a role in the process of CET policy affecting the green transformation of manufacturing industry. If the above mechanism is established, the GTFP of pilot areas with higher technical levels, greener energy structure, and industrial structure will be improved more after the implementation of the CET policy, thereby accelerating the green transformation process of manufacturing industry. This paper adopts the following model to verify this mechanism,
Equation 7 introduces a new variable Mit based on Eq. 6. Mit includes technological innovation (Techit), energy structure (ESit), and industrial structure (ISit). Techit measures the technical level of each province, ESit measures the cleanliness of the energy structure in each province, and ISit measures the green degree of the industrial structure in each province. The smaller these variables, indicating the higher the level of technology, the higher the proportion of clean energy used, and low-energy industries have a larger proportion.
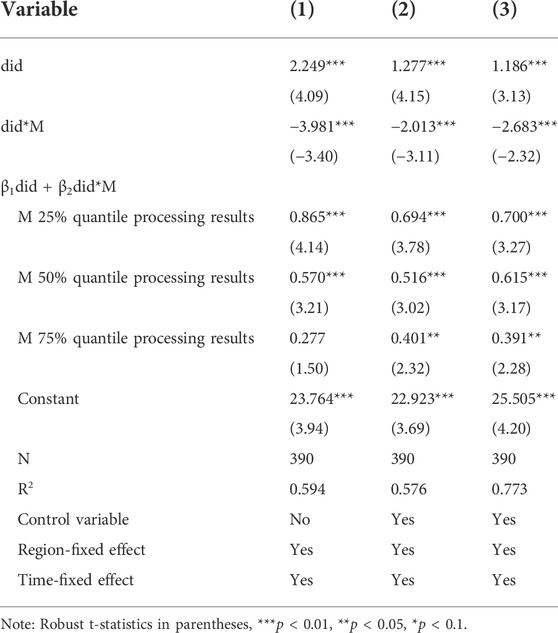
Tables 6, 7 reports the results of the mechanism analysis, which shows that the coefficient of didit is significantly positive, while the coefficient of interaction term didit*Mit is significantly negative, which indicates that the higher the level of technological innovation, the cleaner the energy structure, and the higher the green level of the industrial structure, the greater the impact of CET policy on the green transformation of manufacturing industry. Moreover, at different quantile levels, with the improvement of the level of technological innovation, the cleaning of energy structure, and industrial structure green level, the promoting effect of the CET policy on the green transformation of manufacturing industry continues to increase. Therefore, this means that the traditional mechanism analysis holds, and it also means that areas with a higher level of development need to take greater responsibility for environmental problems.
Additionally, many scholars have verified these traditional mechanisms. Regarding the traditional mechanism of technological innovation. (Cai et al., 2020), Zhang et al. (2017) and Hamamoto (2006) all confirmed similar views, and Jiang et al. (2022) also believed that the use of new technologies can increase the competitiveness of carbon trading companies. However, some studies put forward the opposite view, Usman and Radulescu (2022) believe that technological innovation and the use of non-renewable energy greatly reduce environmental sustainability. Regarding the traditional mechanism of energy structure, Usman et al. (2022b) believed that the increase in energy consumption will have a positive impact on economic growth, while the impact of non-renewable energy and renewable energy on the ecological environment is completely different. The use of energy can cause damage to the environment, while the utilization of renewable energy can help to overcome environmental degradation (Usman et al., 2021). Regarding the traditional mechanism of industrial structure. Tian et al. (2018) pointed out that “metal smelting and rolling” and other energy-intensive sectors are the main sources of carbon emissions in manufacturing industry, and the implementation of carbon trading policies have significantly reduced the “chemical raw materials and chemical products manufacturing”, “non-ferrous metal smelting and rolling processing industry” (Li and Jia, 2016).
6.2 Further assessment
The promotion of GTFP by the CET policy may also be affected by market mechanisms outside of traditional mechanisms. Therefore, this paper constructs the following model to test the extent to which the green transformation of manufacturing industry in the pilot areas is affected by the market mechanism,
In Eq. 8, variable M1it is to measure the operation of the CET market, which is the carbon emission trading price (CETP), and the activity of the carbon emission trading market (CMA) in the pilot area, the rest of the variables are consistent with Eq. 6.
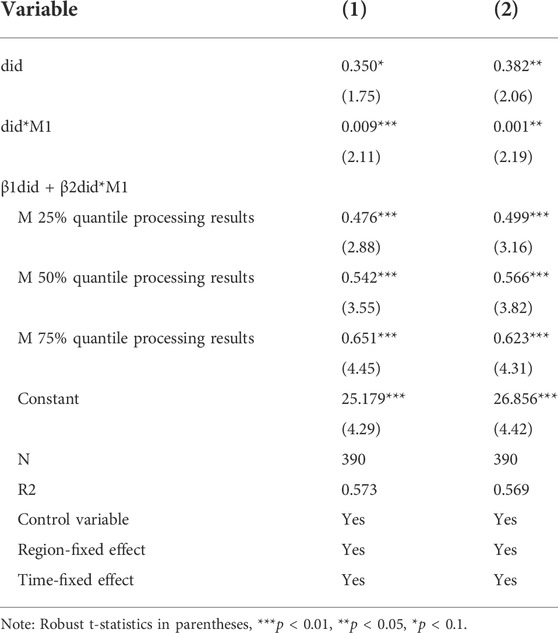
Table 8 reports the results of the further mechanism analysis, which shows that the coefficient of didit and interaction term didit*M1it are significantly positive, which indicates that the higher carbon emission trading prices and more active carbon emission trading markets, the greater the impact of CET policy on the green transformation of manufacturing industry. Moreover, at different quantile levels, with the improvement of the carbon emission trading prices and activity of the carbon emission trading market, the promoting effect of the CET policy on the green transformation of manufacturing industry continues to increase. A reasonable carbon price is essential to play a market mechanism and mitigate global warming, and a sufficiently high carbon price is a necessary adjustment to achieve environmental innovation (Nordhaus, 2011). Therefore, this also verifies that the market mechanism is an important factor affecting the CET policy in promoting GTFP.
7 Conclusion and enlightenment
To ensure that the dual carbon goals are achieved as scheduled, China’s manufacturing industry needs to continue its green transformation. The CET policy is an important exploration of using market tools to promote the low-carbon development of the industry, which is of great significance to promoting the green transformation of China’s manufacturing industry. This paper employs the global Malmquist-Luenberger (GML) productivity index based on the SBM-DEA method to calculate the GTFP covering manufacturing industry of 30 Chinese provinces between 2006 and 2019. Then, the DID model is constructed to empirically study the direct impact and mechanism assessment of CET policy on the GTFP. This paper mainly finds the following conclusion. First, The GTFP of China’s manufacturing industry continued to increase, which shows that the extensive growth mode of China’s manufacturing industry has been improved. Second, the implementation of the CET policy has a significant positive impact on the GTFP of China’s manufacturing industry, which proves that the CET policy can promote the green transformation of China’s manufacturing industry. Our results are robust despite rerunning the estimation using different methods and proxies. In addition, government investment in environmental protection has a positive impact on promoting the green transformation of China’s manufacturing industry. Third, through mechanism analysis, this paper finds that the promoting effect of CET policy on the green transformation of manufacturing industry is mainly affected by technological innovation, optimization of industrial structure, and energy structure. The higher the technology, the greener the industrial structure, and the cleaner the energy structure, and the more significant the CET policy will promote the green transformation of manufacturing industry. Further, this paper also finds that higher carbon prices and more active carbon markets can also significantly increase the positive effect of the CET policy.
Given this, this paper proposes the following policy recommendations. First, policymakers should promote the sharing of experience in the construction of the CET market. The governments and enterprises in the pilot provinces should actively promote their experience in participating in the construction of the CET market. Help other provinces in China adapt and participate in the construction of the CET market as soon as possible, so that advanced production technologies and production models can be more widely used, thereby accelerating the process of green transformation of China’s manufacturing industry. Second, accelerate the promotion of technological innovation. The government should increase investment in environmental protection and use part of the funds raised by the CET market to set up special funds to transform high-emission areas and industries, and improve enterprises’ innovative production models or technologies, thereby improving resource utilization efficiency. Third, increase the use of clean energy. The government should accelerate the construction of hydropower, wind power, and solar power generation equipment, and promote the development and utilization of new energy. Besides, the world is facing an energy shock, governments should adopt price subsidies for the use of clean energy to alleviate the changes in energy structure caused by energy price fluctuations. Fourth, promote the optimization of industrial structure. The above results show that adjusting the industrial structure can effectively promote the green transformation of manufacturing industry. Therefore, the government needs to pay attention to the importance of adjusting the industrial structure. The government can appropriately increase support for low-energy-consuming industries. Moreover, the government needs to reduce the export and investment of energy-intensive industries such as steel and chemical industries. In addition, the government could consider imposing a carbon tax on energy-intensive industries. Finally, the government should designate a reasonable total amount and allocation method for carbon emission permits. If the total amount of carbon emission permits in the market is too large, the price of permits will be too low, and the CET policy will not be able to give full play to the restraint effect of the carbon market on the carbon emissions of enterprises. On the contrary, it will lead to a high price of permits, which will greatly increase the emission reduction pressure of enterprises that have not yet introduced green technologies or have increased energy consumption due to scale expansion. Therefore, the national carbon emission reduction target and the actual carbon emissions of the industries included in the carbon trading system should be comprehensively considered by policymakers to prevent the total amount of carbon emission permits from being excessively disconnected from market demand. In terms of the allocation of carbon emission permits, the method of paid allocation should be gradually introduced to improve the allocation efficiency of permits and better guide the transformation of the industrial structure of manufacturing industry from high energy consumption to low energy consumption.
8 Research limitations and outlook
This paper explores the impact of China’s CET pilot policy on the green transformation of manufacturing, and conducts an extended analysis of its impact mechanism, enriching research in related fields. However, this study also has certain limitations. First, the green transformation of the industry is a long-term process, limited by the availability of data. This study only analyzes the indicators 5 years after the launch of the carbon emissions trading market. The industry transformation should be viewed over a longer period. Upgrade effect. Second, the green transformation of manufacturing industry is a systematic project, and the impact mechanism of environmental policies on the green transformation of manufacturing industry is quite complex. Angles are discussed, and other potential paths remain to be identified. Follow-up research can continue to improve other action paths and clarify the weights of various paths in the green transformation of manufacturing. Third, this paper only analyzes the impact of environmental policies on the green transition of manufacturing from the macro level but does not analyze the impact of carbon trading policies on each sub-sector of manufacturing industry, and research at the sub-industry level needs to be further explored.
Data availability statement
Publicly available datasets were analyzed in this study. This data can be found here: https://data.cnki.net/Yearbook/Navi?type = type&code = A.
Author contributions
ZZ and ZM contributed to study design and draft writing. XL and ZM contributed to data analysis and visualization of results. ZZ and XL contributed revisions and proofreading. ZZ is in charge of fund acquisition. All authors reviewed the final version of the manuscript and approved it for publication.
Funding
This research was funded by the National Social Science Foundation of China (No.19BJY104).
Conflict of interest
The authors declare that the research was conducted in the absence of any commercial or financial relationships that could be construed as a potential conflict of interest.
Publisher’s note
All claims expressed in this article are solely those of the authors and do not necessarily represent those of their affiliated organizations, or those of the publisher, the editors and the reviewers. Any product that may be evaluated in this article, or claim that may be made by its manufacturer, is not guaranteed or endorsed by the publisher.
Footnotes
1“The 14th Five-Year Plan for National Economic and Social Development of the People’s Republic of China and Outline of the Vision for 2035”. http://www.kzlz.gov.cn/P/C/5352.htm.
2http://www.gov.cn/zhengce/2021-10/24/content_5644613.htm.
3In this paper, all the provinces represent China’s provinces (autonomous regions, municipalities).
4The treatment group is the area where the CET policy has been implemented, including Beijing, Tianjin, Hubei, Guangdong, Shanghai, Chongqing, and Fujian (merger Shenzhen into Guangdong), The control group was other area in China. Among them, the CET market of Shenzhen and Beijing were officially launched in June and November 2013, the CET market of Tianjin, Guangdong, and Shanghai were officially launched in December 2013, and the CET market of Hubei and Chongqing were launched in April and June 2014, the CET market of Fujian was officially launched in December 2016, respectively.
5Low-energy-consuming industries: agricultural and sideline food processing industry, food manufacturing industry, beverage manufacturing industry, tobacco product industry, textile industry, textile and clothing, shoe and hat manufacturing, paper and paper product industry, pharmaceutical manufacturing, chemical fiber manufacturing, Metal products industry, general equipment manufacturing, special equipment manufacturing, transportation equipment manufacturing, electrical machinery and equipment manufacturing, communication equipment, computer and other electronic equipment manufacturing, instrumentation and cultural, office machinery manufacturing.High energy-consuming industries: petroleum processing, coking and nuclear fuel processing industries, chemical raw materials and chemical products manufacturing, non-metallic mineral products industry, ferrous metal smelting and rolling processing industry, non-ferrous metal smelting and rolling processing industry.
References
Andrew, R. M. (2018). Global CO<sub>2</sub> emissions from cement production. Earth Syst. Sci. Data 10 (1), 195–217. doi:10.5194/essd-10-195-2018
Anger, A. (2010). Including aviation in the European emissions trading scheme: Impacts on the industry, CO2 emissions and macroeconomic activity in the EU. J. Air Transp. Manag. 16 (2), 100–105. doi:10.1016/j.jairtraman.2009.10.009
Arto, I., and Dietzenbacher, E. (2014). Drivers of the growth in global greenhouse gas emissions. Environ. Sci. Technol. 48 (10), 5388–5394. doi:10.1021/es5005347
Bayer, P., and Aklin, M. (2020). The European Union emissions trading system reduced CO2 emissions despite low prices. Proc. Natl. Acad. Sci. U. S. A. 117 (16), 8804–8812. doi:10.1073/pnas.1918128117
Bel, G., and Joseph, S. (2015). Emission abatement: Untangling the impacts of the EU ETS and the economic crisis. Energy Econ. 49, 531–539. doi:10.1016/j.eneco.2015.03.014
Borghesi, S., Cainelli, G., and Mazzanti, M. (2015). Linking emission trading to environmental innovation: Evidence from the Italian manufacturing industry. Res. Policy 44 (3), 669–683. doi:10.1016/j.respol.2014.10.014
Cai, W., Lai, K.-h., Liu, C., Wei, F., Ma, M., Jia, S., et al. (2019). Promoting sustainability of manufacturing industry through the lean energy-saving and emission-reduction strategy. Sci. Total Environ. 665, 23–32. doi:10.1016/j.scitotenv.2019.02.069
Cai, X., Zhu, B., Zhang, H., Li, L., and Xie, M. (2020). Can direct environmental regulation promote green technology innovation in heavily polluting industries? Evidence from Chinese listed companies. Sci. Total Environ. 746, 140810. doi:10.1016/j.scitotenv.2020.140810
Calel, R., and Dechezleprêtre, A. (2016). Environmental policy and directed technological change: Evidence from the European carbon market. Rev. Econ. statistics 98 (1), 173–191. doi:10.1162/REST_a_00470
Charnes, A., Cooper, W. W., and Rhodes, E. (1978). Measuring the efficiency of decision making units. Eur. J. operational Res. 2 (6), 429–444. doi:10.1016/0377-2217(78)90138-8
Chen, S. (2009). Engine or drag: Can high energy consumption and CO2 emission drive the sustainable development of Chinese industry? Front. Econ. China 4 (4), 548–571. doi:10.1007/s11459-009-0029-9
Chen, S., and Golley, J. (2014). ‘Green’productivity growth in China's industrial economy. Energy Econ. 44, 89–98. doi:10.1016/j.eneco.2014.04.002
Clò, S., Ferraris, M., and Florio, M. (2017). Ownership and environmental regulation: Evidence from the European electricity industry. Energy Econ. 61, 298–312. doi:10.1016/j.eneco.2016.12.001
Du, L., Zhao, Y., Tao, K., and Lin, W. (2019). The compound effect of environmental regulation and governance transformation in enhaning green competitiveness. Econ. Res. J. 10, 106–120.
Duan, H., Mo, J., Fan, Y., and Wang, S. (2018). Achieving China's energy and climate policy targets in 2030 under multiple uncertainties. Energy Econ. 70, 45–60. doi:10.1016/j.eneco.2017.12.022
Feng, T., Sun, L., and Zhang, Y. (2009). The relationship between energy consumption structure, economic structure and energy intensity in China. Energy Policy 37 (12), 5475–5483. doi:10.1016/j.enpol.2009.08.008
Feng, Z., and Chen, W. (2018). Environmental regulation, green innovation, and industrial green development: An empirical analysis based on the Spatial Durbin model. Sustainability 10 (1), 223. doi:10.3390/su10010223
Gao, Y., Li, M., Xue, J., and Liu, Y. (2020). Evaluation of effectiveness of China's carbon emissions trading scheme in carbon mitigation. Energy Econ. 90, 104872. doi:10.1016/j.eneco.2020.104872
Govindaraju, V. C., and Tang, C. F. (2013). The dynamic links between CO2 emissions, economic growth and coal consumption in China and India. Appl. Energy 104, 310–318. doi:10.1016/j.apenergy.2012.10.042
Hamamoto, M. (2006). Environmental regulation and the productivity of Japanese manufacturing industries. Resour. energy Econ. 28 (4), 299–312. doi:10.1016/j.reseneeco.2005.11.001
Hu, Y., Ren, S., Wang, Y., and Chen, X. (2020). Can carbon emission trading scheme achieve energy conservation and emission reduction? Evidence from the industrial sector in China. Energy Econ. 85, 104590. doi:10.1016/j.eneco.2019.104590
Huang, R., and Chen, D. (2015). Does environmental information disclosure benefit waste discharge reduction? Evidence from China. J. Bus. Ethics 129 (3), 535–552. doi:10.1007/s10551-014-2173-0
Jiang, T., Song, J., and Yu, Y. (2022). The influencing factors of carbon trading companies applying blockchain technology: Evidence from eight carbon trading pilots in China. Environ. Sci. Pollut. Res. 29 (19), 28624–28636. doi:10.1007/s11356-021-18425-y
Li, H., and Qin, Q. (2019). Challenges for China's carbon emissions peaking in 2030: A decomposition and decoupling analysis. J. Clean. Prod. 207, 857–865. doi:10.1016/j.jclepro.2018.10.043
Li, K., and Lin, B. (2016). Impact of energy conservation policies on the green productivity in China’s manufacturing sector: Evidence from a three-stage DEA model. Appl. energy 168, 351–363. doi:10.1016/j.apenergy.2016.01.104
Li, W., and Jia, Z. (2016). The impact of emission trading scheme and the ratio of free quota: A dynamic recursive cge model in China. Appl. Energy 174, 1–14. doi:10.1016/j.apenergy.2016.04.086
Li, W., Zhang, Y.-W., and Lu, C. (2018). The impact on electric power industry under the implementation of national carbon trading market in China: A dynamic cge analysis. J. Clean. Prod. 200, 511–523. doi:10.1016/j.jclepro.2018.07.325
Lin, B., and Jia, Z. (2017). The impact of emission trading scheme (ets) and the choice of coverage industry in ets: A case study in China. Appl. Energy 205, 1512–1527. doi:10.1016/j.apenergy.2017.08.098
Liu, Y., Zhou, Y., and Wu, W. (2015). Assessing the impact of population, income and technology on energy consumption and industrial pollutant emissions in China. Appl. Energy 155, 904–917. doi:10.1016/j.apenergy.2015.06.051
Liu, Z., Deng, Z., He, G., Wang, H., Zhang, X., Lin, J., et al. (2022). Challenges and opportunities for carbon neutrality in China. Nat. Rev. Earth Environ. 3 (2), 141–155. doi:10.1038/s43017-021-00244-x
Ma, L., and Zhang, X. (2014). The spatial effect of China's haze pollution and the impact from economic change and energy structure. China Ind. Econ. (04), 19–31. doi:10.19581/j.cnki.ciejournal.2014.04.002
Martin, R., Muûls, M., and Wagner, U. J. (2014). The Impact of the EU ETS on Regulated Firms: What is the evidence after nine years? 31. Available at SSRN 2344376. doi:10.2139/ssrn.2344376
Mi, Z., Meng, J., Guan, D., Shan, Y., Song, M., Wei, Y.-M., et al. (2017). Chinese CO2 emission flows have reversed since the global financial crisis. Nat. Commun. 8 (1), 1712–1810. doi:10.1038/s41467-017-01820-w
Munnings, C., Morgenstern, R. D., Wang, Z., and Liu, X. (2016). Assessing the design of three carbon trading pilot programs in China. Energy Policy 96, 688–699. doi:10.1016/j.enpol.2016.06.015
Nordhaus, W. (2011). Designing a friendly space for technological change to slow global warming. Energy Econ. 33 (4), 665–673. doi:10.1016/j.eneco.2010.08.005
Oh, D.-h. (2010). A global Malmquist-Luenberger productivity index. J. Product. Anal. 34 (3), 183–197. doi:10.1007/s11123-010-0178-y
Pan, W., Pan, W., Hu, C., Tu, H., Zhao, C., Yu, D., et al. (2019). Assessing the green economy in China: An improved framework. J. Clean. Prod. 209, 680–691. doi:10.1016/j.jclepro.2018.10.267
Peng, X., and Li, B. (2015). Trade openness, FDI and green transformation of China's industrial: An empirical analysis based on dynamic panel threshold model using panel data. J. Int. Trade (01), 166–176. doi:10.13510/j.cnki.jit.2015.01.016
Ren, S., Hu, Y., Zheng, J., and Wang, Y. (2020). Emissions trading and firm innovation: Evidence from a natural experiment in China. Technol. Forecast. Soc. Change 155, 119989. doi:10.1016/j.techfore.2020.119989
Ren, S., Zheng, J., Liu, D., and Chen, X. (2019). Does emission trading system improve firm's total factor productivity? Evidence from Chinese listed companies. China Ind. Econ. 5 (05), 5–23. doi:10.19581/j.cnki.ciejournal.2019.05.001
Shao, S., Yang, Z., Yang, L., and Ma, S. (2019). Can China's energy intensity constraint policy promote total factor energy efficiency? Evidence from the industrial sector. Energy J. 40 (4). doi:10.5547/01956574.40.4.ssha
Shen, K., and Gong, J. (2011). Environmental pollution, technological progress and productivity growth in energy-intensive industries in China: Empirical study based on ETFP. China Ind. Econ. 12, 25–34. doi:10.19581/j.cnki.ciejournal.2011.12.003
Smale, R., Hartley, M., Hepburn, C., Ward, J., and Grubb, M. (2006). The impact of CO2 emissions trading on firm profits and market prices. Clim. Policy 6 (1), 31–48. doi:10.1080/14693062.2006.9685587
Speck, S., and Zoboli, R. (2017). The green economy in europe: In search for a successful transition, green economy reader. Springer, 141–160. doi:10.1007/978-3-319-38919-6_7
Tian, Y., Xiong, S., Ma, X., and Ji, J. (2018). Structural path decomposition of carbon emission: A study of China's manufacturing industry. J. Clean. Prod. 193, 563–574. doi:10.1016/j.jclepro.2018.05.047
Tone, K. (2001). A slacks-based measure of efficiency in data envelopment analysis. Eur. J. operational Res. 130 (3), 498–509. doi:10.1016/S0377-2217(99)00407-5
Tone, K. (2002). A strange case of the cost and allocative efficiencies in DEA. J. Operational Res. Soc. 53 (11), 1225–1231. doi:10.1057/palgrave.jors.2601438
Usman, M., Balsalobre-Lorente, D., Jahanger, A., and Ahmad, P. (2022a). Pollution concern during globalization mode in financially resource-rich countries: Do financial development, natural resources, and renewable energy consumption matter? Renew. Energy 183, 90–102. doi:10.1016/j.renene.2021.10.067
Usman, M., Jahanger, A., Makhdum, M. S. A., Balsalobre-Lorente, D., and Bashir, A. (2022b). How do financial development, energy consumption, natural resources, and globalization affect arctic countries' economic growth and environmental quality? An advanced panel data simulation. Energy 241, 122515. doi:10.1016/j.energy.2021.122515
Usman, M., Makhdum, M. S. A., and Kousar, R. (2021). Does financial inclusion, renewable and non-renewable energy utilization accelerate ecological footprints and economic growth? Fresh evidence from 15 highest emitting countries. Sustain. Cities Soc. 65, 102590. doi:10.1016/j.scs.2020.102590
Usman, M., and Makhdum, M. S. A. (2021). What abates ecological footprint in BRICS-T region? Exploring the influence of renewable energy, non-renewable energy, agriculture, forest area and financial development. Renew. Energy 179, 12–28. doi:10.1016/j.renene.2021.07.014
Usman, M., and Radulescu, M. (2022). Examining the role of nuclear and renewable energy in reducing carbon footprint: Does the role of technological innovation really create some difference? Sci. Total Environ. 841, 156662. doi:10.1016/j.scitotenv.2022.156662
Wang, J., Lv, K., Bian, Y., and Cheng, Y. (2017). Energy efficiency and marginal carbon dioxide emission abatement cost in urban China. Energy Policy 105, 246–255. doi:10.1016/j.enpol.2017.02.039
Wang, Y., Sun, X., and Guo, X. (2019). Environmental regulation and green productivity growth: Empirical evidence on the Porter Hypothesis from OECD industrial sectors. Energy Policy 132, 611–619. doi:10.1016/j.enpol.2019.06.016
Wu, X., and Guo, J. (2021). Tendency of embodied carbon change in the export trade of Chinese manufacturing industry from 2000 to 2015 and its driving factors, Economic Impacts and Emergency Management of Disasters in China. Springer, 673–700. doi:10.1007/978-981-16-1319-7_23
Xie, R.-h., Yuan, Y.-j., and Huang, J.-j. (2017). Different types of environmental regulations and heterogeneous influence on “green” productivity: Evidence from China. Ecol. Econ. 132, 104–112. doi:10.1016/j.ecolecon.2016.10.019
Xu, B., Chen, Y., and Shen, X. (2019). Clean energy development, carbon dioxide emission reduction and regional economic growth. Econ. Res. J. 7 (07), 188–202.
Yang, Z., Shao, S., Yang, L., and Miao, Z. (2018). Improvement pathway of energy consumption structure in China's industrial sector: From the perspective of directed technical change. Energy Econ. 72, 166–176. doi:10.1016/j.eneco.2018.04.003
Ye, P. (2022). Policy effects of ecological red lines on industrial upgrading and health promotion: Evidence from China based on DID model. Front. Public Health 10, 844593. doi:10.3389/fpubh.2022.844593
Ye, P., Xia, S., Xiong, Y., Li, Y., and Chen, L. (2022). Can the natural resources capitalization contribute to the achievement of carbon neutrality? A pilot experiment evidence from China. Front. Environ. Sci. 48. doi:10.3389/fenvs.2022.831840
Yu, S., Zheng, S., Li, X., and Li, L. (2018). China can peak its energy-related carbon emissions before 2025: Evidence from industry restructuring. Energy Econ. 73, 91–107. doi:10.1016/j.eneco.2018.05.012
Yu, Y., Jiang, T., Li, S., Li, X., and Gao, D. (2020). Energy-related CO2 emissions and structural emissions’ reduction in China’s agriculture: An input–output perspective. J. Clean. Prod. 276, 124169. doi:10.1016/j.jclepro.2020.124169
Yu, Y., Li, S., Sun, H., and Taghizadeh-Hesary, F. (2021). Energy carbon emission reduction of China’s transportation sector: An input–output approach. Econ. Analysis Policy 69, 378–393. doi:10.1016/j.eap.2020.12.014
Yuan, B., and Xiang, Q. (2018). Environmental regulation, industrial innovation and green development of Chinese manufacturing: Based on an extended CDM model. J. Clean. Prod. 176, 895–908. doi:10.1016/j.jclepro.2017.12.034
Zhai, X., and An, Y. (2020). Analyzing influencing factors of green transformation in China’s manufacturing industry under environmental regulation: A structural equation model. J. Clean. Prod. 251, 119760. doi:10.1016/j.jclepro.2019.119760
Zhang, N., and Zhang, W. (2019). Can energy quota trading achieve win-win development for economic growth and energy saving in China? Econ. Res. J. 1 (01), 165–181.
Zhang, Y.-J., Peng, Y.-L., Ma, C.-Q., and Shen, B. (2017). Can environmental innovation facilitate carbon emissions reduction? Evidence from China. Energy Policy 100, 18–28. doi:10.1016/j.enpol.2016.10.005
Keywords: carbon emissions trading policy, green transformation, mechanism assessment, DID model, manufacturing industry
Citation: Zhou Z, Ma Z and Lin X (2022) Carbon emissions trading policy and green transformation of China’s manufacturing industry: Mechanism assessment and policy implications. Front. Environ. Sci. 10:984612. doi: 10.3389/fenvs.2022.984612
Received: 02 July 2022; Accepted: 09 August 2022;
Published: 15 September 2022.
Edited by:
Atif Jahanger, Hainan University, ChinaReviewed by:
Penghao Ye, Hainan University, ChinaMuhammad Usman, Wuhan University, China
Yang Yu, Hainan University, China
Copyright © 2022 Zhou, Ma and Lin. This is an open-access article distributed under the terms of the Creative Commons Attribution License (CC BY). The use, distribution or reproduction in other forums is permitted, provided the original author(s) and the copyright owner(s) are credited and that the original publication in this journal is cited, in accordance with accepted academic practice. No use, distribution or reproduction is permitted which does not comply with these terms.
*Correspondence: Xinwen Lin, bHluZG9uMTM3OTVAZ21haWwuY29t
 Zheng Zhou1
 Xinwen Lin