 Yang Zhang
 Yang Yang1,2
- 1College of Urban Economics and Public Administration, Capital University of Economics and Business, Beijing, China
- 2Beijing Key Laboratory of Megaregions Sustainable Development Modelling, Beijing, China
- 3China Center for Urban Development, Beijing, China
With the long-term impact of economic globalization, the accelerated cross-border flow of resource elements between cities is increasingly important for the development of urban regions. In this context, the central place theory, which emphasizes the vertical hierarchical relationship between cities, has obvious limitations in interpreting urban interaction. This paper takes the Beijing Tianjin Hebei Urban Agglomeration (including Beijing, Tianjin. and 11 prefecture-level cities in Hebei Province) as the research object, constructs three complex networks of economy, information, and economic information coupling connection, and analyzes the resilience of the network structure. The research results show that: 1) The spatial distribution of the three network structures of Jing-Jin-Ji Urban Agglomeration presents a spatial pattern with Beijing as the core and radiating outward. 2) In terms of weighted degree distribution, Beijing, as an arrow city, has strong competitiveness in the economy and information network, but the hierarchy of cities with balanced information economy development is low. 3) In terms of weighted degree correlation, among the three networks, the cities with a high weighted degree prefer to connect with cities with a low weighted degree, and the mismatch is ranked as information network > information economy coupling network > economic connection network. 4) In terms of network transmission, information network > economy connection network > information economy coupling network, and Beijing and Tianjin have a greater impact. The above results have strong guidance and practical significance for the formulation and adjustment of territorial spatial planning and regional optimization.
1 Introduction
1.1 Background
Modern cities are regarded as resources and springboards to connect and participate in the global economy. They are laboratories of globalization in space, economy, society, culture, and environment. Urban revitalization and growth coexist with urban stagnation and recession. Driven by globalization and the revolution of information technology, many cities have separated from the track of national economic development and connected into horizontal economic networks, thus reshaping and process of globalization (Cohen, 2001; Hanssens et al., 2013; Pereira and Derudder, 2010). Since the 1960’, the research on world urban has experienced three stages: world urban research with “attributes but no relationship,” world urban research in the network society, and world urban network research. In the first two stages, node cities are studied based on urban attribute data, and little attention is paid to the relationship between cities (Yang et al., 2011).
1.2 Literature review
(1) In terms of urban network construction, the current research mainly includes the following progress: Gordon, (2010) studied networks of cities in the world rather than “world cityness.” The study offered a “Southern” perspective on world city research, and it included places not ordinarily considered. Also, fourteen years of sample data on cross-border, intercity airline traffic were used as time-series relational information. The data reflect the links between the two principal cities of South Africa and other cities in Africa and beyond. Pereira and Derudder, (2010) believed that using air passenger flow data to measure and evaluate the world urban system is an effective method. Vinciguerra et al. (2010) modeled the evolution of infrastructure networks as a preferential attachment process. The average path length and average clustering coefficient of the observed network were successfully simulated. Arthur, (2010) employed techniques developed for the analysis of networks to evaluate more than 6,300 cities that are linked together by such firms in terms of their point centrality. Meanwhile, they adopted the block modeling technique to evaluate the positions occupied by these cities and the roles they play in the system. Hanssens et al. (2013) of the POLYMET project group built the Belgian city network in central Belgium. They used the office location of high-end producer services as the node of the network to measure the degree of network development with the multi-center index. Liu et al. (2014) explored the temporal evolution of cities and firms in a two-mode intercity corporate network formed by 50 leading advanced producer service firms across 154 cities for the years 2000 and 2010. In addition, from the perspective of spatial differences, the urban network structure was built with efficiency indicators such as urbanization efficiency, technological innovation efficiency, and green efficiency (Xing et al., 2018; Jing and Zhao, 2018), as well as city scale indicators such as night light data and urban construction land (Li et al., 2018; Yang et al., 2020). Moreover, based on the Baidu Index and other aspects, the urban service industry, transportation, logistics enterprises, economy, information, and other networks were established (Jabareen., 2013; Polèse., 2015). Frost and Podkorytova, (2018) adopted the interlocking network model proposed by the Globalization and World Cities research (GaWC) to the regional level to uncover the interurban relations, which focuses on the analysis of intraregional spatial patterns of globalization.
(2) In the research of urban network structure and network resilience
“Inclusive, safe, and resilient sustainable cities” is an important topic of sustainable development in 2030 of the United Nations (Pizzo, 2015). “Resilient cities” has become a goal of urban construction in China, and the research on the influencing factors of resilient cities has been carried out from the following aspects. Suzanne et al. studied urban resilience from economic, social, institutional, and other factors, and they believed that collaborative management and decentralization are two institutional management factors that can strengthen urban resilience (Hallie et al., 2017). Chad et al. (2018) studied the impact of disaster disturbance on urban resilience. They pointed out that urban resilience is affected by natural disasters such as climate change, natural disasters, resource crises, human disturbances, and human pressure. David et al. (2019) studied the impact of infrastructure on urban resilience, and the study suggested that the impact of an urban environment on urban resilience was mainly reflected in infrastructure, ecological environment, and other factors. Currently, there are two main directions in the study of urban network structure and network resilience.
I. In the evaluation of network structure resilience
At present, there is no unified method for evaluating network structure resilience. In English, both toughness and elasticity are translated as resilience, which refers to the stability and resilience of the system to maintain its original state under external impact. According to the concept of “structure determines function principle,” by taking the network as a physical phenomenon, the network topology parameters based on complex network theory are considered to have a key impact on resilience (Bombelli et al., 2020; Dixit et al., 2020). Vijaya et al. (2020) found that the enterprise supply chain network with the lowest density and centrality and the largest connectivity and network size has the highest resilience.
II. In terms of the resilience evaluation system
Hudec et al. (2018) investigated the differences in urban resilience in Slovakia in response to the financial crisis from three dimensions and 12 indicators of economic, social, and community management capabilities. Moser et al. (2019) constructed an index system from the perspective of nature, society, politics, human resources, economy, and capital. Noura et al. (2020) pointed out that urban resilience is determined by physical, ecological, and socio-economic factors. Cutter et al. (2014) selected 27 regional resilience evaluation indicators from the five dimensions of society, economy, infrastructure, institutions, and environment.
1.3 Research questions
With the rapid development of economy, science, and technology, the links between cities are increasingly closer. Among them, economic ties and information attention are more powerful, which indicates the degree of communication between cities. The resilience of the urban network indicates the ability of the urban network to maintain normal operations of the city under the impact. This is a scientific question worth investigation. Therefore, it is significant to study the resilience of complex urban networks for normal operations of the regional space. Meanwhile, based on the construction of the urban network, the resilience of the urban network needs to be reasonably evaluated, and optimization suggestions should be given according to the results.
By summarizing the existing research and taking the Jing-Jin-Ji Urban Agglomeration as an example, this paper constructs the information connection network, economic connection network, and information economy coupling network based on the Baidu search index and socioeconomic data. Then, the information and economic coupling degree of Jing-Jin-Ji are evaluated, and the resilience of the network is optimized from the perspective of matching and transmission. The study results provide a theoretical basis for enhancing the connectivity of cities in the economic network and information network of the Jing-Jin-Ji Urban Agglomeration and the stability of urban operation and development.
2 Study area, data, and method
2.1 Study area
The Jing-Jin-Ji region is located in the north of North China Plain, north of Zhanghe River, with Yanshan mountain on its back, the Bohai Sea in the East, Taihang Mountain in the west, Shandong and Henan provinces in the southeast and south, Taihang Mountain in the west, Shanxi Province and Inner Mongolia Autonomous Region in the Northwest and North, and Liaoning Province in the northeast. The region includes two municipalities under the central government of Beijing and Tianjin and 13 cities in Hebei Province, including Baoding, Tangshan, Langfang, Shi Jiazhuang, Qin Huangdao, Zhang Jiakou, Chengde, Cangzhou, Hengshui, Xingtai, and Handan (Figure 1).

FIGURE 1. Study area.
2.2 Research data
In the study of urban network characteristics, cities are regarded as nodes in the network. The Baidu search index between cities is used to characterize the information flow in the network nodes. With the help of the Baidu index platform, a Baidu search index with one city as the scope and another city as the keyword is established to obtain the information connection between cities. For example, to obtain the contact information between Beijing and Tianjin, the Baidu search index of Beijing to Tianjin for a certain period of time can be obtained by taking Tianjin as the keyword and Beijing as the range. This study uses the Baidu search index between two cities in the Jing-Jin-Ji region in 2018 to build a 13 * 13 intercity contact matrix for studying the characteristics of the urban network in the Jing-Jin-Ji region.
Meanwhile, the shortest road distance between two cities is used in the process of calculating economic ties, and the data are borrowed from the Gaode map. The statistical data used in this study include the number of permanent residents and the GDP data of 13 cities in Beijing, Tianjin, and Hebei at the end of 2018, which are derived from the 18-years statistical yearbook of each city.
2.3 Research methods and models
2.3.1 Construction of the urban network structure and the network characteristics
By reading the current literature and the sorted information flow intensity, economic connection intensity, and information economy coupling connection intensity, the information, economy, and information economy coupling connection networks are constructed by using the gephi network analysis tool and ArcGIS spatial analysis software. Then, the attribute characteristics of various networks in spatial pattern and centrality are analyzed.
(1) Information contact network (Xiong et al., 2013; Jiang et al., 2015.)
In the calculation of information flow intensity, the intensity of information flow between two cities is expressed by the product of mutual attention between city A and city B, and the formula is as follows
where,
(2) Economic connection network (Niu et al., 1998; Wang et al., 2006)
The gravity model is a common method for the calculation of absolute economic connection quantity, and it is used in this study to measure the economic connection strength between Beijing, Tianjin, and Hebei. The calculation formula is shown as follows:
where
(3) Information economy coupling network
The construction of an information economy coupling network is based on the coupling coordination model, which is an important index for representing the interconnection and interaction degree between two or more systems. The information connection strength and economic connection strength are coupled, and the coupling value is used as the connection strength between the information economy coupling network. The calculation formula is:
where
where

TABLE 1. Classification standard of coupling coordination degree.
(4) Degree centrality
Degree centrality reflects the interaction between a node and other nodes. It is an important expression of the interconnection relationship between cities. The greater the degree of a node, the higher the degree of centrality of the node, and the more important it is in the network (Lin et al., 2019). The calculation formula of degree centrality is shown as follows:
where
2.3.2 Measurement and optimization of network structure resilience
By summarizing the existing literature, this paper selects the attribute characteristics of hierarchy matching and transmission in the interruption scenario, measures, analyzes, and evaluates the structural resilience of the three networks, and proposes optimization countermeasures and suggestions on this basis.
(1) Hierarchical——weighting degree and weighting degree distribution
Weighting degree: The weight of the network edge is included in the hierarchical calculation, which is expressed by weighting degree and weighting degree distribution. In an undirected graph, the degree represents the number of edges directly connected to a node, while the weighting degree describes the sum of the weights of the edges directly connected to a node, that is, the sum of the connection strength. The greater the value of the weighting degree, the stronger the connection between the node and other nodes.
Weighting degree distribution: the probability distribution or frequency distribution of the weighting degree of all nodes in the network can reflect the macrostructure characteristics of the network. The greater the slope, the more significant the hierarchy (Crespo et al., 2013).
where
(2) Matching——neighbor average weighting and degree correlation.
Neighbor weighted average: In the network, each node has a certain number of adjacent nodes (Vi) directly connected with the node. The average degree of all adjacent nodes directly connected to node i is calculated as:
where
Weighted degree correlation: In the network, each node has a certain number of adjacent nodes directly connected with the node. If the weighted degree is positive and the correlation coefficient is positive, the network has the same matching result. If the positive correlation coefficient of the weighted degree is negative, the network is considered mismatched.
where
where
(3) Transmissibility—network efficiency
Network efficiency: it refers to the efficiency of element flow between nodes in the network. The greater the value, the better the transmission of the network (Huang and Hu, 2014)
where
3 The construction of intercity connection network and the characteristics of cyberspace
3.1 Spatial pattern of the intercity connection network
Based on the intensity of information flow, economic connection, and information economy coupling among 13 cities in Beijing, Tianjin, and Hebei, the information connection network, economic connection network, and information economy coupling network are visualized respectively. The natural fracture method is used to classify the constructed network. Each network is divided into five levels, and the network connection is visualized. The construction results of the three types of contact networks are shown in Figure 2.
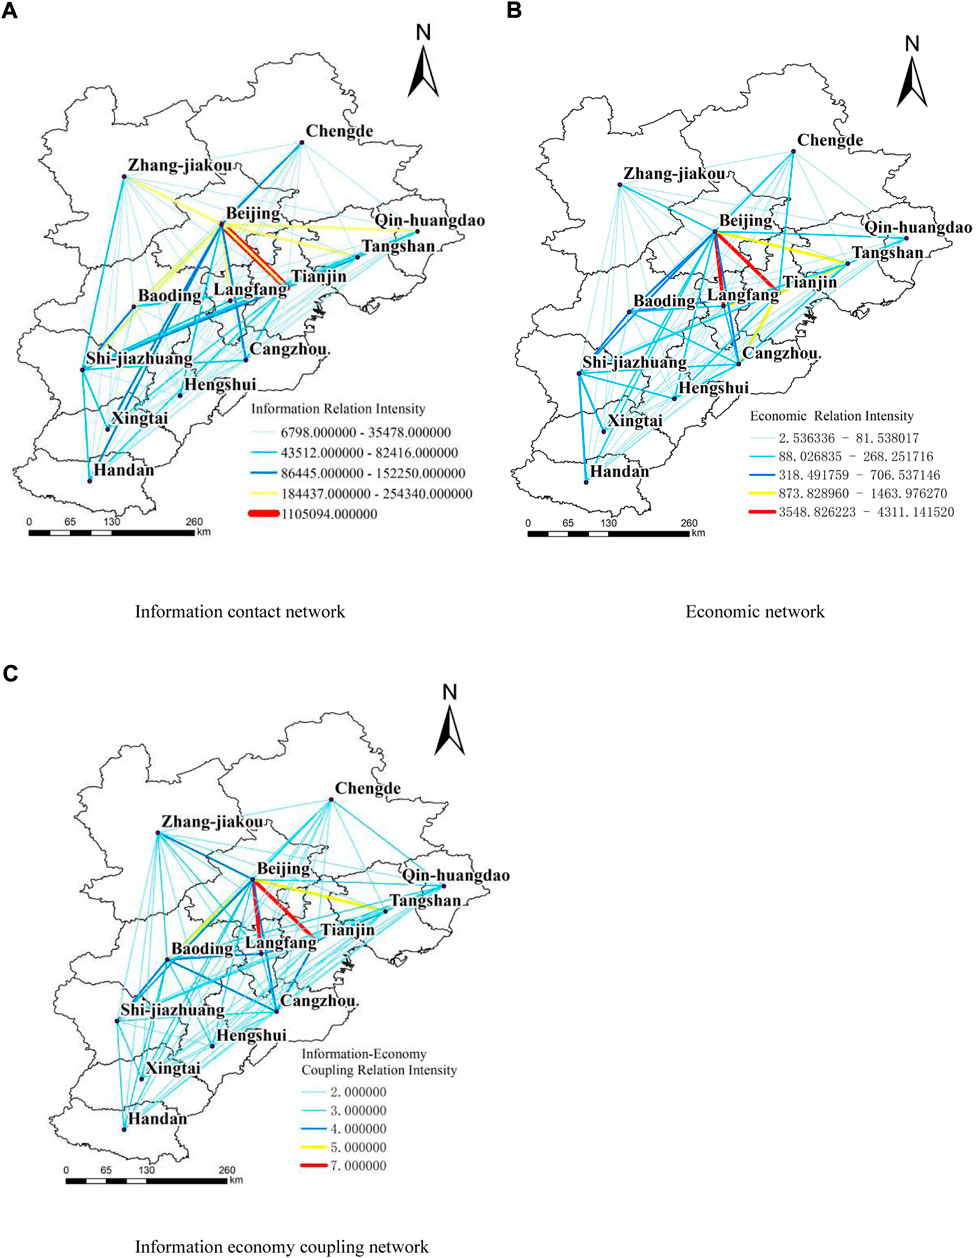
FIGURE 2. Spatial pattern of urban networks.
The information contact network in Figure 2A reflects the mutual search attention of cities. There are 13 nodes and 156 connecting lines in the network. Among the cities at the first level (254,340–1105094), only Beijing and Tianjin show strong information connection strength. This indicates that the information connection between Beijing and Tianjin is strong in the Jing-Jin-Ji Urban Agglomeration network, but there is no attention intensity at the first level to Hebei. The information connection network at the second level (184,437–254,340) presents a network structure centered on Beijing and radiating outward in a spatial structure. Beijing has strong economic concerns with Tianjin, Shi Jiazhuang, Tangshan, Qin Huangdao, Baoding, Zhang Jiakou, Langfang, and Handan. However, except Beijing, the links between cities do not appear at the second level, indicating that the links in the information network group are relatively single. In terms of the structural point, the attention links between cities other than Beijing should be strengthened. At the third level, the urban links with the intensity of information contact between (86,445–152250) mainly include Beijing and Chengde, Cangzhou, and Xingtai, Tianjin-Shi Jiazhuang and Tianjin-Tangshan, and Baoding and Shi Jiazhuang. The information attention among cities at the fourth level of contact intensity (43,512–82,416) mainly appears among cities other than Beijing: in addition to the connection between Beijing and Hengshui, Tianjin, Shi Jiazhuang, Tangshan, Qin Huangdao, Baoding, Zhang Jiakou, Cangzhou, Langfang, Xingtai, Hengshui, and Handan are compared with the first, second. In terms of the intensity of information connection at the three levels, the connection between prefecture-level cities is the closet at the fourth level. The information contact intensity of cities located at the fifth level (6,798–35,478) is the highest among the five categories, which accounts for about two-thirds of the information contact network, indicating that the attention intensity of information between most cities is still relatively weak. The fifth-level network has a hollow network structure in the periphery of the whole Jing-Jin-Ji Urban Agglomeration.
The economic connection network in Figure 2B reflects the overall pattern of economic connection strength between cities, including 13 nodes and 156 connecting lines. Compared with the information network, the location of each node and the distance between nodes in the economic network have a greater impact on the strength of economic ties between cities. Similarly, this study divides the economic ties into the following five levels by using the natural fracture method. The cities at the first level (3,548.826223–4,311.141520) are Beijing-Tianjin and Beijing -Langfang. In the whole Jing-Jin-Ji Urban Agglomeration, there is no strong connection between Tianjin and Langfang, and the economic connectivity between the two cities is still a certain distance from that of Beijing, At the first level, the spatial structure of the economic network is only two rays with Beijing as the endpoint. The cities at the second level of the economic network (873.828960–1463.976270) except Beijing and Tangshan, Handan and Xingtai, Tangshan, Cangzhou, and Langfang all take Tianjin as the center, showing a radial shape. At the third level of the economic connection network (318.491759–706.537146), the city connections include Beijing - Baoding, Beijing - Cangzhou, Tianjin—Baoding, Xingtai - Shi Jiazhuang, and Shi Jiazhuang - Handan. The links between the prefecture-level cities in Hebei are gradually increasing. At the fourth level of the economic network (88.026835–268.251716), each city is involved. Whether it is Beijing, Tianjin, or the prefecture-level cities in Hebei, the economic connection is more widely distributed in space than that at the first, second, and third levels. The number of cities at the fifth level (2.536336–81.538017) is similar to that in the information connection network. This is the level with the largest number of inter-city connections, which accounts for two-thirds of the network connections. However, unlike the information connection network space, the economic network is not hollow at the fifth level, and Beijing still has economic connections with other cities. This shows that from the perspective of the economic network built by the gravity model, Beijing, as the center of the urban agglomeration, is generally weak in the strength of economic links with other cities relative to the strength of information links, but the links between the cities on the fifth level of the two networks are the strongest, so there is a certain space for network optimization.
Figure 2C shows the information economy coupling network obtained by coupling the information connection network and the economic connection network. It reflects the coordination and matching of information and economic connections between cities, including 13 nodes and 156 connections. Combined with the coupling degree classification standard, this paper analyzes whether the coupling links in different information economic networks are coordinated, and adopts the natural fracture method to divide the calculation results into the following five levels. The coupling value of the information economy coupling network at the first level is 7. The network spatial structure at this level is similar to that of the economic connection network. The connection between Beijing Tianjin and Beijing Langfang has reached primary coordination, which reflects that the overall information connection strength and economic connection strength of the Jing-Jin-Ji Urban Agglomeration has not reached good coordination. The three cities of Beijing, Tianjin, and Langfang are most closely connected in the middle of the urban agglomeration, and they only achieve primary coordination. This indicates that the overall information and economic connection of the Jing-Jin-Ji Urban Agglomeration are unbalanced, and there is still a lot of room for improvement in the coordinated development of the two networks. The cities with a coupling coordination degree of 5 at the second level are Beijing and Tangshan, Beijing and Baoding, and the coupling coordination degree of information economic ties is nearly imbalanced. The value of the information economy connection coupling network at the third level is 4, which shows a slight imbalance. In terms of spatial structure, in the whole information economy coordination network, the cities outside Beijing, Tianjin, and Hebei such as Chengde, Handan, Qin Huangdao, Hengshui, and Xingtai do not appear at this level. Generally, there are more connections between cities near the center of urban agglomeration at this level. The coordination intensity of information economy coupling between cities at the fourth level is 3, which shows a moderate imbalance. Compared with the links at the third level, the links between cities at this level are significantly increased. The coupling strength of the fifth level is 2, and the links between cities are the most at this level, which shows a serious imbalance. From the perspective of coordinated development, the development of economic ties lags that of information links, resulting in the level of coordination in the whole information economic ties coupling network. Though Beijing Tianjin and Beijing Langfang reach the level of primary coordination, none of them reach the coordination level.
3.2 Central characteristics
Presents the calculated center value of point degree for the cities at four levels of the three networks.
Point degree centrality reflects the ability of network nodes to directly mobilize network resources and information (Wang et al., 2006), and its ability is positively correlated with the value. The results of point degree centrality are shown in Figure 3 and Table 2. It can be seen that the degree of centrality of the economic connection network is higher than that of the information connection network and information economy coupling connection network. There are four cities with a degree center value of economic connection network above 0.58, which accounts for 30.8% of the total cities, indicating that about one-third of the cities can directly mobilize the economic resources between cities. Compared with the other two networks, the lowest value has only one point, and the centrality is less than 0.1 (Figure 3B). There are three points with a degree centrality of above 0.67 in the information contact network, which accounts for 25% of the total number of cities, but the value is higher than that of the economic contact network, and the point degree center value of the two cities is lower than 0.1 (Figure 3A). The degree center centrality of the information economic connection coupling network is generally low. Only one city (i.e., Beijing) has a degree centrality value of 1, and Baoding and Tianjin have a degree centrality value of 0.5 (Figure 3C), indicating that only the above three cities can directly adjust the resources of surrounding cities under the condition of coordinated economic and information development. The coupling degree centrality values of other cities are less than 0.34, There are even four cities with a point degree centrality of 0, and these cities cannot mobilize resources among other cities at all.
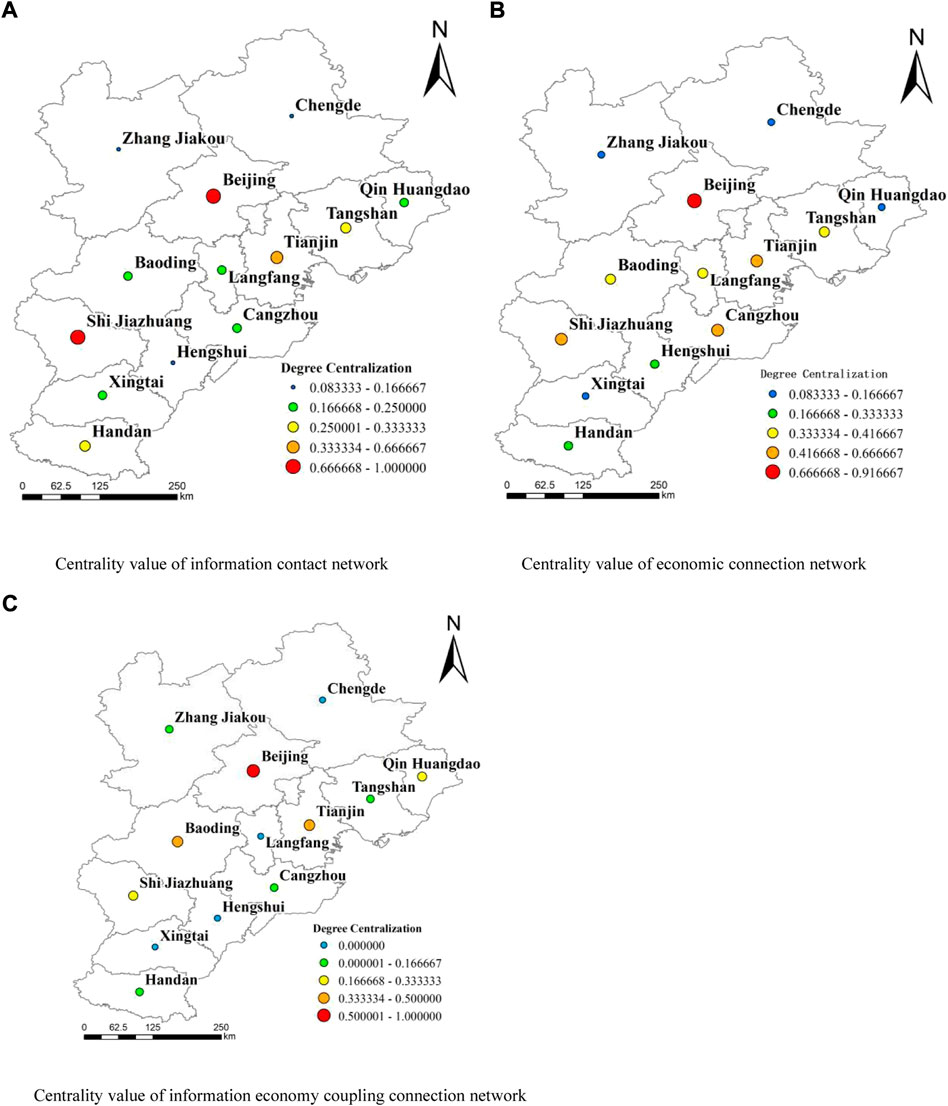
FIGURE 3. The spatial distribution of degree centrality.
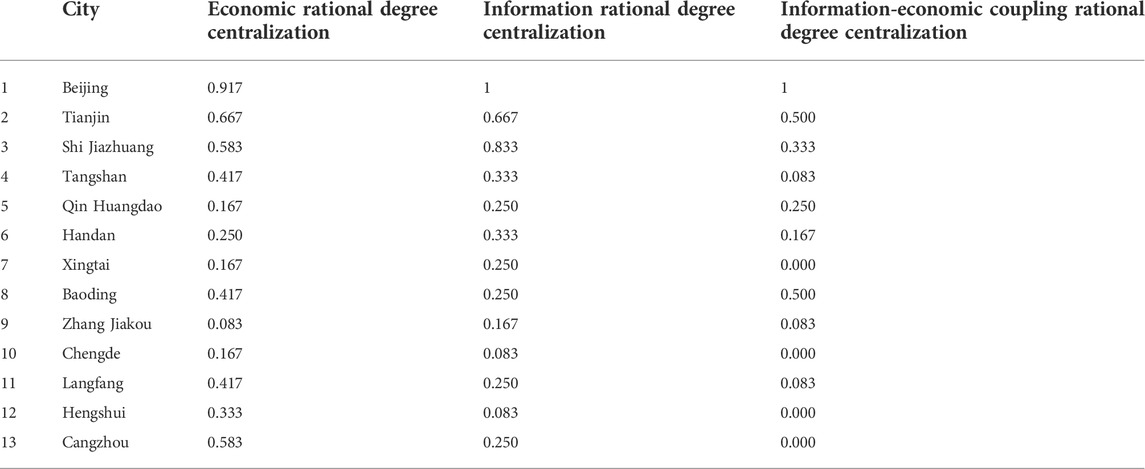
TABLE 2. Centrality value.
4 Resilience of urban network structure
For the three networks of information, economy, and information economy coupling constructed above, the resilience of the network structure is measured and analyzed in terms of hierarchy and matching at the individual and regional levels respectively. Then, the overall transmission and diversity of the network structure under a node interruption scenario are simulated and evaluated.
4.1 Network hierarchy
4.1.1 Weighting degree
The network weighting degree reflects the degree of correlation between urban nodes and the strength of complex correlation, as well as the strength of network connection. Based on network weighting degree, this paper measures the correlation strength of urban nodes and the hierarchical resilience of the network and uses the natural fracture method to divide the weighting degrees of the three types of networks into five levels respectively. The results are illustrated in Figure 4.
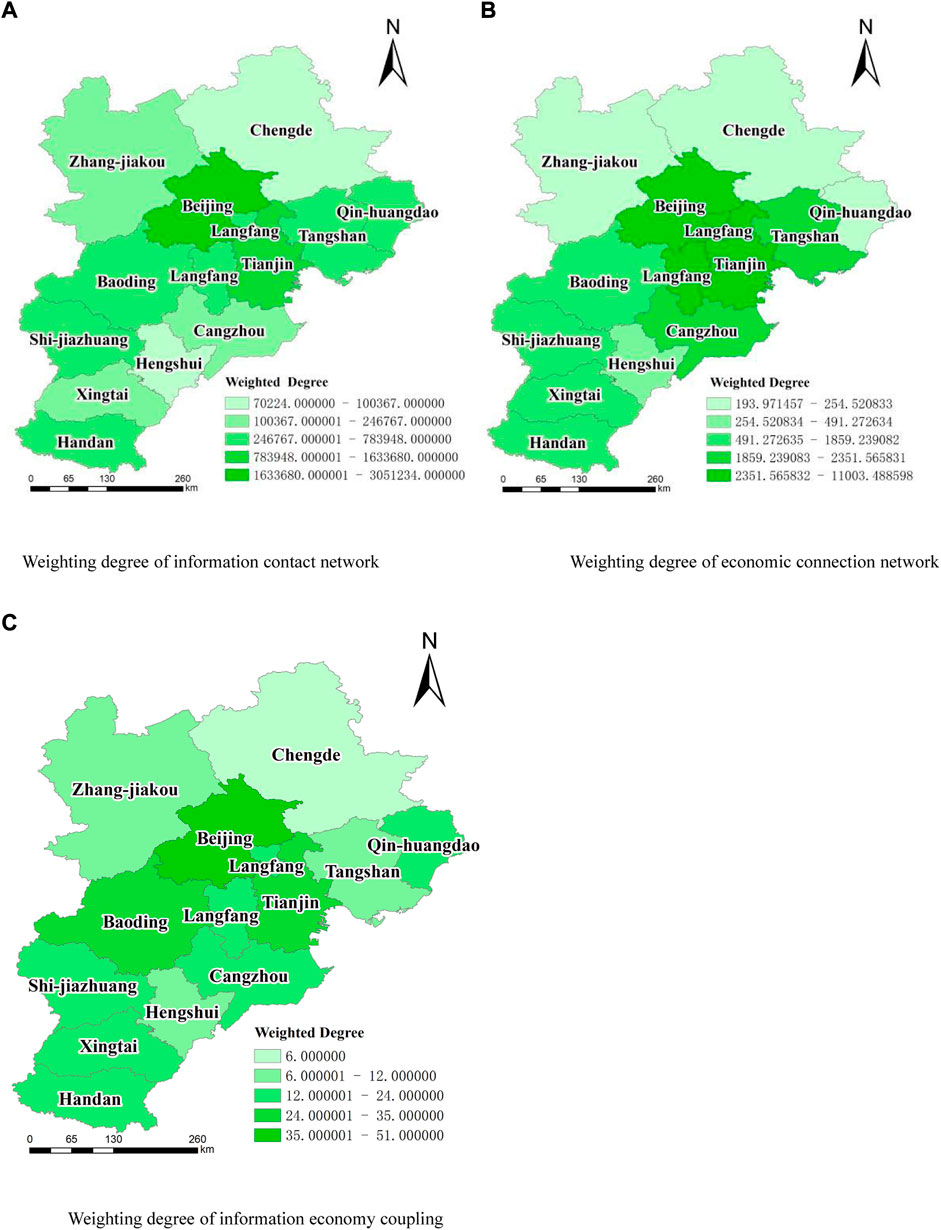
FIGURE 4. Spatial distribution of network weighting degree.
In terms of degree centrality, Shi Jiazhuang, at the first level of degree centrality (high-value area), is located at the second level of the weighting degree, and only Beijing is located at the first level in the Jing-Jin-Ji Urban Agglomeration. This indicates that Beijing, as the capital, not only has a strong connection with other cities in the Jing-Jin-Ji Urban Agglomeration in terms of information connection. By considering the ability to directly mobilize the surrounding resources, the cities at the second and third levels of weighting show a strip distribution from east to west in space. Specifically, Tianjin at the second level is the central node of the strip, and it connects the cities at both ends and plays an important role in an undertaking; The cities at the fourth and fifth levels are mainly distributed on the north and south edges of the Jing-Jin-Ji Urban Agglomeration, with a weak correlation with other cities. Overall, the urban development of the information contact network is relatively homogeneous. If there is a failure in any city except Beijing and Tianjin, the failure or even loss of any node will have a limited impact on the normal operation of the network function (Figure 4A).
Compared with degree centrality, Langfang city and Tianjin city are less located at the first level of degree centrality, indicating that in the Jing-Jin-Ji Urban Agglomeration, Beijing not only has a strong correlation with the surrounding cities but also can directly mobilize the economic resources of the surrounding cities. The cities at the second level of degree distribution are mainly located in the east of the Jing-Jin-Ji Urban Agglomeration. The cities at the third level are mainly located in the south of the Jing-Jin-Ji Urban Agglomeration. The city at the fourth level is only Cangzhou, and the city at the fifth level is located in the north of the Jing-Jin-Ji Urban Agglomeration. Cities at all levels in the economic connection network are roughly distributed in blocks. High-level cities are generally located in the middle east of the Jing-Jin-Ji Urban Agglomeration, and low-level cities are distributed in the north, while high-level cities in the west and south show a semi-surrounded structure. Compared with the information connection network, the hierarchy of the economic connection network is more obvious, its “robustness” has a certain decline compared with the information network, and its “vulnerability” is stronger. Once there is a problem in a high-level city, it will have a great impact on the whole economic connection network, and the network is more prone to failure (Figure 4B).
Compared with the degree of centrality and centrality of the information economy coupling network, high-level cities are the same, and the number of cities at the third level increases. The cities at the fourth and fifth levels are mainly distributed in the south of the urban network. The high-level cities are a city belt running through Beijing, Tianjin, and Hebei, and these cities are at the east-west of the urban agglomeration. Most of the cities at the fourth and fifth levels are in the north, and the cities with balanced information and economy and high external contact intensity in the Jing-Jin-Ji Urban Agglomeration are still concentrated in Beijing (Figure 4C).
4.1.2 Weighted degree distribution
The weighting degrees of all urban nodes in the three types of networks are ranked, and the power curve is drawn to analyze the overall hierarchical structure resilience of the network. The results are shown in Figure 5. The slope a of the weighted degree distribution curve of the three types of networks is large, and | a | is between 0.7 and 1.6, indicating that the hierarchy of the networks is significant. The | a | of information, economy, and coupling network is 1.289, 1.59, and 0.711 respectively, indicating that the hierarchical difference between the three networks is obvious (Figures 5A–C). The economic connection network has the highest hierarchy, and the hierarchical structure between the cities is the most obvious. Besides, there is a strong core city, which is consistent with the spatial distribution of weighting degree. The information connection network ranks second. Although there are high-level cities in Beijing and Tianjin, their spatial distribution is relatively scattered, i.e., in addition to Beijing and Tianjin, the homogenization phenomenon of other cities is obvious. Compared with the economic network, the number of high-level cities in the information economy coupling network is smaller; the hierarchy is the lowest, and its spatial distribution is more scattered, mainly in low-level cities. Therefore, the information economy coupling network has the lowest hierarchy. It shows that there are still great differences in the hierarchy between the information economy coupling network and the single factor network.

FIGURE 5. Weighted degree distribution of networks.
4.2 Network matching
Matching is used to describe the correlation between nodes in the network. If a node with a medium value tends to contact the node with a high value, the network is said to be matched; otherwise, it is mismatched (Batty, 2009; Crespo et al., 2013). If a city tends to develop together with cities of the same level and status, the network has the same matching. The same matching network is easy to be affected by factors such as solidified contact path and closed structure so that it has low innovation and information permeability. When it is affected by the outside world, its recession risk is difficult to be avoided. Therefore, the resilience of network structure is relatively low. If the relationship between cities exists across different levels, cultural backgrounds, and economic differences, the network is considered to have allogeneic. Due to its heterogeneity and openness, the allogeneic network can show a certain resistance and adaptability in the face of regional risks. Therefore, the network structure has a higher resilience.
4.2.1 Neighbor weighted average
The weighted average of neighbors reflects the connection between a node and its neighbor nodes. In this study, the weighted average degree of neighbors is used to measure the preference attachment and network matching resilience of urban nodes. The weighted average degree of the neighbors of three types of network city nodes is graded, and the spatial pattern is shown in Figure 6 by using the natural fracture method.
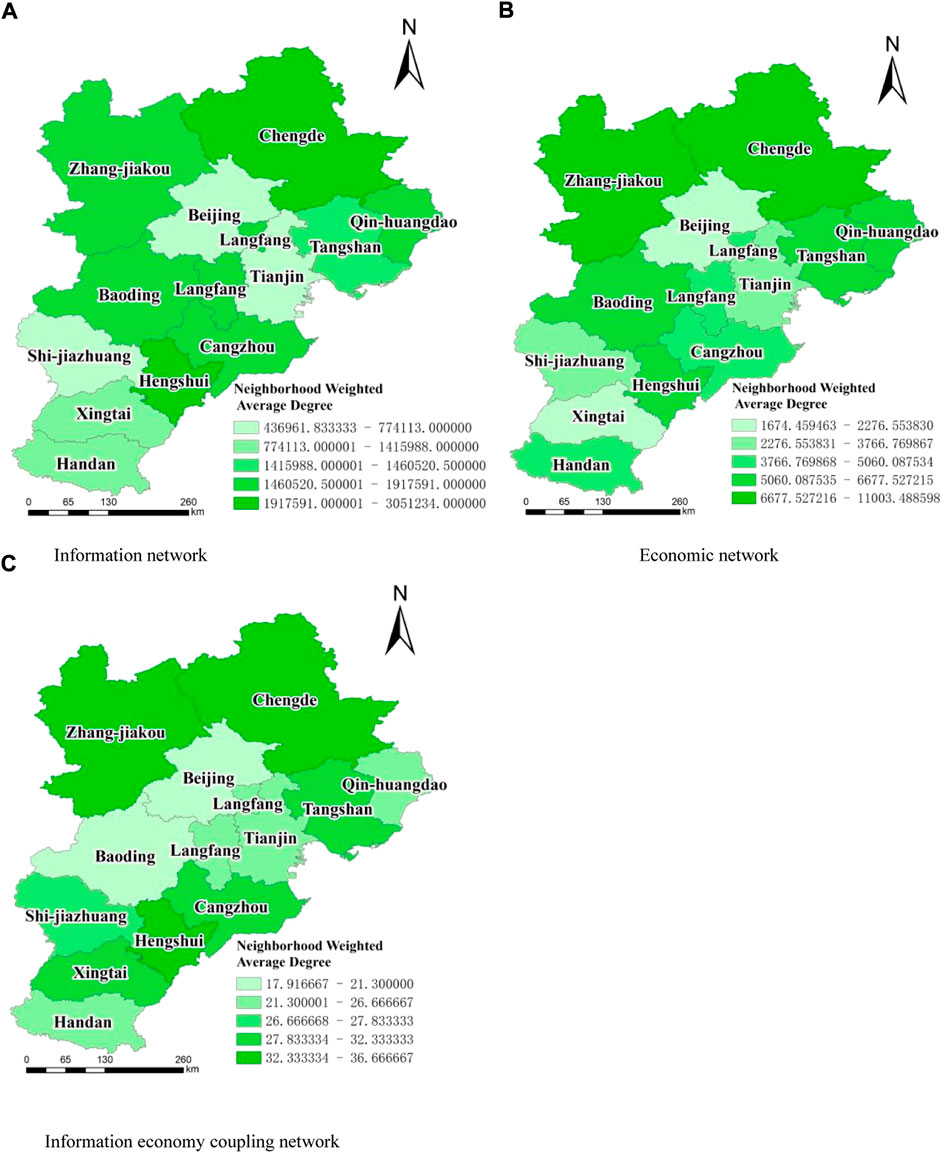
FIGURE 6. Spatial distribution of neighborhood weighted average degree.
Compared with other networks, the information network has the largest number of cities with a weighted average degree of neighbors at the fifth level. Spatially, the neighbors in the cities with a high weighting degree have a low weighted average degree, and there are node cities with low weighting degree around them, indicating that the cities with a high weighting degree in the information network are generally connected with nodes with a low weighting degree. In this way, high-weighted cities can better exchange information with their surrounding cities (Figure 6A).
In the economic connection network, although the cities with the weighted average degree of neighbors at the fifth level only include Beijing and Xingtai, with Beijing and Xingtai as the center, they are surrounded by cities with a low weighting degree and form a surrounding structure around high weighting degree. In terms of spatial distribution, the two cities with a high weighting degree do not gather. It can better connect and drive the surrounding cities with a low weighting degree, which is conducive to the rapid development of the global network structure (Figure 6B).
In the information economy coupling connection network, the city nodes with a high weighting value are located at the fourth and fifth levels, indicating that the node cities with a high central value and balanced development of information connection and economic connection strength play an important role in driving the balanced development of economic and information connection of the surrounding cities. Such node cities have a great impact on the circulation and dissemination of elements of the network, and we should strengthen the interaction ability with high-weighted nodes (Figure 6C).
4.2.2 Weighted degree correlation
In this study, weighted degree association is employed to further describe the matching of the three networks. If the weighted average degree of neighbors increases with the weighting degree, the network has the same matching, i.e., the weighted degree is positively correlated; If the weighted average degree of neighbors decreases with the increase of weighting degree, the network is considered to have mismatching, i.e., the weighted degree correlation index is negative.
The weighted degree correlation results are shown in Figure 7. The weighted degree correlation coefficients of the three networks are 0.502, −0.266, and −0.328, respectively. The weighted degree correlation coefficients B are less than 0, and the coefficients of the three networks are quite different, which indicates that the cities with a high weighting degree in the three networks prefer to connect with the cities with a low weighting degree, i.e., the networks have different matching. Meanwhile, it also shows that the three types of networks have different matching connections.
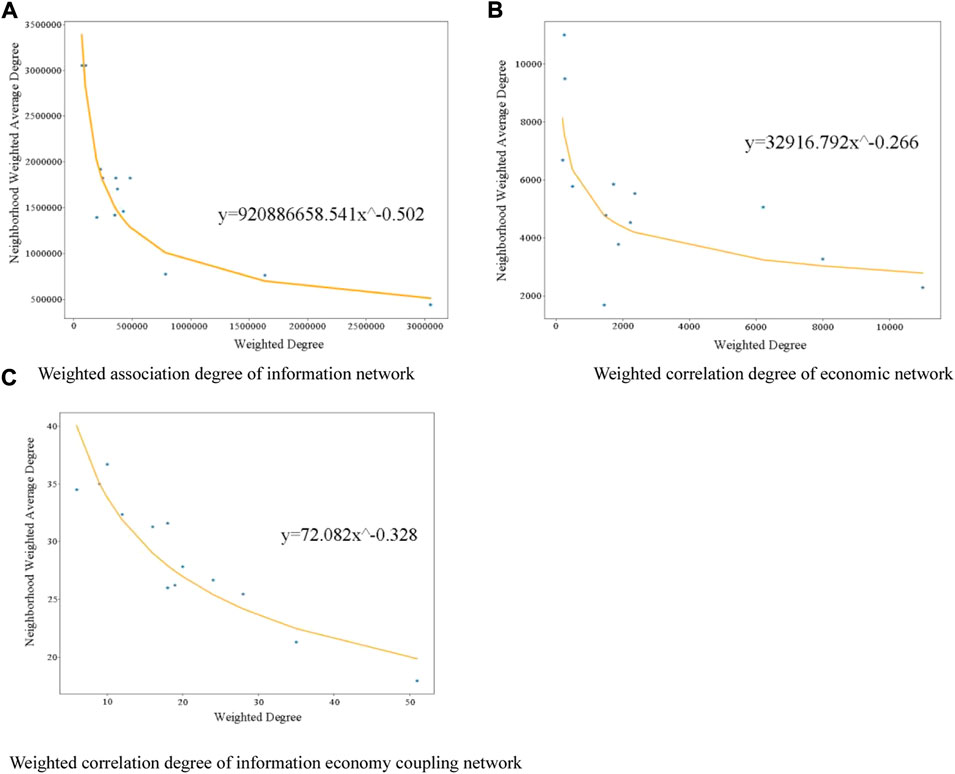
FIGURE 7. Weighted degree correlation of networks.
It can be seen that the weighted degree correlation coefficient of the information connection network is the largest, and the slope of the weighted degree correlation curve is the steepest. That is, the mismatch phenomenon in the network is obvious, and the network connection paths are diversified. This indicates that the core cities with high weighting in the Jing-Jin-Ji Urban Agglomeration not only connect with cities with the same development and comprehensive level but also tend to connect with cities with certain differences in development level. This network mismatch can make the core cities in the Jing-Jin-Ji Urban Agglomeration promote the development of relatively backward cities and strengthen the intensity of information exchange between cities at different levels. From the perspective of structural resilience, combined with the above network hierarchy analysis, it is known that although the information connection network has a high hierarchy, except for Beijing and Tianjin, the distribution of cities at other levels is relatively scattered and homogeneous. In addition, the mismatch phenomenon can weaken the potential crises such as path dependence and regional locking caused by high-level and strengthen the efficient connection and close connection between core city nodes and edge nodes. The occurrence of external interference is conducive to the adaptive adjustment of the network structure. Meanwhile, the network has an obvious mismatch so that the urban agglomeration structure can change from vertical tree growth to horizontal network spread, thus realizing diversified development and regional risk reduction and improving the resilience of the urban network structure. (Figure 7A).
The degree correlation coefficient of the economic connection network is only −0.266. Compared with the degree correlation coefficient of the information connection network and the information economy coupling connection network, there is no strong mismatch. Combined with the analysis results of the network level, the hierarchy of the economic connection network is the highest, but there is a gap between the mismatch and the information connection network, indicating that there is certain path dependence in the economic connection network. Meanwhile, compared with the core cities with a high development level of information networks, they prefer connection. The connection between core cities and general cities and marginal cities is relatively low in the network, which intensifies the closeness of the economic network to a certain extent. Besides, compared with the information connection network, the higher level and lower mismatch of the economic network make the resilience of the economic connection network lower than that of the information connection network. This is not conducive to the resistance and resilience of regional economic flow to disasters (Figure 7B).
The degree correlation coefficient of the information economic connection coupling network is −0.328, which is greater than that of the economic network but less than that of the information network. Combined with the above weighted degree distribution analysis results, the hierarchy of the coupling network is the lowest among the three networks. The low-level resilience of the network structure shows that the distribution of the information economy network cities is relatively homogeneous. In addition, the core cities between networks prefer to connect with general cities and marginal cities, and the connection paths between cities are diversified. Although the arrow ability of highly balanced cities is not very prominent, the “robustness” of the network structure of the information economy coupling network is high. In this case, the node failure of the high equilibrium city has no great impact on the balance of the overall Jing-Jin-Ji Urban Network, and the “vulnerability” of the city is low (Figure 7C).
4.3 Transmissibility of network structure in interrupt scenario
In this study, network efficiency is used to measure the transportability of information, economy, and coupled information-economy coupling networks, which reflects the diffusion ability of elements in the network. When the transportability of the network is high, it indicates that the transmission and exchange of elements between the nodes of the network can be faster, which helps to promote inter-city learning, innovation, communication, etc. Also, it can enhance the resistance of the network in the face of external shocks and make the network highly resilient. The results of the spatial distribution of network transmission after the failure of different nodes are shown in Figure 8, and the network transmission after the failure of different nodes in the 13 cities of the Jing-Jin-Ji Urban Agglomeration of the three networks are ranked, and the result is shown in Table 3.

FIGURE 8. Spatial pattern of network transmission after the failure of different nodes.
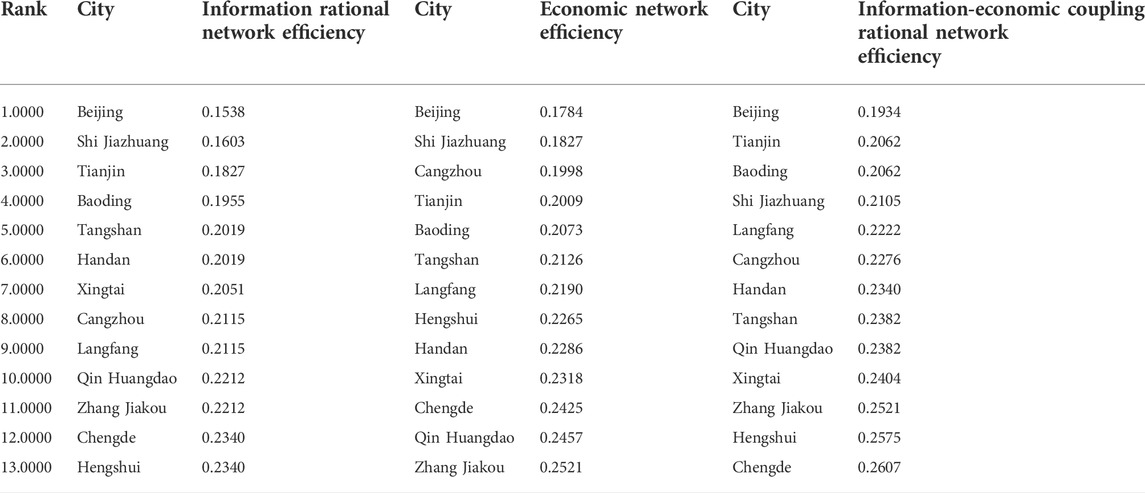
TABLE 3. Network transmission ranking.
The transferability of the information linkage network is between (0.1538–0.2334), which is slightly lower than that of the economic linkage network (0.1784–0.0.2521) and the coupled information-economic linkage network (0.1934–0.2607), indicating the lowest transfer efficiency among cities of the information network. Combined with the centrality characteristics, Beijing and Shi Jiazhuang have a higher degree of centrality, and they have the greatest impact on the transmission effect of the information network. Meanwhile, the network efficiency decreases to 0.1538 and 0.1826 after the failure of two nodes in Beijing and Shi Jiazhuang, which has a greater impact on the transmission type of the city network (Figure 8A).
Beijing has the highest moderate central value of the economic connection network, and it has the greatest impact on network transmission. After the node fails, the network transmission efficiency decreases to 0.1784. Secondly, the city with a greater impact is Shi Jiazhuang. When the network node is interrupted, the network transmission efficiency is reduced to 0.1827. Besides, Zhang Jiakou, Chengde, and Qin Huangdao are the cities that have the least impact on the economic connection network and have smaller central values of the same degree. The failure of the three cities has little impact on the whole network, and the network efficiency decreases to 0.2425, 0.2457, and 0.2521 respectively (Figure 8B).
Compared with the information and economic connection network, the information economy coupling connection network has higher transmission efficiency. When the node is interrupted, this network has higher network efficiency and resilience than the other two networks. Beijing, which has the largest degree center value, also has the greatest impact on the network. When the nodes in Beijing are disconnected, the network efficiency drops to 0.1934. The top cities include Hengshui, Zhang Jiakou, and Chengde, and these cities have the least impact on the network efficiency of the information coupling network after failure (Figure 8C).
From the perspective of the spatial distribution of the three networks around Beijing, the transmission failure of the three networks is decreasing.
5 Conclusion
With the long-term impact of economic globalization, the ability of regional space to handle the impact and restore, maintain, or improve the characteristics and functions of the original system is crucial. As a new form of regional expression, building a complex urban network and evaluating the resilience of urban network structure is significant to promoting regional sustainable development. A safe urban development environment can promote the prosperity and vitality of the city. Based on the Baidu search index and social statistics, this paper constructs the information, economy, and information economy coupling network respectively. Then, the strength and centrality of network connection are analyzed, and the transmission of urban individuals and regional whole in hierarchy matching are measured and analyzed. The results show that:
1 The spatial distribution of economy, information, and economic information coupling network of the Jing-Jin-Ji Urban Agglomeration shows a spatial pattern with Beijing as the core and radiating outward. In the three networks, the connection strength is concentrated between Beijing, Tianjin, and Langfang, and mainly between Beijing-Tianjin and Beijing-Langfang. The connection strength between Tianjin and Langfang is relatively weak; Besides, due to the selection of the model, the information intensity between cities is not affected by distance, so the information connection intensity between cities is closer than the economic connection intensity, but the information connection intensity between developed cities is higher. Moreover, due to the influence of distance, the economic connection strength between cities is generally weaker than the information connection strength. Therefore, in the information economy coupling connection network, only Beijing-Tianjin and Beijing-Langfang are at the level of preliminary coordination. The overall coordination of the information economy network is poor. There is an imbalance in the strength of economic and information links.
2 From the perspective of the weighted degree distribution, the three networks are ranked as economic network > information network > information economy coupling network. The higher hierarchy of the economic and information networks will bring arrow cities with strong competitiveness to these two types of networks. The absolute core is Beijing, followed by Tianjin, Langfang, Cangzhou, and Tangshan. However, with a higher hierarchy, we should always be concerned with the impact and digestion ability of high-level networks in case of core node failure. The cities with balanced development of information economy are at a low level, and the core cities with balanced development have a low driving ability, but the resilience of the network is relatively good.
3 From the perspective of weighted correlation, the high-weighted cities in the three networks prefer to connect with the cities with a low weighting, that is, the network has different matching. The information network has the highest mismatch, followed by the information economy coupling network, and finally the economic connection network. Such nodes have a great impact on the circulation and dissemination of elements of the network. We should pay attention to strengthening the interaction ability with high-weighted nodes.
4 The transmission of the three connection network structures is in the order of information > economy > coupling network. Based on the results of centrality, hierarchy, matching, and transmission, Beijing and Tianjin have a great impact on the transmission of information and economic networks, and Beijing has the greatest impact on the coupling network.
6 Optimization suggestions
In the face of the overall economic downturn and the increasingly fierce competition and fluctuations in various fields of society, the stability, coordination, and sustainability of urban network operation and the ability to recover in time in the face of shocks are significant. Based on the three networks constructed, aiming at the three perspectives of network hierarchy, matching, and transmission, and starting from the resilience of the urban network structure, the urban network institutions are adjusted to strengthen the resilience of the network.
Hierarchical aspects. We should further strengthen the link between high-level cities and low-level cities. Combined with the work of non-capital function relief, we should radiate the functions of Beijing as a core city and strengthen the role of xiong’an new area. Meanwhile, we need to take xiong’an new area as an important starting point, revitalize the entire Beijing Tianjin Hebei Urban Network, flatten the network structure, pay attention to the radiation effect on low-value nodes, and strengthen the supporting role of each node of the urban network.
Matching. We should further improve and build the traffic road network to give full play to the role of core cities, drive the development of marginal cities, and strive to break the barriers of administrative boundaries. Meanwhile, the construction and improvement of the traffic network can further alleviate the excessive accumulation of resources in core cities so that cities on the edge of Beijing Tianjin Hebei can also access good technology and information resources. The outline of the 14th five-year plan mentions three circles, namely, the living circle 50 km away from Beijing. We need to focus on strengthening regional cooperation around Beijing, developing regional express lines, strengthening public service supporting facilities, and achieving the effect of urbanization within 100 km of the functional circle of xiong’an and Tianjin. Xiong’an new area is a concentrated carrier of Beijing’s non-capital functions, and it is 150 km from Chengde, Tangshan, Cangzhou, Baoding, and Zhangjiakou, belonging to the industrial circle. We should make full use of the planning outline to strengthen the vulnerable nodes of the urban network and improve the resilience of the network.
In terms of network transmission, we should take Beijing as the center to radiate the driving ability of Beijing’s core cities to the outside through scientific and technological innovation, cultural transmission, and other approaches, thus strengthening the driving ability and stability of Beijing’s core nodes. Secondly, we can drive the cities on the edge of the Beijing Tianjin Hebei Urban Network with the help of the collaborative mechanism formed by transportation, industry, and ecological environment construction, thus improving the network transmission efficiency of the overall network and the network resilience of the Beijing Tianjin Hebei Urban Network.
Data availability statement
The original contributions presented in the study are included in the article/supplementary material, further inquiries can be directed to the corresponding authors.
Author contributions
YZ proposed the overall research program and the technical route, YY wrote and proofread the manuscript. SW was responsible for the communication and editing, and other academics did the data analysis.
Funding
This research was supported by the Major projects of National Social Science Fund (ID:20ZDA086), Fundamental Research Funds for the Capital University of Economics and Business (ID: QNTD202009 and QNTD202209), Major project of Beijing Social Science Foundation (19ZDA03).
Conflict of interest
The authors declare that the research was conducted in the absence of any commercial or financial relationships that could be construed as a potential conflict of interest.
Publisher’s note
All claims expressed in this article are solely those of the authors and do not necessarily represent those of their affiliated organizations, or those of the publisher, the editors and the reviewers. Any product that may be evaluated in this article, or claim that may be made by its manufacturer, is not guaranteed or endorsed by the publisher.
References
Arthur, S., Beckfield, J., and Sprague-Jones, J. (2010). Intercity relations and globalisation: The evolution of the global urban hierarchy, 1981—2007. Urban Stud. 47 (9), 1899–1923. doi:10.1177/0042098010372679
Batty, M. (2009). “Cities as complex systems: Scaling, interaction, networks, dynamics and urban morphologies,” in Encyclopedia of complexity and systems science. Editor R. A. Meyers (Springer), 1041–1071.
Bombelli, A., Santos, B. F., and Tavasszy, L. (2020). Analysis of the air cargo transport network using a complex network theory perspective. Transp. Res. Part E Logist. Transp. Rev. 138 (C), 101959. doi:10.1016/j.tre.2020.101959
Chad, S., Sarah, W., Laura, D. V., Zuniga-Teran, A., Gerlak, A. K., Schoeman, Y., et al. (2018). Contributions of green infrastructure to enhancing urban resilience. Environ. Syst. Decis. 38 (8), 330–338. doi:10.1007/s10669-018-9702-9
Cohen, M. (2001). Urban assistance and the material world: Learning by doing at the world bank. Environ. Urbanization 13 (1), 37–60. doi:10.1177/095624780101300104
Crespo, J., Suire, R., and Vicente, J. (2013). Lock-in or lock-out? How structural properties of knowledge networks affect regional resilience? J. Econ. Geogr. 14 (01), 199–219. doi:10.1093/jeg/lbt006
Cutter, S. L., Kevin, D. A., and Christopher, T. E. (2014). The geographies of community disaster resilience. Glob. Environ. Change 24 (11), 65–77. doi:10.1016/j.gloenvcha.2014.08.005
David, R., Pavel, S., and Martin, H. (2019). Complex approach to assessing resilience of critical infrastructure elements[J]. Int. J. Crit. Infrastructure Prot. 25 (3), 125–138. doi:10.1016/j.ijcip.2019.03.003
Dixit, V., Verma, P., and Tiwari, M. K. (2020). Assessment of pre and post-disaster supply chain resilience based on network structural parameters with CVaR as a risk measure. Int. J. Prod. Econ. 227 (C), 107655. doi:10.1016/j.ijpe.2020.107655
Frost, I., and Podkorytova, M. (2018). Former soviet cities in globalization: An intraregional perspective on interurban relations through networks of global service firms. Eurasian Geogr. Econ. 59 (1), 98–125. doi:10.1080/15387216.2018.1506995
Gordon, P. (2010). Trajectories of North—south city inter-relations: Johannesburg and cape town, 1994—2007[J]. Urban Stud. 47 (9), 1985–2002. doi:10.1177/0042098010372681
Hallie, Eakin, Bojorquez-Tapia, L. A., Janssen, M. A., Georgescu, M., Manuel-Navarrete, D., Vivoni, E. R., et al. (2017). Opinion: Urban resilience efforts must consider social and political forces.[J]. Proc. Natl. Acad. Sci. U. S. A. 114 (2), 186–189. doi:10.1073/pnas.1620081114
Hanssens, H., Derudder, B., and Witlox, S. V. A. F. (2013). Assessing the functional polycentricity of the mega-city-region of central Belgium based on advanced producer service transaction links. Reg. Stud. 48 (12), 1939–1953. doi:10.1080/00343404.2012.759650
Huang, C. C., and Hu, B. (2014). Simulation modeling and analysis of the group relationship’s resilience. Chin. J. Manag. Sci. 22 (S1), 686–690.
Hudec, O., Reggiani, A., and ŠiserováM, M. S. (2018). Resilience capacity and vulnerability:A joint analysis with reference to Slovak urban districts. Cities 73 (3), 24–35. doi:10.1016/j.cities.2017.10.004
Jabareen, Y. (2013). Planning the resilient city: Concepts and strategies for coping with climate change and environmental risk. Cities 31 (2), 220–229. doi:10.1016/j.cities.2012.05.004
Jiang, D. L., Sun, Y., Ren, H., Chen, Y. Y., and Zhang, Z. K. (2015). Analyses on the city network characteristics of middle Yangtze urban agglomeration based on Baidu index. Resour. Environ. Yangtze Basin 24 (10), 1654–1664.
Jin, G., Deng, X. Z., Zhao, X. D., Guo, B., and Yang, J. (2018). Spatiotemporal patterns in urbanization efficiency within the yangtze river economic belt between 2005 and 2014. J. Geogr. Sci. 28 (8), 1113–1126. doi:10.1007/s11442-018-1545-2
Li, Y., Shao, H., Jiang, N., Shi, G., and Cheng, X. (2018). The evolution of the urban spatial pattern in the yangtze river economic belt: Based on multi-source Remote sensing data. Sustainability 10 (8), 2733–2753. doi:10.3390/su10082733
Lin, P. F., Weng, J. C., Fu, Y., and Yin, B. C. (2019). Structure characteristics of rail transit weighted network based on smart card data. J. Jilin Univ. Eng. Technol. Ed. 50 (03), 1–7.
Liu, X., Derudder, B., Witlox, F., and Hoyler, M. (2014). Cities as networks within networks of cities: The evolution of the city/firm-duality in the world city network, 2000-2010. Tijdschr. Econ. Soc. Geogr. 105 (4), 465–482. doi:10.1111/tesg.12097
Moser, S., Meerow, S., Arnott, J., and Jack-Scott, E. (2019). The turbulent world of resilience:Interpretations and themes for transdisciplinary dialog[J]. Clim. Change (1), 1–20. doi:10.1007/s10584-018-2358-0
Niu, H. N., Meng, Q. M., Hu, Q. C., and Chen, Y. C. (1998). Economic relation analysis between regions and Gansu province and their surrounding areas. Econ. Geogr. 18 (03), 51–56.
Noura, A., Talalal, Al-A., Mohamed, H., Ahsan, R., and Alrubkhi, A. (2020). Changing urban ecology a challenge for coastal urban resilience:A study on Muscat[J]. Environ. Urbanization ASIA 2 (1), 10–28. doi:10.1177/0975425320906307
Pereira, R. A. O., and Derudder, B. (2010). Determinants of dynamics in the world city network, 2000-2004. Urban Stud. 47 (9), 1949–1967. doi:10.1177/0042098010372678
Pizzo, B. (2015). Problematizing resilience: Implications for planning theory and practice[J]. Cities 43, 133–140. doi:10.1016/j.cities.2014.11.015
Vinciguerra, S., Frenken, K., and Valente, M. (2010). The geography of internet infrastructure: An evolutionary simulation approach based on preferential attachment. Urban Stud. 47 (9), 1969–1984. doi:10.1177/0042098010372685
Vijaya, Dixit, Priyanka, Verma, and Manoj Kumar, Tiwari (2020). Assessment of pre and post-disastersupply chain resilience based on network structural parameters with CVaR as a riskmeasure[J]. International Journal of Production Economics 227, 107655–107655. doi:10.1016/j.ijpe.2020.107655
Wang, X., Wu, D. T., and Wang, H. Q. (2006). An attempt to calculate economic links between cities. Urban Stud. 03, 55–59.
Xing, Z. C., Wang, J. G., and Zhang, J. (2018). Total-factor ecological efficiency and productivity in yangtze river economic belt, China: A non-parametric distance function approach. J. Clean. Prod. 200, 844–857. doi:10.1016/j.jclepro.2018.08.015
Xiong, L. F., Zhen, F., Wang, B., and Xi, G. L. (2013). The research of the Yangtze River delta core area’s city network characteristics based on Baidu index. Econ. Geogr. 33 (07), 67–73.
Yang, Y., Leng, B., Tan, Y., and Arthur, S. A. (2011). Re-view on world city studies and their implications in urban systems. Geogr. Res. 30 (6), 1009–1020. doi:10.11821/yj2011060005
Keywords: urban network, Resilience, Coupling, complex network, Jing-Jin-Ji (3J) region
Citation: Zhang Y, Yang Y, Wei S, Ma Z, Tian M, Sun M and Nie J (2022) Research on spatial structure and resilience of complex urban network: A case study of Jing-Jin-Ji Urban Agglomeration. Front. Environ. Sci. 10:999124. doi: 10.3389/fenvs.2022.999124
Received: 20 July 2022; Accepted: 25 August 2022;
Published: 28 September 2022.
Edited by:
Ying Jing, Zhejiang University, ChinaCopyright © 2022 Zhang, Yang, Wei, Ma, Tian, Sun and Nie. This is an open-access article distributed under the terms of the Creative Commons Attribution License (CC BY). The use, distribution or reproduction in other forums is permitted, provided the original author(s) and the copyright owner(s) are credited and that the original publication in this journal is cited, in accordance with accepted academic practice. No use, distribution or reproduction is permitted which does not comply with these terms.
*Correspondence: Shaokun Wei, d2Vpc2hhb2t1bkBjY3VkLm9yZy5jbg==;