 Ilan Stavi1,2*
- 1Dead Sea and Arava Science Center, Yotvata, Israel
- 2Eilat Campus, Ben-Gurion University of the Negev, Eilat, Israel
This study reviews the global increase in atmospheric greenhouse gas (GHG) concentrations, including carbon dioxide (CO2), methane (CH4), and nitrous oxide (N2O), alongside the accelerated climatic change and its slow onset effects (or events) between 1992 and 2021. The establishment of the United Nations Framework Convention on Climate Change (UNFCCC) in 1992, and the simultaneous UN Earth Summit in Rio de Janeiro, generated the international efforts to tackle climatic change. Over the years, the UNFCCC-Conference of the Parties (COP) has led the efforts in climate change mitigation and adaptation, with many sequential meetings across the world. Three decades later, at the COP26 meeting in Glasgow in 2021, it is evident that climate change impacts have substantially worsened. Despite some uncertainties, it seems that over the last three decades, the climate change slow onset events, including 1) increasing temperatures, 2) glacial retreat, 3) sea level rise, 4) ocean acidification, 5) soil salinization, 6) land and forest degradation, 7) loss of biodiversity, and 8) desertification, have substantially exacerbated. Simultaneously, other (non-GHGs related) anthropogenic impacts, including habitat fragmentation, land-use and sea-use change and misuse, species overexploitation, environmental pollution, infrastructure constructions, and urbanization, have considerably increased. With the aim of achieving the Shared Socio-Economic Pathways 1.9 (SSP1-1.9) or SSP1-2.6 ultimate goals—keeping global warming in 2,100 below 1.5°C or 2.0°C, respectively, compared to preindustrial levels—it may still be possible to avoid climate change’s irreversible tipping points. To reach this target, policymaking must become more decisive and proactive, with continuous risks assessment, frequent monitoring of outcomes and their compatibility to goals, implementing practical legislation tools, and assigning specific financial instruments, aimed at effectively tackling climate change slow onset events and related environmental issues. Substantial efforts should be invested in boosting climate change mitigation, while simultaneously targeting effective climatic change adaptation measures and promoting environmental conservation and restoration. Relying on tools such as the UN Sustainable Development Goals (SDGs) will sustain provisioning, supporting, regulating, and cultural ecosystem services, thus improving water-, food-, environmental-, energy-, economic-, health-, and governance-security, while lessening the risks of social unrest, violent conflicts, mass migration, and other humanitarian catastrophes.
Introduction
The United Nations Framework Convention on Climate Change (UNFCCC)—predesigned in the late 1980s, and officially established in 1992—provided the foundation for intergovernmental efforts to address the responsibility of humankind for the increased emission of greenhouse gases (GHGs) (Climate Change Secretariat, 2002). Specifically, the Convention was aimed at promoting an international environmental treaty for combating climate change and its worldwide adverse impacts on natural and managed ecosystems, as well as on human health and welfare. The Convention acknowledged that per capita emissions are substantially greater in developed countries than in developing ones, but that the share of emissions from the developing countries is expected to grow to meet their social, economic, and developmental needs. Thus, the Convention called for ‘cooperation by all countries and their participation in effective international response, in accordance with their common but differentiated responsibilities and respective capabilities, as well as with their social and economic conditions’ (UNFCCC, 1992).
The simultaneous establishment of Conference of the Parties (COP) as the supreme body of the UNFCCC provided the Convention with administrative instruments for stabilizing atmospheric GHG concentrations, and with the timeframe for its implementation (Climate Change Secretariat, 2002). It was declared that ‘the Parties should protect the climate system for the benefit of present and future generations, and on the basis of equity. Accordingly, the developed country Parties should take the lead in combating climate change and its adverse impacts’. Further, in terms of adaptation actions, it was declared that priority should be given to developing country Parties that are particularly vulnerable to adverse impacts of climate change, such as small island countries, low-lying coastal countries, dryland countries, etc. Article seven in the treaty details the COP’s responsibilities, among which is the periodic examination of ‘obligations of the Parties and the institutional arrangements under the Convention … review reports submitted by its subsidiary bodies and provide guidance to them’, and set up ‘ordinary sessions of the COP every year’ (UNFCCC, 1992).
Although the first COP meeting (COP1) was held in 1995 (in Berlin) (UNFCCC, 1995), it is a direct outcome of the UN Earth Summit (also known as the UN Conference on Environment and Development) held in 1992 in Rio de Janeiro, which addressed climatic change and related challenges, including increasing temperatures and decreasing precipitations, sea level rise, ocean acidification, soil salinization, land degradation and desertification, forest and biodiversity loss, and other environmental issues (UN, 1993). Since then, and over three decades, many additional COP meetings were held (Table 1). Among the earlier meetings, the Kyoto Conference 1997) is particularly remarkable as it led to the publishing of the Kyoto Protocol, which states specific and measurable actions to be taken by the Parties. Among these actions, the requirement to reduce global GHG emissions by at least 5% in the commitment period between 2008 and 2012, is probably the most ambitious (UN, 1998). Among the later meetings, the Paris Conference (2015) is a prominent landmark due to the resulting Paris Agreement, with the specific call for limiting global warming to 1.5–2.0°C compared to pre-industrial levels. Four years later, in 2019, a voluntary initiative of the COP26 Universities Network—a group of over 80 United Kingdom universities and research centers—was established, aimed at promoting the goal of ‘net zero emissions’ (also named as ‘carbon neutrality’) by 2050 (Reid and Wood, 2021).
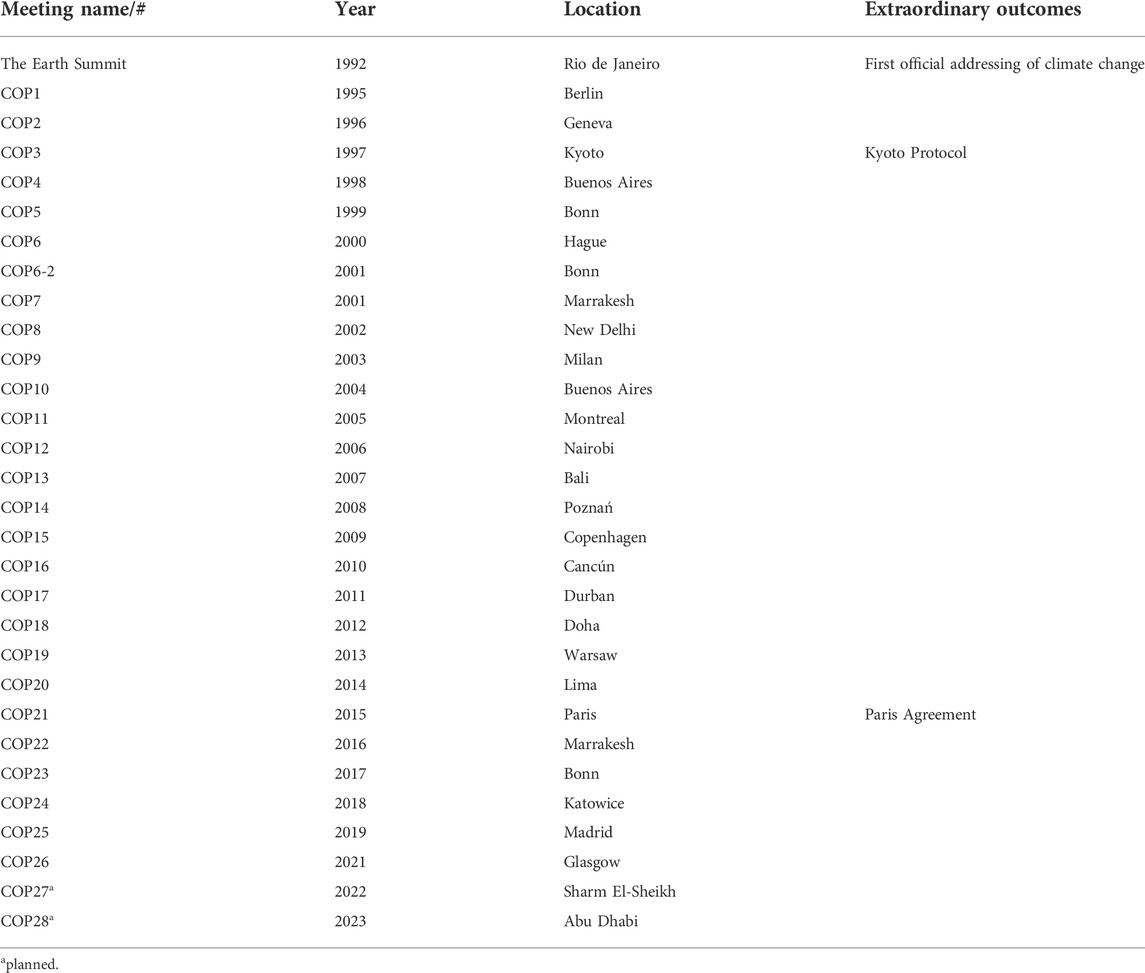
TABLE 1. The United Nations Framework Convention on Climate Change (UNFCCC) Conference of the Parties (COPs)’ meeting history.
However, despite these meetings, decisions, and recommendations, global GHG emissions have continued to rise over time, continuously breaking records of atmospheric concentrations of the major GHGs—including carbon dioxide (CO2: Figure 1A), methane (CH4: Figure 1B), and nitrous oxide (N2O: Figure 1C). Among the GHGs, CO2 is the most widespread, and its main anthropogenic sources are related to land-use change, deforestation, and burning of fossil fuels (Harper et al., 2018). The main anthropogenic sources of CH4 are enteric fermentation by ruminant livestock animals, as well as rice paddies and landfills. The global warming potential (GWP) of CH4 is 28 times greater than that of CO2 (Lin et al., 2021). The main anthropogenic source of N2O is the excess use of nitrogen (N) fertilizer in agricultural lands. The GWP of N2O is ∼300 times greater than that of CO2 (Wang et al., 2021).
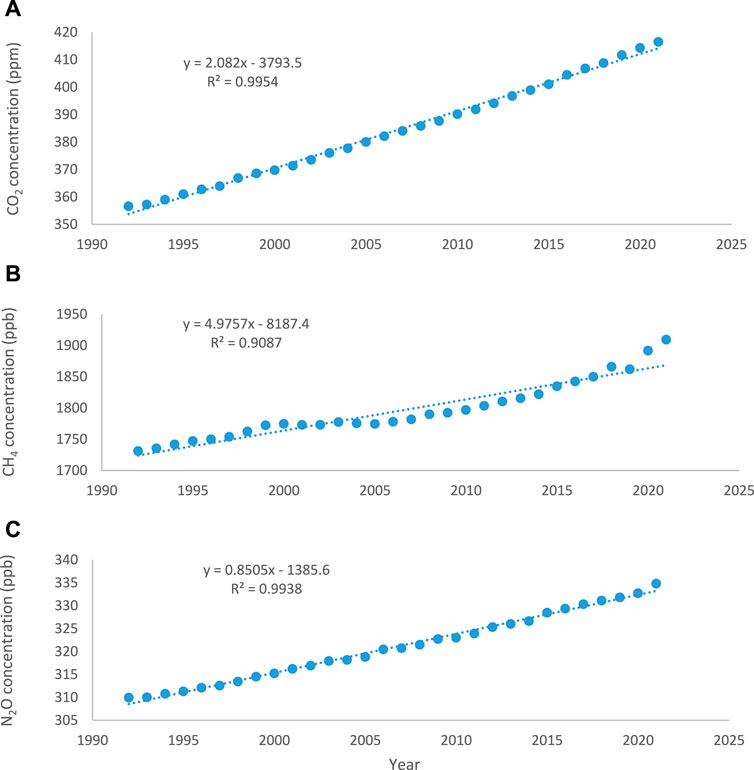
FIGURE 1. Changes in atmospheric concentrations of carbon dioxide (CO2: (A), methane (CH4: (B), and nitrous oxide (N2O: (C) between 1992 and 2021. Data source: https://www.statista.com/statistics/1091926/atmospheric-concentration-of-co2-historic/ (A); https://www.eea.europa.eu/data-and-map/s/daviz/atmospheric-concentration-of-carbon-dioxide-5#tab-chart_5_filters=%7B%22rowFilters%22%3A%7B%7D%3B%22columnFilters%22%3A%7B%22pre_config_polutant%22%3A%5B%22CH4%20(ppb)%22%5D%7D%7D (B); https://www.eea.europa.eu/data-and-maps/daviz/atmospheric-concentration-of-carbon-dioxide-5#tab-chart_5_filters=%7B%22rowFilters%22%3A%7B%7D%3B%22columnFilters%22%3A%7B%22pre_config_polutant%22%3A%5B%22N2O%20(ppb)%22%5D%7D%7D (C).
Concordant with the soaring atmospheric GHG concentrations, climate change, expressed by extreme weather events and abrupt interruptions of climatic patterns, including severe and consecutive droughts on the one hand, and harsh rainstorms and devastating floods on the other hand, have become the new ‘normal’ weather regime (Bowen, 2015). The biophysical effects of climate change are various, and occur over a wide range of temporal scales. Among these, eight effects that take place over relatively long timeframes have been termed by the UNFCCC as ‘slow onset effects’ (or ‘slow onset events’). These events include 1) increasing temperatures, 2) glacial retreat, 3) sea level rise, 4) ocean acidification, 5) soil salinization, 6) land and forest degradation, 7) loss of biodiversity, and 8) desertification (UNFCCC, 2012). The objective of this synthesis study is to concisely review the sequential trends caused by the slow onset events over the last three decades (1992–2021), as well as some of the most influential consequences for future life on Earth. As shown throughout this synthesis, failure to halt the accelerating increase in atmospheric GHG concentrations and the consequent abrupt climatic change over this timeframe have exacerbated the slow onset events, risking biophysical quality of terrestrial and marine ecosystems, and jeopardizing ecosystem services. However, beyond the climate change related slow onset events, other (non-GHGs related), direct anthropogenic impacts—including habitat fragmentation, land- (and sea-) use change and misuse, environmental pollution, and species overexploitation, alongside mineral mining and quarrying, infrastructure construction, and urbanization—have amplified some of these events throughout the last three decades. Further, the net effect of some of these direct anthropogenic impacts may exceed the effects of climate change, substantially modifying the Earth’s biophysical environment and degrading ecosystem services. These direct anthropogenic impacts are concisely discussed, emphasizing their potential consequences for global sustainability.
Increasing temperatures
Radiative forcing, in which the mix of gases in the atmosphere retains some of the solar energy from reflection on Earth, is a natural process that enables life on Earth. However, elevated GHG concentrations in the atmosphere causes the energy imbalance (Wigley, 2021). Sequential data obtained by the National Oceanic and Atmospheric Administration (NOAA) clearly demonstrate the increased radiative forcing by CO2, CH4, N2O, as well as their total radiative forcing between 1992 and 2019 (Figure 2A). The term Equilibrium Climate Sensitivity was coined to assist in estimating the climatic response to radiative forcing, aimed at avoiding climatic irreversible tipping points, and particularly negating temperature rise beyond a certain level (IPCC, 2014; IPCC 2021).
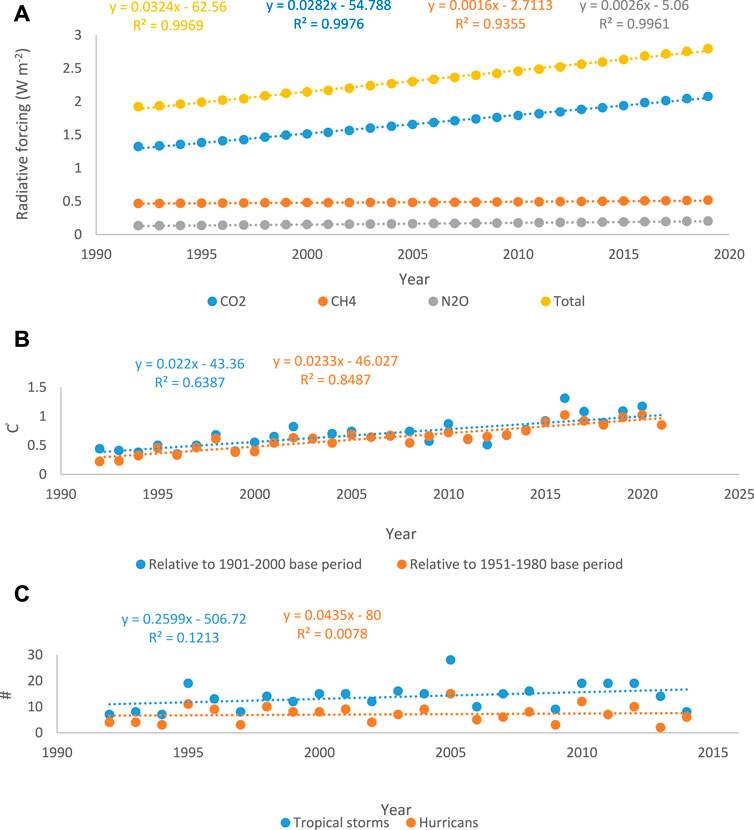
FIGURE 2. Changes in radiative forcing imposed by carbon dioxide (CO2), methane (CH4), and nitrous oxide (N2O), as well as total radiative forcing, between 1992 and 2019 (A); global temperature anomalies relative to the 1901–2000 and 1951–1980 base periods (B); the number of tropical storms and hurricanes per year, at a global scale, between 1992 and 2014 (C). Data source: NOAA (National Oceanic and Atmospheric Administration). 2020. The NOAA Annual Greenhouse Gas Index. www.esrl.noaa.gov/gmd/aggi (A); Data source for the 1901–2000 base period: https://www.ncdc.noaa.gov/cag/global/time-series; data source for the 1951–1980 base period: https://climate.nasa.gov/vital-signs/global-temperature/ (B); https://www.nhc.noaa.gov/climo/images/AtlanticStormTotalsTable.pdf (C).
Specifically, compared to preindustrial level (the 1850–1900 baseline), the global surface temperature average over 2081–2,100 is projected to be higher by 1.0–1.8°C (1.5°C on average) under the very low GHG emissions scenario (‘Taking the green road 1st: coded as the Shared Socioeconomic Pathways (SSP)1–1.9, or as the Representative Concentration Pathway (RCP)1.9 (where the 1.9 represents the end-of-century radiative forcing of 1.9 W m−2)). At the same time, the low GHG emissions scenario (‘Taking the green road 2nd: SSP1-2.6, or RCP2.6) will cause global warming of up to 2.0°C. Further, the intermediate GHG emissions scenario (‘Middle of the road’: SSP2-4.5, or RCP4.5) is anticipated to cause temperature increase by 2.1–3.5°C, whereas the high GHG emissions scenario (‘A road divided’: SSP3-7.0, or RCP7.0) is expected to increase temperature by 2.8–4.6°C, and the very high GHG emissions scenario (‘Taking the highway’: SSP5-8.5, or RCP8.5) is forecasted to increase temperature by 3.3–5.7°C (IPCC, 2021). Regardless, it is acknowledged that global warming highly varies across the globe. For example, the average temperature of the coldest days in the Arctic region is projected to increase by about three times the global average increase (IPCC, 2021), while in the Mediterranean, mean temperatures in the coming decades are forecasted to be 20% warmer than the global average (Lionello and Scarascia, 2018).
Overall, global warming during the last three decades is evident when addressing temperature anomalies. Data obtained by NOAA and the National Aeronautics and Space Administration (NASA) show an increasing trend of global temperature between 1992 and 2021 relative to baselines of both 1901–2000 and 1951–1980 (Figure 2B). Further, of the 10 warmest years between 1880 and 2020, eight were in the second decade of the 21st century. The other two warmest years were 2005 and 2010 (https://www.ncei.noaa.gov/access/monitoring/monthly-report/global/202013).
Specifically, increasing global temperatures warm ocean water and elevate oceanic evaporation, therefore interrupting the natural water cycle (Collins et al., 2013), and increasing the frequency and magnitude of extreme climatic events, such as major (category 3–5) tropical cyclones (IPCC, 2021; Bloemendaal et al., 2022). At the same time, there is uncertainty regarding long-term trends of all (including both ‘normal’ and major) Atlantic hurricanes and tropical cyclones (IPCC, 2021). To some extent, this concurs with data obtained by NOAA, demonstrating a slight and non-significant increase in total number of tropical storms and hurricanes per year between 1992 and 2014 (Figure 2C). It was suggested that the long-term trend toward more high-end rapid intensification (24-h intensification events of ≥50 kt day−1) of tropical cyclones is somewhat muted by the simultaneous trend toward La Niña-like climatic conditions, increasing cyclone activity over the north Atlantic while decreasing it over the north and south Pacific (Klotzbach et al., 2022). One way or another, rising global temperatures have caused monsoon activity to increase since the 1980s over West Africa (IPCC, 2021).
Increased water-loss from terrestrial water bodies by evaporation is an additional important direct effect of elevated temperatures on the biophysical environment (Xia et al., 2022). Another prominent direct effect is higher soil-water evaporation, which has resulted in long-term and severe ecological and agricultural stress, reducing the soil’s capacity to support primary productivity (Dolschak et al., 2019; IPCC, 2021). The resulting mass mortality of vegetation, and the consequent decreased plant cover, is expected to cause the aggravation of sand- and dust-storms (ESCAP, 2018). Overall, the increased evaporation losses impact natural biogeochemical cycles and adversely affect a wide range of ecosystem services and functions (Mooney et al., 2009). Further, the increasing temperatures are projected to accelerate permafrost thawing in high latitudes (IPCC, 2021). Due to the massive stores of organic carbon locked in permafrost, thawing triggers extensive microbial breakdown of carbon into CO2 and CH4 that are released to the atmosphere, generating a positive feedback with climate change (Schuur et al., 2015). The combined effect of the increasing temperatures degrades ecological and environmental quality, deteriorating water-, food-, economic-, and health-security for extensive human populations, resulting in generation and exacerbation of humanitarian catastrophes across the globe (Stavi et al., 2021a).
Glacial retreat
Net loss of glacier cover has been mostly substantial for the northern hemisphere. Across the Arctic sea ice region, glacier cover has substantially decreased. Between 2011 and 2020, annual average cover of Arctic sea ice reached its lowest level since at least 1850. Compared to the 1979–1988 timeframe, glacier cover in 2010–2019 across this region has decreased by 40% in September (when Arctic sea ice reaches its minimum) and by 10% in March (IPCC, 2021). September Arctic sea ice is declining at a rate of 13% per decade relative to the 1981–2010 average (Figure 3A). Over the past two decades, a substantial decrease in ice sheet mass was also observed for Greenland (Figure 3B). According to a recently published long-term study, the loss of Greenland’s ice sheet increased from 41 ± 17 Gt yr−1 in 1990–2000 to 187 ± 17 Gt yr−1 in 2000–2010 and to 286 ± 20 Gt yr−1 in 2010–2018. However, due to a series of cold summers, the acceleration trend in ice sheet loss shifted from positive in 2000–2010 to negative in 2010–2018 (Mouginot et al., 2019).

FIGURE 3. Change in Arctic sea ice cover (in September) between 1992 and 2021 (A); Greenland ice sheet cumulative mass variation between 2002 and 2021 (B); Antarctica ice sheet cumulative mass variation between 2002 and 2021 (C). Data source: https://climate.nasa.gov/vital-signs/arctic-sea-ice/ (A); https://climate.nasa.gov/vital-signs/ice-sheets/ (B,C).
While there is a consensus regarding the tremendous decline in northern glaciers and ice sheets, it seems that glacier and ice trends in the southern polar region are somewhat controversial. In a recent summary for policymakers by the Intergovernmental Panel on Climate Change (IPCC), it was stated that due to opposing impacts and substantial variability across the Antarctic sea ice over the past decades, the trend in ice sheet and glacier cover is not clear (IPCC, 2021). At the same time, NASA shows a clear decrease in Antarctica’s ice sheet mass over the last two decades (Figure 3C). This trend is consistent with a recent long-term study, which revealed that Antarctica’s ice sheet mass loss increased from 50 ± 14 Gt yr−1 in 1989–2000 to 166 ± 18 Gt yr−1 in 1999–2009 and to 252 ± 26 Gt yr−1 in 2009–2017. To some extent, this controversy could be attributed to local variability in surficial conditions and the resulting glacial processes (Rignot et al., 2019). At a finer resolution, this controversy is exemplified by Zhang et al. (2020), who recorded that the ice sheet volume of west Antarctica declined while it increased in east Antarctica during the years 2002–2019. For the very same timeframe, Zhang and others found a net loss of 68.7 ± 8.1 km3 yr−1 of Antarctic ice sheet volume, and an acceleration loss rate of 5.5 ± 0.9 km3 y−2.
A recent review study showed that between 1994 and 2017, Earth lost 28 trillion tonnes of ice, including 7.6 trillion tonnes from the Arctic sea ice, 6.5 trillion tonnes from Antarctic ice shelves, 6.1 trillion tonnes from mountain glaciers, 3.8 trillion tonnes from the Greenland ice sheet, 2.5 trillion tonnes from the Antarctic ice sheet, and 0.9 trillion tonnes from the Southern Ocean sea ice. Of these, 58% of the ice loss was from the Northern Hemisphere, and 42% from the Southern Hemisphere. According to the same study, since the 1990s, the rate of ice loss has increased by 50%—from 0.8 to 1.2 trillion tonnes per year (Slater et al., 2021).
Among the mountain glaciers, those in the Central Asian corridors—such as the Tien Shan, Pamir, Karakoram, and Himalaya—are of specific interest. Substantial changes in these glaciers’ mass have been reported for the last decades and are also forecasted for the coming decades. These changes are attributed to latitudinal, altitudinal, topographic, and geologic conditions, as well as to glacier type and properties (Chen et al., 2016; Li et al., 2016; Shahgedanova et al., 2020). Yet, an overall negative mass balance—both for the past and future—has been reported/forecasted for most Central Asian glaciers (Chen et al., 2016; Li et al., 2016; Pohl et al., 2017; Bolch et al., 2022). In humanitarian terms, the receding Central Asian glaciers directly impact the living conditions of large rural populations, which are already vulnerable and often impoverished, and generally lack the financial or political capacity to overcome the changing environmental conditions (USAID, 2018). The most direct forecasted effect is the decrease in glacier-fed streamflow, reducing the availability of fresh water for domestic use and agricultural irrigation by local populations, adversely affecting their water-, food-, and economic-security (Stavi et al., 2021a). In addition, hydropower generation, which relies on glacial water flow, is also expected to substantially decrease, adversely impacting energy security for these populations (USAID, 2018).
Sea level rise
Global sea level rise is attributed to the simultaneous impacts of melting glaciers and ice sheets, and the thermal expansion of the oceans’ water. Globally, thermal expansion was responsible for 50% of sea level rise between 1971 and 2018, while the remainder is attributed to melting glaciers and ice sheets (IPCC, 2021). Oceans’ water thermal expansion is attributed to the increase in water temperature. Data obtained by NASA shows an increasing trend in global sea surface temperature anomaly (between 1992 and 2020: Figure 4A), and a corresponding sea level rise (between 1993 and 2021: Figure 4B). Relative to the 1995–2014 baseline, the likely global mean sea level rise by 2,100 is 0.28–0.55 m under the very low GHG emissions scenario (SSP1-1.9/RCP1.9), 0.32–0.62 m under the low GHG emissions scenario (SSP1-2.6/RCP2.6), 0.44–0.76 m under the intermediate GHG emissions scenario (SSP2-4.5/RCP4.5), and 0.63–1.01 m under the very high GHG emissions scenario (SSP5-8.5/RCP8.5) (IPCC, 2021).
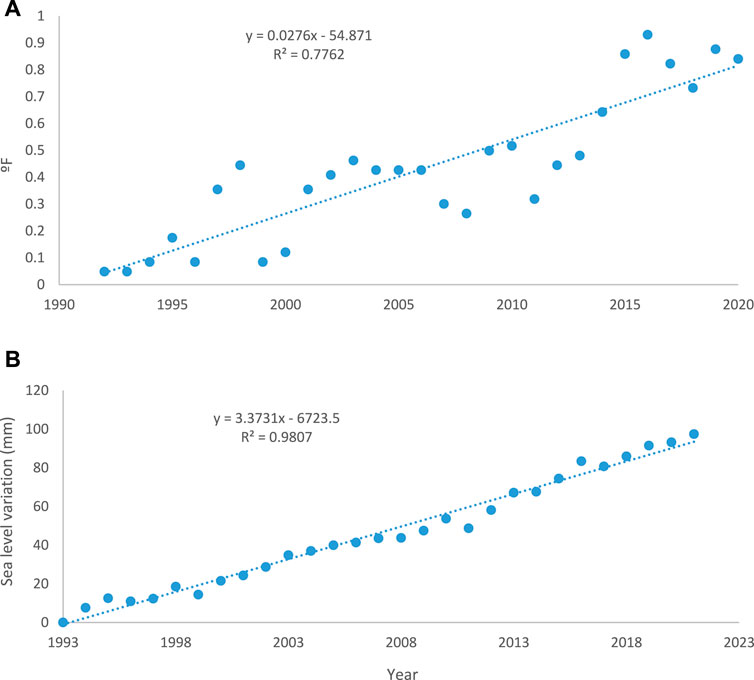
FIGURE 4. Mean global sea surface temperature anomaly between 1992 and 2020, relative to the 1971–2000 baseline (A); mean change in sea level between 1993 and 2021 (B). Data source: https://www.epa.gov/sites/default/files/2021-04/sea-surface-temp_fig-1.csv; https://www.epa.gov/climate-indicators/climate-change-indicators-sea-surface-temperature (A); https://climate.nasa.gov/vital-signs/sea-level/ (B).
Specifically, sea level rise risks coastal aquifers, increasing the probability of groundwater salinization and adversely affecting water security of extensive human populations around the world (Jasechko et al., 2020; IPCC, 2022a). Also, sea level rise is expected to increase the frequency and severity of coastal flooding in low-lying areas, and to intensify shoreline erosion along sandy coasts (IPCC, 2021). A particular adverse impact is the projected damages to shoreline infrastructures (IPCC, 2022a), and specifically to coastal cities that have expanded into areas previously uninhabited due to flood risk. Low-lying cities exist in some of the most populated countries, such as China, India, Bangladesh, several Southeastern Asian countries, as well as in some other parts of the world, and are expected to experience substantial inundation already in the mid-21st century (Jevrejeva et al., 2016).
Overall, it seems that flooding risks affect global populations disproportionally, as the relative contribution of developed countries to sea level rise is 64–69% greater than that of developing countries (updated data to 2005: Hardy and Nuse, 2016). Within the latter group of countries, a special focus on inequality should be put on Small Island Developing States (SIDS: Thomas et al., 2020), which encompass a total of 58 states across the Caribbean Sea, Atlantic Ocean, Indian Ocean, South China Sea, and the Pacific Ocean (UN-OHRLLS, 2015). Altogether, the SIDS inhabit approximately 65 million people (approximately 0.8% of the ∼8.0 billion global human population: Mead, 2021), while contributing less than 1% of global GHG emissions, and yet, suffer the most from sea level rise (Thomas et al., 2020). The inherent physical features of SIDS—small size and remoteness—make them highly susceptible to the influence of large-scale ocean-atmosphere interactions, such as trade winds, El Niño, monsoons, tropical cyclones, and hurricanes. In addition, many SIDS—among which are nine least developed countries (LDCs)—experience particular socio-economic hardships, which further aggravate their vulnerability. This includes small population size, high dependence on traditional economic sectors such as agriculture and fishery, and high public debt level (UN-OHRLLS, 2015), as well as the concentration of large populations (of which one-third live on land less than 5 m above sea level), agricultural lands, and infrastructures in coastal zones. Altogether, these conditions exacerbate the susceptibility of SIDS to climate change, and worsen the water-, food-, environmental-, and economic-insecurity of their populations (Mead, 2021). In economic terms, the annual climate change-related loss of gross domestic product (GDP) in SIDS ranges between ∼1.0 and 6.5%, as opposed to a world average of ∼0.5% (UN-OHRLLS, 2015).
Sea level rise has already displaced people in a number of SIDS including Kiribati, Solomon Islands, the Marshall Islands, and the Federated States of Micronesia. Displacement of people from SIDS is expected to surge over the 21st century, as extensive lands in these islands will become inhabitable as a result of sea level rise (UN-OHRLLS, 2015). Indeed, SIDS are recognized as the most immediately vulnerable area to mass outmigration (Handmer and Nalau, 2019). The migrated and resettled SIDS’ populations are likely to experience substantial changes in their social fabric, traditional culture, and lifestyle, with the probable significant degradation in their economic security (UN-OHRLLS, 2015; Handmer and Nalau, 2019).
Ocean acidification
Acidification of oceans is a complex phenomenon in which several contributing factors together lower the pH of seawater. This phenomenon is predominated by atmospheric CO2 incorporation in the seawater-pools of dissolved inorganic carbon, which originate from several oceanic biogeochemical cycles and sources (Mostofa et al., 2016). It is evident that during the last three decades ocean acidification has been substantial. Data obtained from the United States Environmental Protection Agency (EPA: www.epa.gov/climate-indicators/climate-change-indicators-ocean-acidity) for Hawaii (1992–2018), Bermuda (1992–2015), Cariaco (NE Venezuela: 1992–2014), and the Canary Islands (1995–2009), shows a trend of decreasing seawater pH for all sites (though not significantly so for the latter) (Figure 5A). While the increase in acidification of oceans has been primarily attributed to the continuously rising atmospheric concentration of CO2, the contribution of natural factors—including plant litter decomposition, volcanic eruptions, CO2 emissions from freshwater sources, etc.—is also acknowledged (Mostofa et al., 2016). Regardless, oceans’ elevated CO2 (alongside higher seawater temperature) may increase primary productivity (a process known as the ‘CO2 fertilization effect’) of specific marine species, partially offsetting the atmospheric concentration of this GHG (Holding et al., 2015). Yet, data obtained from the EPA’s website demonstrate the increase in ocean CO2 partial pressure (pCO2) for each of the four sites over time (though not significantly so for the Canary Islands) (Figure 5B). Assessing the Pearson product-moment correlation coefficient between the ocean pCO2 level and seawater pH reveals a negative and very strong correlation for Hawaii (r = -0.9913), the Canary Islands (r = -0.9991), and Bermuda (r = -0.9800), whilst a negative but only intermediately-strong correlation for Cariaco (r = -0.4767) (data for calculation of r values was obtained from: www.epa.gov/climate-indicators/climate-change-indicators-ocean-acidity).
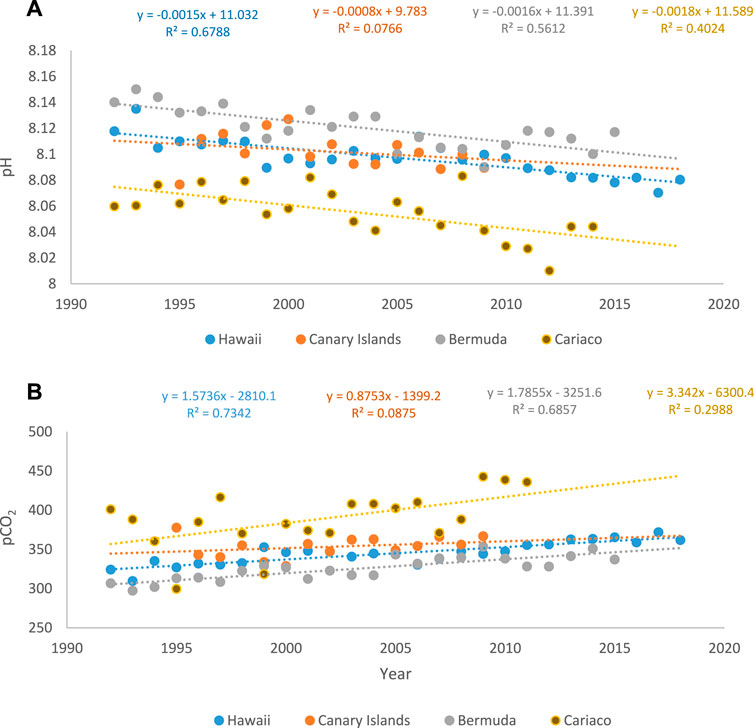
FIGURE 5. Mean change in ocean pH between 1992 and 2018 (A); mean change in ocean CO2 partial pressure (pCO2) between 1992 and 2018 (B). Data source: Bates, 2016; González-Dávila, 2012; University of South Florida, 2021; University of Hawaii, 2021; EPA's Climate Change Indicators in the United States: www.epa.gov/climate-indicators; https://www.epa.gov/climate-indicators/climate-change-indicators-ocean-acidity
In addition, anthropogenic emissions of nitrogen oxides (NOx) and sulfur dioxide (SO2) by industrial, transportation, and agricultural sectors, increase the acidity of aerosols that are then deposited in oceans, further elevating ocean acidity (Baker et al., 2021). Overall, ocean acidification causes substantial modifications in the seawater carbonate (CO32−) system, with simultaneous, complex impacts on its components. Calcifying organisms are specifically impacted, as the lower pH of seawater decreases calcification and growth rates of corals and other marine organisms (Mostofa et al., 2016), and dissolves their calcium carbonate (CaCO3) structure. Specifically, in warm water, symbiosis between corals and the unicellular microalgae Symbiodinium genus may be interrupted, resulting in the loss of the characterizing brown symbionts and a subsequent paling of the coral host, a process known as bleaching. Coral bleaching at the scale of colonies or groups of colonies has been documented since the early 20th century. Yet, regional-scale mass bleaching was first reported in the early 1980s. It was suggested that oceans’ rising temperature combined with increasing acidification accelerate coral mass bleaching (Hoegh-Guldberg et al., 2017).
Coral reefs support biodiversity and encompass habitats for rich wildlife. Once mass bleaching takes place, it degrades the resilience of reef ecosystems, eventually causing their collapse. Beyond the adverse effects on this supporting ecosystem service, mass bleaching is expected to adversely affect other services. Among the provisioning ecosystem services, fishery is the most obvious, providing vital nutrition to many coastal communities. Also, in some communities, such as the Solomon Islands, corals are harvested and used as a construction material. In terms of regulating services, the reefs protect shoreline areas from waves and extreme storms, thus lessen coastal erosion. Simultaneously, the reefs store carbon and enable the cycling of nutrients and other elements. The most prominent cultural service is probably reef tourism, which has grown substantially over recent decades (UN-OHRLLS, 2015; Woodhead et al., 2019). Obviously, the most adversely impacted human communities are those who reside in SIDS, where coral reefs encompass an important source for subsistence, fisheries, tourism, and shoreline protection. This risk seems to be particularly relevant for SIDS in the Pacific and Indian Oceans, where some of the SIDS have already lost 80% of their corals (UN-OHRLLS, 2015). Under the SSP1-2.6/RCP2.6 GHG emissions scenario, global SIDS are projected to lose 70–90% of reef-building corals, while under the SSP2-4.5/RCP4.5 scenario and beyond, global SIDS may lose up to 99% of corals (IPCC, 2022b).
Soil salinization
Natural soil salinity is attributed to the prevailing geophysical conditions, and is known as primary salinization. These geophysical conditions include the parent material mineralogy, topography, and the water table properties. One of the major causes of primary salinization is chemical weathering of parent material, and the resulted release of cations (such as calcium (Ca2+), potassium (K+), magnesium (Mg2+), and sodium (Na+)) and anions (such as bicarbonates (HCO3−), chloride (Cl−), and sulphate (SO42−)) to the soil solution. In saline soils, the salt content reduces the plants’ water uptake capacity, decreases the availability of nutrients for vegetation, and imposes plant toxicity (Litalien and Zeeb, 2020; Stavi et al., 2021b). Salinity, measured in electrical conductivity (EC) of the soil solution, ranges from 0 to 2 dS m−1 for non-saline, 2–4 dS m−1 for slightly saline, 4–8 dS m−1 for moderately saline, 8–16 dS m−1 for strongly saline, and >16 dS m−1 for very strongly saline soil (Salt Farm Foundation, 2018).
In humid regions, the dissolved ions are prone to leaching and transportation to surface or belowground waterbodies. However, in drylands, the soluble ions remain in the soil exchangeable complex, or precipitate as secondary minerals. This precipitation can occur when the ionic concentration in the soil solution reaches the saturation of a certain salt. Under certain conditions, Na+ ions may replace the precipitated less soluble salts in the exchange complex, a process known as primary sodification, which imposes high toxicity conditions for plants. Depending on the salt composition in the soil solution, primary salinization-sodification processes may also take place, characterized by EC value > 4 dS m−1 (compared to EC < 4 in sodic soils) and pH value being usually <8.5 (compared to pH > 8.5 in sodic soils) (Stavi et al., 2021b). A specific type of soil salinization, termed as ‘saline seep’, occurs in recharge alluvial plains laying over shallow, salt-rich underground waterbodies (SDSU Extension, 2019).
Like in warm dryland regions, where high evaporation rates increase the salt concentration of the water solution (Stavi et al., 2021b), the global rising temperatures elevate evaporation rates, increasing the extent and severity of soil salinization. Additionally, the increase in frequency and magnitude of droughts across extensive parts of the world is further expected to accelerate the extent and severity of soil salinity (Bannari and Al-Ali, 2020). An additional primary salinity mechanism is related to aeolian salt deposition, in which salts originating in seawater are deposited—either by rainfall (wet deposition) or without rainfall (dry deposition)—up to several kilometres inland, causing salinization across extensive areas (Hassani et al., 2021). A specific primary salinity process in coastal areas that are prone to tides is caused by the intrusion of seawater into inland’s surface- or underground-water bodies. For surface water bodies, this process is specifically prominent in river deltas. The extent and severity of this process are exacerbated by the rising sea level (Eslami et al., 2021).
Sometimes, it is not easy to distinguish between the site-specific share of anthropogenic vs natural causes of salinization. Yet, soil salinity, sodicity, and salinity-sodicity processes in non-agricultural lands are usually attributed to droughts and increasing temperatures, and therefore, are more related to ‘natural’ causes. At the same time, such processes taking place in agricultural lands, and specifically in irrigated croplands, are generally attributed to direct anthropogenic impacts, and are termed secondary salinization, secondary sodification, or secondary salinization-sodification (Stavi et al., 2021b). Time-series databanks or exclusive maps for dynamics over time of naturally-vs anthropogenic-caused saline and sodic soils do not exist. Nevertheless, a recent study shows that global saline land area increased from slightly over 9 M km2 in 1986 to over 10.5 M km2 in 2016 (Ivushkin et al., 2019). Figure 6 demonstrates the global distribution of saline, sodic, and saline-sodic lands. A recent modeling study of future soil salinization dynamics until 2,100 identifies the drylands of Southwest United States, Central and South America, South Africa, and Australia as salinity hotspots, whilst forecasting a decrease in soil salinity in Northwest United States, Eastern Europe, western Central Asia, and the Horn of Africa (Hassani et al., 2021).
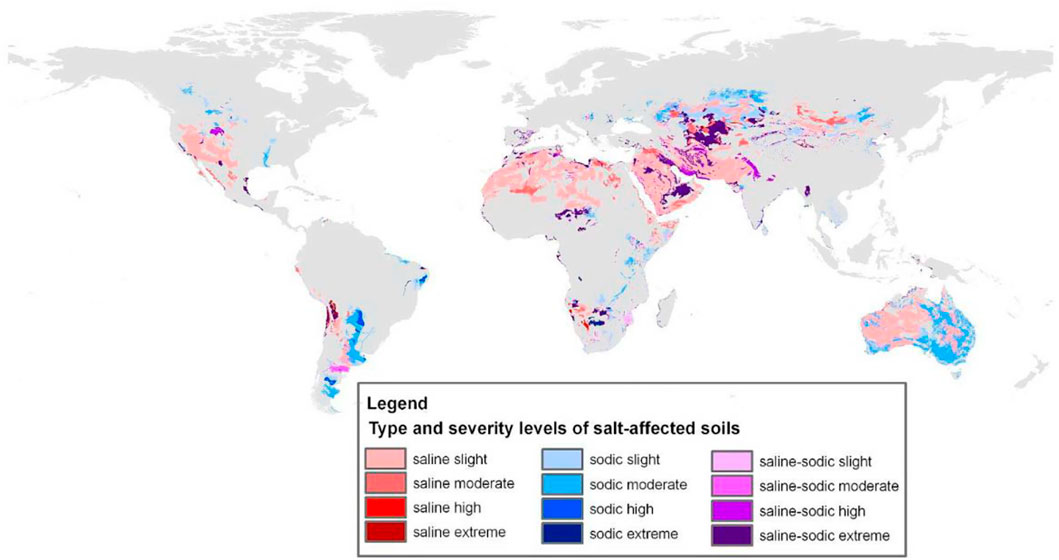
FIGURE 6. Global distribution of saline, sodic, and saline-sodic soils. Source: Encyclopedia of the Environment (unknown date). https://www.encyclopedie-environnement.org/en/zoom/land-salinization/
Land and forest degradation
Land degradation encompasses several processes that can take place separately, or in conjunction with others. The main processes of land (or soil) degradation are structure deformation, depleted organic carbon pool, biochemical deterioration (including nutrient depletion and acidification), salinization (and the related processes of sodification and combined salinization-sodification), and erosion by wind or water (Olsson et al., 2019). Climatic change is a major cause of land and soil degradation, with prominent impacts on each of the involved processes (Talukder et al., 2021). Further, oxidation of soil organic carbon emits CO2 to the atmosphere, turning soils from carbon-sinks to carbon-sources, and exacerbating climatic change feedbacks (Lal, 2010). Yet, it seems that the complex nature of land and soil degradation, as well as the difficulty in monitoring its spatiotemporal dynamics (including the degree of degradation—ranging between light, moderate, strong, and extreme), have negated the generation of time-series, globally inclusive database of this issue. Specifically, distinguishing between ‘natural’ causes of land and soil degradation processes vs anthropogenic ones—such as habitat fragmentation, vegetation clearing, land-use change, agricultural malpractices, irrational grazing management, the expansion of infrastructures, urbanization, and environmental pollution—is often impossible. One way or another, climatic change aggravates anthropogenic-driven processes of land and soil degradation (Olsson et al., 2019; Talukder et al., 2021). Taking these limitations into account, and considering the substantial uncertainties, no conclusive insights can be achieved regarding global extents and trends of naturally-driven land and soil degradation over the period of focus of this study (1992–2021).
Yet, a global assessment for 1997–2003 estimated that land degradation processes occur in 15–63% of total land area (Safriel, 2007). According to the United Nations, between 2000 and 2015, global proportion of degraded land encompassed 20% of the total land area (https://unstats.un.org/sdgs/report/2019/goal-15/: Figure 7A). A proxy global assessment of land degradation, determined according to changes in remotely sensed Normalized Difference Vegetation Index (NDVI) data for 1981–2003, revealed degradation of a total area of over 35 M km2 throughout this period, encompassing ∼23% of the globe’s terrestrial area (Bai et al., 2008). A somewhat more recent global assessment of NDVI changes—for 1998–2013—reveals net declined or stressed productivity in 19% of grasslands and 26% of shrublands and other open lands (European Environment Agency, 2019). Recently, the United Nations Convention to Combat Desertification (UNCCD) estimated the global extent of land degradation to encompass over 18 M km2 (UNCCD, 2021). The decreased productive capacity of the degraded lands substantially deteriorates a wide range of ecosystem services and functions, namely reduced food, feed, and fiber production, hence risking food- and economic-security (GEF, 2019).
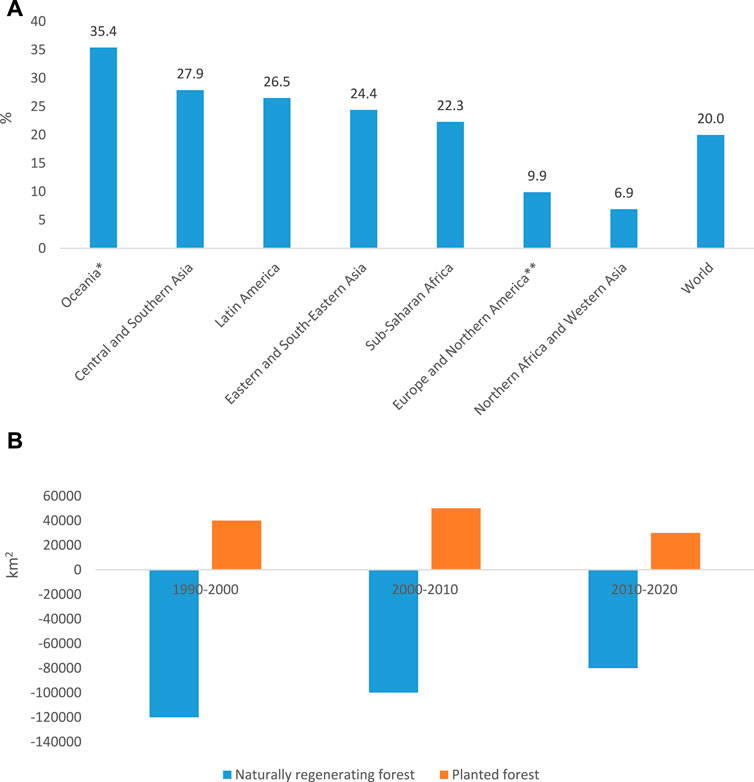
FIGURE 7. Proportion of degraded land between 2000 and 2015 (%) (A); global annual net change in area of naturally regenerating- and planted-forests, by decade, between 1990 and 2020 (B). Notes: *Including Australia, New Zealand and Papua New Guinea, and excluding the islands of Oceania; **Excluding Switzerland and the United States; modified from: https://unstats.un.org/sdgs/report/2019/goal-15/ (A); modified from: https://www.fao.org/forest-resources-assessment/2020/en/ (B)
In terms of forest degradation, one of its main indicators is tree dehydration, which is attributed to increasing temperatures and long-term droughts (Earles et al., 2018). Drought-stressed trees become more susceptible to pest infestations, resulting in mass tree mortality. Regardless of drought-stress, increasing temperatures accelerate the spread of some tree pathogens and diseases throughout the world’s forests (Anderegg et al., 2015). One way or another, the stressed or desiccated trees become an available fuel, elevating the frequency and magnitude of high-severity wildfires. Forest wildfires turn biomass-assimilated carbon into CO2, emitting this GHG to the atmosphere and aggravating climatic change feedbacks (Berenguer et al., 2021). Regardless, the extent of anthropogenic deforestation for the logging industry and/or for the establishment of croplands and grazing lands, as well as for urbanization and the construction of infrastructures, has been enormous, accelerating the rates of forest loss. Yet, the global rate of forest area loss is under debate. For example, according to the Global Forest Watch, out of ∼40 M km2 of global forests, deforestation for logging, agriculture, and urbanization between 2001 and 2021 encompassed ∼1.17 M km2, 0.88 M km2, and 31 k km2, respectively (https://www.globalforestwatch.org/). However, according the World Bank, total (including both natural- and anthropogenic-driven) loss of forest area across the globe is considerably less, encompassing a total of 1.3 M km2 between 1990 and 2016 (https://data.worldbank.org/indicator/AG.LND.FRST.K2). According to the Food and Agriculture Organization (FAO) of the United Nations, between 1990 and 2020, the rate of annual loss of naturally regenerating forests has decreased, and moreover, faced some mitigation by forest planting (Figure 7B). Yet, in addition to negating the important regulating ecosystem service of carbon sequestration, the combination of natural- and anthropogenic-driven forest degradation adversely affects many other ecosystem services. Among the other regulating services, flood and soil erosion control are probably the most prominent. The major provisioning services are forest-derived food (such as fruits, nuts, edible bulbs, and mushrooms) and wood (including logs, poles, and fuelwood) products. Among the supporting services, biodiversity is most important. Forests also fulfil cultural and spiritual services, such as heritage sites and communal identity (Stavi et al., 2022).
Nevertheless, despite the generally adverse impacts of climatic change on the world forests, higher atmospheric CO2 concentrations are acknowledged to increase tree photosynthesis through the CO2 fertilization effect. With this effect, forests’ increasing productivity offsets some of the CO2 emissions, potentially mitigating climate change to some extent. However, while this effect seems to be prominent for young trees, its potential impact on mature trees is still questionable, a fact that is related to the tree’s carbon-use efficiency, which is higher in young individuals than in mature ones (Luo and Niu, 2020).
Loss of biodeversity
Biodiversity loss has been widely attributed to the degradation or extinction of ecosystems and habitats. Climatic change, specifically rising temperatures, has caused extensive destruction of terrestrial, marine, and freshwater ecosystems, with the consequent adverse impact on biodiversity’s supporting ecosystem service. Specifically, temperatures exceed levels that species can cope with, causing the mass mortality of plants and animals. The rising temperatures also accelerate infestation of diseases and pathogens, further threatening many species in diverse biomes. If global warming is to exceed 2.1°C in 2,100 (SSP2-4.5/RCP4.5 and beyond), risks of habitat collapse and ecosystems extinction are to escalate rapidly, with biodiversity hotspots suffering the most (IPCC, 2022c). According to the United Nations, over the last decades, the Red List Index of species survival—which represents the changing state of global biodiversity—has declined by ∼10%, from 0.821 in 1993 to 0.735 in 2019 (https://unstats.un.org/sdgs/report/2019/goal-15/; Figure 8).
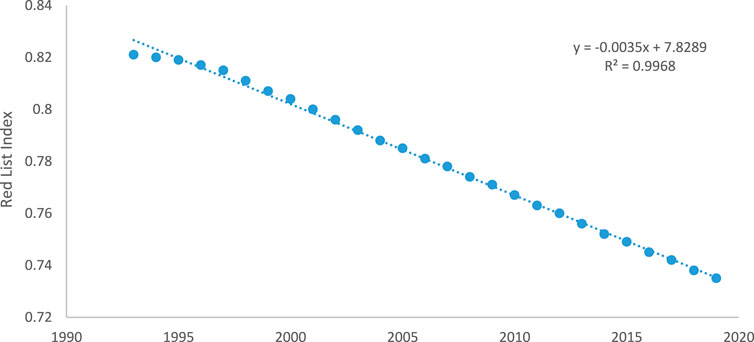
FIGURE 8. Red List Index of species (including >20,000 species of mammals, birds, amphibians, corals, and cycads) survival, between 1993 and 2019. Source: UN Stats. https://unstats.un.org/sdgs/report/2019/goal-15/
However, a plethora of studies have shown that climate change impact on biodiversity is not that clear. Regarding plant diversity, global extinctions have generally not been directly related to climatic change. At the same time, local extinctions have taken place in the climatic margins of a species’ range. Overall, the major threats (in descending importance) to plant diversity were identified as habitat loss-fragmentation-degradation > species overexploitation > species invasion > air pollution > climate change (Corlett, 2016). A global meta-analysis of local-scale plant biodiversity changes over time—comprised of information provided in published studies and of data obtained from reports on vegetation monitoring plots around the world—revealed no clear adverse effect on species richness and diversity. The timeframe for these studies and reports varied highly, and ranged between five and 261 years. While some of the studies and reports showed an increase in species richness and/or diversity, others showed a decline in these vegetation parameters. Specifically, despite the possible decline in plant diversity at a local scale—for example due to species outmigration—global-scale plant biodiversity is not necessarily adversely affected by climatic change (Vellend et al., 2013).
A recent report by the World Wildlife Fund (WWF, 2020) assessed the risk imposed on animal (including mammals, birds, fish, reptiles, and amphibians) biodiversity by climate change between 1970 and 2016, alongside the threats imposed by four other main factors, including land- (and sea-) use change and misuse, species overexploitation, invasive species and diseases, and environmental pollution. The assessment was separately conducted for five regions, including North America; Latin America and Caribbean; Europe and Central Asia; Africa; and Asia-Pacific. Altogether, these five factors reduced the global abundance of 20,811 populations—representing 4,392 animal species—by 68% along this period. However, calculating the average risk imposed on biodiversity by each of the five factors revealed that climate change is of least importance. Namely, the impact imposed by these factors followed the order of land- (and sea-) use change and misuse (50.1 ± 2.3%) > species overexploitation (24.4 ± 2.8%) > invasive species and diseases (12.6 ± 0.6%) > environmental pollution (6.8 ± 1.6%) > climate change (6.1 ± 1.4%) (means and SE calculation is based on data obtained from WWF, 2020).
Nevertheless, in the context of biodiversity loss, separating between the impacts of climate change and other dominating factors is not always straightforward. For example, climatic changes are expected to stimulate vegetation invasion. A broadly accepted viewpoint is that climatic changes increase the capacity of alien plant species to invade new territories, while simultaneously decreasing the resistance of natural ecosystems to invasions by interrupting their dynamic equilibrium (Thuiller et al., 2007). Yet, the impact of climate change on vegetation invasiveness seems to be rather complex, and moreover, scale-dependent. A systematic review of many modeling case studies showed high variability in the effects of climatic change on vegetation invasion in terrestrial systems. Specifically, in regional-to global-scale models, a reduction in species range size was predicted more often than an increase. Conversely, in local-to small-scale models, an increase in species range size was forecasted more frequently than a reduction (Bellard et al., 2018).
Desertification
Desertification is defined as land degradation in dry sub-humid, semi-arid, and arid regions, whereas land degradation in hyper-arid regions is excluded from the definition of desertification (UNCCD, 1994; see Figure 9 for global desertification vulnerability map (USDA-NRCS, 1998)). This process causes the deterioration of productive capacity, ecological integrity, and ecosystem services of the affected land. Desertification derives from either natural or anthropogenic causes, with often the two act simultaneously. Among the ‘natural’ causes, climate change is predominant (Mirzabaev et al., 2019; Fan et al., 2020). A recent assessment of climatic trends across the world’s drylands between 1979 and 2018 revealed a general increase in temperatures and decrease in precipitations, with the most notable changes recorded during the last decade. During this entire period, the rate of temperature increase has been 0.032°C yr−1, and the rate of precipitation decrease has been 0.074 mm month−1 yr−1 (Daramola and Xu, 2022). Yet, at the regional scale, variations are more dramatic. For example, warming of the Saharan Belt and the surrounding oceans during recent decades has led to substantial modifications in the nature of the Hadley Cell system, causing convective rainstorms to become more intense and intermittent (Biasutti, 2019). In the China–Mongolia–Russia Economic Corridor, between 2000 and 2015, the areal cover of slight desertification has faced ∼32% increase (from ∼720,000 km2 to ∼950,000 km2), while that of severe desertification has faced ∼13% decrease (from ∼82,000 km2 to ∼71,000 km2). Overall, while the total desertified area along this period increased by ∼10%, the degree of desertification showed a decreasing trend (Fan et al., 2020). At the same time, another study implemented in Central Asia revealed regional increasing temperatures since the 1980s, coupled with northward and eastward areal expansion of the arid-cold (BWk) climatic region into the semi-arid-cold (BSk) climatic region (Hu and Han, 2022).
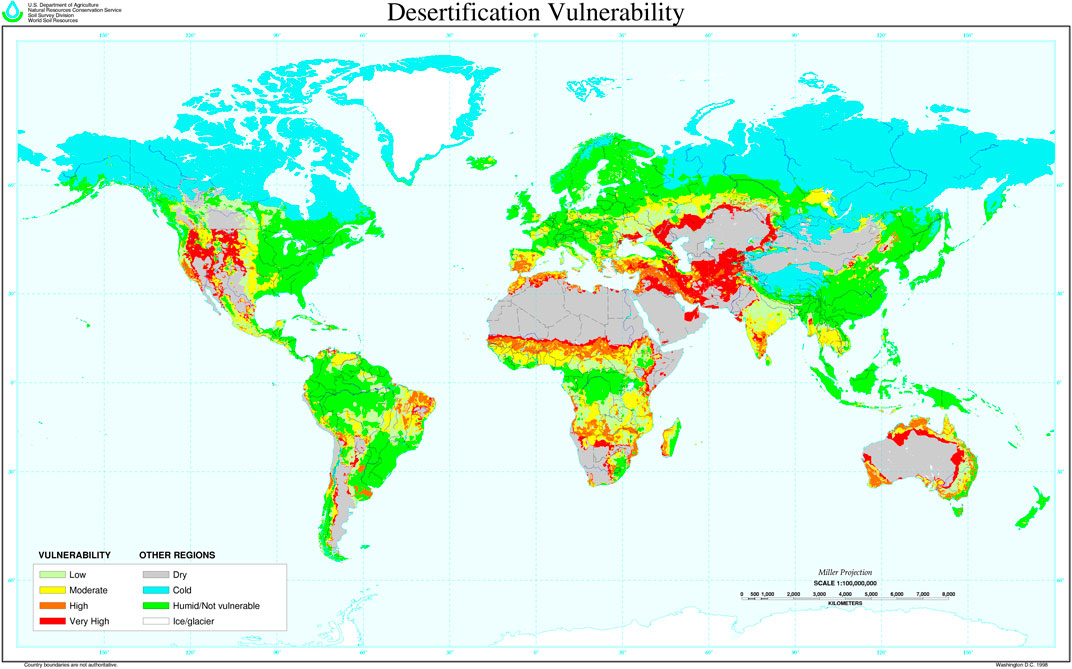
FIGURE 9. Global desertification vulnerability map. Source: USDA-NRCS (1998). https://www.nrcs.usda.gov/wps/portal/nrcs/detail/soils/use/worldsoils/?cid=nrcs142p2_054003
One way or another, increasing temperatures and severe droughts across extensive drylands elevate evaporation loss and reduce soil-water content, causing the mass mortality of vegetation (Stavi et al., 2018). The resulted increase in frequency and severity of dust- and sand-storms further exaggerate drylands’ environmental degradation. The simultaneous rarer but stronger rainstorms cause extensive flooding and large-scale soil erosion processes, alongside depletion of soil organic carbon pools. The combined effect of these processes causes the expansion and aggravation of drylands. However, because different sets of indicators, approaches, and methodologies are used, the global assessment of extent and severity of desertification is rather complicated, and suffers substantial uncertainties. Further, these uncertainties complicate the quantification of past desertification, as well as the prediction of future desertification (Mirzabaev et al., 2019). Yet, a recent study showed that between 1982 and 2015, climate change has caused the degradation and desertification of almost 5.5 M km2 (encompassing almost 13%) of the world drylands (Burrell et al., 2020). A recently developed index—the Global Desertification Vulnerability Index (GDVI)—revealed that the present combined impact of climatic change and direct anthropogenic activities impose moderate, high, and very high desertification risk in 13, 7, and 9%, respectively, of the global terrestrial area. Compared to the 2000–2014 baseline, the GDVI projects that in 2,100, the areal coverage of low desertification risk will decline from 47 to 35% under the SSP2-4.5/RCP4.5, and to 24% under the SSP5-8.5/RCP8.5 (Huang et al., 2020).
Yet, in addition to modern climatic changes that are attributed to anthropogenic emissions of GHGs, desertification processes can also be generated by natural meteorological conditions. For example, changes in regional wind patterns that modify dust deposition, possibly decreasing the input of mineral material to the system. The simultaneous increase in extent and severity of soil erosion processes results in the net loss of mineral materials from the system (Stavi et al., 2010). Overall, the major anthropogenic drivers of desertification are land-use change and unsustainable land management practices, including intensified agriculture, overgrazing by livestock, and clearing of woody vegetation, alongside extensive infrastructure construction, mineral mining and quarrying, urban expansion, and environmental pollution. These practices and land-uses increase the pressures imposed on the already fragile drylands, exacerbating the degradation in their productivity and functioning (Mirzabaev et al., 2019). Across the world, desertification adversely affects the livelihood of over 200 million people, most of whom live in developing countries (Burrell et al., 2020) in South, Central, and East Asia, the Middle East, the Saharan Belt, and North and West Africa (Mirzabaev et al., 2019). The combined effect of ‘natural’ and anthropogenic driven desertification is expected to deteriorate the water-, food-, environmental-, energy-, economic-, health-, and governance-security of human populations across the world’s drylands. Further, these impacts are expected to exaggerate the potential for social unrest, violent conflicts, and mass migration, aggravating humanitarian disasters across the globe (Stavi et al., 2021a).
Boosting climate change mitigation and adaptation, and enhancing environmental conservation and restoration: A wakeup call
Despite some uncertainties, it seems that climatic change slow onset events d have significantly exacerbated during the last three decades (between 1992 and 2021). Simultaneously, many other direct anthropogenic-driven causes have further aggravated the slow onset events and adversely affected environmental quality (Figure 10). Over time, the combined impacts of the slow onset events and other anthropogenic causes have substantially degraded provisioning, supporting, regulating, and cultural ecosystem services. The global human population growth—forecasted to reach 9.8 billion in 2050 and 11.2 billion in 2,100 (https://www.un.org/en/desa/world-population-projected-reach-98-billion-2050-and-112-billion-2100)—is expected to substantially exaggerate environmental stressors. This state calls for the implementation of urgent measures in climate change mitigation and adaptation, as well as in environmental conservation and restoration.
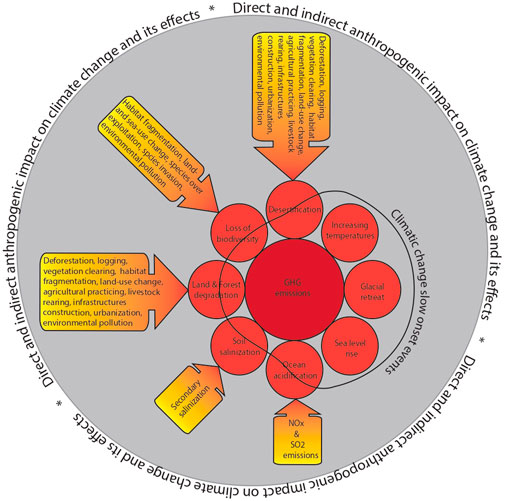
FIGURE 10. Direct and indirect anthropogenic impact on climatic change and its effects.
Fore and foremost, proactive decision making at all levels—ranging between the local to international scales—should become more decisive, including continuous risk assessment, frequent monitoring of outcomes and their compatibility to goals, implementing practical legislation tools, and assigning specific financial instruments, aimed at enhancing the mitigation of climatic change slow onset events and related environmental aspects (Jones et al., 2014). Shifting to more nature-based solutions and environmentally-friendly modes of operation should be encouraged by subsidizing the relevant economic sectors. Another potential mechanism is by paying for accomplishing ecosystem services (Capodaglio and Callegari, 2018). Policy makers may benefit from following the United Nations Sustainable Developments Goals (UN SDGs: https://sdgs.un.org/), while allowing flexibility and adjustments of its principles according to emerging environmental issues. Alongside these measures, decision makers should promote climate- and environmental-justice policies, particularly supporting the most vulnerable communities and countries, which are often deprived of governance power at the local, national, regional, and international levels (Thomas et al., 2020).
In the energy sector, fossil fuels should be replaced by renewable energy sources, such as solar, wind, geothermal, marine energies, biomass conversion-based energies, and others (Demirbaş, 2006). Deforestation should be heavily controlled, and offset by extensive climate-smart afforestation and reforestation projects (Verkerk et al., 2020). Also, mass tree planting in croplands and grazing lands should be promoted, by applying agroforestry and silvopastoral practices (Raskin and Osborn, 2019). In relevant coastal areas, conservation and restoration of mangrove systems should be promoted, to control inundation and minimize coastline erosion (Kumano et al., 2021). Further, tree-planting in densely populated areas such as towns and municipalities should be maximized, to reduce the ‘urban heat island’ effect (Schwaab et al., 2021). Overall, land degradation should be minimized by adopting conservation practices, coupled with the use of offsetting mechanisms such as the Zero Net Land Degradation (ZNLD, also known as the Land Degradation Neutrality (LDN): Tal, 2015). Regardless, promoting a change in human diet from animal-protein based to alternative sources of protein—through extensive investments in the food-tech sector—is expected to substantially cut the stressors imposed on global agricultural and grazing lands, while simultaneously conserving water resources, reducing GHG emissions, and lessening environmental pollution (Mbow et al., 2019).
Regardless, environmental contamination should be minimized through the control and treatment of pollution sources, alongside the implementation of environmentally-friendly waste management, and the recovery of polluted air, water, and soil resources. A promising strategy in this context is the multiple-R concept, such as the Reduce-Reuse-Recycle (3R), Reduce-Reuse-Recycle-Recovery (4R), etc. (Yu et al., 2021). Simultaneously, the mass development of alternative eco-friendly and biodegradable materials, as well as of clean technologies (green technologies), should be of top priority (Ko, 2020). Altogether, judicious implementation of these measures is expected to assist in the reviving of global environmental health.
Conclusion
The rising atmospheric concentrations of GHGs over the past three decades (1992–2021) has caused the substantial exacerbation of climatic change. Despite some uncertainties, it seems that this caused the aggravation of slow onset effects, including increasing temperatures, glacial retreat, sea level rise, ocean acidification, soil salinization, land and forest degradation, loss of biodiversity, and desertification. Yet, as shown throughout this review study, other (non-GHGs related) anthropogenic impacts, such as habitat fragmentation, land- (and sea-) use change and misuse, environmental pollution, and urbanization, have also intensified along this period, considerably increasing the stressors imposed on environmental quality and ecosystem services. Therefore, proactive policymaking and legislation of climate change mitigation measures, alongside effective adaptation means and inclusive environmental conservation and restoration practices, should be of top priority, potentially alleviating the damages to environmental health and global sustainability, and avoiding climatic irreversible tipping points.
Author contributions
IS has designed, wrote, and finalized the manuscript.
Funding
The Dead Sea and Arava Science Center is supported by the Israel Ministry of Science and Technology.
Acknowledgments
The author is grateful to Michelle Finzi for proofreading of the manuscript. The author much appreciates the helpful and constructive comments made by two reviewers on the original submission.
Conflict of interest
The author declares that the research was conducted in the absence of any commercial or financial relationships that could be construed as a potential conflict of interest.
Publisher’s note
All claims expressed in this article are solely those of the authors and do not necessarily represent those of their affiliated organizations, or those of the publisher, the editors and the reviewers. Any product that may be evaluated in this article, or claim that may be made by its manufacturer, is not guaranteed or endorsed by the publisher.
References
Anderegg, W. R. L., Hicke, J. A., Fisher, R. A., Allen, C. D., Aukema, J., Bentz, B., et al. (2015). Tree mortality from drought, insects, and their interactions in a changing climate. New Phytol. 208, 674–683. doi:10.1111/nph.13477
Bai, Z. G., Dent, D. L., Olsson, L., and Schaepman, M. E. (2008). Proxy global assessment of land degradation. Soil Use Manag 24, 223–234. doi:10.1111/j.1475-2743.2008.00169.x
Baker, A. R., Kanakidou, M., Nenes, A., Myriokefalitakis, S., Croot, P. L., Duce, R. A., et al. (2021). Changing atmospheric acidity as a modulator of nutrient deposition and ocean biogeochemistry. Sci. Adv. 7, eabd8800. doi:10.1126/sciadv.abd8800
Bannari, A., and Al-Ali, Z. M. (2020). Assessing climate change impact on soil salinity dynamics between 1987-2017 in arid landscape using landsat TM, ETM+ and OLI data. Remote Sens. 12, 2794. doi:10.3390/rs12172794
Bellard, C., Jeschke, J. M., Leroy, B., and Mace, G. M. (2018). Insights from modeling studies on how climate change affects invasive alien species geography. Ecol. Evol. 8, 5688–5700. doi:10.1002/ece3.4098
Berenguer, E., Lennox, G. D., Ferreira, J., Malhi, Y., Aragão, L. E. O. C., Barreto, J. R., et al. (2021). Tracking the impacts of El Niño drought and fire in human-modified Amazonian forests. Proc. Natl. Acad. Sci. U. S. A. 118, 30. doi:10.1073/pnas.2019377118
Biasutti, M. (2019). Rainfall trends in the african sahel: Characteristics, processes, and causes. Wiley Interdiscip. Rev. Clim. Change 10, e591. doi:10.1002/wcc.591
Bloemendaal, N., de Moel, H., Martinez, A. B., Muis, S., Haigh, I. D., van der Wiel, K., et al. (2022). A globally consistent local-scale assessment of future tropical cyclone risk. Sci. Adv. 8, eabm8438. doi:10.1126/sciadv.abm8438
Bolch, T., Duethmann, D., Wortmann, M., Liu, S., and Disse, M. (2022). Declining glaciers endanger sustainable development of the oases along the Aksu-Tarim River (Central Asia). Int. J. Sustain. Dev. World Ecol. 29, 209–218. doi:10.1080/13504509.2021.1943723
Bowen, V. (2015). Extreme weather: Is 'abnormal' becoming the new 'normal'? Weather 70, S15–S16. doi:10.1002/wea.2528
Burrell, A. L., Evans, J. P., and De Kauwe, M. G. (2020). Anthropogenic climate change has driven over 5 million km2 of drylands towards desertification. Nat. Commun. 11, 3853. doi:10.1038/s41467-020-17710-7
Capodaglio, A. G., and Callegari, A. (2018). Can payment for ecosystem services schemes be an alternative solution to achieve sustainable environmental development? A critical comparison of implementation between Europe and China. Resources 7, 40. doi:10.3390/resources7030040
Chen, Y., Li, W., Deng, H., Fang, G., and Li, Z. (2016). Changes in central asia's water tower: Past, present and future. Sci. Rep. 6, 35458. doi:10.1038/srep35458
Climate Change Secretariat (2002). A guide to the climate change convention process, preliminary 2nd edition. AvaliableAt: https://unfccc.int/resource/process/guideprocess-p.pdf.
Collins, M., Knutti, R., Arblaster, J., Dufresne, J. L., Fichefet, T., Friedlingstein, P., et al. (2013). ““Long-term climate change: Projections, commitments and irreversibility”,” in The physical science basis. Contribution of working group I to the fifth assessment report of the intergovernmental Panel on climate change. Editors T. F. Stocker, D. Qin, G. K. Plattner, M. Tignor, S. K. Allen, J. Boschunget al. (Cambridge: Cambridge University Press). AvaliableAt: https://www.ipcc.ch/site/assets/uploads/2018/02/WG1AR5_Chapter12_FINAL.pdf.
Corlett, R. T. (2016). Plant diversity in a changing world: Status, trends, and conservation needs. Plant Divers. 38, 10–16. doi:10.1016/j.pld.2016.01.001
Daramola, M. T., and Xu, M. (2022). Recent changes in global dryland temperature and precipitation. Intl J. Climatol. 42, 1267–1282. doi:10.1002/joc.7301
Demirbaş, A. (2006). Global renewable energy resources. Energy Sources Part A Recovery Util. Environ. Eff. 28, 779–792. doi:10.1080/009083190910488
Dolschak, K., Gartner, K., and Berger, T. W. (2019). The impact of rising temperatures on water balance and phenology of European beech (Fagus sylvatica L.) stands. Model. Earth Syst. Environ. 5, 1347–1363. doi:10.1007/s40808-019-00602-1
Earles, J. M., Stevens, J. T., Sperling, O., Orozco, J., North, M. P., and Zwieniecki, M. A. (2018). Extreme mid-winter drought weakens tree hydraulic-carbohydrate systems and slows growth. New Phytol. 219, 89–97. doi:10.1111/nph.15136
ESCAP (2018). Sand and dust storms in Asia and the pacific: Opportunities for regional cooperation and action. The economic and social commission for Asia and the pacific. AvaliableAt: https://www.unescap.org/sites/default/files/UNESCAP%20SDS%20Report_1.pdf.
Eslami, S., Hoekstra, P., Minderhoud, P. S. J., Trung, N. N., Hoch, J. M., Sutanudjaja, E. H., et al. (2021). Projections of salt intrusion in a mega-delta under climatic and anthropogenic stressors. Commun. Earth Environ. 2, 142. doi:10.1038/s43247-021-00208-5
European Environment Agency (2019). Land degradation knowledge base: Policy, concepts and data. AvaliableAt: https://www.eionet.europa.eu/etcs/etc-uls/products/etc-uls-reports/etc-uls-report-2019-1-land-degradation-knowledge-base-policy-concepts-and-data.
Fan, Z., Li, S., and Fang, H. (2020). Explicitly identifying the desertification change in CMREC area based on multisource remote data. Remote Sens. 12, 3170. doi:10.3390/rs12193170
GEF (2019). Global environmental facility land degradation. AvaliableAt: https://www.thegef.org/sites/default/files/publications/gef_land_degradation_bifold_august_2019_0.pdf.
Handmer, J., and Nalau, J. (2019). “Understanding loss and damage in pacific small island developing states,” in Loss and damage from climate change – concepts, methods and policy options. Editors R. Mechler, M. Bouwer, T. Schinko, S. Surminski, and J. A. Linnerooth-Bayer (Berlin: Springer), 365–381. doi:10.1007/978-3-319-72026-5_15
Hardy, R. D., and Nuse, B. L. (2016). global sea-Level rise: Weighing country responsibility and risk. Clim. Change 137, 333–345. doi:10.1007/s10584-016-1703-4
Harper, A. B., Powell, T., Cox, P. M., House, J., Huntingford, C., Lenton, T. M., et al. (2018). Land-use emissions play a critical role in land-based mitigation for Paris climate targets. Nat. Commun. 9, 2938. doi:10.1038/s41467-018-05340-z
Hassani, A., Azapagic, A., and Shokri, N. (2021). Global predictions of primary soil salinization under changing climate in the 21st century. Nat. Commun. 12, 6663. doi:10.1038/s41467-021-26907-3
Hoegh-Guldberg, O., Poloczanska, E. S., Skirving, W., and Dove, S. (2017). Coral reef ecosystems under climate change and ocean acidification. Front. Mar. Sci. 4, 158. doi:10.3389/fmars.2017.00158
Holding, J. M., Duarte, C. M., Sanz-Martín, M., Mesa, E., Arrieta, J. M., Chierici, M., et al. (2015). Temperature dependence of CO2-enhanced primary production in the European Arctic Ocean. Nat. Clim. Change 5, 1079–1082. doi:10.1038/nclimate2768
Hu, Q., and Han, Z. (2022). Northward expansion of desert climate in Central Asia in recent decades. Geophys. Res. Lett. 49, e2022GL098895. doi:10.1029/2022gl098895
Huang, J., Zhang, G., Zhang, Y., Guan, X., Wei, Y., and Guo, G. (2020). Global desertification vulnerability to climate change and human activities. Land Degrad. Dev. 31, 1380–1391. doi:10.1002/ldr.3556
IPCC (2014). Climate change 2014: Synthesis ReportContribution of working groups I, II and III to the fifth assessment report of the intergovernmental Panel on climate change. Geneva, Switzerland: IPCC, 151. AvaliableAt: https://www.ipcc.ch/site/assets/uploads/2018/02/SYR_AR5_FINAL_full.pdf.
IPCC (2022a). Climate change 2022: Impacts, adaptation and vulnerability – summary for policymakers. The Working Group II contribution to the Sixth Assessment Report. AvaliableAt: https://www.ipcc.ch/report/sixth-assessment-report-working-group-ii/.
IPCC (2022c). Fact sheet - biodiversity: Climate change impacts and risks. Contribution of Working Group II to the Sixth Assessment Report of the Intergovernmental Panel on Climate Change. AvaliableAt: https://report.ipcc.ch/ar6wg2/pdf/IPCC_AR6_WGII_FactSheet_Biodiversity.pdf.
IPCC (2022b). Fact sheet - small Islands: Climate change impacts and risks. Contribution of Working Group II to the Sixth Assessment Report of the Intergovernmental Panel on Climate Change. AvaliableAt: https://www.ipcc.ch/report/ar6/wg2/downloads/outreach/IPCC_AR6_WGII_FactSheet_SmallIslands.pdf.
IPCC (2021). “Summary for policymakers”, in climate change 2021: The physical science basis,”in Contribution of working group I to the sixth assessment report of the intergovernmental Panel on climate change (Geneva: IPCC Press). AvaliableAt: https://www.ipcc.ch/report/ar6/wg1/downloads/report/IPCC_AR6_WGI_SPM_final.pdf.
Ivushkin, K., Bartholomeus, H., Bregt, A. K., Pulatov, A., Kempen, B., and de Sousa, L. (2019). Global mapping of soil salinity change. Remote Sens. Environ. 231, 111260. doi:10.1016/j.rse.2019.111260
Jasechko, S., Perrone, D., Seybold, H., Fan, Y., and Kirchner, J. W. (2020). Groundwater level observations in 250,000 coastal US wells reveal scope of potential seawater intrusion. Nat. Commun. 11, 3229. doi:10.1038/s41467-020-17038-2
Jevrejeva, S., Jackson, L. P., Riva, R. E. M., Grinsted, A., and Moore, J. C. (2016). Coastal sea level rise with warming above 2 °C. Proc. Natl. Acad. Sci. U.S.A. 113, 13342–13347. doi:10.1073/pnas.1605312113
Jones, R. N., Patwardhan, A., Cohen, S. J., Dessai, S., Lammel, A., Lempert, R. J., et al. (2014). ““Foundations for decision making”, in Climate change 2014: Impacts, adaptation, and vulnerability. Part A: Global and sectoral aspects,” in Contribution of working group II to the fifth assessment report of the intergovernmental Panel on climate change. Editors C. B. Field, V. R. Barros, D. J. Dokken, K. J. Mach, M. D. Mastrandrea, T. E. Biliret al. (Cambridge: Cambridge University Press). AvaliableAt: https://www.ipcc.ch/site/assets/uploads/2018/02/WGIIAR5-Chap2_FINAL.pdf.
Klotzbach, P. J., Wood, K. M., Schreck, C. J., Bowen, S. G., Patricola, C. M., and Bell, M. M. (2022). Trends in global tropical cyclone activity: 1990–2021. Geophys. Res. Lett. 49, e2021GL095774. doi:10.1029/2021gl095774
Ko, Y. T. (2020). Modeling an innovative green design method for sustainable products. Sustainability 12, 3351. doi:10.3390/su12083351
Kumano, N., Tamura, M., Inoue, T., and Yokoki, H. (2021). Estimating the cost of coastal adaptation using mangrove forests against sea level rise. Coast. Eng. J. 63, 263–274. doi:10.1080/21664250.2021.1892968
Lal, R. (2010). Managing soils and ecosystems for mitigating anthropogenic carbon emissions and advancing global food security. BioScience 60, 707–721. doi:10.1525/bio.2010.60.9.8
Li, Z., Tian, L., Wu, H., Wang, W., Zhang, S., Zhang, J., et al. (2016). Changes in glacier extent and surface elevations in the Depuchangdake region of northwestern Tibet, China. Quat. Res. 85, 25–33. doi:10.1016/j.yqres.2015.12.005
Lin, X., Zhang, W., Crippa, M., Peng, S., Han, P., Zeng, N., et al. (2021). A comparative study of anthropogenic CH4 emissions over China based on the ensembles of bottom-up inventories. Earth Syst. Sci. Data 13, 1037–1088. doi:10.5194/essd-13-1073-2021
Lionello, P., and Scarascia, L. (2018). The relation between climate change in the Mediterranean region and global warming. Reg. Environ. Change 18, 1481–1493. doi:10.1007/s10113-018-1290-1
Litalien, A., and Zeeb, B. (2020). Curing the Earth: A review of anthropogenic soil salinization and plant-based strategies for sustainable mitigation. Sci. Total Environ. 698, 134235. doi:10.1016/j.scitotenv.2019.134235
Luo, Y., and Niu, S. (2020). Mature forest shows little increase in carbon uptake in a CO2-enriched atmosphere. Nature 580, 191–192. doi:10.1038/d41586-020-00962-0
Mbow, C., Rosenzweig, C., Barioni, L. G., Benton, T. G., Herrero, M., Krishnapillai, M., et al. (2019). “Food security,” in Climate change and land: An IPCC special report on climate change, desertification, land degradation, sustainable land management, food security, and greenhouse gas fluxes in terrestrial ecosystems (Geneva: IPCC Press). AvaliableAt: https://www.ipcc.ch/site/assets/uploads/sites/4/2021/02/08_Chapter-5_3.pdf.
Mead, L. (2021). Small islands, large oceans: Voices on the frontlines of climate change. AvaliableAt: https://www.iisd.org/system/files/2021-03/still-one-earth-SIDS.pdf.
Mirzabaev, A., Wu, J., Evans, J., García-Oliva, F., Hussein, I. A. G., Iqbal, M. H., et al. (2019). ““Desertification”,” in Climate change and land: An IPCC special report on climate change, desertification, land degradation, sustainable land management, food security, and greenhouse gas fluxes in terrestrial ecosystems (Geneva: IPCC Press). AvaliableAt: https://www.ipcc.ch/site/assets/uploads/sites/4/2019/11/06_Chapter-3.pdf.
Mooney, H., Larigauderie, A., Cesario, M., Elmquist, T., Hoegh-Guldberg, O., Lavorel, S., et al. (2009). Biodiversity, climate change, and ecosystem services. Curr. Opin. Environ. Sustain. 1, 46–54. doi:10.1016/j.cosust.2009.07.006
Mostofa, K. M. G., Liu, C. Q., Zhai, W. D., Minella, M., Vione, D., Gao, K., et al. (2016). Reviews and syntheses: Ocean acidification and its potential impacts on marine ecosystems. Biogeosciences 13, 1767–1786. doi:10.5194/bg-13-1767-2016
Mouginot, J., Rignot, E., Bjørk, A. A., van den Broeke, M., Millan, R., Morlighem, M., et al. (2019). Forty-six years of Greenland ice sheet mass balance from 1972 to 2018. Proc. Natl. Acad. Sci. U.S.A. 116, 9239–9244. doi:10.1073/pnas.1904242116
Olsson, L., Barbosa, H., Bhadwal, S., Cowie, A., Delusca, K., Flores-Renteria, D., et al. (2019). “Land degradation”,” in Climate change and land: An IPCC special report on climate change, desertification, land degradation, sustainable land management, food security, and greenhouse gas fluxes in terrestrial ecosystems (Geneva: IPCC Press). AvaliableAt: https://www.ipcc.ch/site/assets/uploads/sites/4/2019/11/07_Chapter-4.pdf.
Pohl, E., Gloaguen, R., Andermann, C., and Knoche, M. (2017). Glacier melt buffers river runoff in the Pamir Mountains. Water Resour. Res. 53, 2467–2489. doi:10.1002/2016wr019431
Raskin, B., and Osborn, S. (2019). The agroforestry handbook – agroforestry for the UK. Bristol: Soil Association Ltd. AvaliableAt: https://www.soilassociation.org/media/19141/the-agroforestry-handbook.pdf.
Reid, A., and Wood, E. (2021). COP26-An introduction to the UN conference of the Parties. The scottish parliament information center (SPICe). AvaliableAt: https://sp-bpr-en-prod-cdnep.azureedge.net/published/2021/6/2/65344c5f-7066-4f46-aad8-92a91a4033e5/SB%2021-28.pdf.
Rignot, E., Mouginot, J., Scheuchl, B., van den Broeke, M., van Wessem, M. J., and Morlighem, M. (2019). Four decades of antarctic ice sheet mass balance from 1979-2017. Proc. Natl. Acad. Sci. U.S.A. 116, 1095–1103. doi:10.1073/pnas.1812883116
Safriel, U. N. (2007). “The Assessment of global trends in land degradation,” in Climate and land degradation. Editors M. V. K. Sivakumar, and N. Ndiang’ui (Berlin: Springer), 1–38.
Salt Farm Foundation (2018). Further reading on salinization, Hoornderweg. AvaliableAt: https://www.salineagricultureworldwide.com/uploads/file_uploads/files/More%20info%20on%20Salinization-%20Salt%20Farm%20Foundation%202018(1).pdf.
Schuur, E. A. G., McGuire, A. D., Schädel, C., Grosse, G., Harden, J. W., Hayes, D. J., et al. (2015). Climate change and the permafrost carbon feedback. Nature 520, 171–179. doi:10.1038/nature14338
Schwaab, J., Meier, R., Mussetti, G., Seneviratne, S., Bürgi, C., and Davin, E. L. D. (2021). The role of urban trees in reducing land surface temperatures in European cities. Nat. Commun. 12, 6763. doi:10.1038/s41467-021-26768-w
SDSU Extension (2019). Soybean best management practices – chapter 47: Managing high water tables and saline seeps in soybean production. Brookings: South Dakota State University Press. AvaliableAt: https://extension.sdstate.edu/sites/default/files/2020-03/S-0004-47-Soybean.pdf.
Shahgedanova, M., Afzal, M., Hagg, W., Kapitsa, V., Kasatkin, N., Mayr, E., et al. (2020). Emptying water towers? Impacts of future climate and glacier change on river discharge in the northern tien Shan, central Asia. Water 12, 627. doi:10.3390/w12030627
Slater, T., Lawrence, I. R., Otosaka, I. N., Shepherd, A., Gourmelen, N., Jakob, L., et al. (2021). Review article: Earth's ice imbalance. Cryosphere 15, 233–246. doi:10.5194/tc-15-233-2021
Stavi, I., Paschalidou, A., Kyriazopoulos, A. P., Halbac-Cotoara-Zamfir, R., Siad, S. M., Suska-Malawska, M., et al. (2021a). Multidimensional food security nexus in drylands under the slow onset effects of climate change. Land 10, 1350. doi:10.3390/land10121350
Stavi, I., Perevolotsky, A., and Avni, Y. (2010). Effects of gully formation and headcut retreat on primary production in an arid rangeland: Natural desertification in action. J. Arid Environ. 74, 221–228. doi:10.1016/j.jaridenv.2009.08.007
Stavi, I., Rachmilevitch, S., Hjazin, A., and Yizhaq, H. (2018). Geodiversity decreases shrub mortality and increases ecosystem tolerance to droughts and climate change. Earth Surf. Process. Landforms 43, 2808–2817. doi:10.1002/esp.4412
Stavi, I., Thevs, N., and Priori, S. (2021b). Soil salinity and sodicity in drylands: A review of causes, effects, monitoring, and restoration measures. Front. Environ. Sci. 9, 712831. doi:10.3389/fenvs.2021.712831
Stavi, I., Thevs, N., Welp, M., and Zdruli, P. (2022). Provisioning ecosystem services related with oak (Quercus) systems: A review of challenges and opportunities. Agroforest Syst. 96, 293–313. doi:10.1007/s10457-021-00718-3
Tal, A. (2015). The implications of environmental trading mechanisms on a future Zero Net Land Degradation protocol. J. Arid Environ. 112, 25–32. doi:10.1016/j.jaridenv.2014.05.013
Talukder, B., Ganguli, N., Matthew, R., vanLoon, G. W., Hipel, K. W., and Orbinski, J. (2021). Climate change‐triggered land degradation and planetary health: A review. Land Degrad. Dev. 32, 4509–4522. doi:10.1002/ldr.4056
Thomas, A., Baptiste, A., Martyr-Koller, R., Pringle, P., and Rhiney, K. (2020). Climate change and small island developing states. Ann. Rev. Environ. Resour. 45, 6–27. doi:10.1146/annurev-environ-012320-083355
Thuiller, W., Richardson, D. M., and Midgley, G. F. (2007). “Will climate change promote alien plant invasions?”,” in Ecological studies (Berlin: Biological Invasions. Springer), 197–211.
UN (1998). Kyoto protocol to the united Nations Framework convention on climate change. AvaliableAt: https://unfccc.int/resource/docs/convkp/kpeng.pdf.
UN (1993). Report of the united Nations conference on environment and development, volume I resolutions adopted by the conference. AvaliableAt: https://www.un.org/esa/dsd/agenda21/Agenda%2021.pdf.
UN-OHRLLS (2015). Small island developing states in numbers – climate change edition 2015. New York, NY: The United Nations Office of the High Representative for the Least Developed Countries. AvaliableAt: https://sustainabledevelopment.un.org/content/documents/2189SIDS-IN-NUMBERS-CLIMATE-CHANGE-EDITION_2015.pdf.
UNCCD (1994). Elaboration of an international convention to combat desertification in countries experiencing serious drought and/or desertification, particularly in Africa. United Nations Convention to Combat Desertification. AvaliableAt: https://wedocs.unep.org/bitstream/handle/20.500.11822/27569/UNCCD_English.pdf?sequence=1&isAllowed=y.
UNCCD (2021). Proportion of land that is degraded over total land area – SDG indicator 15.3.1, united Nations convention to combat desertification. AvaliableAt: https://unece.org/sites/default/files/2021-05/2.2_UNCCD_SDGIndicator1531_merged.pdf.
UNFCCC (1995). Provisional agenda and annotations, including suggestions for the organization of work – note by the Executive Secretary. AvaliableAt: https://unfccc.int/cop5/resource/docs/cop1/01.pdf.
UNFCCC (2012). Slow onset events – technical paper. AvaliableAt: https://unfccc.int/resource/docs/2012/tp/07.pdf.
UNFCCC (1992). United Nations Framework convention on climate change. AvaliableAt: https://unfccc.int/files/essential_background/background_publications_htmlpdf/application/pdf/conveng.pdf.
USAID (2018). Climate risk profile – central Asia fact sheet. Washington, D.C.2 United States Agency for International Development. AvaliableAt: https://reliefweb.int/sites/reliefweb.int/files/resources/2018-April-30_USAID_CadmusCISF_Climate-Risk-Profile-Central-Asia.pdf.
Vellend, M., Baeten, L., Myers-Smith, I. S., Elmendorf, S. C., Beauséjour, R., Brown, C. D., et al. (2013). Global meta-analysis reveals no net change in local-scale plant biodiversity over time. Proc. Natl. Acad. Sci. U.S.A. 110, 19456–19459. doi:10.1073/pnas.1312779110
Verkerk, P. J., Costanza, R., Hetemäki, L., Kubiszewski, I., Leskinen, P., Nabuurs, G. J., et al. (2020). Climate-smart forestry: The missing link. For. Policy Econ. 115, 102164. doi:10.1016/j.forpol.2020.102164
Wang, C., Amon, B., Schulz, K., and Mehdi, B. (2021). Factors that influence nitrous oxide emissions from agricultural soils as well as their representation in simulation models: A review. Agronomy 11, 770. doi:10.3390/agronomy11040770
Wigley, T. M. L. (2021). The relationship between net GHG emissions and radiative forcing with an application to Article 4.1 of the Paris Agreement. Clim. Change 169, 13. doi:10.1007/s10584-021-03249-z
Woodhead, A. J., Hicks, C. C., Norström, A. V., Williams, G. J., and Graham, N. A. J. (2019). Coral reef ecosystem services in the Anthropocene. Funct. Ecol. 33, 1023–1034. doi:10.1111/1365-2435.13331
WWF (2020). Living planet report 2020. Gland: World Wildlife Fund. AvaliableAt: https://www.zsl.org/sites/default/files/LPR%202020%20Full%20report.pdf.
Xia, Q. Q., Chen, Y. N., Zhang, X. Q., Ding, J. L., and Lv, G. H. (2022). Identifying reservoirs and estimating evaporation losses in a large arid inland basin in northwestern China. Remote Sens. 14, 1105. doi:10.3390/rs14051105
Yu, K. H., Zhang, Y., Li, D. N., Montenegro-Marin, C. E., and Kumar, P. M. (2021). Environmental planning based on reduce, reuse, recycle and recover using artificial intelligence. Environ. Impact Assess. Rev. 86, 106492. doi:10.1016/j.eiar.2020.106492
Keywords: climatic change feedbacks, coral bleaching, deforestation, global warming, mountain glacier, rainstorms and floods, Representative concentration pathway (RCP), Small island developing states (SIDS)
Citation: Stavi I (2022) Rio (1992) to Glasgow (2021): Three decades of inadequate mitigation of climate change and its slow onset effects. Front. Environ. Sci. 10:999788. doi: 10.3389/fenvs.2022.999788
Received: 21 July 2022; Accepted: 06 September 2022;
Published: 26 September 2022.
Edited by:
Haijun Deng, Fujian Normal University, ChinaReviewed by:
Shuhua Zhang, Xi'an University of Science and Technology, ChinaAndrea Santos, Federal University of Rio de Janeiro, Brazil
Copyright © 2022 Stavi. This is an open-access article distributed under the terms of the Creative Commons Attribution License (CC BY). The use, distribution or reproduction in other forums is permitted, provided the original author(s) and the copyright owner(s) are credited and that the original publication in this journal is cited, in accordance with accepted academic practice. No use, distribution or reproduction is permitted which does not comply with these terms.
*Correspondence: Ilan Stavi, aXN0YXZpQGFkc3NjLm9yZw==