 Nan Zhou1
 Ye Tian
 Xiang Cai
- 1Business School, Guilin University of Electronic Technology, Guilin, China
- 2College of Economics and Management, Beibu Gulf University, Qinzhou, China
- 3School of Management, Shinawatra University, Bangkok, Thailand
Sustainable business model innovation (SBMI) and green technology innovation (GTI) are keys to creating shared social and business value, and both are essential elements of responsible innovation. However, SBMI or GTI is unable to develop a sustainable business. The main purpose of this study is to analyze sustainable dual innovation as a conceptual framework based on the panel data of 1468 Chinese manufacturing A-share listed companies from 2010 to 2020, and it has obtained three essential findings. First, there is a significant matching effect between SBMI and GTI on sustainable corporate performance (SCP). Companies report higher levels of SCP when there is a higher congruence in SBMI with GTI. Secondly, organizations with high SBMI-low GTI realize superior SCP compared to organizations with low SBMI-high GTI. The high SBMI-low GTI becomes an ideal choice for most companies and avoids the “destructive factors” brought by low SBMI-high GTI. Finally, a highly aggressive corporate strategy has a “magnifying effect” on the impact of the combination of SBMI and GTI on SCP. The research provides a comprehensive understanding and collective impact of SBMI and GTI on SCP. Overall, findings provide a theoretical basis for enterprises to decide on the consistency/inconsistency trade-off between SBMI and GTI. Moreover, it encourages to enterprises must develop an aggressive strategy to balance.
1 Introduction
Sustainable development is now widely accepted, and businesses must innovate and implement sustainable initiatives as environmental problems become serious issues (Albitar et al., 2022). While green innovation is an essential element of sustainable development (Le, 2022), enterprises relied on green technology innovation (GTI) or sustainable business model innovation (SBMI) single path, which could not meet the requirements of sustainable development in the past.
According to Kluza et al. (2021), and Liao and Li (2022), SBMI and GTI are considered as most suitable for sustainable corporate performance (SCP). Green strategy (GS) is introduced as a solution to corporate sustainability strategies. Practical activities such as GTIs and new sustainable business models reduce the potential of the negative impact of their operations on the natural environment. Globally prominent companies such as Apple, Ricoh, IKEA, LEGO, and Google are starting to establish sustainable business practices and agreed to increase sustainability goals, creating new business models for customers on priority bases for sustainable development (Gaiardelli et al., 2014).
However, several studies have been conducted on sustainable development from the enterprise level, and most of the studies on corporate green development are based on the perspective of green technological progress (Yang et al., 2022). In contrast, not a single study has been found on sustainable development from the perspective of BM. However, Bocken et al. (2014) shows that SBMI effectively addresses sustainable corporate development. The SCP has become an influential agenda for the Chinese government. Especially in the development context, double reduction, and industrial transformation and upgrading. Conversely, China, the leading developing country, has the world’s largest manufacturing sector. One of the main pillars of economic growth has been the manufacturing industry in the past decades, which also has had a severe negative impact on the environment (Li et al., 2020). The Chinese government is actively upgrading its industries and guiding companies to focus on high-quality growth and balanced development. Moreover, sustainable development has become a global issue, and China is determined to reduce CO2 emissions by 2030 and achieve carbon neutrality by 2060 (Xi, 2022). These pressures and policies also force companies to focus on sustainable development; SBMI and GTI become necessary for enterprises to achieve sustainable development.
The SBMI and GTI are vital to creating shared social and business value (Chopra and Narayana, 2013; Spieth et al., 2019), and both are essential elements of responsible innovation (Schwab, 2017). While many companies recognize the importance of sustainability, GTI and SBMI cannot do sustainable businesses. However, literature is available on green innovation, but most of the current literature only examines the impact of SBMI or GTI on corporate sustainability. Literature on SBMI is mainly based on an “embedded” understanding of traditional business models, injecting “sustainability” only into the issues of value proposition, value creation, value capture, and value delivery (Baldassarre et al., 2017; Velter et al., 2020; Minatogawa et al., 2022). Moreover, literature on GTI tends to favor its results on the organization’s environmental or financial performance (Wang et al., 2021a; Cao et al., 2021; Ma et al., 2021). The empirical literature incorporating SBMI and GTI into an overall analytical framework to fully explain the mechanisms of action on SCP is particularly scarce, and both SBMI and GTI belong to the essential elements of green innovation. Therefore, this study aims to incorporate SBMI and GTI into a theoretical framework to investigate the effects of their interaction on SCP.
However, research on the SBMI and GTI interact to affect SCP faces two critical challenges: first, relative to GTI, existing research has focused on SBMI, which can lead to more direct business benefits, such as cost savings and new revenue streams (Schaltegger et al., 2012; Bocken et al., 2014), and improve organizational resilience (Buliga et al., 2016) and reputation (Homburg et al., 2013), therefore letting more intangible competitive advantages. It has been argued that SBMI has excellent potential to address long-term sustainability challenges (Stubbs and Cocklin, 2008; Foss and Saebi, 2017). Second, literature shows a particular interest in GTI in the long run; many business model innovations seem to have failed due to the lack of GTI cooperation (Patel, 2015; Taran et al., 2015; Geissdoerfer et al., 2018), longer-term view and paying more attention to GTI can we have a “greater future” (Lu et al., 2022; Wang et al., 2022). Several researchers in recent years provided evidence that the field of business models is increasingly progressively relevant to a scientific discipline (Boons and Lüdeke-Freund, 2013; Evans et al., 2017). Although SBMI and GTI have emerged as core elements for creating green competitive advantage (Lin and Chen, 2017; Bani-Melhem et al., 2022), literature is scared of exploring the combined effects of GTI and SBMI.
From this point of view, enterprises must maintain a balance between SBMI and GTI rather than carry out an “either-or” separate dealing to achieve a sustainable future. In addition, the company does not have sufficient resources to cope with SBMI and GTI, simultaneously characterized by high risk, initiative, and innovation.
Therefore, the following two key questions are:
Qs 1: What will be the combination of SBMI and GTI, to achieve better sustainable growth for companies?
Qs 2: Does aggressive corporate strategy amplify the impact of the interaction between SBMI and GTI on SCP?
To answer the above research questions, panel data was used for 1468 Chinese manufacturing A-share listed companies from 2010 to 2020 time period. Our results confirm that SBMI and GTI are compulsory, and there is a significant relationship between SBMI and GTI on SCP. Furthermore, the study reveals that high SBMI-low GTI is more valuable, while low SBMI-high GTI may bring more “disruptive factors.” In addition, the study also finds the “amplification effect” of aggressive corporate strategies in the impact of SBMI-GTI on SCP. The study contributes theoretically to how SBMI and GTI interact to influence SCP and highlights the moderating effect of different degrees of aggressive strategy. The findings of this study also have guiding implications for corporate decision-making in specific management practices. It also helps enterprises better understand at different levels of SCP generated by various combinations of SBMI and GTI at high and low levels. Further, it provides reliable theoretical support for a strategic trade-off between different levels of aggressiveness. Finally, the limited enterprise resources generate better SCP.
This paper is organized as follows: The second part is a literature review on SBMI, GTI, and SCP. The third part proposes the hypotheses related to SBMI, GTI, and SCP, the purpose of the moderating role of corporate strategic aggressiveness in the influence of SBMI and GTI on SCP, and explains the study’s conceptual model. The fourth part is about data sources and their details, as well as the reasons for using the relevant variables. The fifth section presents the results of the regression analysis, moderating effect test, and robustness test, which confirm the proposed three hypotheses in this study. The sixth section summarizes the study results, makes policy recommendations, and specifies the direction of the subsequent research.
2 Literature review
2.1 Sustainable business model innovation
In recent years, business model innovation (BMI) has been famous in academia and business practice. Many studies believe that a change in BMI can bring sustainable development in enterprises (Evans et al., 2017). Schaltegger et al. (2012), Jolink and Niesten (2015) argue that BMI can integrate sustainability into enterprise development. Since the growth of SCP brought by BMI is evident, BMI for sustainability and SBMI are technically considered as part of BMI, which is also based on BMI (Geissdoerfer et al., 2018). The success rate of business model (BM) and BMI is low. However, there are no specific data on the failure ratio of BM and BMI (Hart and Milstein, 2003; Lüdeke-Freund, 2010). Due to the increasing international pressure for sustainable development, the available BM and BMI options are limited and cannot fully control the demographic issues caused by increasing resources and environmental impacts on global development (Bocken et al., 2014). The concept of non-sustainable BM also seems outdated (Geissdoerfer et al., 2018), and the exploration from the perspective of BM and BMI cannot acclimate the objective environmental changes. It is necessary to investigate the implication and extension of related concepts and explore that from a new perspective. Which also provides impartial conditions for separating SBMI from BMI. However, Geissdoerfer et al. (2018) defines the concepts of BM, SBM, BMI, and SBMI. Compared to BM, SBM is a broader concept, encompassing all from economic values to social and environmental values (Bocken and Geradts, 2020; Shakeel et al., 2020). The SBMI is clearly defined as: Innovations that create significant positive and/or significantly reduced negative impacts for the environment and/or society, through changes in the way the organization and its value-network create, deliver value and capture value (i.e. create economic value) or change their value propositions (Bocken et al., 2014). It is also widely recognized that SBMI has enormous potential to address long-term sustainability challenges (Stubbs and Cocklin, 2008; Saebi et al., 2017). As a result, SBMI has become an essential part of more companies to remain consistently economical (Zahra et al., 2006; Baden-Fuller and Morgan, 2010; Zott et al., 2011; Robins, 2013; Wirtz et al., 2016) and create more social and economic and environmental value for more stakeholders (Geissdoerfer et al., 2018).
2.2 Green technology innovation
Although traditional technological innovation activities have produced intense material progress, and also caused significant environmental damage. There is an increasing interest in green innovation among researchers and businesses, especially with the emergence of new technologies and materials. However, GTI was not a hot issue for researchers until 2007, mainly due to the acrimony at the United Nations Climate Change Conference conducted that year and the U.S. government’s eventual dramatic signing of the Bali Road Map. Since 2008, developed and developing countries have focused on emissions neutrality, and green, low-carbon technology innovation is becoming a common issue for global warming and climate change.
However, Shi and Lai (2013) show a strong contrast in the growth rate of overall publications about the GTI field between developed and developing countries, with developed countries paying more attention to GTI. Second, GTI is a global phenomenon, and research on GTI in emerging economies has increased dramatically in recent years. One possible reason is related to the Chinese government’s announcement of its increased international responsibility for low-carbon economic development and its commitment to the United Nations for its emission reduction targets at the 15th International Climate Change Conference, held in Copenhagen in 2009. Currently, China has made evident progress in GTI and is at the forefront of green technology growth in specific technology areas, particularly in solar photovoltaic energy, electric vehicles, and other technologies, which are impressive and significant achievements. Compared to other countries and regions, China ranked among the world’s leading countries in green technological innovation related to the environment.
However, some scholars have obtained the remarkable result of a downward trend in the growth rate of green total factor productivity in China (Zhang and Tan, 2016; Chen et al., 2018; Xu et al., 2019). Therefore, China still relies more on labor, productive capital, and natural capital for green development to promote sustainable growth by increasing green productivity. There is still a long way to go to transform the growth rate and replace old with new ones.
2.3 Sustainable corporate performance
The core of sustainable development is to promote economic growth and social development with the goal of efficiency, harmony, and sustainability, which is an important trend in the modern world (He et al., 2021). Embedding sustainability in corporate performance is one of the most important ways to achieve high-quality economic development. Most recent research on sustainable development performance focuses on the macro-level and meso-level, such as the country (Feng et al., 2017; Gao, 2019a; Du and Ma 2019), province (Liu et al., 2021; Xie et al., 2022), economic belt (Gao, 2019b; Cui et al., 2021; Chen et al., 2022), industry (Sun et al., 2021; Xu et al., 2022b; Yuan et al., 2022) and city (Jin et al., 2019; Guo and Zhou, 2021). However, few studies directly explore SCP from a micro perspective. The micro-level enterprise is the direct recipient and responder of the concept of sustainable development. Therefore, the realization path of SCP is an important area of research.
The definition of SCP has not yet been standardized and clarified. Scholars do not disagree with SCP’s financial performance component but mainly disagree with non-financial performance. The triple bottom line (TBL) model of sustainable performance considers environmental and social performance components of non-financial performance. Economic sustainability relates to the organization’s ability to meet its needs and expectations in a financially sound manner, social sustainability includes developing and realizing household demands and needs, including maintaining long-lasting social relationships, and environmental sustainability alludes to preserving and renewing the ecosystem for current and future generations (Jum’a et al., 2022; Larbi-Siaw et al., 2022; Ossewaarde and Ossewaarde-Lowtoo, 2020). Spangenberg et al. (2002) expanded TBL to four dimensions: social, economic, environmental, and institutional. The institutional level is complementary to the TBL ideology and is composed of organizations and rules (Gupta and Gupta, 2020). Government compliance requirements, increasingly stringent penalties, rising stakeholder awareness (e.g., customers, sustainability suppliers), and the brand benefits of being a “green company” are further driving more and more companies to focus on the green technology of their business performance (Seuring and Müller, 2008; Gupta and Gupta, 2020). Another similar and more familiar concept is corporate social responsibility (CSR). CSR emphasizes the fulfillment of social responsibility as a critical prerequisite for generating economic benefits at the corporate level (Farah et al., 2021), the contribution of CSR activities to the environment, consumers, society, and the balance of economic, environmental, and social requirements (Nikolaou et al., 2013). Most scholars who insist on “sustainable development” believe that companies should focus on CSR while pursuing economic benefits (Kolk, 2016; Xia et al., 2018; Meseguer-Sánchez et al., 2021) and that fulfilling CSR is beneficial to the long-term sustainable development of companies. Therefore, considering CSR as the primary connotation of SCP can avoid the conceptual complexity issues associated with previous studies’ multidimensional understanding of SCP.
3 Research hypothesis
The SBMI and GTI are both essential elements of innovation (Baldassarre et al., 2017; Guo Y. Y et al., 2018). However, scholars only examined the impact of SBMI or GTI on SCP (Peralta et al., 2019; Jabbour et al., 2020; Wang and Yang, 2021). For example, Shakeel et al. (2020) argue that corporate SBMI improves organizational output through sustainable value proposition innovation, sustainable value creation, and delivery innovation, and sustainable value capture innovation to achieve sustainable performance at environmental, social, and economic levels. Lv et al. (2021) and Ma et al. (2021) argue that GTI cannot solve the environmental problems in the production and consumption process but also improve enterprises’ market competitiveness by increasing production’s sustainability. Literature is unable found incorporating both into a holistic framework. Examine the effect of one variable on SCP while controlling the other variable; otherwise, the antecedent mechanism of SCP cannot be revealed comprehensively and objectively.
The two variables have a complementary relationship; the marginal effect of one type of innovation activity will necessarily vary with the other (Milgrom and Roberts, 1995). Because both SBMI and GTI have essential effects on SCP, can the two not work together on SCP?
Task-technology matching theory provides some theoretical support for us to address this issue. According to the task-technology matching theory, new technology can only produce higher performance if it matches the task scenario, and the degree of task-technology matching directly impacts performance (Goodhue and Thompson, 1995; Li et al., 2016). The matching problem has received extensive attention from scholars in economics and sociology. The core of the matching theory is the resolution of the indistinguishability dilemma in resource allocation. Believe that SBMI and GTI are naturally complementary with significant indivisibility and that businesses can convert and match between them based on their needs.
However, the SBMI that supports it impacts the GTI’s speed and characteristics. The SBMI is a non-technical innovation whose primary goal is to realize its green value. When SBMI can match GTI, SBMI will significantly affect GTI, which will help enterprises find the right direction of green technology development, improve the efficiency of green R&D activities, contribute to the transformation of GTI commercial results and support the promotion of SCP. Moreover, SBMI heavily depends on whether and how GTI is accepted in the economy. When GTI is combined with SBMI, it can help enterprises acquire core capabilities to ensure sustainable development, improve long-term adaptability to the external environment (Sahoo et al., 2022), and thus promote the improvement of SCP. Therefore, SBMI and GTI are complementary and inseparable, and their alignment promotes higher SCP.
However, mismatch between SBMI and GTI are common in the long-term development of businesses. When GTI is strong, GTI may lose SBMI’s guidance in the right direction of GTI, and enterprises face the risk of a “failure trap” caused by high input costs and high-income uncertainty. However, when SBMI is strong, it will extend its extinction time due to its high stickiness with existing technology, thus impeding the next stage of GTI. It may also cause organizations to develop organizational inertia and path dependence, fall into the “success trap,” and eventually struggle to adapt to drastic changes in the external environment. Despite SBMI’s ability to improve SCP in the short term, enterprises face increasingly fierce market competition due to economic globalization. Short-term business performance is no longer the main focus of enterprises, and improving long-term competitiveness has moved to the top of the enterprise development priority list. When SBMI and GTI do not match, the enterprise will have a specific resource idle, which will be detrimental to SCP improvement.
Therefore, this paper proposes hypothesis 1.
H1: The SCP level is higher when SBMI is consistent with GTI when SBMI is inconsistent with GTI.From the perspective of a resources-based view, the enterprise’s resources are limited, and allocation between SBMI and GTI is in a trade-off relationship. Different input combinations will have different impacts on SCP. Therefore, the business development of enterprises is seriously affected by the accumulation of resources in the early stage. Some enterprises are more sensitive to SBMI, while others have more substantial GTI capability, which is more likely to produce path-dependent solid constraints. However, when an enterprise tries to acquire new resources, it must decide which scarce and valuable resources to acquire and how to replenish them.? Therefore, it is challenging for enterprises to balance SBMI and GTI. The SBMI and GTI are hardly consistent all the time. In particular, there are fundamental differences between SBMI and GTI (Table 1).Based on that premise, companies tend to choose one innovation approach (e.g., SBMI) as the dominant one under certain spatial and temporal conditions and then switch to another innovation approach (e.g., GTI) under other spatial and temporal conditions to realize the founder of SBMI and GTI on a larger geographical and temporal scale. When SBMI and GTI are inconsistent, it is more practical to discuss the mechanism of the effect on SCP.There are two cases when SBMI and GTI are inconsistent: high SBMI-low GTI and low SBMI-high GTI.In the first case, the SBMI level is higher than the GTI level. Although SBMI has drawbacks, the most obvious is low entry barriers. Due to resource constraints and the business philosophy of “living in the present,” many companies must choose between SBMI and GTI and choose high SBMI-low GTI. According to a survey conducted by the Economist Intelligence Unit in 2005, more than half of executives believe BMI is more important than product and service innovation. Companies are paying more attention to SBMI, which helps unlock the potential value embedded in technology, capturing as much value as possible and converting technology into market revenue. This is particularly important for businesses in their early stages.The colossal risk of GTI itself, which cannot guarantee the commercial success of enterprises, is an important reason why these enterprises are willing to choose high SBMI-low GTI. According to Schumpeter’s theory of innovation, “innovation is the commercial application of an invention patent,” and R&D that cannot be commercialized to bring sufficient company profits is not considered successful technological innovation. An intriguing phenomenon is that many companies, including investors, cannot assess GTI’s prospects. Warren Buffett has been asked what he looks for the most when investing in businesses (Rajaratnam et al., 2011). “Business Model” has become a buzzword among operators and venture capitalists.The SBMI level is lower than the GTI level in the second case. Companies that choose low SBMI-high GTI are willing to give up short-term benefits to pursue long-term goals because they believe that being technically rigid is the only way to achieve actual, sustainable development. Companies that adopt a low SBMI-high GTI business model do not choose the high GTI business model but go through a continuous adjustment process. China’s photovoltaic industry is a prime example. This capital- and technology-intensive emerging industry has enormous growth potential but is also rife with destructive innovations. Looking at the tragic wave of China’s photovoltaic industry, only those corporations that prioritize investment in green technology R&D have survived to the present day, while those that overly pursue the capital logic of BMI have almost all fallen and gone up in smoke.However, pursuing GTI entails greater risk (Cooper, 1981; Roper and Tapinos, 2016; Xue et al., 2022). Compared to high SBMI-low GTI, low SBMI-high GTI does not ensure good long-term enterprise performance. These are the following factors:First, consider the characteristics of green technology. Long development cycles, high costs, high risks, and low profits distinguish green technologies. The enormous risks of green technology development will make companies cautious in the absence of economic scale effects to amortize the expensive technology investments and operating costs. Evidence suggests that industries in desperate need of green technologies, such as steel, petrochemicals, and other heavy pollution manufacturing industries, have average profit margins at the bottom of the “smile curve” and cannot afford the high GTI costs, limiting green technology adoption and development by enterprises in these industries. (Hu et al., 2021; Yin et al., 2021; Chen and Zheng, 2022).Second, insufficient R&D motivation for green technology. As opposed to general technology, green technology is primarily reflected in social and ecological benefits, which do not directly benefit enterprises but increase their economic costs. Government environmental regulations primarily drive the current market demand for so-called green technology. Government subsidies provide many funds for corporate GTI in developing countries, but government subsidies distort factor markets. The picture of insufficient power sources for GTI will emerge once the government implements a subsidy retreat policy.Third, the company’s security awareness. There is no universal formula. Different definitions of success frequently influence a company’s strategic positioning. A common understanding is that risk avoidance is a general prerequisite for business continuity; for example, “financial stability” may be considered a “safety factor.” (Subramaniam et al., 2011; Florio and Leoni, 2017). High SBMI-low GTI is considered more valuable to increase enterprises’ sustainable development, whereas low SBMI-high GTI may bring more “disruptive factors.” Each business success is unique, but based on common sense and extensive empirical findings, high SBMI-low GTI is the preferred choice for most businesses.Therefore, proposed hypothesis 2:H2: When the result of SBMI is inconsistent with GTI, firms with the high SBMI-low GTI have higher levels of SCP than those with the low SBMI-high GTI.Only a few studies on the degree of strategic aggressiveness have been conducted. However, the “strategies are positioned along a continuum” concept proposed by Dent (1990) provides an excellent analytical framework for determining strategic aggressiveness. The current typology of strategic aggressiveness in the literature is based on Miles and Snow’s corporate strategy taxonomy proposed in 1978 and 2003, respectively (Mintzberg and Waters, 1985; Fiss, 2011; Kong et al., 2020), which classifies corporate strategies as prospectors, defenders, and analyzers. These strategies are continuous, with defenders, prospectors at the extremes, and analysts in the middle with both defender and prospector characteristics. Here is proposed the following model of the degree of strategic aggressive continuum’s great extent (Figure 1), drawing on Miles and Snow (1978, 2003) strategy classification.The strategic aggressiveness amplifies the impact of the SBMI and GTI on SCP, specifically through the three aspects described below.First, companies with a high degree of strategic aggressiveness have a strong incentive to mobilize more resources in the process of promoting SBMI and GTI, and they concentrate on rapidly advancing new green technologies, green product development, and creating new SBM, with an emphasis on “open source” rather than “cost-cutting” (Kabanoff and Brown, 2008). Therefore firms with a high degree of strategic aggressiveness have a greater need for long-term investment in green product development and green market expansion, even if it means taking the risk of “short loan and long investment.” (Ye et al., 2021) and using more social networks to seek support from local governments (Song et al., 2016; Xu et al., 2022a). Furthermore, companies with a high degree of strategic aggressiveness tend to attract a large and diverse marketing and R&D team, are results-oriented, and measure their performance through customer-centric metrics (Olson et al., 2005; Zhang and Li, 2009).Second, companies with a high degree of strategic aggressiveness have higher confidence or risk appetite when advancing SBMI and GTI. Companies with a high degree of strategic aggressiveness typically have a broad focus and are constantly developing. Firms with a high degree of strategic aggressiveness are prone to “overconfidence.” The CEO’s overconfidence is not solely due to cognitive bias. According to Yun et al. (2021), overconfident CEOs prefer different competitive strategy options, resulting in significant differences in the degree of aggressiveness of corporate behavior. Papadakis and Barwise (2002) believe that CEO characteristics are related to the degree of strategic aggressiveness. Firms with a high degree of strategic aggressiveness choose significantly advanced exploratory green innovation and constantly invent green technology products and green services to capture and exploit new opportunities in new green product markets. The CEO’s confidence is critical for hazardous exploratory green innovation activities. According to research on organizational behavior, aggressiveness and overconfidence are associated with the CEOs of many great companies (Hirshleifer et al., 2012; Gilbey et al., 2021; Wang et al., 2022).Third, companies with a high degree of strategic aggressiveness develop and maintain the ability to understand and adapt to environmental changes. Companies with a high degree of strategic aggressiveness are more likely to be able to advance SBMI and GTI systematically, often in tandem with credit loss strategies in other areas of the field (Taran et al., 2015; Forés, 2019; Peng, 2020; Liu and Kong, 2021). To analyze new opportunities for green products, firms with a high degree of strategic aggressiveness must be able to investigate environmental conditions. Trends thoroughly and events, analyze the environment for potential opportunities of all kinds, and these scanning activities must not be limited to current technology and business areas (Walker and Brewer, 2009; Gumusluoglu and Acur, 2016; Nath and Siepong, 2022). Firms with a high degree of strategic aggressiveness are more likely to perceive environmental change and uncertainty than firms with a low degree of strategic aggressiveness.Therefore, proposed hypothesis 3.
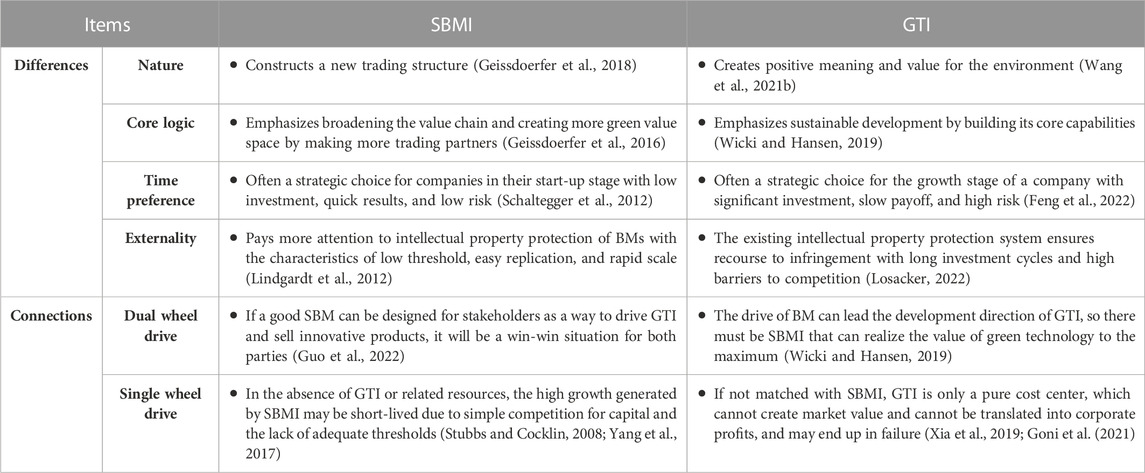
TABLE 1. Differences and connections between SBMI and GTI.
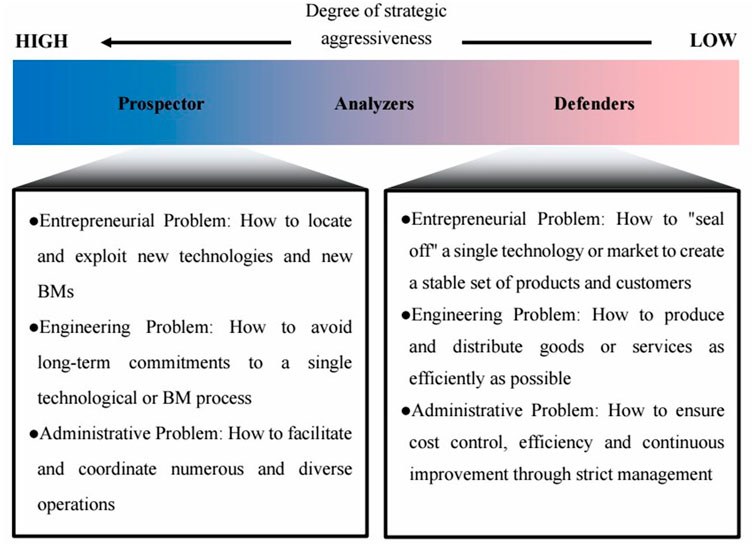
FIGURE 1. A continuum model of the degree of strategic aggressiveness.
H3: The high degree of corporate strategic aggressiveness amplifies the effect of SBMI and GTI on SCP.The following conceptual model is proposed in this study (Figure 2).
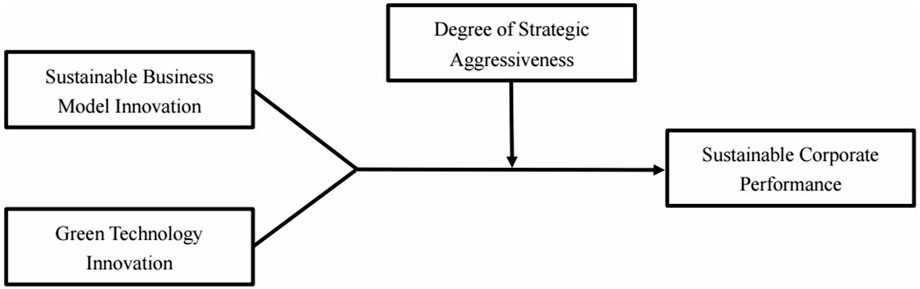
FIGURE 2. Conceptual model of this study.
4 Materials and methods
4.1 Data and sample
This study’s sample consists of manufacturing firms listed in China A-shares from 2010 to 2020. Compared to other types of enterprises, such enterprises are complete in many aspects, including procurement, R&D, production, and sales (Xiao and Zhang, 2021), and rich SBMI sample data can be collected. Furthermore, manufacturing firms are more willing to transform their R&D and green technological accomplishments, and their GTI characteristics are visible. Listed Chinese manufacturing enterprises are selected for the survey.
Four main data sources are used, China Stock Market and Accounting Research (CSMAR), Chinese Research Data Services Platform (CNRDS), Hexun CRS database, and the Cninfo website are the primary data sources. The CSMAR is one of China’s largest databases of listed companies and a major source of information on the Chinese stock market and listed companies’ financial statements. CNRDS is a high-quality, open, platform-based aggregate data platform for economic, financial, and business research in China, covering listed companies’ innovation patents, green patents, and text information. In China, Hexun CRS database was an early third-party provider of social responsibility performance scores based on annual and social responsibility reports from listed companies total CSR score of a company is split into five dimensions: (1) shareholder, (2) employee; (3) supplier, customer, and consumer; (4) environmental; and (5) social responsibility. The China Securities Regulatory Commission’s Cninfo website publishes financial reports, announcements, and other information from listed companies. To ensure the accuracy of the data, we cross-check it against the annual reports of listed companies provided by the Cninfo website and company websites. The initial sample is as follows: (1) We exclude listed companies that have a severe lack of variables; (2) Exclude listed companies that have financial irregularities, such as special treatment (ST and ST*).; (3) Exclude from the analysis any listed enterprises that left the Stock Exchange during the investigation period. Examine the distribution of variable values and notice some rather extreme outliers. Many studies have discarded outliers, but doing so would have resulted in the loss of some of the data (Henderson et al., 2012). To avoid outliers adversely affecting the results, we adopt 99% winsorization, drawing on Flammer and Bansal (2017) and Shiu and Yang (2017). Finally, after merging the data and eliminating firms with missing values, this paper obtains 7090 unbalanced panel data for 1468 listed firms over the sample period.
4.2 Dependent variable
4.2.1 Sustainable corporate performance (SCP)
According to previous studies, SCP consists of financial performance and CSR. The financial performance measure is based on returns on assets (ROA), and the social responsibility score of HeXun measures CSR. We use the more objective catastrophe progression to overcome the subjectivity of the design weights when determining financial performance and CSR weights (Zuo et al., 2021). Further measure SCP using ROA and the total CSR score from 2010 to 2020. This paper uses SCP lagged one period for the robustness test.
4.3 Explanatory variables
4.3.1 Sustainable business model innovation (SBMI)
The existing methods of measuring SBMI are mainly the interview (Geissdoerfer et al., 2016; Todeschini et al., 2017; Yip and Bocken, 2018) and the questionnaire (Cheah and Ho, 2019; Peralta et al., 2019). The former method is mainly targeted at senior managers familiar with corporate sustainable business models, but to a certain extent, it is affected by respondents’ characteristics and understanding of limitations. The latter has high labor costs and the dilemma of poor replicability and low generalizability.
With the rapid development of machine learning, many scholars have started to use textual analysis techniques to extract the value information from listed companies’ disclosures (Wang K. M et al., 2018). Currently, there are two main types of textual analysis: the first method is lexicon which counts word occurrences from word lists (dictionaries), and the second is a combination of keyword search and manual counting. However, several challenges arise when applying these approaches to measuring SBMI. Word lists (dictionaries) that share common meanings do not consider the textual language environment. Although the combination of keyword search and manual scoring overcomes the drawbacks of the first method, it still has a high human cost and relies on the empirical judgment of researchers to a high degree. The word frequency analysis method of seed words + Word2Vec similar words expansion + specific dictionary is a good choice. This method overcomes the shortcomings of the previous two methods by selecting a small number of representative words, potentially saving labor costs. The Word2Vec model is trained using a specialized corpus of “MD and A” seed words to find similar words that match the target language environment and form a specific dictionary. Therefore SBMI has calculated the ratio of the total number of times a word from the SBM-specific dictionary appears in the “MD and A” section of a company’s annual report for the year to the total number of words in the text. The more SBM words mentioned in the “MD and A” section, the more effort enterprises put into SBMI, and the ratio measurement method can highlight the importance of these words. The specific construction steps are shown in Figure 3.
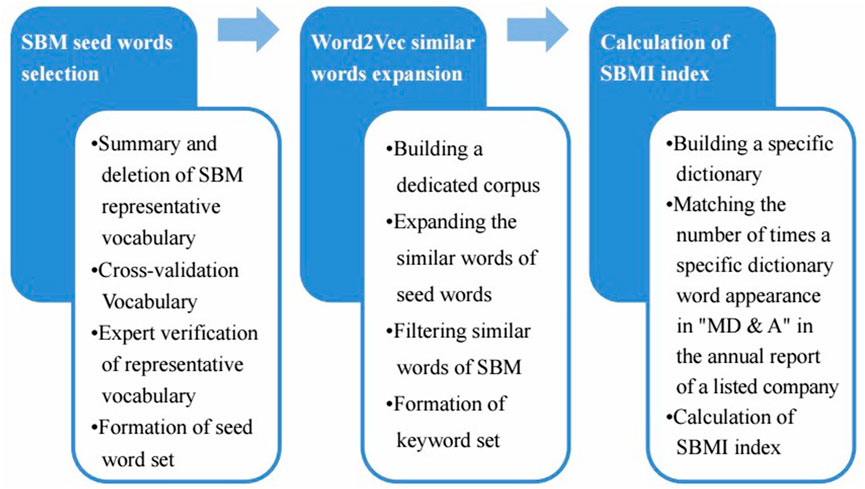
FIGURE 3. Diagram of proxy variable construction for SBMI.
Step 1: SBM seed word selection. Based on the definition and characteristics of SBM described by Joyce and Paquin (2016), SBM representative words are summarized and screened at first. Delete the words that do not fit the SBM connotation and identify the semantically ambiguous words. Drawing on Denzin, 2017, words are cross-validated through materials and literature from multiple sources. These words must be screened and supplemented. The revised SBM word set is also verified by three SBM field experts, resulting in a seed set of SBM words.
Step 2: Word2Vec similar words expansion. Expansion of similar words in Word2Vec. Expressions use multiple semantically similar words to describe the same concept or thing; after selecting the seed set of words, it is necessary to expand the similar words. Therefore, following Li et al. (2021), this paper uses the Word2Vec model to realize the expansion of similar words based on the particular corpus of “MD and A” in the annual reports of listed companies. After eliminating repeated words and some low-frequency words, the remaining similar words were analyzed by three professional researchers. The words that are all approved are added to the keyword set.
Step 3: Calculation of SBMI index. Following the acquisition of the SBM keyword set, experts are invited to conduct verification, and the keyword set is confirmed again comparing text samples from annual reports of listed companies to form the SBM-specific dictionary. SBMI is represented by a ratio of the number of times words from the SBM-specific dictionary appear in the annual report “MD and A” to the total number of words in the text. Lv et al. (2018), to keep the SBMI comparable with the GTI, scale normalization is applied to it so that it falls into the 0 to 1 range.
4.3.2 Green technology innovation (GTI)
There are two main types of existing methods to measure GTI. One is the factor input method, including enterprise R&D expenditure (Fan and Chu, 2019), the sum of internal expenditure on R&D and investment in technological transformation (Bi et al., 2011; Wang F. Z et al., 2018), etc. Second is the factor output method, including the number of green patents (Klemetsen et al., 2018; Qi et al., 2018; Barbieri et al., 2020), new product sales revenue per unit of energy consumption (Guo Y et al., 2018). R&D expenditure does not effectively distinguish between GTI and non-GTI; new product sales revenue is not unavailable to all enterprises with relevant data. As a result, the above measurement methods are not used in this paper, and the absolute number of green patents and the relative proportion of green patents are the two main ways to measure GTI by patents. Although the number of green patents can reflect the level of corporate GTI, the proportion of green patents to all patents more accurately reflects corporate GTI direction (Wang and Zhao, 2019). There will be withdrawal and rejection in the process of patent application (Lei and Wright, 2017); this study refers to Cai et al. (2019) and Chang et al. (2015) to select a more reliable number of authorized patents. The basic measurement method of GTI is as follows:
Because of the more stringent application and granting conditions, the quality of invention patents is also higher (He et al., 2018; Mao et al., 2018). The number of green invention patents granted and the number granted for robustness testing are used in this study. Following Lv et al. (2018), scale normalization is applied to the GTI so that it falls into the 0 to 1 range to keep it comparable with the SBMI.
4.3.3 Degree of strategic aggressiveness (STRATEGY)
Bentley et al. (2013), developed a discrete composite measure that proxies for strategic aggressiveness. Companies with higher scores have a high level of strategic aggressiveness, while companies with lower scores have a low level of strategic aggressiveness. For the composite measure of strategic aggressiveness, we use the following characteristics: (1) the R&D to sales ratio, (2) the employee to sales ratio, (3) a historical growth measure (1-year percentage change in total sales), (4) the marketing and administrative expenses to sales ratio, (5) a measure of employee fluctuations, and (6) the fixed assets to total assets ratio. Following Ittner et al. (1997), all variables are calculated using a 5-year rolling average. The first five individual variables are ranked within each year’s industry by forming quintiles. For each variable, observations in the highest quintile are assigned a score of 4, the second-highest quintile is assigned score of 3, and so on, while those in the lowest quintile are assigned a score of 0. Those observations are assigned a score for the sixth variable is the inverse of the preceding principle. Observations in the highest quintile with the sixth variable receive a score of 0, while those in the lowest quintile receive a score of 4. Each company year, add the scores from the six variables, with a maximum score of 24 (high degree of strategic aggressiveness) and a minimum score of 0 (low degree of strategic aggressiveness).
4.4 Control variables
Senior manager equity incentives (ln_mh). Some enterprises’ senior managers do not hold shares; the natural logarithm is calculated after adding 1 to the original data. Equity incentives, which are highly correlated with the firm’s business conditions, are one of the most important sources of income for senior managers (Elsilä et al., 2013; Kim et al., 2016). Therefore, corporate executives’ pay is closely related to SCP. As a result, we control the number of shares held by senior management.
Senior manager compensation incentives (ln_mss). The total salaries of senior executives are calculated using the natural logarithm. Salary is another source of income for senior managers, and it is also highly correlated with business performance (Chen and Jermias, 2014), which further leads to the high correlation between the income of senior corporate managers and SCP. Therefore, control for total senior manager salaries.
Industry competitiveness (HHI). The Herfindahl-Hirschman Index measures each listed company’s market share (based on SIC three-digit industry codes) (Wang and Zhang, 2015). It has been observed that industry competition and financial performance are not linearly related, with neither low nor high levels of industry competition having a positive impact on financial performance and medium levels of industry competition. They effectively reduced firm costs and improved firm financial performance (Schmidt, 1997). Industry competitiveness affects SCP in a curve-related manner. Also include an industry competitiveness control in the regression analysis.
Key pollution monitoring unit (KPMU). The value is 1 if it belongs to a key pollution monitoring unit; otherwise, the value is 0. Some studies consider whether a company is a key pollution monitoring unit in its environmental management system. This system certification promotes environmental compliance and improves the environmental performance in the enterprise (Yu and Bi, 2021), while also influencing SCP. Therefore the variable of whether a key pollution monitoring unit is controlled.
The number of listing days (ln_ld). The natural logarithm is used for measurement. The longer it has been since the first listing, the more openly disclosed corporate information (Chen and Mu, 2018) and controlled the number of days.
Financial subsidies (ln_fn). Because the number of financial subsidies received by the enterprise maybe 0, the natural logarithm is computed after adding 1 to the original data. It is widely accepted that government subsidies positively impact firm performance (Zheng et al., 2021).
The concentration of equity (LHR). The largest shareholder’s shareholding rate is used for measurement. Previous perspectives on the effect of equity concentration on performance have been inconsistent with Jensen and Meckling (1976), arguing that an increase in corporate equity concentration enhances the firm’s value. In contrast; Farooq (2015) argues that an increase in equity concentration causes information asymmetry problems, which affects the firm’s debt ratio and worsens its financial position, jeopardizing the steady development of corporate performance. Furthermore, equity structure non-linearly impacts firm performance (Du and Liu, 2002; Zhang et al., 2019). The equity concentration is under control by rigorously considering scientific research.
Nature of equity (EN). If it is a state-owned enterprise (SOE), code it as 1; otherwise, code it as 0. In China, SOEs generally bear a policy burden and prioritize social performance over economic performance, and SOEs do not outperform non-SOEs in terms of economic performance (Li and Li, 2019). Therefore the nature of equity that may affect SCP is under control.
4.5 Statistical analysis
It should be noted that the measurement methods of consistency and inconsistency of the two “inseparable” variables in this study are primarily difference scores and interaction terms. These scores have consisted of the algebraic, absolute, or squared difference between two component measures (e.g., Alexander and Randolph, 1985; Dougherty and Pritchard, 1985; Turban and Jones, 1988; Rice et al., 1989; Tubbs and Dahl, 1991). However, combining two measures into a single index with different scores may result in information loss, making the index unreliable (Edwards, 1993; Edwards and Parry, 1993). In addition, a product term does not represent the effects of consistency (Edwards, 2001). That is, we have no way to know whether each component of the final index contributes uniquely to predicting outcomes or if only one component does so (Lubatkin et al., 2006). However, polynomial regression equations contain the component measures composing the difference and specific higher-order terms, such as the squares of both component measures and their product (Edwards, 1994). Therefore, polynomial regression is not only used to represent consistency (i.e., fit, match, similarity, or agreement) between two variables, but it also allows to avoid many of the problems associated with different scores and interaction terms (Edwards, J. R., and Parry, 1993). Furthermore, The three-dimensional response surface analysis based on a polynomial regression presented the effect of two variables and their consistency and inconsistency on the dependent variable, which helps to explain the consistency and inconsistency effect more effectively (Ilmarinen et al., 2016). The polynomial regression and response surface analysis to investigate how SBMI and GTI interact to affect sustainable corporate performance.
4.5.1 Polynomial regression estimation
Polynomial regression estimation is the construction of interaction terms (
where
The study used polynomial regression and response surface analysis to test for consistency and asymmetric inconsistency effects in Hypothesis 1 and 2 (Edwards and Parry, 1993; Herhausen, 2016). Three-dimensional response surfaces generated from polynomial regressions are used to examine the impact of consistent (inconsistent) predictor variables on the outcome variables (Edwards and Parry, 1993; Edwards and Van Harrison, 1993). In response to surface analysis, the slope and curvature of the inconsistency line (
4.5.2 Moderation test
Finally, a hierarchical regression analysis is applied to test the moderating effects of the degree of strategic aggressiveness on the relationship between SBMI-GTI inconsistency and SCP (see Hypothesis 3). Different from linear regressions in which the statistical significance of the coefficient for a three-way interaction should be assessed to establish a three-way moderating effect, in polynomial regressions, the increment in
Where
5 Empirical results and analysis
5.1 Descriptive statistical analysis
Table 2 represents the descriptive statistics of the main variables. The mean value of
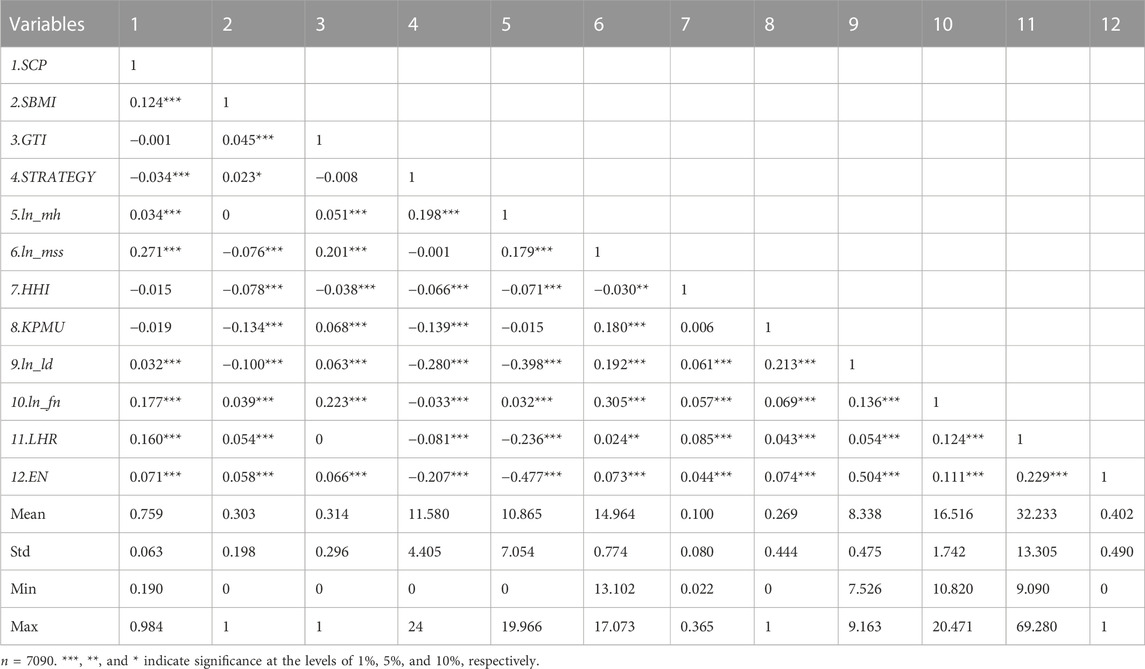
TABLE 2. Descriptive statistics and correlations of the main variables.
Table 2 also shows the correlations between the variables used in our study.
5.2 Analysis of regression results
Before the polynomial regression, in order to reduce multicollinearity and facilitate the interpretation of the results, the explanatory variables for constructing interaction terms are centered in this paper. The variance inflation factor (VIF) diagnosis is performed for all input variables of the regression models. The results show that the mean value of VIF is 2.15, falling far below 10, so there is no multicollinearity. In addition, to avoid the problems of serial correlation, autocorrelation, and heteroscedasticity that may exist in panel data regression analysis, as well as the endogeneity problems caused by omitted variables, the fixed effect model with robust standard errors, is used for estimation.
Table 3 presents the results of the polynomial and stepwise regression analyses regarding the influence of SBMI and GTI on SCP. In Model 1, only control variables are added, and
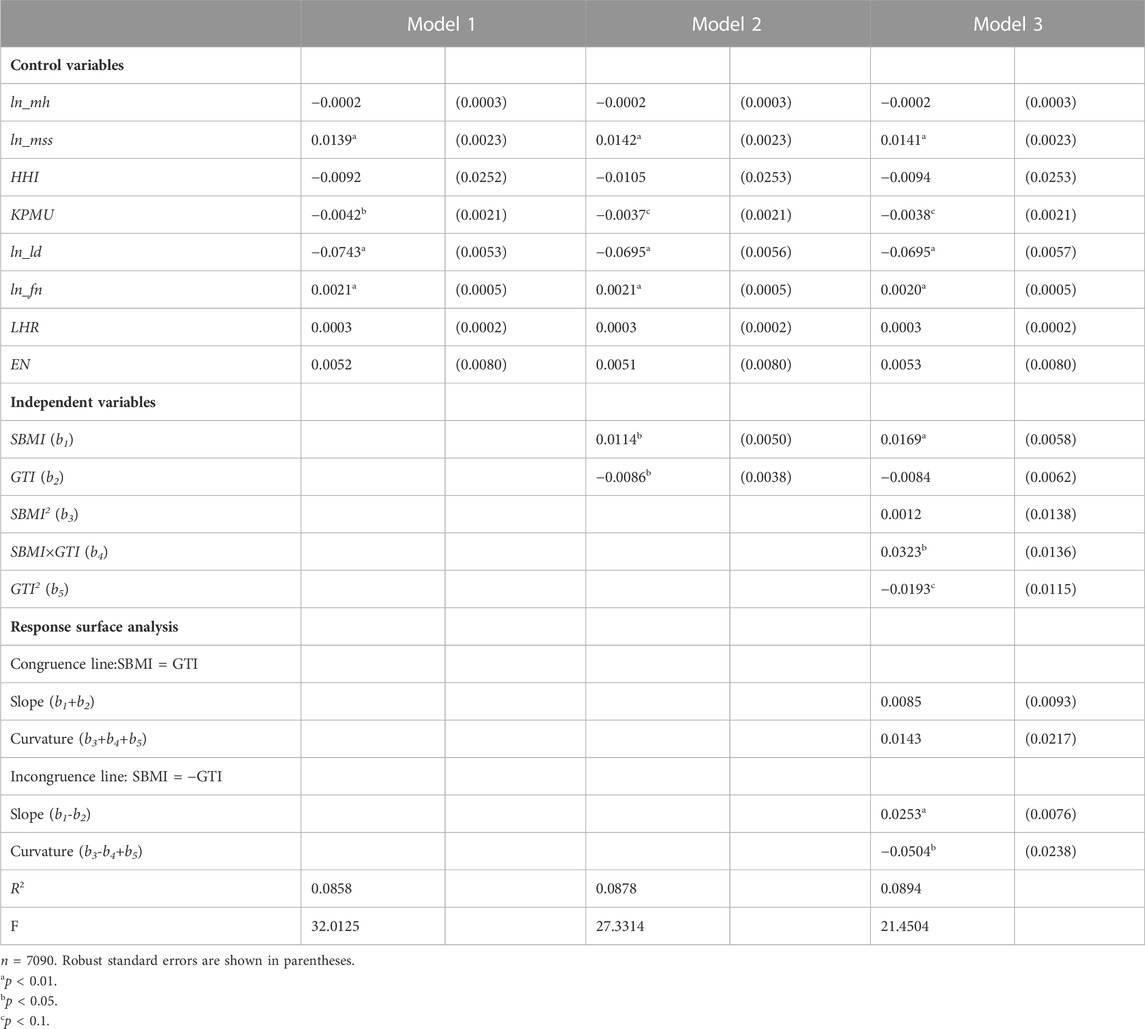
TABLE 3. Results of polynomial benchmark regression and response surface analysis.
Based on the polynomial regression results of Model 3, a three-dimensional surface graph that directly reflects the response surface analysis results and the two-dimensional curve graphs of the sections corresponding to the consistency line and inconsistency line are drawn in Figures 4–6, respectively. As shown in Figure 4, the consistency line is from the front (low SBMI-low GTI) to the back (high SBMI-high GTI), while the inconsistency line is from the left (low SBMI-high GTI) to the right (high SBMI-low GTI). According to the response surface analysis data of Model 3 shown in Table 4, the curvature of the response surface along the inconsistency line
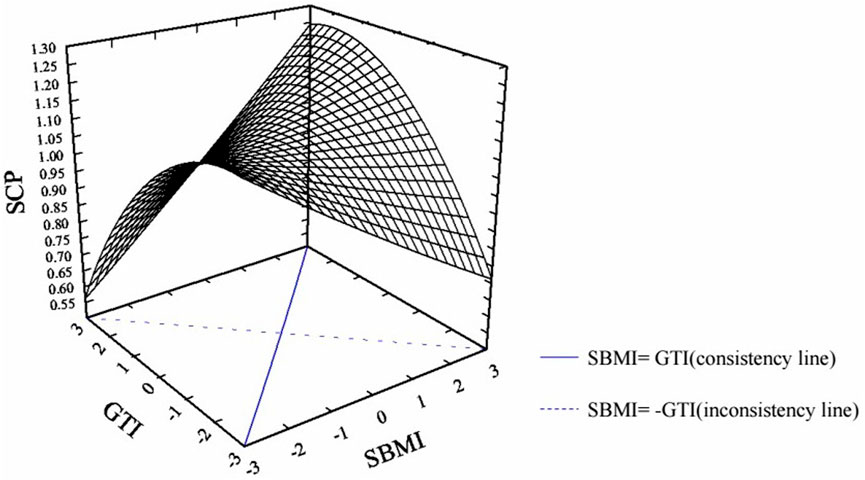
FIGURE 4. Surface graph of SBMI-GTI consistency/inconsistency on SCP.
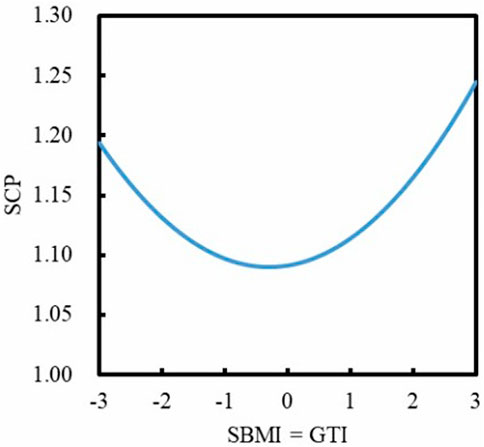
FIGURE 5. Side view of response surface along consistency line.
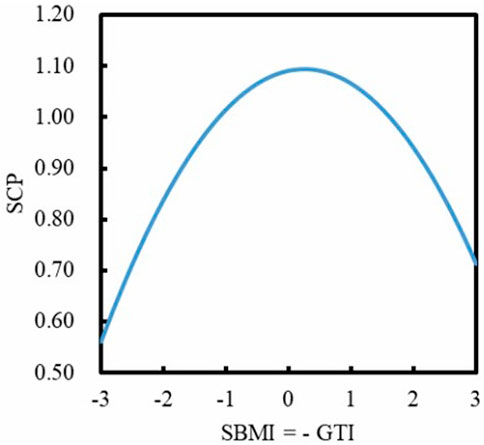
FIGURE 6. Side view of response surface along inconsistency line.
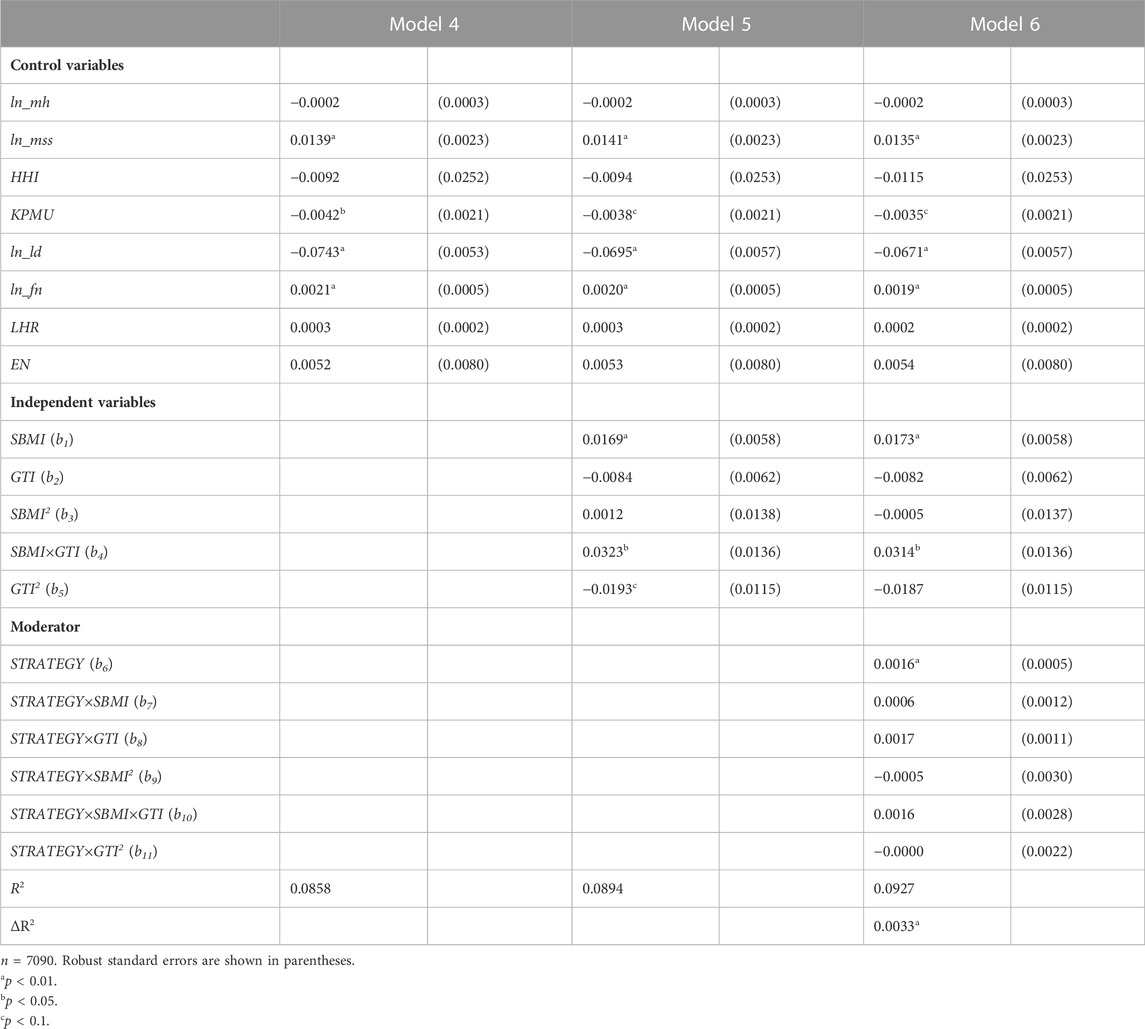
TABLE 4. Moderation effects of degree of corporate strategic aggressiveness.
The results of Model 5 and Model 6 in Table 4 show that
This result indicates that the degree of corporate strategic aggressiveness moderates the relationship between SBMI-GTI inconsistency and SCP. The three-dimensional surface graphs directly reflect the polynomial regression results with a high degree of strategic aggressiveness and a low degree of strategic aggressiveness in Figures 7, 8, respectively. To more clearly identify the moderating effect of the degree of strategic aggressiveness on the relationship between SBMI-GTI inconsistency and SCP of a firm, we also provide the side views of response surfaces along the inconsistency line (
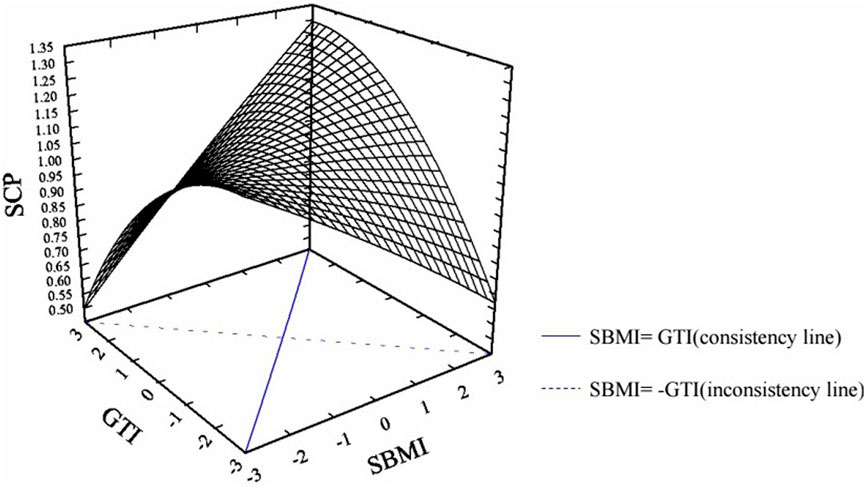
FIGURE 7. Surface graph of SBMI-GTI consistency/inconsistency on SCP, when the degree of corporate strategic aggressive is high.
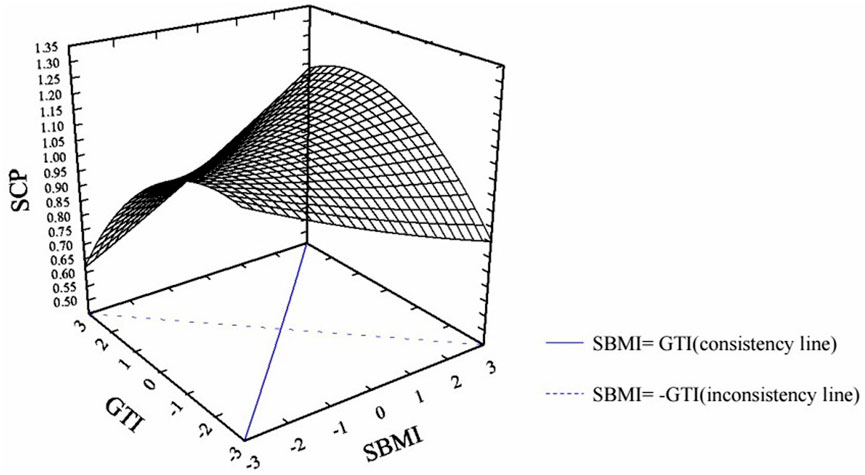
FIGURE 8. Surface graph of SBMI-GTI consistency/inconsistency on SCP, when the degree of corporate strategic aggressive is low.
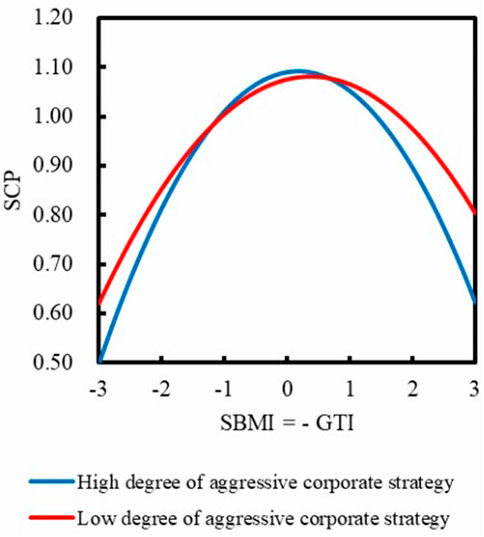
FIGURE 9. Side view of response surface along inconsistency line with the moderating effect.
5.3 Robustness test
To further ensure the reliability of the study findings, the following robustness tests are applied. In Table 5, the dependent variable SCP is treated with a lag of one period, and the results of the benchmark regression and moderating effect results are shown in columns RO-1a and RO-1b. Second, replace the proxy for the independent variable with more stringent green invention patents granted to measure GTI, and the benchmark regression and moderating effect results are in Table 5, columns RO-2a and RO-2b. Finally, for estimation, a fixed effects model with Driscoll-Kraay standard error correction is used, and the benchmark regression and moderating effects results are shown in Table 5, columns RO-3a and RO-3b.
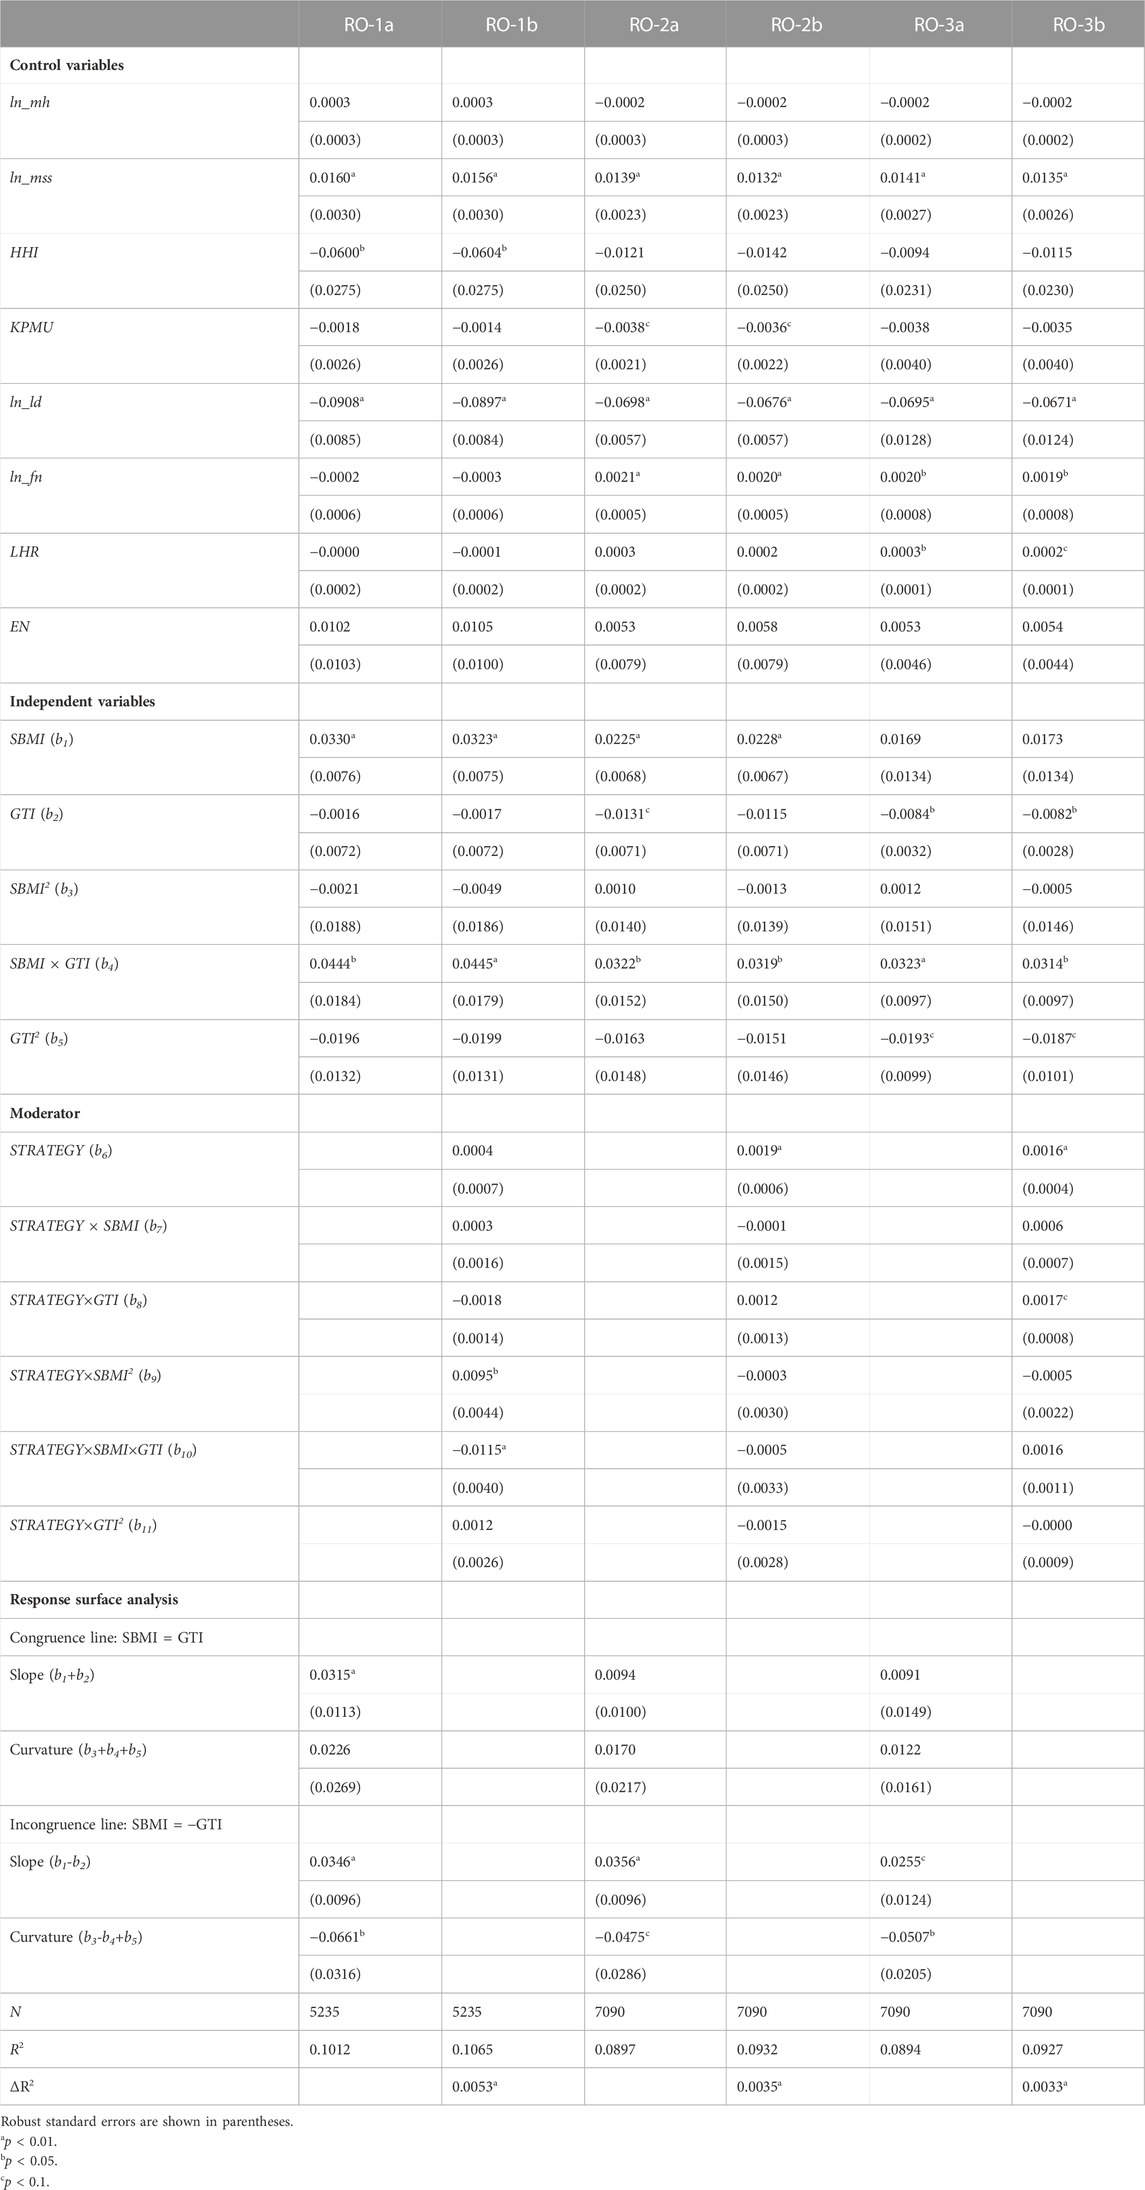
TABLE 5. Results of robustness test.
The polynomial regression analysis and robustness test results all remain consistent with the previous, indicating that the results of this paper are not affected by variable measurement or estimation methods, and the findings are highly robust.
6 Discussion and conclusion
6.1 Summary results
The impact of the interaction between SBMI and GTI on SCP is investigated using a sample of 1468 Chinese A-share listed manufacturing enterprises and the “sustainable dual innovation perspective.”
According to the empirical findings, in the consistent state of SBMI and GTI, SCP is higher than the inconsistency between SBMI and GTI. SBMI and GTI have natural synergies, and their influence on SCP has a matching effect. When the inconsistency between SBMI and GTI increases in either direction, the level of SCP decreases, indicating that sustainable corporate development requires both the pull of SBMI and the push of GTI. SBMI and GTI have a usual synergy, and as a result, they have matching effects on SCP.
Second, to fully understand the complex interactions between SBMI and GTI, it also reveals the specific impact of the inconsistency between SBMI and GTI on SCP. It is found that SCP levels are significantly higher when firms choose the high SBMI-low GTI combination than the low SBMI-high GTI. These findings suggest that the high SBMI-low GTI combination is perceived as more valuable for sustainable growth and is preferred by most businesses, whereas the low SBMI-high GTI combination may introduce more “disruptive factors.” It is a fascinating and significant finding from this study.
Third, using the degree of strategic aggressiveness as the moderator variable, the study’s findings show that the inverted U-shaped curve is more curved under the strategic conditions of firms with a high degree of aggressiveness than firms with a smaller extent of aggressiveness. It suggests that a high degree of corporate strategic aggressiveness amplifies the effect of SBMI-GTI inconsistency on SCP; the more inconsistent the SBMI-GTI combination, the lower the SCP. A low degree of aggressiveness moderates this effect. The more inconsistent the SBMI-GTI combination is, the less degree of corporate strategic aggressiveness leads to a slightly higher SCP than a lower one. SBMI-GTI tends to be consistent, a low degree of corporate strategic aggressiveness drives SBMI-GTI to produce a higher SCP. According to the findings, the degree of corporate strategic aggressiveness increases the impact of the SBMI and GTI combination on SCP.
6.2 Theoretical contribution
This paper develops four significant contributions to the existing literature.
First, prior research has only looked at the effects of SBMI or GTI on SCP separately, using a degree of separation and opposition treatment. However, later researchers have talked about how BMI and GTI can be coordinated to improve organizational performance (Kaiyuan et al., 2019; Qu et al., 2021; Tong et al., 2022), no quantitative investigation of the specific impact of the interaction between SBMI and GTI on SCP. This is the first study to incorporate both SBMI and GTI into a theoretical framework to investigate the effect of their interaction on SCP.
Second, the study confirms that promoting sustainable enterprise development requires both SBMI and GTI. SBMI and GTI are naturally complementary, and their impact on SCP has a matching effect. It also characterizes between high SBMI-low GTI and low SBMI-high GTI, with low SBMI-high GTI causing more negative to SCP than high SBMI-low GTI. Companies prefer high SBMI-low GTI combinations to improve their sustainability. Provide a theoretical explanation as well.
Third, a continuum model of the degree of corporate strategic aggressiveness drawing on Miles and Snow’s (1978, 2003) strategy classification method is used as an analytical framework to confirm that highly aggressive corporate strategies increase the impact of SBMI-GTI inconsistency on SCP. A firm strategy with a high degree of aggressiveness results in a higher SCP. SBMI and GTI confirm that the degree of corporate strategic aggressiveness has an “amplifying effect” on SCP. This adds to the body of knowledge on the corporate strategy’s moderating impact on the causal mechanism of the interaction between SBMI and GTI on SCP; it also offers sound theoretical guidance for businesses deciding on their future innovation strategies. Finally, polynomial regression is used with response surface analysis as a novel research method. Although measurement methods such as difference value (Cao et al., 2009), sum value (Lubatkin et al., 2006), and product value (Shu et al., 2015) have been used to explain the consistency and inconsistency between two associated variables, such methods cannot effectively reveal the impact of the difference in direction between SBMI and GTI on SCP. Polynomial regression can provide a strong explanation for the difference scores (Edwards and Parry, 1993; Edwards and Cable, 2009) between SBMI and GTI consistent and inconsistent, high SBMI-low GTI and low SBMI-high GTI. The response surface analysis method, in particular, can visualize the above empirical results, which can assist in comprehending the specific impact of different SBMI and GTI combinations on SCP. This research method is rare in panel data studies of the relationship between SBMI, GTI, and SCP, and this study makes a significant theoretical attempt.
6.3 Management implications
Based on the research presented above, the following management implications are drawn:
The preliminary results indicate that maintaining the SBMI and GTI pace will improve performance. Because when SBMI and GTI align, SBMI creates a sustainable business plan for green products before they are fully grown in GTI; at the same time, SBMI assists GTI in determining the next stage of development. SBMI is protected to some extent throughout the development of GTI by increasing the competitiveness of green product differentiation. Although SBMI and GTI may evolve recursively, a trade-off situation should be avoided as much as possible. The SBMI and GTI must consider both and walk as balanced as possible on two legs.
Second, the results show that high SBMI-low GTI is more valuable in the short term and has indeed become the preferred choice for most enterprises, even though the significant risk of GTI does not assure business success (Hirshleifer et al., 2012; Wicki and Hansen, 2019; Wang et al., 2022). Due to resource limitations, most businesses are now paying closer attention to combinations with high SBMI and low GTI. However, these companies are concerned with short-term gains and have to abandon their long-term goals. GTI is the primary source of long-term corporate performance. It also suggests that SBMI should eventually convert GTI to avoid SBMI suspiciously communicating sustainability efforts.
Finally, findings suggest that a high degree of corporate strategic aggressiveness modifies the specific effects of the SBMI-GTI combination on SCP by “amplifying.” Therefore, in the process of promoting SBMI and GTI, companies should focus on “open source” rather than “cost-cutting,” recruit marketing and R&D talents, adopt complex coordination mechanisms across departments and fields (Sun et al., 2017), develop and maintain a broad and continuous development of technology and market environment insight ability (Anim et al., 2018), and respond quickly to demand the world’s future.
6.4 Limitations and future directions
The main limitations of this paper are as follows: first, Chinese manufacturing companies have made remarkable innovation achievements in the last decade, so here chose panel data of Chinese manufacturing listed companies for 2010–2020 to reveal the impact of SBMI and GTI on SCP. However, in comparison to SBMI, GTI is more of a system project that takes a long time and has a slow effect. Moreover, the effect of the SBMI-GTI combination on SCP has some more novel findings in a larger study and time interval. Future studies may consider stretching the study time scale forward or backwards to investigate the causal mechanisms between the abovementioned variables. Second, this study does not explicitly examine the differences in enterprise ownership among the research objects. Because SOEs bear more social responsibility in promoting sustainable development, the SBMI-GTI SOE combination should have some unique characteristics. For example, do SOEs balance SBMI and GTI as a typical demonstration function in transitioning to a sustainable development model? SOEs’ inherent disadvantages in terms of institutional mechanisms and other aspects result in inefficiencies and investment distortion effects for long-term development?
Future research could provide some useful insights into this area. Finally, most scholars have adopted ROA as a proxy variable for corporate financial performance, even though it can reflect an enterprise’s financial status and operating results in a given period. However, explanations for enterprises’ solvency, growth, operating capacity, and equity expansion capacity remain insufficient. Therefore, future research is establishing an index system to measure corporate financial performance.
Data availability statement
The raw data supporting the conclusions of this article will be made available by the authors, without undue reservation.
Author contributions
NZ: Conceptualization, Visualization, Writing—review and editing. LP: Writing—review and editing. YT: Methodology, Data curation, Software, Writing—original draft, Writing—review and editing. XC: Visualization, Supervision, Validation, Writing -review and editing. NZ: Methodology, Data curation. JG: Formal analysis, Data curation. All authors have read and agreed to the published version of the manuscript.
Funding
This research is supported by the National Natural Science Foundation of China (72164007). This research is partly supported by the Key research base of Humanities and Social Sciences in Guangxi Universities “Beibu Gulf Ocean Development Research Center.” (BHZKY2207, Research on production factor upgrading and high-quality development of Marine industry in Beibu Gulf).
Acknowledgments
The authors would like to acknowledge the reviewers and colleagues for their valuable guidance and helpful comments.
Conflict of interest
The authors declare that the research was conducted in the absence of any commercial or financial relationships that could be construed as a potential conflict of interest.
Publisher’s note
All claims expressed in this article are solely those of the authors and do not necessarily represent those of their affiliated organizations, or those of the publisher, the editors and the reviewers. Any product that may be evaluated in this article, or claim that may be made by its manufacturer, is not guaranteed or endorsed by the publisher.
References
Albitar, K., Borgi, H., Khan, M., and Zahra, A. (2022). Business environmental innovation and CO2 emissions: The moderating role of environmental governance. New Jersey, USA: Business Strategy and the Environment.
Alexander, J. W., and Randolph, W. A. (1985). The fit between technology and structure as a predictor of performance in nursing subunits. Acad. Manag. J. 28 (4), 844–859. doi:10.5465/256240
Anim, P. A., Agbemabiese, G. C., Acheampong, G., Adams, M., and Boakye, E. (2018). Market orientation, innovation and business performance: Insight from womenpreneurs in the fashion industry in Ghana. J. Creativity Bus. Innovation 4, 5–27.
Baden-Fuller, C., and Morgan, M. S. (2010). Business models as models. Long. Range Plan. 43, 156–171. doi:10.1016/j.lrp.2010.02.005
Baldassarre, B., Calabretta, G., Bocken, N. M. P., and Jaskiewicz, T. (2017). Bridging sustainable business model innovation and user-driven innovation: A process for sustainable value proposition design. J. Clean. Prod. 147, 175–186. doi:10.1016/j.jclepro.2017.01.081
Bani-Melhem, S., Al-Hawari, M. A., and Mohd. Shamsudin, F. (2022). Green innovation performance: A multi-level analysis in the hotel sector. J. Sustain. Tour. 30, 1878–1896. doi:10.1080/09669582.2021.1991935
Barbieri, N., Marzucchi, A., and Rizzo, U. (2020). Knowledge sources and impacts on subsequent inventions: Do green technologies differ from non-green ones? Res. Policy 49, 103901. doi:10.1016/j.respol.2019.103901
Bentley, K. A., Omer, T. C., and Sharp, N. Y. (2013). Business strategy, financial reporting irregularities, and audit effort. Contemp. Account. Res. 30, 780–817. doi:10.1111/j.1911-3846.2012.01174.x
Bi, K. X., Yang, C. J., and Huang, P. (2011). Research on the impact of FDI on the green process innovation of Chinese manufacturing industries: An empirical analysis based on the panel data. China Soft Sci., 172–180.
Bocken, N. M., and Geradts, T. H. (2020). Barriers and drivers to sustainable business model innovation: Organization design and dynamic capabilities. Long. Range Plan. 53, 101950. doi:10.1016/j.lrp.2019.101950
Bocken, N. M., Short, S. W., Rana, P., and Evans, S. (2014). A literature and practice review to develop sustainable business model archetypes. J. Clean. Prod. 65, 42–56. doi:10.1016/j.jclepro.2013.11.039
Boons, F., and Lüdeke-Freund, F. (2013). Business models for sustainable innovation: State-of-the-art and steps towards a research agenda. J. Clean. Prod. 45, 9–19. doi:10.1016/j.jclepro.2012.07.007
Buliga, O., Scheiner, C. W., and Voigt, K. I. (2016). Business model innovation and organizational resilience: Towards an integrated conceptual framework. J. Bus. Econ. 86, 647–670. doi:10.1007/s11573-015-0796-y
Cai, W. X., Ni, X. R., Zhao, P., and Yang, T. T. (2019). The impact of business groups on innovation outputs: Evidence from Chinese manufacturing firms. China Ind. Econ., 137–155. doi:10.19581/j.cnki.ciejournal.2019.01.008
Cao, Q., Gedajlovic, E., and Zhang, H. (2009). Unpacking organizational ambidexterity: Dimensions, contingencies, and synergistic effects. Organ. Sci. 20, 781–796. doi:10.1287/orsc.1090.0426
Cao, S., Nie, L., Sun, H., Sun, W., and Taghizadeh-Hesary, F. (2021). Digital finance, green technological innovation and energy-environmental performance: Evidence from China's regional economies. J. Clean. Prod. 327, 129458. doi:10.1016/j.jclepro.2021.129458
Chang, X., Fu, K., Low, A., and Zhang, W. (2015). Non-executive employee stock options and corporate innovation. J. Financial Econ. 115, 168–188. doi:10.1016/j.jfineco.2014.09.002
Cheah, S., and Ho, Y. P. (2019). Coworking and sustainable business model innovation in young firms. Sustainability 11, 2959. doi:10.3390/su11102959
Chen, C., Lan, Q., Gao, M., and Sun, Y. (2018). Green total factor productivity growth and its determinants in China’s industrial economy. Sustainability 10, 1052. doi:10.3390/su10041052
Chen, H., Zheng, J., Muhammad, I., Han, T., Zhang, D., Li, B., et al. (2022). Protein kinase D1 promotes the survival of random-pattern skin flaps in rats. Commer. Res. 641, 67–76. doi:10.1016/j.bbrc.2022.12.021
Chen, M. H., Liu, W. F., Wang, S., and Yue, H. J. (2022). Performance evaluation, difference decomposition and driving factors of green development in the yellow river basin. China Popul. Resour. Environ. 32, 126–133.
Chen, X. D., and Mu, X. Y. (2018). The impact of financial subsidy on scientific and technological innovation business performance—based on analysis of listed companies. Sci. Technol. Prog. Policy 35, 85–91.
Chen, Y., and Jermias, J. (2014). Business strategy, executive compensation and firm performance. Account. Finance 54, 113–134. doi:10.1111/j.1467-629X.2012.00498.x
Chopra, S. K., and Narayana, M. G. P. L. (2013). “Creating shared value by aligning business and social objectives through the application of technology,” in 2013 IEEE global humanitarian technology conference (GHTC), 489–494. doi:10.1109/GHTC.2013.6713735IEEE
Cooper, R. G. (1981). The components of risk in new product development: Project new prod. R&D Manag. 11, 47–54. doi:10.1111/j.1467-9310.1981.tb00449.x
Cui, X., Shen, Z., Li, Z., and Wu, J. (2021). Spatiotemporal evolutions and driving factors of green development performance of cities in the yangtze river economic belt. Ecol. Inf. 66, 101476. doi:10.1016/j.ecoinf.2021.101476
Dent, J. F. (1990). Strategy, organization and control: Some possibilities for accounting research. Account. Organ. Soc. 15, 3–25. doi:10.1016/0361-3682(90)90010-R
Denzin, N. K. (2017). The research act: A theoretical introduction to sociological methods. New York, USA: Routledge.
Dougherty, T. W., and Pritchard, R. D. (1985). The measurement of role variables: Exploratory examination of a new approach. Organ. Behav. Hum. Decis. Process. 35 (2), 141–155. doi:10.1016/0749-5978(85)90032-9
Du, L., and Ma, Y. Y. (2019). Green development and its performance measurement in “the belt and Road” countries. Jilin Univ. J. Soc. Sci. Ed. 59, 135–149+222. doi:10.15939/j.jujsse.2019.05.jj4
Du, Y., and Liu, L. G. (2002). Ownership structure and corporate governance efficiency: An empirical analysis of listed companies in China. J. Manag. World, 124–133. doi:10.19744/j.cnki.11-1235/f.2002.11.017
Edwards, J. R., and Cable, D. M. (2009). The value of value congruence. J. Appl. Psychol. 94, 654–677. doi:10.1037/a0014891
Edwards, J. R., and Parry, M. E. (1993). On the use of polynomial regression equations as an alternative to difference scores in organizational research. Acad. Manag. J. 36, 1577–1613. doi:10.5465/256822
Edwards, J. R. (1993). Problems with the use of profile similarity indices in the study of congruence in organizational research. Pers. Psychol. 46 (3), 641–665. doi:10.1111/j.1744-6570.1993.tb00889.x
Edwards, J. R., and Rothbard, N. P. (1999). Work and family stress and well-being: An examination of person-environment fit in the work and family domains. Organ. Behav. Hum. Decis. Process. 77, 85–129. doi:10.1006/obhd.1998.2813
Edwards, J. R. (2001). Ten difference score myths. Organ. Res. methods 4 (3), 265–287. doi:10.1177/109442810143005
Edwards, J. R. (1994). The study of congruence in organizational behavior research: Critique and a proposed alternative. Organ. Behav. Hum. Decis. Process. 58 (1), 51–100. doi:10.1006/obhd.1994.1029
Edwards, J. R., and Van Harrison, R. (1993). Job demands and worker health: Three-dimensional reexamination of the relationship between person-environment fit and strain. J. Appl. Psychol. 78, 628–648. doi:10.1037/0021-9010.78.4.628
Elsilä, A., Kallunki, J. P., Nilsson, H., and Sahlström, P. (2013). CEO personal wealth, equity incentives and firm performance. Corp. Gov. Int. Rev. 21, 26–41. doi:10.1111/corg.12001
Evans, S., Vladimirova, D., Holgado, M., Van Fossen, K., Yang, M., Silva, E. A., et al. (2017). Business model innovation for sustainability: Towards a unified perspective for creation of sustainable business models. Bus. Strategy Environ. 26, 597–608. doi:10.1002/bse.1939
Fan, L. L., and Chu, Y. Y. (2019). Enterprise environmental expenditure, government environmental subsidy and green technology innovation. Resour. Dev. Mark. 35, 20–25+37.
Farah, T., Li, J., Li, Z., and Shamsuddin, A. (2021). The non-linear effect of CSR on firms’ systematic risk: International evidence. J. Int. Financial Mark. Institutions Money 71, 101288. doi:10.1016/j.intfin.2021.101288
Farooq, O. (2015). Effect of ownership concentration on capital structure: Evidence from the MENA region. Int. J. Islamic Middle East. Finance Manag. 8, 99–113. doi:10.1108/IMEFM-10-2013-0115
Feng, C., Wang, M., Liu, G. C., and Huang, J. B. (2017). Green development performance and its influencing factors: A global perspective. J. Clean. Prod. 144, 323–333. doi:10.1016/j.jclepro.2017.01.005
Feng, S., Zhang, R., and Li, G. (2022). Environmental decentralization, digital finance and green technology innovation. Struct. Change Econ. Dyn. 61, 70–83. doi:10.1016/j.strueco.2022.02.008
Fiss, P. C. (2011). Building better causal theories: A fuzzy set approach to typologies in organization research. Acad. Manag. J. 54, 393–420. doi:10.5465/amj.2011.60263120
Flammer, C., and Bansal, P. (2017). Does a long-term orientation create value? Evidence from a regression discontinuity. Strategic Manag. J. 38, 1827–1847. doi:10.1002/smj.2629
Florio, C., and Leoni, G. (2017). Enterprise risk management and firm performance: The Italian case. Br. Account. Rev. 49, 56–74. doi:10.1016/j.bar.2016.08.003
Forés, B. (2019). Beyond gathering the ‘low-hanging fruit’ of green technology for improved environmental performance: An empirical examination of the moderating effects of proactive environmental management and business strategies. Sustainability 11, 6299. doi:10.3390/su11226299
Foss, N. J., and Saebi, T. (2017). Fifteen years of research on business model innovation: How far have we come, and where should we go? J. Manag. 43, 200–227. doi:10.1177/0149206316675927
Gaiardelli, P., Resta, B., Martinez, V., Pinto, R., and Albores, P. (2014). A classification model for product-service offerings. J. Clean. Prod. 66, 507–519. doi:10.1016/j.jclepro.2013.11.032
Gao, Y. (2019a). Study on green development performance and influencing factors in eight comprehensive economic areas of China. J. Quantitative Tech. Econ. 36, 3–23. doi:10.13653/j.cnki.jqte.20190906.002
Gao, Y. (2019b). Study on low-carbon and green development performance for countries along the belt and Road. Soft Sci. 33, 78–84. doi:10.13956/j.ss.1001-8409.2019.08.14
Geissdoerfer, M., Bocken, N. M., and Hultink, E. J. (2016). Design thinking to enhance the sustainable business modelling process–A workshop based on a value mapping process. J. Clean. Prod. 135, 1218–1232. doi:10.1016/j.jclepro.2016.07.020
Geissdoerfer, M., Vladimirova, D., and Evans, S. (2018). Sustainable business model innovation: A review. J. Clean. Prod. 198, 401–416. doi:10.1016/j.jclepro.2018.06.240
Gilbey, A., Walmsley, S., Tani, K., and Reweti, S. (2021). Decision making dyads and judgement overconfidence: Implications for high-risk industries. Appl. Ergon. 97, 103529. doi:10.1016/j.apergo.2021.103529
Goni, F. A., Gholamzadeh Chofreh, A., Estaki Orakani, Z., Klemeš, J. J., Davoudi, M., and Mardani, A. (2021). Sustainable business model: A review and framework development. Clean Technol. Environ. Policy 23, 889–897. doi:10.1007/s10098-020-01886-z
Goodhue, D. L., and Thompson, R. L. (1995). Task-technology fit and individual performance. MIS Q. 19, 213–236. doi:10.2307/249689
Gumusluoglu, L., and Acur, N. (2016). Fit among business strategy, strategy formality, and dynamic capability development in new product development. Eur. Manag. Rev. 13, 107–123. doi:10.1111/emre.12070
Guo, J. H., and Zhou, D. P. (2021). The impact of national innovation-oriented city policy on urban green development performance. Soft Sci. 35, 85–92. doi:10.13956/j.ss.1001-8409.2021.10.14
Guo, L., Cao, Y., Qu, Y., and Tseng, M. L. (2022). Developing sustainable business model innovation through stakeholder management and dynamic capability: A longitudinal case study. J. Clean. Prod. 372, 133626. doi:10.1016/j.jclepro.2022.133626
Guo, Y, Y., Wang, L., and Xie, Y. (2018). Green innovation, green entrepreneurial orientation and supply chain learning: Evidence from manufacturing firms in China. Basel, Switzerland. doi:10.20944/preprints201805.0232.v1
Guo, Y. Y, Y. Y., Zhang, S., and Zhang, D. P. (2018). The impacts of environmental regulation and governmental R and D funding on green technology innovation: Suppressing or promoting? — a literature review. East China Econ. Manag. 32, 40–47. doi:10.19629/j.cnki.34-1014/f.170926016
Gupta, A. K., and Gupta, N. (2020). Effect of corporate environmental sustainability on dimensions of firm performance–towards sustainable development: Evidence from India. J. Clean. Prod. 253, 119948. doi:10.1016/j.jclepro.2019.119948
Hart, S. L., and Milstein, M. B. (2003). Creating sustainable value. Acad. Manag. Perspect. 17 (2), 56–67. doi:10.5465/ame.2003.10025194
He, L., Sun, Y., Xia, Y., and Zhong, Z. (2021). Construction of a green development performance index of industrial enterprises: Based on the empirical study of 458 listed industrial enterprises in China. Ecol. Indic. 132, 108239. doi:10.1016/j.ecolind.2021.108239
He, Z. L., Tong, T. W., Zhang, Y., and He, W. (2018). Constructing a Chinese patent database of listed firms in China: Descriptions, lessons, and insights. J. Econ. Manag. Strategy 27, 579–606. doi:10.1111/jems.12186
Henderson, A. D., Raynor, M. E., and Ahmed, M. (2012). How long must a firm Be great to rule out chance? Benchmarking sustained superior performance without being fooled by randomness. Strategic Manag. J. 33, 387–406. doi:10.1002/smj.1943
Herhausen, D. (2016). Unfolding the ambidextrous effects of proactive and responsive market orientation. J. Bus. Res. 69, 2585–2593. doi:10.1016/j.jbusres.2015.10.139
Hirshleifer, D., Low, A., and Teoh, S. H. (2012). Are overconfident CEOs better innovators? J. Finance 67, 1457–1498. doi:10.1111/j.1540-6261.2012.01753.x
Homburg, C., Stierl, M., and Bornemann, T. (2013). Corporate social responsibility in business-to-business markets: How organizational customers account for supplier corporate social responsibility engagement. J. Mark. 77, 54–72. doi:10.1509/jm.12.0089
Hu, D., Jiao, J., Tang, Y., Han, X., and Sun, H. (2021). The effect of global value chain position on green technology innovation efficiency: From the perspective of environmental regulation. Ecol. Indic. 121, 107195. doi:10.1016/j.ecolind.2020.107195
Ilmarinen, V. J., Lönnqvist, J. E., and Paunonen, S. (2016). Similarity-attraction effects in friendship formation: Honest platoon-mates prefer each other but dishonest do not. Personality Individ. Differ. 92, 153–158. doi:10.1016/j.paid.2015.12.040
Ittner, C. D., Larcker, D. F., and Rajan, M. V. (1997). The choice of performance measures in annual bonus contracts. Account. Rev., 231–255.
Jabbour, C. J. C., Seuring, S., de Sousa Jabbour, A. B. L., Jugend, D., Fiorini, P. D. C., Latan, H., et al. (2020). Stakeholders, innovative business models for the circular economy and sustainable performance of firms in an emerging economy facing institutional voids. J. Environ. Manag. 264, 110416. doi:10.1016/j.jenvman.2020.110416
Jensen, M. C., and Meckling, W. H. (1976). Theory of the firm: Managerial behavior, agency costs and ownership structure. J. Financial Econ. 3, 305–360. doi:10.1016/0304-405X(76)90026-X
Jin, P., Peng, C., and Song, M. (2019). Macroeconomic uncertainty, high-level innovation, and urban green development performance in China. China Econ. Rev. 55, 1–18. doi:10.1016/j.chieco.2019.02.008
Jolink, A., and Niesten, E. (2015). Sustainable development and business models of entrepreneurs in the organic food industry. Bus. Strategy Environ. 24 (6), 386–401. doi:10.1002/bse.1826
Joyce, A., and Paquin, R. L. (2016). The triple layered business model canvas: A tool to design more sustainable business models. J. Clean. Prod. 135, 1474–1486. doi:10.1016/j.jclepro.2016.06.067
Jum'a, L., Zimon, D., Ikram, M., and Madzík, P. (2022). Towards a sustainability paradigm; the nexus between lean green practices, sustainability-oriented innovation and triple bottom line. Int. J. Prod. Econ. 245, 108393. doi:10.1016/j.ijpe.2021.108393
Kabanoff, B., and Brown, S. (2008). Knowledge structures of prospectors, analyzers, and defenders: Content, structure, stability, and performance. Strategic Manag. J. 29, 149–171. doi:10.1002/smj.644
Kaiyuan, D., Tao, J., Shenghui, Z., Ting, T., and Guixiang, Z. (2019). The interaction between technological innovation and business model innovation and its interaction effect on competitive advantage of enterprises. London, UK: Z. Shenghui.-Francis Academic Press, 248. doi:10.25236/icemeet.2019.448
Kim, M., Boyd, D. E., Kim, N., and Cheong, H. Y. (2016). CMO equity incentive and shareholder value: Moderating role of CMO managerial discretion. Int. J. Res. Mark. 33, 725–738. doi:10.1016/j.ijresmar.2016.09.001
Klemetsen, M. E., Bye, B., and Raknerud, A. (2018). Can direct regulations spur innovations in environmental technologies? A study on firm-level patenting. Scand. J. Econ. 120, 338–371. doi:10.1111/sjoe.12201
Kluza, K., Ziolo, M., and Spoz, A. (2021). Innovation and environmental, social, and governance factors influencing sustainable business models-meta-analysis. J. Clean. Prod. 303, 127015. doi:10.1016/j.jclepro.2021.127015
Kolk, A. (2016). The social responsibility of international business: From ethics and the environment to CSR and sustainable development. J. World Bus. 51, 23–34. doi:10.1016/j.jwb.2015.08.010
Kong, D., Yang, X., Liu, C., and Yang, W. (2020). Business strategy and firm efforts on environmental protection: Evidence from China. Bus. Strategy Environ. 29, 445–464. doi:10.1002/bse.2376
Larbi-Siaw, O., Xuhua, H., Owusu, E., Owusu-Agyeman, A., Fulgence, B. E., and Frimpong, S. A. (2022). Eco-innovation, sustainable business performance and market turbulence moderation in emerging economies. Technol. Soc. 68, 101899. doi:10.1016/j.techsoc.2022.101899
Le, T. T. (2022). How do corporate social responsibility and green innovation transform corporate green strategy into sustainable firm performance? J. Clean. Prod. 362, 132228. doi:10.1016/j.jclepro.2022.132228
Lei, Z., and Wright, B. D. (2017). Why weak patents? Testing the examiner ignorance hypothesis. J. Public Econ. 148, 43–56. doi:10.1016/j.jpubeco.2017.02.004
Li, K., Mai, F., Shen, R., and Yan, X. (2021). Measuring corporate culture using machine learning. Rev. Financial Stud. 34, 3265–3315. doi:10.1093/rfs/hhaa079
Li, L., Yang, H. Z., Tan, Y. B., and Jian, Z. Q. (2016). A literature review of task-technology fit theory and tendency prospects. Shanghai, China: Foreign Economics and Management, 29–41. doi:10.16538/j.cnki.fem.2016.01.00301
Li, S. M., and Li, Q. (2019). Equity structure, nature of property right and development of equipment manufacturing enterprise—an empirical study based on data of listed companies from 2012 to 2017. Inn. Mong. Soc. Sci. 40, 108–115. doi:10.14137/j.cnki.issn1003-5281.2019.02.016
Li, Z., Liao, G., and Albitar, K. (2020). Does corporate environmental responsibility engagement affect firm value? The mediating role of corporate innovation. Bus. Strategy Environ. 29 (3), 1045–1055. doi:10.1002/bse.2416
Liao, B., and Li, L. (2022). Spatial division of labor, specialization of green technology innovation process and urban coordinated green development: Evidence from China. Sustain. Cities Soc. 80, 103778. doi:10.1016/j.scs.2022.103778
Lin, Y. H., and Chen, Y. S. (2017). Determinants of green competitive advantage: The roles of green knowledge sharing, green dynamic capabilities, and green service innovation. Qual. Quantity 51, 1663–1685. doi:10.1007/s11135-016-0358-6
Lindgardt, Z., Reeves, M., Stalk, G., and Deimler, M. (2012). Own the future: 50 ways to win from. New Jersey, USA: The Boston Consulting Group, 291–298. doi:10.1002/9781119204084.ch40Business model innovation: When the game gets tough, change the game
Liu, C., and Kong, D. (2021). Business strategy and sustainable development: Evidence from China. Bus. Strategy Environ. 30, 657–670. doi:10.1002/bse.2645
Liu, R., Chen, D., Yang, S., and Chen, Y. (2021). Evaluation of green development efficiency of the major cities in gansu province, China. Sustainability 13, 3034. doi:10.3390/su13063034
Losacker, S. (2022). ‘License to green’: Regional patent licensing networks and green technology diffusion in China. Technol. Forecast. Soc. Change 175, 121336. doi:10.1016/j.techfore.2021.121336
Lu, N., Wu, J., and Liu, Z. (2022). How does green finance reform affect enterprise green technology innovation? Evidence from China. Sustainability 14, 9865. doi:10.3390/su14169865
Lubatkin, M. H., Simsek, Z., Ling, Y., and Veiga, J. F. (2006). Ambidexterity and performance in small-to medium-sized firms: The pivotal role of top management team behavioral integration. J. Manag. 32, 646–672. doi:10.1177/0149206306290712
Lüdeke-Freund, F. (2010). in Towards a conceptual framework of 'business models for sustainability. Editors R. Wever, J. Quist, A. Tukker, J. Woudstra, F. Boons, and N. Beute (Delft: Knowledge Collaboration and Cearning for Sustainable Innovation), 25–29.
Lv, C., Shao, C., and Lee, C. C. (2021). Green technology innovation and financial development: Do environmental regulation and innovation output matter? Energy Econ. 98, 105237. doi:10.1016/j.eneco.2021.105237
Lv, D. W., Lan, H. L., and Chen, W. H. (2018). Study on the relationship between performance feedback inconsistency and R&D intensity. Nankai Bus. Rev. 21, 50–61. doi:10.3969/j.issn.1008-3448.2018.04.006
Ma, Y., Zhang, Q., and Yin, Q. (2021). Top management team faultlines, green technology innovation and firm financial performance. J. Environ. Manag. 285, 112095. doi:10.1016/j.jenvman.2021.112095
Mao, H., Yin, Z. F., and Zhang, J. (2018). Could China’s innovation get rid of the trap of utility model system. China Ind. Econ., 98–115. doi:10.19581/j.cnki.ciejournal.2018.03.006
Meseguer-Sánchez, V., Gálvez-Sánchez, F. J., López-Martínez, G., and Molina-Moreno, V. (2021). Corporate social responsibility and sustainability. A bibliometric analysis of their interrelations. Sustainability 13, 1636. doi:10.3390/su13041636
Miles, R. E., and Snow, C. C. (1978). Organizational strategy, structure and process. New York: McGraw-Hill.
Miles, R. E., and Snow, C. C. (2003). Organizational strategy, structure, and process. Stanford, CA: Stanford University Press.
Milgrom, P., and Roberts, J. (1995). Complementarities and fit strategy, structure, and organizational change in manufacturing. J. Account. Econ. 19, 179–208. doi:10.1016/0165-4101(94)00382-F
Minatogawa, V., Franco, M., Rampasso, I. S., Holgado, M., Garrido, D., Pinto, H., et al. (2022). Towards systematic sustainable business model innovation: What can we learn from business model innovation. Sustainability 14, 2939. doi:10.3390/su14052939
Mintzberg, H., and Waters, J. A. (1985). Of strategies, deliberate and emergent. Strategic Manag. J. 6, 257–272. doi:10.1002/smj.4250060306
Nath, P., and Siepong, A. (2022). Green marketing capability: A configuration approach towards sustainable development. J. Clean. Prod. 354, 131727. doi:10.1016/j.jclepro.2022.131727
Nikolaou, I. E., Evangelinos, K. I., and Allan, S. (2013). A reverse logistics social responsibility evaluation framework based on the triple bottom line approach. J. Clean. Prod. 56, 173–184. doi:10.1016/j.jclepro.2011.12.009
Olson, E. M., Slater, S. F., and Hult, G. T. M. (2005). The importance of structure and process to strategy implementation. Bus. Horizons 48, 47–54. doi:10.1016/j.bushor.2004.10.002
Ossewaarde, M., and Ossewaarde-Lowtoo, R. (2020). The EU’s green deal: A third alternative to green growth and degrowth? Sustainability 12, 9825. doi:10.3390/su12239825
Papadakis, V. M., and Barwise, P. (2002). How much do CEOs and top managers matter in strategic decision-making? Br. J. Manag. 13, 83–95. doi:10.1111/1467-8551.00224
Peng, C. W. (2020). The role of business strategy and CEO compensation structure in driving corporate social responsibility: Linkage towards a sustainable development perspective. Corp. Soc. Responsib. Environ. Manag. 27, 1028–1039. doi:10.1002/csr.1863
Peralta, A., Carrillo-Hermosilla, J., and Crecente, F. (2019). Sustainable business model innovation and acceptance of its practices among Spanish entrepreneurs. Corp. Soc. Responsib. Environ. Manag. 26, csr.1790–1134. doi:10.1002/csr.1790
Qi, S. Z., Lin, S., and Cui, J. B. (2018). Do environmental rights trading schemes induce green innovation? Evidence from listed firms in China. Econ. Res. J. 53, 129–143.
Qu, S., Shi, H., Zhao, H., Yu, L., and Yu, Y. (2021). Research on enterprise business model and technology innovation based on artificial intelligence. Eurasip J. Wirel. Commun. Netw. 2021, 145–219. doi:10.1186/s13638-021-02025-y
Rajaratnam, M., Rajaratnam, B., and Rajaratnam, K. (2011). Murdering mr. Market: An equity valuation and capital allocation model for long-term value-investors.” in Market: An equity valuation and capital allocation model for long-term value-investors. (September 29, 2011). doi:10.2139/ssrn.1935365
Rice, R. W., McFarlin, D. B., and Bennett, D. E. (1989). Standards of comparison and job satisfaction. J. Appl. Psychol. 74 (4), 591–598. doi:10.1037/0021-9010.74.4.591
Roper, S., and Tapinos, E. (2016). Taking risks in the face of uncertainty: An exploratory analysis of green innovation. Technol. Forecast. Soc. Change 112, 357–363. doi:10.1016/j.techfore.2016.07.037
Saebi, T., Lien, L., and Foss, N. J. (2017). What drives business model adaptation? The impact of opportunities, threats and strategic orientation. Long. Range Plan. 50, 567–581. doi:10.1016/j.lrp.2016.06.006
Sahoo, S., Kumar, A., and Upadhyay, A. (2022). How do green knowledge management and green technology innovation impact corporate environmental performance? Understanding the role of green knowledge acquisition. New Jersey, USA: Business Strategy and the Environment, 1–19. doi:10.1002/bse.3160
Schaltegger, S., Lüdeke-Freund, F., and Hansen, E. G. (2012). Business cases for sustainability: The role of business model innovation for corporate sustainability. Int. J. Innovation Sustain. Dev. 6, 95–119. doi:10.1504/IJISD.2012.046944
Schmidt, K. M. (1997). Managerial incentives and product market competition. Rev. Econ. Stud. 64, 191–213. doi:10.2307/2971709
Schwab, K. (2017). The global competitiveness report 2017-2018. Geneva, Switzerland: World Economic Forum.
Seuring, S., and Müller, M. (2008). From a literature review to a conceptual framework for sustainable supply chain management. J. Clean. Prod. 16, 1699–1710. doi:10.1016/j.jclepro.2008.04.020
Shakeel, J., Mardani, A., Chofreh, A. G., Goni, F. A., and Klemeš, J. J. (2020). Anatomy of sustainable business model innovation. J. Clean. Prod. 261, 121201. doi:10.1016/j.jclepro.2020.121201
Shanock, L. R., Baran, B. E., Gentry, W. A., Pattison, S. C., and Heggestad, E. D. (2014). Erratum to: Polynomial regression with response surface analysis: A powerful approach for examining moderation and overcoming limitations of difference scores. J. Bus. Psychol. 29, 161. doi:10.1007/s10869-013-9317-6
Shi, Q., and Lai, X. (2013). Identifying the underpin of green and low carbon technology innovation research: A literature review from 1994 to 2010. Technol. Forecast. Soc. Change 80, 839–864. doi:10.1016/j.techfore.2012.09.002
Shiu, Y. M., and Yang, S. L. (2017). Does engagement in corporate social responsibility provide strategic insurance-like effects? Strategic Manag. J. 38, 455–470. doi:10.1002/smj.2494
Shu, C. L., Hu, Y. F., and Jiang, X. (2015). Learning ambidexterity, knowledge acquisition and innovation performance in strategic alliances. R&D Manag. 27, 97–106. doi:10.13581/j.cnki.rdm.2015.06.012
Song, L., Augustine, D., and Yang, J. Y. (2016). Environmental uncertainty, prospector strategy, and new venture performance: The moderating role of network capabilities. Int. Entrepreneursh. Manag. J. 12, 1103–1126. doi:10.1007/s11365-016-0382-y
Spangenberg, J. H., Pfahl, S., and Deller, K. (2002). Towards indicators for institutional sustainability: Lessons from an analysis of agenda 21. Ecol. Indic. 2, 61–77. doi:10.1016/S1470-160X(02)00050-X
Spieth, P., Schneider, S., Clauß, T., and Eichenberg, D. (2019). Value drivers of social businesses: A business model perspective. Long. Range Plan. 52, 427–444. doi:10.1016/j.lrp.2018.04.004
Stubbs, W., and Cocklin, C. (2008). Conceptualizing a “sustainability business model, 21. California, USA: Organization and Environment, 103–127. doi:10.1177/1086026608318042
Subramaniam, N., Collier, P., Phang, M., and Burke, G. (2011). The effects of perceived business uncertainty, external consultants and risk management on organisational outcomes. J. Account. Organ. Change 7, 132–157. doi:10.1108/18325911111139671
Sun, L. Y., Miao, C. L., and Yang, L. (2017). Ecological-economic efficiency evaluation of green technology innovation in strategic emerging industries based on entropy weighted TOPSIS method. Ecol. Indic. 73, 554–558. doi:10.1016/j.ecolind.2016.10.018
Sun, Z. Q., Cheng, X. F., and Gu, W. S. (2021). Influence of heterogeneous environmental regulation on industrial green development performance. East China Econ. Manag. 35, 1–10. doi:10.19629/j.cnki.34-1014/f.210316011
Taran, Y., Boer, H., and Lindgren, P. (2015). A business model innovation typology. Decis. Sci. 46, 301–331. doi:10.1111/deci.12128
Todeschini, B. V., Cortimiglia, M. N., Callegaro-de-Menezes, D., and Ghezzi, A. (2017). Innovative and sustainable business models in the fashion industry: Entrepreneurial drivers, opportunities, and challenges. Bus. horizons 60, 759–770. doi:10.1016/j.bushor.2017.07.003
Tong, Z. Q., Li, P. X., Yang, L., and Wang, S. K. (2022). The effect of the matching of business model innovation and technology innovation on the performance of latecomers: A textual analysis based on annual report. Sci. Technol. Prog. Policy 39, 84–93. doi:10.6049/kjjbydc.2021020420
Tubbs, M. E., and Dahl, J. G. (1991). An empirical comparison of self-report and discrepancy measures of goal commitment. J. Appl. Psychol. 76 (5), 708–716. doi:10.1037/0021-9010.76.5.708
Turban, D. B., and Jones, A. P. (1988). Supervisor-subordinate similarity: Types, effects, and mechanisms. J. Appl. Psychol. 73 (2), 228–234. doi:10.1037/0021-9010.73.2.228
Velter, M. G. E., Bitzer, V., Bocken, N. M. P., and Kemp, R. (2020). Sustainable business model innovation: The role of boundary work for multi-stakeholder alignment. J. Clean. Prod. 247, 119497. doi:10.1016/j.jclepro.2019.119497
Walker, R. M., and Brewer, G. A. (2009). Can management strategy minimize the impact of red tape on organizational performance? Adm. Soc. 41, 423–448. doi:10.1177/0095399709338027
Wang, B. B., and Zhao, C. (2019). China's green technological innovation—patent statistics and influencing factors. J. Industrial Technol. Econ. 38, 53–66. doi:10.3969/j.issn.1004-910X.2019.07.007
Wang, F., and Zhang, X. P. S. (2015). The role of the internet in changing industry competition. Inf. Manag. 52, 71–81. doi:10.1016/j.im.2014.10.006
Wang, L., Zeng, T., and Li, C. (2022). Behavior decision of top management team and enterprise green technology innovation. J. Clean. Prod. 367, 133120. doi:10.1016/j.jclepro.2022.133120
Wang, M., Li, Y., Cheng, Z., Zhong, C., and Ma, W. (2021a). Evolution and equilibrium of a green technological innovation system: Simulation of a tripartite game model. J. Clean. Prod. 278, 123944. doi:10.1016/j.jclepro.2020.123944
Wang, M., Li, Y., Li, J., and Wang, Z. (2021b). Green process innovation, green product innovation and its economic performance improvement paths: A survey and structural model. J. Environ. Manag. 297, 113282. doi:10.1016/j.jenvman.2021.113282
Wang, Y., and Yang, Y. (2021). Analyzing the green innovation practices based on sustainability performance indicators: A Chinese manufacturing industry case. Environ. Sci. Pollut. Res. 28, 1181–1203. doi:10.1007/s11356-020-10531-7
Wang, F. Z, F. Z., Jiang, T., and Guo, X. C. (2018). Government quality, environmental regulation and green technological innovation of enterprises. Sci. Res. Manag. 39, 26–33. doi:10.19571/j.cnki.1000-2995.2018.01.004
Wang, K. M, K. M., Wang, H. J., Li, D. D., and Dai, X. Y. (2018). Complexity of annual report and management self-interest: Empirical evidence from Chinese listed firms. Manag. World 34, 120–132+194. doi:10.19744/j.cnki.11-1235/f.2018.0038
Wicki, S., and Hansen, E. G. (2019). Green technology innovation: Anatomy of exploration processes from a learning perspective. Bus. Strategy Environ. 28, 970–988. doi:10.1002/bse.2295
Wirtz, B. W., Pistoia, A., Ullrich, S., and Göttel, V. (2016). Business models: Origin, development and future research perspectives. Long. Range Plan. 49, 36–54. doi:10.1016/j.lrp.2015.04.001
Xi, J. P. (2022). On adhering to the harmonious coexistence of man and nature. Beijing, China: Central Literature Publishing House, 252.
Xia, B., Olanipekun, A., Chen, Q., Xie, L., and Liu, Y. (2018). Conceptualising the state of the art of corporate social responsibility (CSR) in the construction industry and its nexus to sustainable development. J. Clean. Prod. 195, 340–353. doi:10.1016/j.jclepro.2018.05.157
Xia, D., Zhang, M., Yu, Q., and Tu, Y. (2019). Developing a framework to identify barriers of green technology adoption for enterprises. Resour. Conservation Recycl. 143, 99–110. doi:10.1016/j.resconrec.2018.12.022
Xiao, Y., and Zhang, X. (2021). Influence of technological mergers and acquisitions on the sustainability of manufacturing enterprise innovation: An analysis based on the modiating role of absorptive capacity and utilization capacity. J. Technol. Econ. 40, 1–12.
Xie, L., Yao, Y., Dan, Z. G., Shi, F. F., Yuan, Y., Fang, L., et al. (2022). Evaluation of provincial green development performance based on DPSIR model. J. Environ. Eng. Technol 12, 1681–1686. doi:10.12153/j.issn.1674-991X.20210612
Xu, J., Ruijie, J., and Mingmei, S. (2022a). Research on government-business relations and innovation decision-making of private enterprises. Sci. Res. Manag. 43, 63. doi:10.19571/j.cnki.1000-2995.2022.08.008
Xu, L. Y., Zhang, D. D., and Du, J. G. (2022b). The impact of environmental regulation on the green development performance of new agricultural operation entities—the moderating role of green culture. Chin. J. Agric. Resour. Regional Plan.
Xu, X., Huang, X., Huang, J., Gao, X., and Chen, L. (2019). Spatial-temporal characteristics of agriculture green total factor productivity in China, 1998 - 2016: Based on more sophisticated calculations of carbon emissions. Int. J. Environ. Res. Public Health 16, 3932. doi:10.3390/ijerph16203932
Xue, L., Zhang, Q., Zhang, X., and Li, C. (2022). Can digital transformation promote green technology innovation? Sustainability 14, 7497. doi:10.3390/su14127497
Yang, M., Evans, S., Vladimirova, D., and Rana, P. (2017). Value uncaptured perspective for sustainable business model innovation. J. Clean. Prod. 140, 1794–1804. doi:10.1016/j.jclepro.2016.07.102
Yang, Y., Tan, N., and Hu, J. N. (2022). Global value chain embedding, technological innovation and green development of resource-based industries. Statistics Decis. 15, 71–76. doi:10.13546/j.cnki.tjyjc.2022.15.013
Ye, Z., Zhang, X., and Hu, C. (2021). Corporate operating strategy and short-term loans used as long-term investment. Nankai Bus. Rev.
Yin, S., Zhang, N., Li, B., and Dong, H. (2021). Enhancing the effectiveness of multi-agent cooperation for green manufacturing: Dynamic Co-evolution mechanism of a green technology innovation system based on the innovation value chain. Environ. Impact Assess. Rev. 86, 106475. doi:10.1016/j.eiar.2020.106475
Yip, A. W., and Bocken, N. M. (2018). Sustainable business model archetypes for the banking industry. J. Clean. Prod. 174, 150–169. doi:10.1016/j.jclepro.2017.10.190
Yu, L. C., and Bi, Q. (2021). Can environmental management system certification curb the risk of stock price crash? J. Bus. Econ., 55–69. doi:10.14134/j.cnki.cn33-1336/f.2021.08.005
Yuan, H. X., Feng, Y. D., and Yu, Y. Z. (2022). Does manufacturing agglomeration promote or hinder green development performance? Evidence from the yangtze river economic belt. Econ. Geogr. 42, 121–131. doi:10.15957/j.cnki.jjdl.2022.06.013
Yun, J., Ning, X., and Bao, Y. (2021). CEO overconfidence and strategic change: Research based on resilience effect and creative effect. Nankai Bus. Rev.
Zahra, S. A., Sapienza, H. J., and Davidsson, P. (2006). Entrepreneurship and dynamic capabilities: A review, model and research agenda. J. Manag. Stud. 43, 917–955. doi:10.1111/j.1467-6486.2006.00616.x
Zhang, J., and Tan, W. (2016). Study on the green total factor productivity in main cities of China. Zb. Rad. Ekon. Fak. u Rijeci časopis za Ekon. Teor. i praksu 34, 215–234. doi:10.18045/zbefri.2016.1.215
Zhang, Y. C., and Li, S. L. (2009). High performance work practices and firm performance: Evidence from the pharmaceutical industry in China. Int. J. Hum. Resour. Manag. 20, 2331–2348. doi:10.1080/09585190903239690
Zhang, Y., Zhou, Y. H., and Liu, Z. Z. (2019). Research on the relationship between ownership concentration and business performance of rural banks. J. Yunnan Univ. Finance Econ. 35, 84–93. doi:10.16537/j.cnki.jynufe.000518
Zheng, F., Shen, X. H., and Lu, R. (2021). Heterogeneous influence of government subsidies on enterprise performance: Based on the perspective of industry life cycle. Econ. Surv. 38, 96–104. doi:10.15931/j.cnki.1006-1096.2021.01.007
Zott, C., Amit, R., and Massa, L. (2011). The business model: Recent developments and future research. J. Manag. 37, 1019–1042. doi:10.1177/0149206311406265
Keywords: sustainable business model innovation, green technology innovation, sustainable corporate performance, degree of strategic aggressiveness, matching effect, amplification effect
Citation: Zhou N, Pan L, Tian Y, Zhu N, Cai X and Gao J (2023) How sustainable business model innovation and green technology innovation interact to affect sustainable corporate performance. Front. Environ. Sci. 11:1049295. doi: 10.3389/fenvs.2023.1049295
Received: 20 September 2022; Accepted: 05 January 2023;
Published: 18 January 2023.
Edited by:
Zhenghui Li, Guangzhou University, ChinaReviewed by:
Luigi Aldieri, University of Salerno, ItalySuat Teker, Isik University, Türkiye
Feng Li, Beijing Wuzi University, China
Copyright © 2023 Zhou, Pan, Tian, Zhu, Cai and Gao. This is an open-access article distributed under the terms of the Creative Commons Attribution License (CC BY). The use, distribution or reproduction in other forums is permitted, provided the original author(s) and the copyright owner(s) are credited and that the original publication in this journal is cited, in accordance with accepted academic practice. No use, distribution or reproduction is permitted which does not comply with these terms.
*Correspondence: Liurong Pan, cGFuX2JiZ3VAeWVhaC5uZXQ=; Ye Tian, ODM1MzYxMDAyQHFxLmNvbQ==