- 1Key Laboratory of Geographic Information System, Ministry of Education, School of Resources and Environmental Sciences, Wuhan University, Wuhan, China
- 2Department of Geography, University of Washington, Seattle, WA, United States
The nighttime lights accurately and coherently depict how humans live. This study uses nighttime light measurements to quantify changes in nighttime lighting and refugee population in Ukraine before and after the war. We combined the Theil–Sen estimator with the M-K test to explore the trends of nighttime light. In addition, we constructed a linear model using nighttime light data and a portion of the UNHCR refugee data. Our results reveal that 1 week after the start of the Russo-Ukrainian War, the nighttime light area and the average nighttime light DN value in Ukraine exhibited a steep decline of about 50 percent. Our findings showed taht refugee population changes calculated through models and nighttime light data were mostly consistent with UNHCR data. We thought that the nighttime light data might be used directly to dynamically estimate changes in the refugee movement throughout the war. Nighttime light changes has significant implications for international humanitarian assistance and post-war reconstruction.
1 Introduction
The Russian–Ukrainian War is one of the worst conflicts of the 21st century. Since the commencement of the conflict on February 24, Russia and Ukraine, particularly the Ukrainian populace, have sustained significant losses (Aljazeera, 2022; BBC, 2022; CBC, 2022; Guardian, 2022; NPR, 2022; UN News, 2022). Currently, the fight is increasing and expanding. Both countries, particularly Ukraine, will incur more losses if the crisis persists. Under the current circumstances, it is vital to conduct a scientific assessment of the refugee population, which will draw the world’s attention to this unfortunate conflict and persuade the parties to continue peace discussions via the influence of public media. Simultaneously, it is crucial to create a scientific basis for international assistance to Ukraine and, more importantly, to build post-war domestic reconstruction indicators for Ukraine.
There are now multiple sources for the dynamic estimation of the Ukrainian domestic refugee population during the Russian–Ukrainian War, including reports from the Ukrainian government, western media, and the United Nations Refugee Agency. Using nighttime lights and remote sensing data to assess the war’s dynamics is a practical and efficient method. The US Defense Meteorological Satellite Program (DMSP) developed the Operational Linescan System (OLS) in the twentieth century. The original goal of the system was to remotely measure the faint reflection of moonlight by clouds at night to obtain the inversion of nighttime meteorological data. However, OLS can catch city lights sensitively in conditions of a clear night sky, which has spurred the development of nighttime light remote sensing (Croft, 1978; Deren and Xi, 2015). Numerous researchers have adopted this approach because of the extensive utility of nighttime light remote sensing in studies of global and regional urbanization, population change, and economic activity. Through literature reviews, some researchers have summarized the applications of nighttime light data from various industries in studies of the nature and society. In addition, they have voiced concerns about the limitations and difficulties of nighttime lighting data and have made proposals for its development and improvement (Zhao et al., 2019). Many studies have examined the origin, data platform, application orientation, and remote sensing nighttime light data development trends. Nighttime light data were analyzed to assess the potential for data mining from new data sources, knowledge discovery, ground observations, and geographical conditions, i.e., global situation monitoring (Deren and Xi, 2015).
Numerous nighttime light remote sensing applications have been devised and applied in studies of urbanization, population change, economic activity, conflict assessment, greenhouse gas emissions, and the environment. The possible impact of soil resources on construction lands can be evaluated using the DMSP/OLS nighttime light image dataset in conjunction with census data and soil map data (Imhoff et al., 1997). They used DMSP/OLS multi-temporal nighttime light data in urban development for iterative unsupervised classifications. The data then permitted the construction of maps of regional and urban dynamic changes (Zhang and Seto, 2011; Stokes and Seto, 2019; Liu et al., 2012). The inversion of nighttime light data on regional urbanization and economic growth is a mature topic of the study. Using multi-year nighttime light images in conjunction with urban street network data to capture the urban form and features of different regions has enabled a spatial–temporal analysis of urban expansion (Duque et al., 2019). The nighttime light data produced by the Visible Infrared Imaging Radiometer Suite (VIIRS) carried out by the Suomi National Polar-orbiting Partnership (S-NPP) satellite, when combined with local economic data and modeled with quadratic polynomials, allow the relationship between city-level gross domestic product (GDP) distribution characteristics and landform types to be investigated (Zhao et al., 2017). The study of the population distribution using the data on nighttime lights dates back to the 1990s. Using DMSP/OLS image composite data and high-resolution census data to perform comparative research, the regularity of image-valued areas and population residential areas can be determined (Sutton et al., 1997; Lo, 2001). Additionally, nighttime light data can be utilized to gauge social and economic growth (Chen and Nordhaus, 2011; Shi et al., 2014; Wu and Wang, 2019). Using nighttime light data to dynamically assess war-torn and underdeveloped countries can determine the status and development of post-war rehabilitation work and serve as a significant source of data for tracking humanitarian crises in the destination country. Furthermore, this analysis provides scientific evidence for the following recuperation and development of local economic activities (Li et al., 2017; Li et al., 2018). Social and productive human activities accompany the nighttime illumination. When losses are inflicted by war or natural catastrophes, a quantitative framework can be developed, and multi-temporal nighttime light data can be used to quantify the extent of the damage to economic activities rapidly. Also, the nighttime light data can even provide scientific information for recovery and post-disaster reconstruction (Qiang et al., 2020).
In exploring the application scope of the aforementioned nighttime light data, we discovered that nighttime lights are relatively mature in their ability to reflect the population and social activities. The aforementioned research focused primarily on the inversion, reasoning, and historical nighttime light data analysis. Most of the timescales were for years or months, which was reasonable for the long history of a region or country. Despite the significant changes in some areas in a short time, there are few research results on whether nighttime lights can induce inversion. In addition, the existing rules between nighttime lights and population activities, economic activities, and production activities reflect additional studies regarding the use of nighttime lights and the inversion of human social activities. However, further research was required for other levels, including emergency and the tendency of emergency inversion. In this study, we analyzed nighttime light data using empirical models and combined them with the Office of the UN High Commissioner for Refugees (UNHCR) data to develop a logistic regression model to explain population changes. Before and after the war, a quantitative analysis of dynamic spatial–temporal changes in nighttime lights and the refugee population was carried out. Ultimately, we aimed to evaluate the effectiveness of these new methods for exploring dynamic nighttime lights and refugee population changes during the war.
2 Data and methodology
2.1 Study area
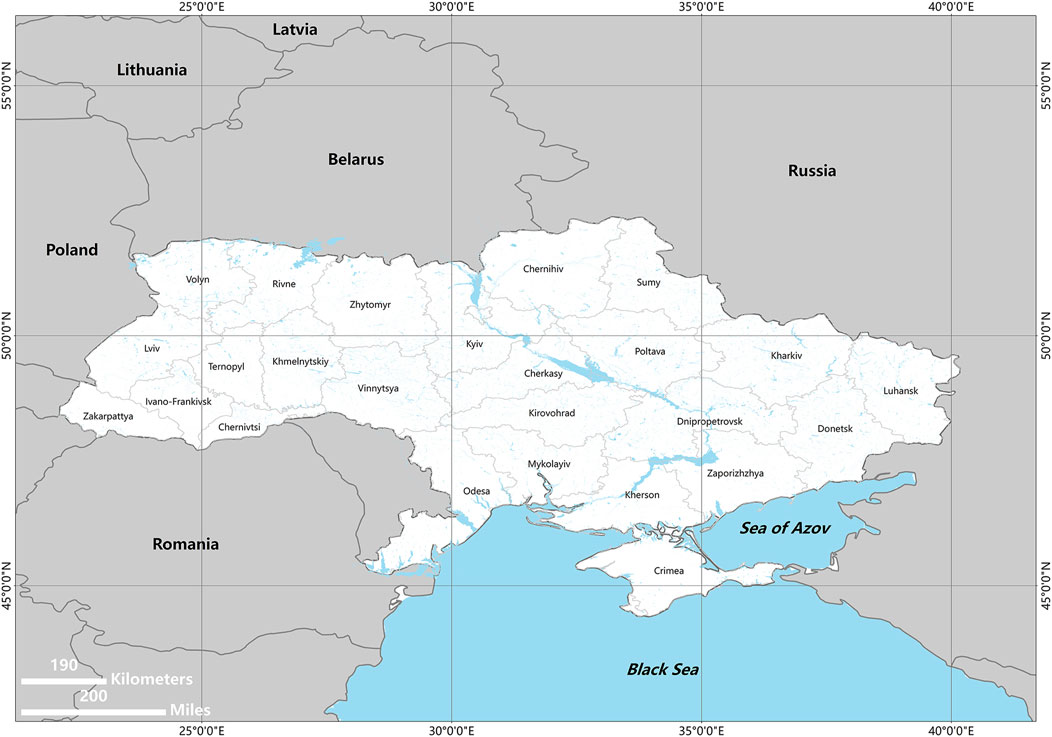
Ukraine is situated in Eastern Europe, with the Black Sea to its south, the Russian Federation to its east, Belarus to its north, and Poland, Slovakia, Hungary, and Romania to its west. With a population of 41.17 million people, the country is geographically located at the intersection of the European Union and the Commonwealth of Independent States (excluding Crimea). Ukraine’s administrative division consists of 24 regions (Figure 1), one autonomous republic, and two municipalities (UNdata, 2022). On 24 February 2022, conflict broke out between Russia and Ukraine on the grounds of the “demilitarization and de-Nazification”, and the conflict officially turned into a full-scale war on that date (CNN, 2022a; CNN, 2022b; TASS, 2022).
We intended to perform a dynamic assessment of war damages in Ukraine, and our study area encompassed the entirety of Ukraine. Considering that the conflict significantly impacted the capital, Kyiv, we chose Kyiv as a specific research objective in this study to clarify the impact before and after the war. The Crimea region was excluded from the study due to the absence of demographic statistics for these areas.
2.2 Data sources
Nighttime light data were obtained from the Day–Night Band (DNB) sensor of the VIIRS onboard the S-NPP and Joint Polar Satellite System (JPSS) satellite platforms (NASA-Suomi NPP, 2022). The DNB’s ultra-sensitive performance in low-light conditions marks a major improvement in the resolution and calibration over Defense Weather Satellite Program (DMSP)-generated nighttime light images from the previous generation (Román et al., 2018). The DNB sensor delivers global nighttime visible light data and daily measurements of near-infrared (NIR) data suited for Earth system science applications (UNdata, 2022). The Black Marble product kit (VNP46) comprises the Daily Atmosphere Sensor Top (TOA) nighttime light (NTL) product (VNP46A1) and the Daily Moonlight-adjusted nighttime light product (VNP46) (VNP46A2). Compared to VNP46A1, VNP46A2 can more realistically reverse the anthropogenic light sources on the Earth’s surface. VNP46A2 utilizes all high-quality, cloud-free, atmospheric, terrain, vegetation, snow, lunar, and stray nighttime light-corrected DN values to estimate nighttime lights and have other inherent surface optical properties (Román et al., 2018; Román et al., 2019; Román et al., 2020; Román et al., 2021). Additionally, the Black Marble product kit (VNP46) comprises the Moonlight adjustable nighttime light product (VNP46A3) and the Annual Light adjustable nighttime light product (VNP46) (VNP46A4). VNP46A3 and VNP46A4 are the abbreviated names for the third and fourth nighttime light (NTL) products, respectively, in the Black Marble suite. VNP46A3 and VNP46A4 provide monthly and yearly composites derived from daily atmospherical and lunar bi-directional reflectance distribution function (BRDF)-corrected NTL radiance to eliminate the influence of artifacts and biases. This study utilized the VNP46A2 data series (NASA-VNP46A2, 2022; NASA- VNP46A4, 2022).
The United Nations High Commissioner for Refugees (UNHCR) is a global organization dedicated to saving lives, protecting rights, and building a better future for refugees, forcibly displaced communities, and stateless people. The UNHCR provides data on refugee population border crossings from Ukraine during the war and offers daily information on the influx and departure of refugees into and out of Ukraine (https://data.unhcr.org/en/situations/ukraine). The time and location of the fight between the Russian and Ukrainian soldiers were obtained from the website global conflict tracker, an interactive guide to ongoing conflicts of concern to the United States, including background information and resources (https://www.cfr.org/global-conflict-tracker).
2.3 Data preprocessing
For the nighttime light data on VNP46A2 and VNP46A4, we initially employed a Python encoding technique to obtain the ‘gap-filled BRDF-corrected DNB NTL’ and ‘Temporal Radiance Composite Using All Observations During Snow-free Period’ layers, respectively. Then, using visual contrast interpretation, we found the dates for which complete data were available in the daily Ukrainian night light data. Finally, these data were converted into a raster format with a unit of nWatts/cm/sr, and the georeference coordinate was WGS 1984. Moreover, we compiled daily values of VNP46A2 into weekly and monthly data (Román et al., 2020). Then, 10 weeks before (16 December 2021 to 23 February 2022) and after (24 February 2022 to 2 May 2022) the beginning of the Russian–Ukrainian War, the obtained nighttime light images were combined. Additionally, we collected nighttime light data (VNP46A4) from 2012 to 2021 for a long-term nighttime light trend analysis.
On the auxiliary data side, we used Python encoding to convert the obtained UNHCR data from XML to CSV, making it easier to analyze. In addition, we utilized visual interpretation to track sites of daily battles in the Russian–Ukrainian War and used GIS tools to organize the time and position of the matches mentioned previously into data tables.
2.4 Methodology
2.4.1 Calculation of the total nighttime lights DN value
In this study, we employed the digital number value (DN value) of nighttime lights, which referred to the digital grayscale reflection of the brightness of surface nighttime lights on the image grid. The nighttime light DN value is usually a comprehensive indicator of a region’s socioeconomic development level. A higher DN value suggests a higher degree of regional development and vice versa. We introduced a yearly average DN value of nighttime lights, the sum of the daily average DN values of nighttime lights in the area. The changes in the yearly average DN values of the annual nighttime lights can be used to characterize the evolution of an area over several years (Chen et al., 2003; Zhuo et al., 2003). The average DN value of nighttime lights is expressed as follows:
where
2.4.2 Analysis of the trend of nighttime lights
We used the Theil–Sen estimator and the M-K test to calculate the trend of changes in image DN values during peacetime and war in Ukraine. The Theil–Sen estimator is a robust linear regression method that selects the median slope across all lines using two-dimensional sample pairs. Compared to the trend analysis based on the least squares method, the Theil–Sen estimator can avoid the lack of time series data and the influence of data distribution on the analysis results, eliminate the interference of outliers on the time series, and be used to identify trends in the univariate time series (Burn and Elnur, 2002; Wang et al., 2020).
In the formula,
The statistics for constructing trend analysis tests are as follows:
In the formula,
Due to the unstable and complicated changes in all aspects of society throughout the war, months may not be the optimum unit of time to describe variations in nighttime lights, population, and economic activities. For analysis purposes, we composited the daily nighttime light data into weekly data. We selected the period between 16 December 2021 and 4 May 2022, 10 weeks before and 10 weeks after the start of the war, for a total of 20 weeks of nighttime light data. In addition, we combined the daily nighttime light data based on an analysis of the nighttime light change trend to compare the trend of the nighttime light 10 weeks from the start of the war (2022.2.24 to 2022.5.4) with nighttime light trends during peacetime for 10 weeks (2021.12.16 to 2021.2.23).
2.4.3 Verification of the reliability of the nighttime light-driven model
This study used the Nash–Sutcliffe efficiency index (NSE) and R square (R2) to verify the model’s reliability. The NSE is a widely used and potentially reliable statistic for assessing the model’s goodness of fit (Schaefli and Gupta, 2007; Moriasi et al., 2007). R2 indicates the degree to which the data fit the regression model (the goodness of fit). The data on Ukrainian nighttime lights and refugee population from 24 February 2022 (the beginning of the war) to 2 May 2022 were processed by a statistical distribution fitting and was confirmed to satisfy a normal distribution. Then, for modeling purposes, we utilized the Ukrainian domestic nighttime light data and refugee population data for this period. In addition, we used 50% of the nighttime light data and refugee population data for modeling analyses and the remaining 50% for model accuracy verification.
In the formula,
The variation range of the NSE is from −∞ to 1. When the NSE calculation result is 1, the observed value is the same as the simulated value; if the NSE is between 0.5 and 1, it means that the model result is acceptable, and when the NSE result is less than 0, it is considered that the model reliability is poor.
3 Results
3.1 Nighttime light trends in Ukraine
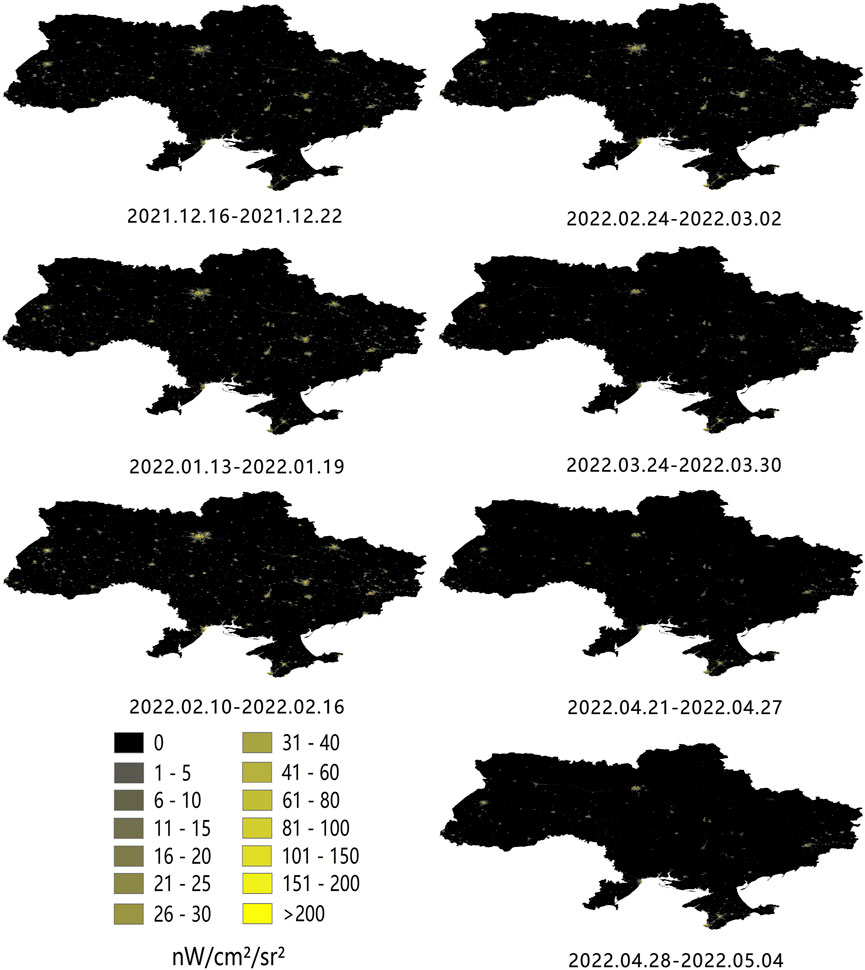
Figure 2 depicts the nighttime light area and DN value distribution in Ukraine in the 10 weeks before and after the outbreak of the Russian−Ukrainian War (16 December 2021 to 4 May 2022). Ten weeks before the start of the war, the nighttime lights in Ukraine were stable on a national scale. The range of nighttime lights fluctuated but altered little. In the first week following the outbreak of war, the national nighttime light area was reduced by 50% (Figure 3A) (24 February 2022 to 2 March 2022). In the following weeks, the national nighttime light area hovered at 50% of its pre-war level (3 March 2022 to 4 May 2022). The fifth week following the start of the conflict was the darkest in Ukraine, and the nighttime light area was almost 75% smaller than that before the war, indicating that the war caused significant damage to Ukraine in a short amount of time. In addition, after the start of the conflict, the average nighttime light DN value, maximum nighttime light DN value, and total nighttime light DN value decreased dramatically throughout the country (Figures 3A, B). In Ukraine, the highest nighttime light DN value and total nighttime light DN value were lowered by more than 90% than the week before and after the war. The change in nighttime lights demonstrated that the conflict affected the quantity and quality of nighttime lights in Ukraine.
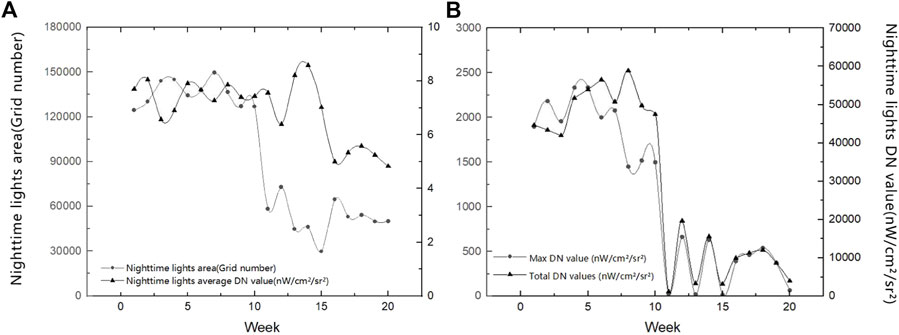
FIGURE 3. Weekly nighttime lights area trends (A) and nighttime lights DN value changes (B) in Ukraine from 16 December 2021 to 2 May 2022.
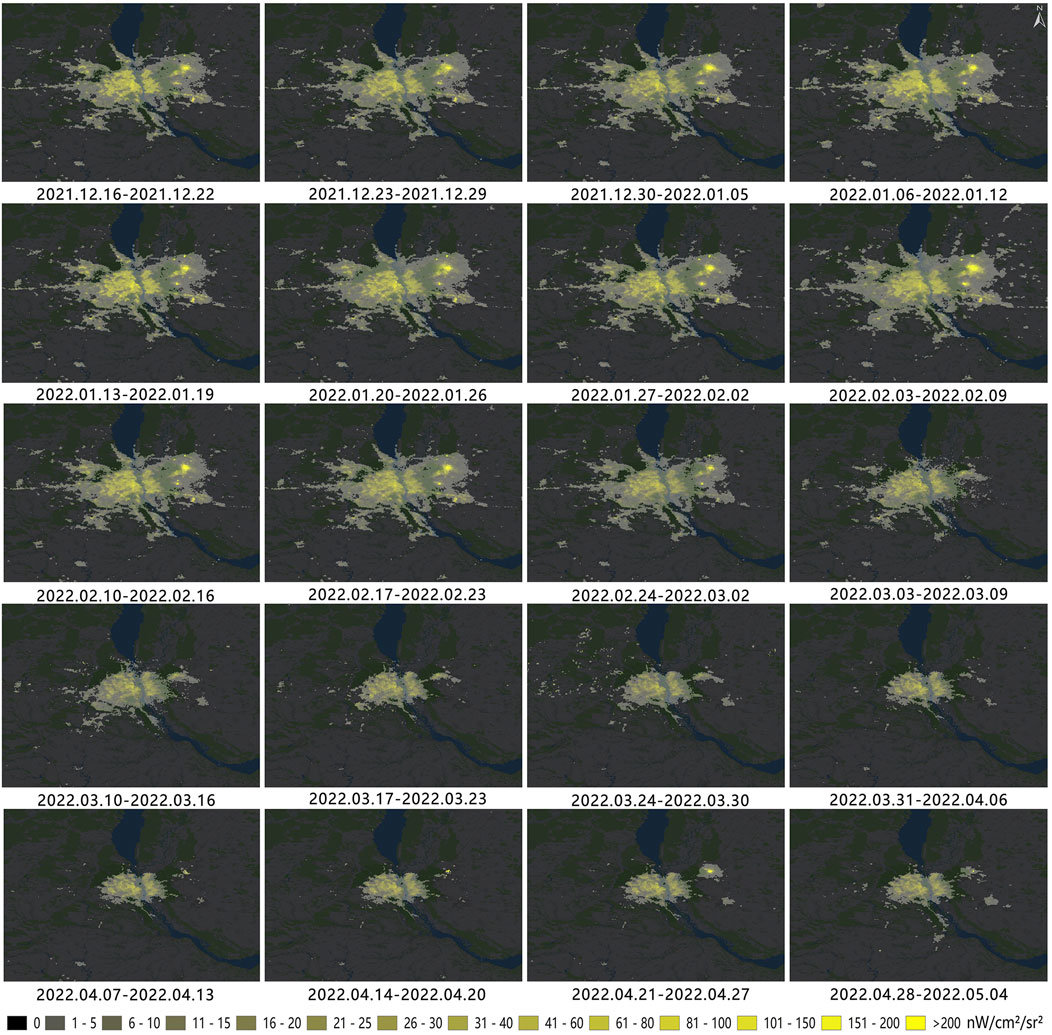
The changing map of nighttime lights provided a more concrete depiction of the oblast- and city-scale destruction wrought by the war in Ukraine. Based on the area of nighttime lights and the average DN value, we discovered that all oblasts had a substantial decline in the area and DN value during the first week of the war. In the weeks that followed, the nighttime lights exhibited low-value fluctuations much below pre-war values (Figure 4). From a spatial perspective, the city and oblast with the greatest reduction in the nighttime light area were the capital Kyiv (Figure 5), Cherkasy oblast in the center, Kyiv oblast, Donetsk oblast, Sumy oblast, and Ternopil oblast in the west, and these oblasts and cities had 50% fewer nighttime lights than before the war. In addition, the average nighttime light DN value changed, which indicates the quality of nighttime lights varied dramatically by oblasts, decreasing significantly in Donetsk and Sum oblasts in the east and Ternopil Oblast in the west. However, certain oblasts, including Luhansk, Zakarpattia, and Kherson, experienced few modifications, which might be because nighttime lights in these places did not meet high standards before the war.
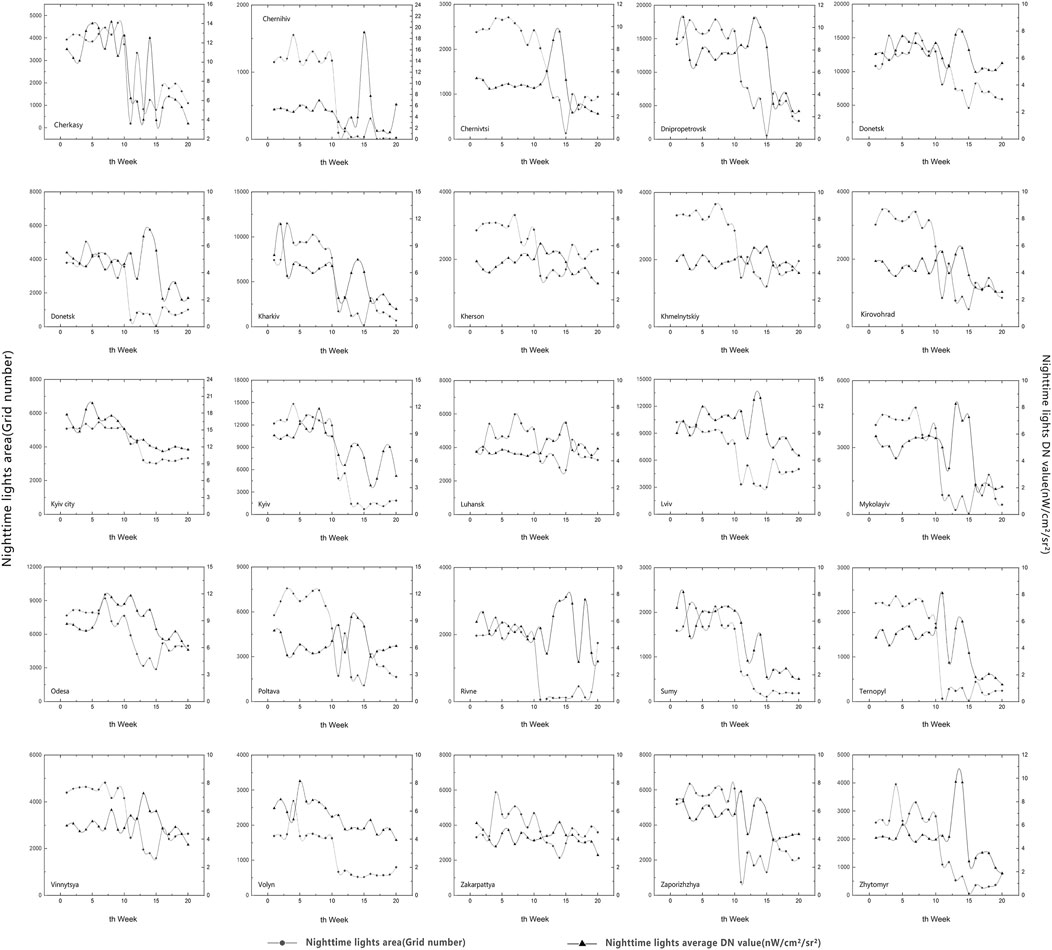
FIGURE 4. Weekly analysis of nighttime light trends in all oblasts of Ukraine (2021.12.16–2022.5.2).
Changes in the nighttime light area and nighttime light DN value indicated a gradual disappearance from the city’s periphery to the center of the town. The DN value of the city’s central district’s nighttime lights decreased from a high value to a low value (Figure 5). Changes in the city’s nighttime lights revealed the war’s spatial–temporal impact on the operation and vibrancy of the city.
In addition, to scientifically reflect the changes in nighttime lights in Ukraine during the Russian–Ukrainian War, we presented the nighttime light data from consecutive years in peacetime and conducted trend analyses in conjunction with nighttime light data of the war. We performed a trend analysis on the monthly nighttime light data from 2012 to 2021 (combined daily data) and wartime nighttime light data. We discovered that the nighttime light area of the entire nation had fallen marginally, particularly in the central and eastern parts. During the 10 years between 2012 and 2021, the DN value of nighttime lights increased or decreased dramatically in some regions (Figure 6A). During the conflict period from February 24th to 2 May 2022, however, the nighttime light area across the nation reduced drastically and on a wide scale. Similarly, the light intensity gradually decreased (Figure 6B).

FIGURE 6. Comparison of the nighttime light DN value and area change from 2012 to 2021 (A) and from February 24 to 2 May 2022 (B).
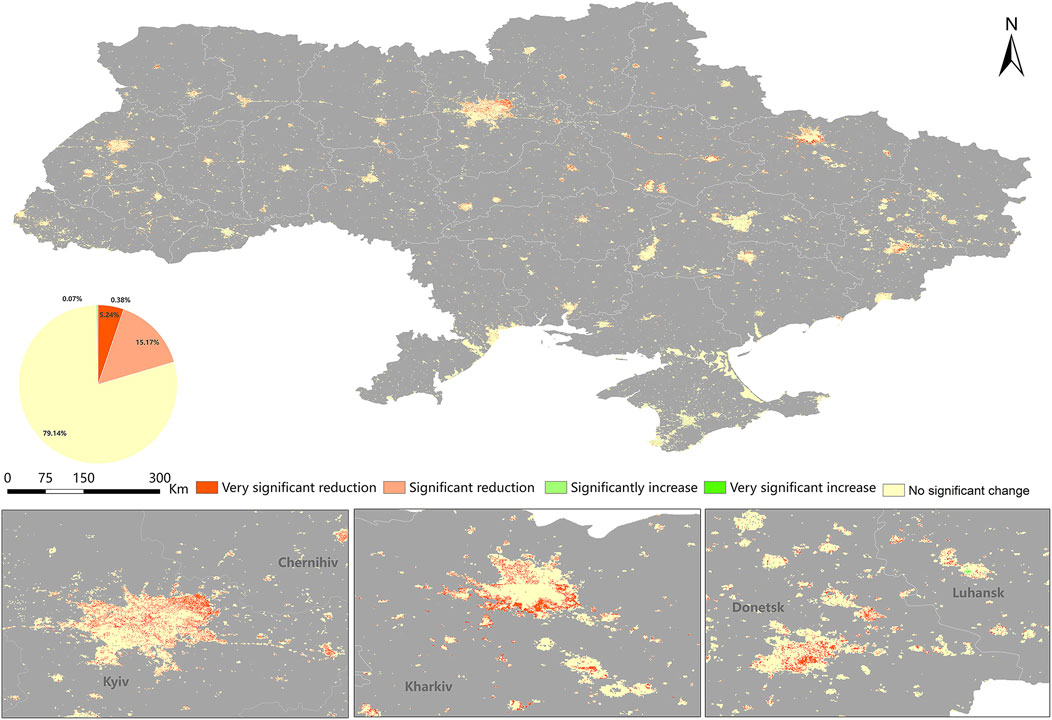
Since nighttime lights did not fluctuate significantly during times of peace, we investigated the short-term trend of nighttime lights in the country using data from 10 weeks before and after the start of the conflict. Using the Theil–Sen estimator and the M-K test, the trend of DN values at the pixel scale was analyzed. We found a significant reduction in the nighttime light DN value, which accounted for 5.24%, the severely reduced nighttime lights accounted for 15.17%, and only 0.45% of the region grew enormously. The remaining areas, which comprised 79.14%, exhibited little change (Figure 7).
From February 24 to May 2, nighttime lights showed a noticeable reduction, particularly in the capital Kyiv and built-up areas around it. Other oblasts, particularly Kharkiv and Donetsk in the east, saw a decrease in nighttime lights. The middle and western regions, where fighting and strife were less frequent and severe, had a less significant impact on nighttime lights than the eastern region. In addition, there was the periodic dimming of nighttime lights in areas where there was no fighting, which may have been caused by a power supply gap or artificial dimming.
3.2 Refugee population trends in Ukraine
We examined both variables based on the preceding findings, which indicated a general downward tendency in nighttime light changes in Ukraine and an upward trend in the UNHCR-registered refugee population data throughout the same period. The refugee population dataset registered by the UNHCR corresponded to a normal distribution, with a strong association coefficient (−0.89) with nighttime lights of Ukraine for the same period, as determined by the statistical distribution fitting. Then, we fit the data on nighttime lights and refugee populations. We analyzed the data trend changes using linear, polynomial, exponential, and S-shaped functions and determined that the S-shaped function was the most acceptable match. After multiple attempts, we decided that the logistic equation employed for the fit was the most appropriate in terms of the goodness-of-fit and statistical significance. As depicted in Figure 8A, the logistic equation was utilized to fit nighttime light data and refugee population registration data in order to generate a model for the final calculation of the registered refugee population using the total nighttime light DN value. The model was expressed as y = 3684039.53/{1 + exp[−1.19E-5*(x-584851.5)]}, where y was the refugee population registered on a specific day; x was the total nighttime light DN value of the Ukrainian nightlight on the same day; the goodness-of-fit of the model was 0.69, and the model was significant at the level of 0.05. In addition, the NSE of the model reached 0.78, indicating that the reliability of the model was acceptable and that the simulated values of the model were well correlated with the observed values. The comparison between the simulated and observed results is shown in Figure 8B.
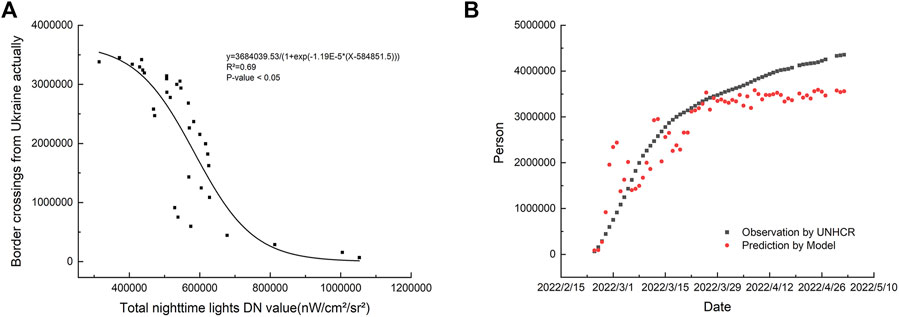
FIGURE 8. Relation between the refugee population and the total nighttime light DN value (A); validation of the model of migration and nighttime lights using the UNHCR data (B).
From the aforementioned results, we found that the decrease in the total nighttime light DN value was mainly due to the decline in the area of nighttime lights and the reduction in the average nighttime light DN value. We utilized the daily nighttime light area and the average nighttime light DN value to examine the association between refugee population levels and nighttime lights. The correlation coefficient between the registered refugee population and area of nighttime lights was −0.52, and the correlation relationship with the average DN value of nighttime lights was −0.53. However, because the total nighttime light DN value is a product of the average DN value and area, we concluded that the effect of the location of nighttime lights and the average nighttime light DN value on the change in the refugee population were almost the same. Based on this consideration, we classify the changes in the DN value and nighttime light area before and after the conflict by Jenks Natural Breaks Classification (Chen et al., 2013); the classification situation is depicted in Table 1.
From Table 1, we calculated the weekly change in the refugee population after the war began, as depicted in Figure 9. After the war started, the refugee population increased significantly in the 2nd, 5th, and 8th weeks and increased slightly in the 1st, 3rd, 6th, and 9th weeks. The 4th and 7th weeks saw minimal variations from the previous week. The refugee population demonstrates a cyclical variation over 3 weeks, with a “low-high-low” trend, as depicted in Figure 8.
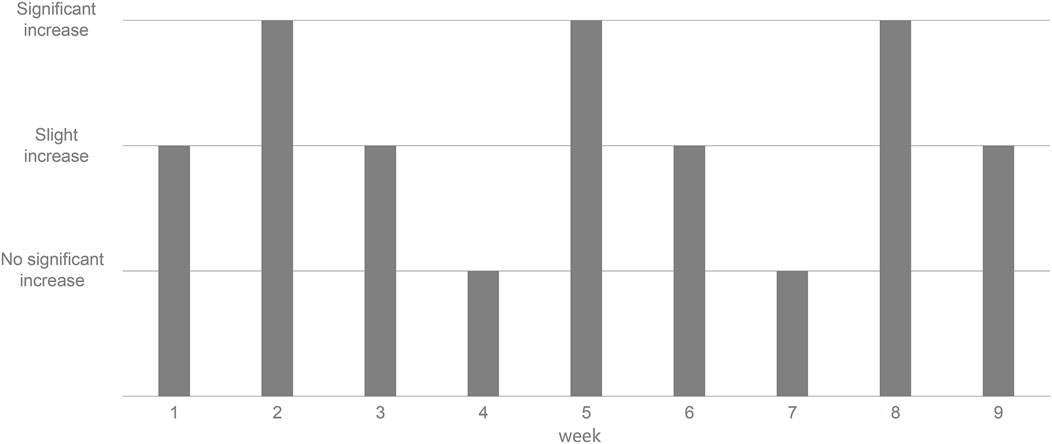
FIGURE 9. Trends in the refugee population by the grade within 9 weeks after the beginning of the war.
4 Discussion
4.1 Relationship between nighttime lights and conflicts
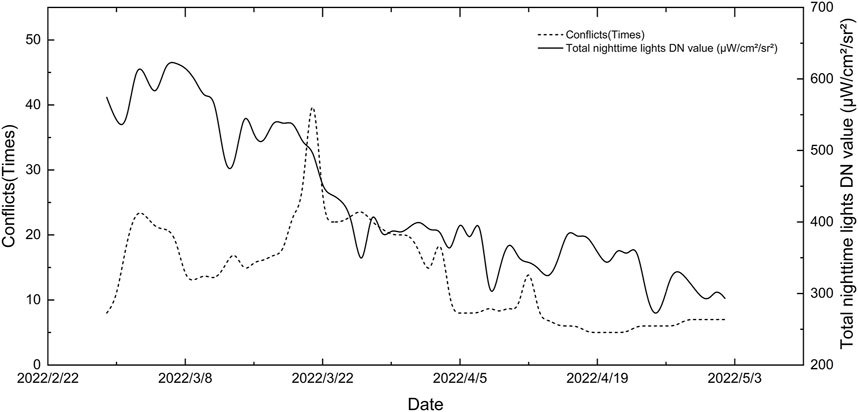
Based on the aforementioned analytical findings, it is certain that war conflicts have contributed to the decline of the light. Consequently, we considered analyzing and discussing nightlights and frequency of military conflicts throughout the same period. However, we compared the total intensity of nighttime lights and frequency of national disputes using a time series. We found that when the number of conflicts decreased, the fluctuation degree of the overall nighttime light intensity gradually reduced. Yet, the two trends were not entirely congruent (Figure 10), considering that the disappearance of nighttime lights was varied. The times of wars and conflicts were only a vague concept. It was challenging to gather and quantify additional information, such as the scope of disputes, their severity, their duration, and their subsequent consequences. Changing the number of conflicts made it impossible to adequately assess the relationship between the two variables.
Although it was difficult to quantify the precise relationship between nighttime lights and the number of conflicts, the overall trend was consistent. As a result, we would continue our discussion based on the general trend relationship between the two concepts. We considered that as the war proceeded, the country’s nighttime lights would grow dimmer, symbolizing the immense damage caused by the conflict. Furthermore, across the nation, the frequency of conflict was not connected with the disappearance of the total nighttime light DN value, indicating that observing the nighttime light conditions was not an effective way to determine the conflict situation in the area. Nonetheless, hostilities may erupt on other battlefields or at different scales, and the statistical analysis results may be vastly different; hence, the inferences require additional research. These estimates are useful as reference values and can be used to compare war losses, but more supplementary data are necessary to determine the extent of war damage.
4.2 Relationship between nighttime lights and refugees
Almost no research has been conducted on the correlation between nighttime lights and the movement of war refugees. Actual and reliable statistics are used to determine whether nighttime lights reflect the trend of the refugee population. This study’s data were derived from the United Nations Refugee Agency’s daily statistics to depict the refugee population’s flow accurately. We eventually evaluated and adopted the logistic equation to construct the model of nighttime lights and refugee population fluctuations. Due to the high upper limit of nighttime light data, the changes were quite adaptable. However, the refugee population will not continue to expand indefinitely. Consequently, as the total nighttime light DN value grows in a linear regression equation, the convergence is problematic and the model fails. A more precise expression, such as the logarithm or multiple linear regression equation, is required for a broader perspective. Still, more supplementary data may be necessary to develop these equations and confirm the model’s validity. This study employed a brief and continuous training data time series. The relationship between the refugee population and nighttime light data in Ukraine is reasonably basic and linear. It is impossible to estimate how long the current war situation in local conflicts will persist. However, based on the actual refugee population statistics and nighttime light inversion, the regression model developed for this study can achieve the research objectives.
We discussed the two situations according to the changing trend of nighttime lights and the refugee population, suppose the war continues in its current state. In this instance, the nighttime light area of Ukraine will continue to diminish in the original region, as will the average DN value of nighttime lights. According to our research, the fading of nighttime lights indicates a progressive transition from the city’s periphery to its center. The average DN value of the city center’s evening lighting gradually declines. Based on nighttime lights and the refugee population model, our analysis reveals that the refugee population continues to grow, with the majority originating from urban areas. However, it is based on the assumption that the war commences or concludes. In that circumstance, the refugee population and nighttime lights will depict a different state. Then, this study’s refugee population calculation model driven by nighttime light data may no longer be applicable.
4.3 A depiction of the war by nighttime lights
The nighttime light is an inversion of the behavior and scope of human activity, just as a war is an abnormal and unpredictable act initiated by humans. Consequently, a relationship exists between the two. Li used the DMSP/OLS and VIIRS monthly composites to illustrate the variations in nighttime lights in Syria and Iraq during the war (Li et al., 2017; Li et al., 2018). The study indicates a rule that the war quickly destroys a country’s nighttime lights, but post-war reconstruction allows nighttime lights to return gradually. As detailed previously, this circumstance also occurred in Ukraine, although the war between Russia and Ukraine remains in a stalemate. Furthermore, our simulations show that more nighttime lights in Ukraine will disappear as the war continues. Whether in Ukraine, Syria, or Iraq, the fact that the war may quickly extinguish nighttime lights holds true. The disappearance of nighttime lights also indicates changes in the spatial and temporal dimensions of the war. The timescale of nighttime lights employed by Li et al. in the Iraqi and Syrian wars was a month. In contrast, we used a week, which more accurately reflects the severity and brutality of the war and sensitivity of nighttime lights to the war. Furthermore, modeling, which employs weekly nighttime light data and refugee populations, followed by simulations of refugee population movements, can provide timely humanitarian assistance under specific circumstances and on finer timescales. Overall, nighttime lights offer an approximation of the extent and course of the war’s impacts, but they are insufficient to adequately depict their particulars.
5 Conclusion
In this study, the refugee population and multi-day nighttime light data were used for mathematical modeling, and then, daily nighttime light data were compiled and analyzed. Before and after the beginning of the Russian–Ukrainian War, nighttime lights in Ukraine changed, and the refugee population changed as follows:
1) In the first week following the start of the war, the nighttime light area and average nighttime light DN value in Ukraine exhibited a sharp downward trend. The rate of decline then slowed. The changes in nighttime lights were especially pronounced in and around Kyiv and the northern and eastern regions.
2) During the first week, the refugee population in Ukraine increased the most, followed by a gradual decrease. After the start of the war, the refugee population shifted cyclically, exhibiting a “low–high–low” pattern. From the central and eastern regions poured an influx of displaced people. If the war continues, the number of refugees will continue to rise.
3) Following the outbreak of war, the Ukrainian state and society suffered a sudden decline, which was reflected in the alteration of nighttime lights. Affected by the transit time and other ground factors, night lights may not always reflect the actual status of the population and society; hence, assessing war losses based on nighttime lights may necessitate additional supplementary data for an accurate assessment.
Using nighttime light data to model the dynamic estimation of the changes in the refugee population of Ukraine during the war is crucial for calculating human losses in Ukraine and the subsequent supply of international humanitarian aid and post-war rehabilitation under the current war conditions.
Data availability statement
Publicly available datasets were analyzed in this study. These data can be found at: https://ladsweb.modaps.eosdis.nasa.gov/missions-and-measurements/products/VNP46A4/.
Author contributions
SH and CH conceived and supervised the research topic. CH and SH proposed the methods. CH and HZ processed the data. CH, HY, and YZ analyzed the results. CH, HY, XN, and QW wrote the manuscript.
Funding
This work was supported by the Project of Philosophy and Social Science Research of Colleges and Universities in Hubei Province (grant number 21G010).
Acknowledgments
The authors would like to thank the staff and scientists at NASA for providing the VIIRS−NPP data. The authors would like to appreciate the UNHCR and the Organization of the Global Conflict Tracker. They would also like to thank Liyuan Wei, Tingting Cui, and Lu Yang for providing some ideas about nighttime lights.
Conflict of interest
The authors declare that the research was conducted in the absence of any commercial or financial relationships that could be construed as a potential conflict of interest.
Publisher’s note
All claims expressed in this article are solely those of the authors and do not necessarily represent those of their affiliated organizations, or those of the publisher, the editors, and the reviewers. Any product that may be evaluated in this article, or claim that may be made by its manufacturer, is not guaranteed or endorsed by the publisher.
References
Aljazeera (2022). Ukraine latest updates: UN says 6.5m displaced inside Ukraine. Available from: https://www.aljazeera.com/news/2022/3/17/un-says-more-than-700-civilians-killed-ukraine-liveblog (Accessed 04 10, 22).
BBC (2022). Broadcasting company. Available from: https://www.bbc.com/news/world-europe-60506682 (Accessed 03 01, 22).
Burn, D. H., and Elnur, M. H. (2002). Detection of hydrologic trends and variability. J. Hydrology 255 (1/4), 107–122. doi:10.1016/s0022-1694(01)00514-5
CBC (2022). UN says Ukraine's civilian deaths are being underestimated and the true number may never be known. Available from: https://www.cbc.ca/news/politics/civilian-deaths-ukraine-accurate-numbers-1.6404174. (accessed 04.03.22)
Chen, J., Yang, S. T., Li, H. W., Zhang, B., and Lv, J. R. (2013). Research on geographical environment unit division based on the method of natural Breaks (Jenks). Spat. Inf. Sci. 3, 47–50. doi:10.5194/isprsarchives-xl-4-w3-47-2013
Chen, J., Zhuo, L., Shi, P.-J., and Toshiaki, I. (2003). The study on urbanization process in China based on DMSP/OLS data: Development of a light index for urbanization level estimation. J. REMOTE SENSING-BEIJING- 7, 168–175.
Chen, X., and Nordhaus, W. D. (2011). Using luminosity data as a proxy for economic statistics. Proc. Natl. Acad. Sci. U. S. A. 108, 8589–8594. doi:10.1073/pnas.1017031108
CNN (2022a). CNN(Ukraine-satellite-images). Available from: https://edition.cnn.com/interactive/2022/03/world/ukraine-satellite-images/ (Accessed 03 01, 22).
CNN (2022b). What does putin want in Ukraine? The conflict explained. Available from: https://edition.cnn.com/2022/02/24/europe/ukraine-russia-conflict-explainer-2-cmd-intl/index.html (Accessed 04 28, 22).
Croft, T. A. (1978). Nighttime images of the Earth from space. Sci. Am. 239, 86–98. doi:10.1038/scientificamerican0778-86
Deren, L., and Xi, L. (2015). An overview on data mining of nighttime light remote sensing. Acta Geod. Cartogr. Sinica 44 (6), 591–601. doi:10.11947/j.AGCS.2015.20150149
Duque, J. C., Lozano-Gracia, N., Patino, J. E., Restrepo, P., and Velasquez, W. A. (2019). Spatiotemporal dynamics of urban growth in Latin American cities: An analysis using nighttime light imagery. Landsc. Urban Plan. 191, 103640. doi:10.1016/j.landurbplan.2019.103640
Guardian (2022). Ukraine economy to shrink by almost half this year, World Bank forecasts. Available from: https://www.theguardian.com/business/2022/apr/10/ukraine-economy-gdp-russia-invasion-world-bank-forecast (Accessed 03 23, 22).
Imhoff, M. L., Lawrence, W. T., Elvidge, C. D., Paul, T., Levine, E., and Privalsky, M. V. (1997). Using nighttime DMSP/OLS images of city lights to estimate the impact of urban land use on soil resources in the United States. Remote Sens. Environ. 59, 105–117. doi:10.1016/s0034-4257(96)00110-1
Li, X., Li, D. R., Xu, H. M., and Wu, C. Q. (2017). Intercalibration between DMSP/OLS and VIIRS nighttime light images to evaluate city light dynamics of Syria's major human settlement during Syrian Civil War. Int. J. Remote Sens. 38, 5934–5951. doi:10.1080/01431161.2017.1331476
Li, X., Liu, S. S., Jendryke, M., Li, D. R., and Wu, C. Q. (2018). Night-time light dynamics during the Iraqi civil war. Remote Sens. 10, 858. doi:10.3390/rs10060858
Liu, Z. F., He, C. Y., Zhang, Q. F., Huang, Q. X., and Yang, Y. (2012). Extracting the dynamics of urban expansion in China using DMSP-OLS nighttime light data from 1992 to 2008. Landsc. Urban Plan. 106, 62–72. doi:10.1016/j.landurbplan.2012.02.013
Lo, C. P. (2001). Modeling the population of China using DMSP operational linescan system nighttime data. Photogrammetric Eng. Remote Sens. 67, 1037–1047.
Moriasi, D. N., Arnold, J. G., Van Liew, M. W., Bingner, R. L., Harmel, R. D., and Veith, T. L. (2007). Model evaluation guidelines for systematic quantification of accuracy in watershed simulations. Trans. ASABE 50.3, 885–900. doi:10.13031/2013.23153
NASA-Suomi NPP (2022). Suomi NPP. Available from: https://www.nasa.gov/mission_pages/NPP/main/index.html (Accessed 04 08, 22).
NASA-VNP46A2 (2022). VNP46A2. Available from: https://ladsweb.modaps.eosdis.nasa.gov/missions-and-measurements/products/VNP46A2/ (Accessed 04 30, 22).
NASA-VNP46A4 (2022). VNP46A4. Available from: https://ladsweb.modaps.eosdis.nasa.gov/missions-and-measurements/products/VNP46A4/ (Accessed 04 08, 22).
NPR (2022). Russia's war could shrink the Ukrainian economy by 45% this year, the World Bank says.Available from: https://www.npr.org/2022/04/11/1092032051/russia-war-shrink-ukraine–economy-world-bank (Accessed 04 11, 22).
Qiang, Y., Huang, Q. X., and Xu, J. W. (2020). Observing community resilience from space: Using nighttime lights to model economic disturbance and recovery pattern in natural disaster. Sustain. Cities Soc. 57, 102115. doi:10.1016/j.scs.2020.102115
Román, M. O., Wang, Z., Shrestha, R., Yao, T., and Kalb, V. (2019). Black Marble user guide version 1.0. Washington, DC, USA: NASA.
Román, M. O., Wang, Z., Shrestha, R., Yao, T., and Kalb, V. (2020). Black Marble user guide version 1.1. Washington, DC, USA: NASA.
Román, M. O., Wang, Z., Shrestha, R., Yao, T., and Kalb, V. (2021). Black Marble user guide version 1.2. Washington, DC, USA: NASA.
Román, M. O., Wang, Z., Sun, Q., Kalb, V., Miller, S. D., Molthan, A., et al. (2018). NASA's Black Marble nighttime lights product suite. Remote Sens. Environ. 210, 113–143. doi:10.1016/j.rse.2018.03.017
Schaefli, B., and Gupta, H. V. (2007). Do Nash values have value? Hydrol. Process. 21, 2075–2080. doi:10.1002/hyp.6825
Shi, K. F., Yu, B. L., Huang, Y. X., Hu, Y. J., Yin, B., Chen, Z. Q., et al. (2014). Evaluating the ability of NPP-VIIRS nighttime light data to estimate the gross domestic product and the electric power consumption of China at multiple scales: A comparison with DMSP-OLS data. Remote Sens. 6, 1705–1724. doi:10.3390/rs6021705
Stokes, E. C., and Seto, K. C. (2019). Characterizing urban infrastructural transitions for the Sustainable Development Goals using multi-temporal land, population, and nighttime light data. Remote Sens. Environ. 234, 111430. doi:10.1016/j.rse.2019.111430
Sutton, P., Roberts, C., Elvidge, C., and Meij, H. (1997). A comparison of nighttime satellite imagery and population density for the continental United States. Photogrammetric Eng. Remote Sens. 63, 1303–1313.
TASS(MILITARY OPERATION IN UKRAINE) (2022). Putin declares beginning of military operation in Ukraine. Available from: https://tass.com/politics/1409329 (Accessed 02 24, 22).
UN News (2022). Ukraine. Available from: https://news.un.org/en/focus/ukraine (Accessed 04 05, 22).
UNdata (2022). Ukraine–Country profile. Available from: http://data.un.org/Search.aspx?q=ukraine (Accessed 04 26, 22).
Wang, Y. W., Yue, H. B., Peng, Q., He, C., Hong, S., and Bryan, B. A. (2020). Recent responses of grassland net primary productivity to climatic and anthropogenic factors in Kyrgyzstan. Land Degrad. Dev. 31, 2490–2506. doi:10.1002/ldr.3623
Wu, K., and Wang, X. N. (2019). Aligning pixel values of DMSP and VIIRS nighttime light images to evaluate urban dynamics. Remote Sens. 11, 1463. doi:10.3390/rs11121463
Zhang, Q. L., and Seto, K. C. (2011). Mapping urbanization dynamics at regional and global scales using multi-temporal DMSP/OLS nighttime light data. Remote Sens. Environ. 115, 2320–2329. doi:10.1016/j.rse.2011.04.032
Zhao, M., Cheng, W. M., Zhou, C. H., Li, M. C., Wang, N., and Liu, Q. Y. (2017). GDP spatialization and economic differences in south China based on NPP-VIIRS nighttime light imagery. Remote Sens. 9, 673. doi:10.3390/rs9070673
Zhao, M., Zhou, Y. Y., Li, X. C., Cao, W. T., He, C. Y., Yu, B. L., et al. (2019). Applications of satellite remote sensing of nighttime light observations: Advances, challenges, and perspectives. Remote Sens. 11, 1971. doi:10.3390/rs11171971
Keywords: nighttime lights, Russian–Ukrainian War, refugee population, mapping, spatio–temporal
Citation: Huang C, Hong S, Niu X, Wu Q, Zhong Y, Yang H and Zhang H (2023) Mapping of nighttime light trends and refugee population changes in Ukraine during the Russian–Ukrainian War. Front. Environ. Sci. 11:1055100. doi: 10.3389/fenvs.2023.1055100
Received: 27 September 2022; Accepted: 06 January 2023;
Published: 23 January 2023.
Edited by:
Ying Jing, Zhejiang University, ChinaReviewed by:
Hao Jiang, Guangzhou Institute of Geography, ChinaQingsong He, Huazhong University of Science and Technology, China
Jinzhu Wang, Deakin University, Australia
Copyright © 2023 Huang, Hong, Niu, Wu, Zhong, Yang and Zhang. This is an open-access article distributed under the terms of the Creative Commons Attribution License (CC BY). The use, distribution or reproduction in other forums is permitted, provided the original author(s) and the copyright owner(s) are credited and that the original publication in this journal is cited, in accordance with accepted academic practice. No use, distribution or reproduction is permitted which does not comply with these terms.
*Correspondence: Song Hong, c29uZ2hvbmdwa3VAMTI2LmNvbQ==
 Chaoqing Huang
 Song Hong
 Xiaoxiao Niu1
 Haoran Zhang