 Charles J. Vörösmarty1,2,3*
 Jerry M. Melillo4
 Donald J. Wuebbles5
 Atul K. Jain5
 Amy W. Ando6
 Mengye Chen7
 Seth Tuler8,9
 Richard Smith10
 David Kicklighter4
 Fabio Corsi1,2
 Balazs Fekete
 Ariel Miara1
 Hussain H. Bokhari1
 Joseph. Chang6
 Tzu-Shun Lin5
 Nico Maxfield1,3
 Swarnali Sanyal5
 Jiaqi Zhang7
- 1Environmental Sciences Initiative, Advanced Science Research Center, Graduate Center, City University of New York, New York, NY, United States
- 2Department of Civil Engineering, The City College of New York, New York, NY, United States
- 3Department of Earth and Environmental Sciences, Graduate Center, New York, NY, United States
- 4The Ecosystems Center, Marine Biological Laboratory, Woods Hole, MA, United States
- 5Department of Atmospheric Sciences, University of Illinois Urbana-Champaign, Urbana, IL, United States
- 6Department of Agricultural and Consumer Economics, University of Illinois Urbana-Champaign, IL, Urbana, United States
- 7Hydrometeorology and Remote Sensing Laboratory, University of Oklahoma, Norman, OK, United States
- 8Social and Environmental Research Institute, Northampton, MA, United States
- 9Worcester Polytechnic Institute, Worcester, MA, United States
- 10United States Geological Survey, National Water Quality Assessment Program, Reston, VA, United States
Change to global climate, including both its progressive character and episodic extremes, constitutes a critical societal challenge. We apply here a framework to analyze Climate-induced Extremes on the Food, Energy, Water System Nexus (C-FEWS), with particular emphasis on the roles and sensitivities of traditionally-engineered (TEI) and nature-based (NBI) infrastructures. The rationale and technical specifications for the overall C-FEWS framework, its component models and supporting datasets are detailed in an accompanying paper (Vörösmarty et al., this issue). We report here on initial results produced by applying this framework in two important macro-regions of the United States (Northeast, NE; Midwest, MW), where major decisions affecting global food production, biofuels, energy security and pollution abatement require critical scientific support. We present the essential FEWS-related hypotheses that organize our work with an overview of the methodologies and experimental designs applied. We report on initial C-FEWS framework results using five emblematic studies that highlight how various combinations of climate sensitivities, TEI-NBI deployments, technology, and environmental management have determined regional FEWS performance over a historical time period (1980–2019). Despite their relative simplicity, these initial scenario experiments yielded important insights. We found that FEWS performance was impacted by climate stress, but the sensitivity was strongly modified by technology choices applied to both ecosystems (e.g., cropland production using new cultivars) and engineered systems (e.g., thermoelectricity from different fuels and cooling types). We tabulated strong legacy effects stemming from decisions on managing NBI (e.g., multi-decade land conversions that limit long-term carbon sequestration). The framework also enabled us to reveal how broad-scale policies aimed at a particular net benefit can result in unintended and potentially negative consequences. For example, tradeoff modeling experiments identified the regional importance of TEI in the form wastewater treatment and NBI via aquatic self-purification. This finding, in turn, could be used to guide potential investments in point and/or non-point source water pollution control. Another example used a reduced complexity model to demonstrate a FEWS tradeoff in the context of water supply, electricity production, and thermal pollution. Such results demonstrated the importance of TEI and NBI in jointly determining historical FEWS performance, their vulnerabilities, and their resilience to extreme climate events. These infrastructures, plus technology and environmental management, constitute the “policy levers” which can actively be engaged to mitigate the challenge of contemporary and future climate change.
1 Introduction
Understanding how climate-related shocks reverberate through food-energy-water systems (FEWS) is a preeminent national concern that will greatly impact the management of traditionally-engineered infrastructure (e.g., dams, irrigation, and water treatment plants) (McKinsey and Company, 2006; ASCE, 2016; Munyasya and Chileshe, 2018), nature-based infrastructure (e.g., land, aquatic systems) (EPA, 2015; Green et al., 2015; European Commission, 2016), and their combination, as in urban settings and large-scale water resource delivery systems (Young, 2000; McDonald et al., 2016; Vörösmarty et al., 2018). The linked nature of these issues convinces us of the need for integrated frameworks (Weaver et al., 2012; Vörösmarty et al., this issue) and guides our approach to analyzing the nexus, specifically to detect trends and extremes in the key determinants of FEWS performance, diagnose their impacts on biogeophysical and human systems, and identify regional management tradeoffs, including those presented by evolving environmental regulations and economic incentives.
Our study is motivated by an important message from the fourth National Climate Assessment (NCA), namely, that the consequences of climate change and variability cannot be considered in isolation of other critical aspects of global change like land-use change, shifts in atmospheric chemistry (e.g., air quality, precipitation chemistry), and emerging FEWS technologies (e.g., regenerative and low-impact agriculture, renewable energy systems, gray-water reuse). FEWS challenges manifest themselves in unique, sub-national regional contexts (Zhuang et al., 2021). In addition, there is growing recognition of the limits to the capacity of traditionally-engineered infrastructures to deliver food, water, and energy (Green et al., 2015; ACSE, 2021), with growing interest in the logic of combining “grey-green” approaches (Young, 2000; WWAP, 2018; Browder et al., 2019). Ironically, this interest appears as new studies reveal widespread impairment of natural capital (Díaz et al., 2019) and substantially rising costs to operate engineered systems as a result of poor management of nature-based infrastructure (McDonald et al., 2016; Vörösmarty et al., 2021). We advance research encompassing these perspectives by pursuing an overall technical and scientific goal consisting of three parts, to:
1) Create an analysis framework to support advanced modeling and data integration capable of evaluating the impact of climate trends and extremes on the state and dynamics of engineered and natural infrastructures necessary to support the agricultural (food and biofuel crops), energy (electricity from conventional/renewable sources) and water resource (multi-sectoral use, pollution abatement) sectors;
2) Assess the resulting impacts, opportunities and tradeoffs in biogeophysical and economic terms across the food-energy-water nexus; and,
3) Explore with key stakeholders the use of both natural and engineered infrastructures as “policy levers” to minimize system-wide biogeophysical and economic damage.
The rationale and methodology behind the framework noted in the first component, its overall architecture, detailed technical specifications on its component models, and supporting datasets are described in an accompanying paper (Vörösmarty et al., this issue). Still more complete explanations of the models, input data, assessment results, their skill and their uncertainties are given in an accompanying series of papers in this Frontiers Special Topic (this issue): (Bokhari et al., 2023; Chang et al., 2023; Fekete et al., 2023; Kicklighter et al., 2023; Lin et al., 2023; Maxfield et al., 2023; Zhang et al., 2023). Tuler et al., 2023 describe interactions with stakeholders and the role of FEWS science in regional planning and policy-making.
We demonstrate here the framework designed to analyze Climate-induced Extremes on the Food, Energy, Water System Nexus (C-FEWS), with particular emphasis on the roles and sensitivities of traditionally-engineered and nature-based infrastructures (TEI and NBI, respectively). The framework is described in Vörösmarty et al. (this issue), including a schematic of its overall architecture and details on the component models, data sets and experimental designs. We focus in this paper on two strategically important adjacent regions of the U.S., the Northeast (NE) and Midwest (MW) (Figure 1), with each exhibiting unique climate, biogeophysical, and socioeconomic characteristics and histories. The two regions are home to a significant fraction of both the nation’s population (140M) and GDP ($6.7Tr) in 2021 and are dominated by urban, suburban and agricultural land uses (U.S. Census Bureau, 2022). Landscapes across the NE-MW represent a major, natural infrastructure that continues to be intensively managed and transformed by humans, as they have been for centuries (Melillo et al., 2009). Both regions play key roles in strategic decisions that affect global food security, the capacity of the U.S. to rely on renewable energy sources like biofuels, pollution abatement, and economic security (Pryor et al., 2014; USGCRP, 2017). As a potential return of major food production systems is contemplated for the NE (Foster, 2017; Wolfe et al., 2017; Werner et al., 2019), a comparative analysis with the agriculturally-dominated MW, including tradeoffs with potential expansion of food and biofuels production onto marginal lands (Gelfand et al., 2013), we see as important and timely.
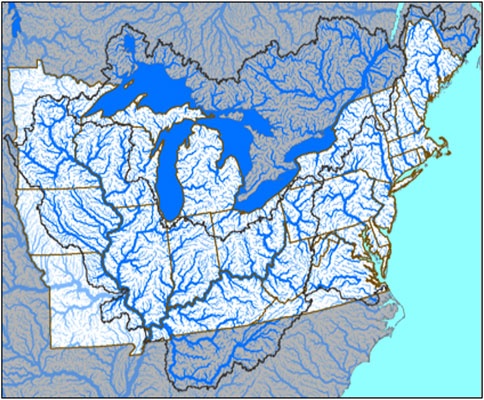
FIGURE 1. The C-FEWS study region of the Northeast (NE) and Midwest (MW) showing watersheds and relevant political boundaries. The study focuses on the U.S. portion of this domain, with NE comprising the states of Connecticut (CT), Delaware (DE), Maine (ME), Maryland (MD), Massachusetts (MA), New Hampshire (NH), New Jersey (NJ), New York (NY), Pennsylvania (PA), Rhode Island (RI), Vermont (VT), Washington DC (DC), and West Virginia (WV). The MW states are Illinois (IL), Indiana (IN), Iowa (IA), Michigan (MI), Minnesota (MN), Missouri (MO), Ohio (OH), and Wisconsin (WI).
The character and performance of these two regional FEWS are set within the backdrop of a rapidly changing climate (Kunkel et al., 2013a; Peterson et al., 2013; Vose et al., 2014; Wuebbles et al., 2014b). Climate change across the NE-MW is rich in extremes (Karl et al., 2009; Hayhoe et al., 2010; Wuebbles et al., 2010; Wuebbles et al., 2014a; Wuebbles et al., 2014b), with rising temperature impacting seasonality and onset of snowmelt (Karl et al., 2009; Walsh et al., 2014), and projected to bring record temperatures and more severe heat waves (Kunkel et al., 2010; USGCRP, 2017). Length of the growing season across both regions has increased by more than a week. Over the last century, NE precipitation increased by 10% (Kunkel et al., 2013b), with a 55% increase in the top 1% of extreme precipitation events over the last 50 years, the largest in the nation (USGCRP, 2017). The MW has similarly seen its threshold of extreme precipitation increase by 42%. Observed extremes have in part been driven by cyclical variability operating in the context of climate change. For example, extended regionally significant dry seasons across the MW can occur when positive North Atlantic Oscillations (NAOs) and cold El Niño Southern Oscillations (ENSOs) combine (Wuebbles et al., 2010). The NE and MW also show increased likelihood of extreme precipitation (Hirsch and Ryberg, 2012; Peterson et al., 2013), leading to the MW experiencing three record-breaking flood events in the past quarter century. While there is no apparent long-term trend in the frequency or severity of MW droughts, individual droughts, sometimes in combination with other extreme events, and lasting over relatively short time periods can produce important consequences. For example, the 2011–2012 drought event, particularly severe over the 2012 growing season and coincident with a heat wave, was one of the worst on record (Jin et al., 2019).
We report here on the first phase of the C-FEWS study, an exploration of FEWS behaviors across the NE and MW in historical context (1980–2019), with analysis of the individual and conjunctive roles of climate, land management, technology, and regulation. The particular aim of this paper is to demonstrate some of the major capabilities of the C-FEWS framework, highlighting a sample of noteworthy early results. The focus on the historical past enables us to assess, through the numerical experiments verified with documented observations, the importance of individual elements and linkages across the regional FEWS that have operated over a multi-decadal timeframe. This offers insight into how such macro-scale dynamics could emerge in the future. Under Methods, we begin with a presentation of the specific study goals and hypotheses to be tested. We also present a summary of our overall analysis framework and workflows, briefly explaining our approach to single and multi-factor numerical experiments (scenarios), including the character of the climate extremes analyzed. The Results section begins with the set-up used for the five emblematic experiments, pointing out their aims and the particular combinations of climate and non-climate factors that were analyzed. We then review some key results from these scenario experiments and use the Discussion to demonstrate how our sample outputs can suggest which elements of the FEWS will be most or least resilient to change over the coming decades. The last section also includes current and prospective plans on engaging stakeholders.
2 Methods
2.1 Study goals and guiding hypotheses
Two hypotheses guide this research. The first is diagnostic in its intent, while the second is prognostic. Both address the issue of climate trends and extremes and how these reverberate through the FEWS, with Hypothesis 1 focusing retrospectively from 1980-present to generate knowledge on how the nexus is “wired together” and sensitive to potential climate shocks. The prognostic work under Hypothesis 2 additionally assesses potential interventions and climate adaptation strategies over a planning horizon to 2100.
Hypothesis 1. The response of engineered and natural infrastructures to changing climate and its extremes (i.e., droughts, heat-waves, heavy precipitation, cold-waves) limits the capacity of the NE-MW to produce food and biofuels, reduces the reliable supply and quality of fresh water, and constrains electric power output, imparting unique signatures of impact on regional-scale FEWS that arise not only within the component parts of the system but the strengthening or weakening of their interconnections.
Hypothesis 2. Given Hypothesis 1, climate-related impacts on FEWS can be substantially mitigated through an optimal mix of engineered and natural infrastructures, emerging technologies, efficiency gains, and/or policy and regulatory instruments.We demonstrate in this paper how the C-FEWS framework can be used to explore regional, systems-level issues and hypotheses. While the framework is designed to address both hypotheses, we demonstrate here its use in diagnostic experiments used to test Hypothesis 1 over the historical time period, 1980–2019. We initially emphasize studies of the NE and MW, but use lessons learned from this exercise to help broaden the potential utility of the C-FEWS framework in assessments cast at the national scale.
2.2 Hypothesis testing and attribution studies
For our initial application of the C-FEWS framing, it is useful to restate our hypotheses in simpler form: a) limits imposed on TEI and NBI arising from climate extremes will constrain the overall performance of FEWS across the NE and MW, and b) the impact of progressive climate change and its extremes can be attenuated by management decisions. To test these assertions, we configured the C-FEWS computational framework to simulate a series of scenarios. We carried out factorial experiments to attribute and, when necessary, to rank the relative contributions of multiple environmental stressors (extreme weather, CO2 enrichment, ozone pollution, nitrogen deposition, nutrient inputs, and land-use change) to regional-scale outputs, similar to our earlier work in the NE (Miara et al., 2013; Stewart et al., 2013; Ehsani et al., 2017), China (Tian et al., 2011), and the pan-Arctic (McGuire et al., 2010; Hayes et al., 2011; Kicklighter et al., 2013).
We begin by formulating a historical Baseline scenario for 1980–2019 (Table 1, B1), which reflects the observational climate record, its trends and extremes, as well as documented contemporaneous land cover, water use, ecosystem state, and engineering systems that collectively serve as the benchmark against which all other scenarios are compared. Results from single factor (S1-S4) and multiple factor scenarios can be organized as main themes (e.g., for energy [ED1-EDX], food [AD1-ADX]) to identify the relative contributions of climate and non-climate factors to sector-specific FEWS performance over the historical period and into the future to 2100 [F1]. Results from these scenarios can then be used to rank the causal factors tested in terms of their overall impact on the assessment model outputs, such as: crop production; carbon sequestration; river discharge; electricity production and thermal load dissipation in rivers; and, water pollution. Scenario outputs are also used to map sensitive geographic sub-regions. These attribution and sensitivity tests are designed to consider multiple time domains. They can include persistent events like heat and cold waves, but also short-duration phenomena like “flash” droughts or extreme precipitation. In this paper we feature dominant climate extremes that are detectable (from either repeated or sustained events) over an annual time horizon (Sanyal and Wuebbles, 2023a; Sanyal and Wuebbles, 2023b). Change over months-to-years can also be critical, for example, through the impact of ENSOs and NAOs, volcanic eruptions, long-term drought and flood legacies, and pest infestations. Multi-year to decadal phenomena also condition FEWS performance, as with progressive climate warming, changes in seasonality, land use change such as urban sprawl, the evolution of cropping practices, and point and non-point source aquatic pollution loading and control.
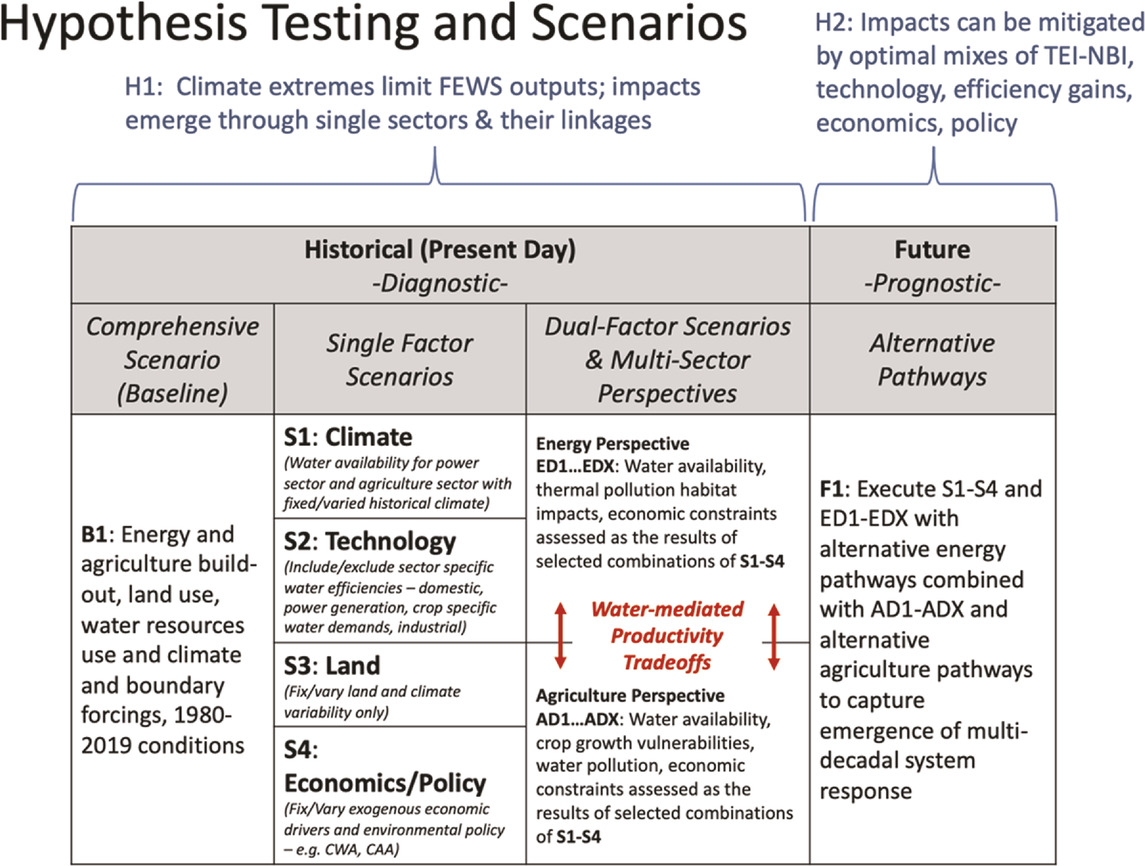
TABLE 1. Hypothesis testing (Diagnostic) and scenario forecast (Prognostic) experiments designed to identify regional system sensitivities to single and multi-factor stressors. The experiments simulate how climate, alternate technologies and land management, economics and policy jointly determine FEWS biogeophysical and economic responses. The analysis considers past and future time domains and assesses the role and sensitivities of engineered (e.g., thermoelectric power systems) and natural infrastructure (e.g., land use) deployments.
2.3 Experimental set-up for the five test cases
The C-FEWS framework consists of a soft-linked workflow configuration (Vörösmarty et al., this issue) that requires an appropriate configuration of models and datasets to execute experiments aimed at yielding particular, targeted insights. Figure 2 shows the main workflow components. These include Climate and Non-Climate Forcing Time Series. The first phase of the C-FEWS effort has focused on historical time series while the second will involve projections to the end of the century, analyzed over three individual time domains (early-century [1995–2004], mid [2045–54], late [2085–94]). All input and output datasets were appropriately assembled, harmonized, and quality controlled before use in any of the historical time period experiments. These included aggregate and parameter-type specifications for the models as well as any geospatial data. Specific combinations of these input data constituted the individual scenarios, referred to as Single and Multiple Factor Experiments (SFEs and MFEs, respectively). These bundled data inputs were then used in one or more of the C-FEWS models, producing a suite of Biogeophysical Outputs describing each of the FEWS component sectors. These outputs were then post-processed as diagnostics in the hypothesis testing as well as serving as performance and sensitivity measures, which we call Δ metrics. These metrics captured FEWS response to the SFEs and MFEs, often reflecting a straightforward “on-off” state specified by each experimental setup. For example, to explore how regional crop production is impacted by drought, we first specified a sensitivity measure based on the historical performance of the sector for years flagged as having the drying event (known as climate Approach A):
where Y could be crop yield, cd the climate drought year, b2 and a2 the 2 years before and after the event. Since we also performed single-factor non-climate experiments (ncSFEs) over the same Baseline period, we simultaneously explored climate/drought impacts as they interacted with assessment model outputs associated with any of the other main themes (i.e., technology, land use, management/regulations, Table 1). To do this, we computed for each non-climate target output variable (e.g., crop yield with/without cultivars), depicted as ncd, a second sensitivity metric of the same general form as in Eq. 1:
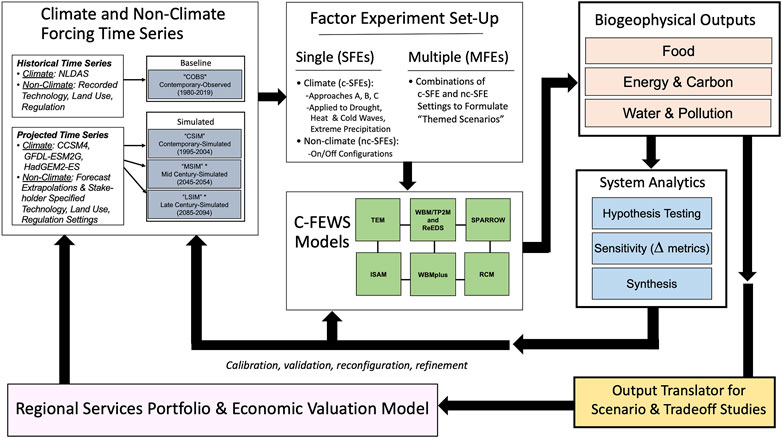
FIGURE 2. Computational workflow for the single factor and multi-factor experiments, SFEs and MFEs, respectively. Studies reported in this paper focus on the historical timeframe (1980–2019).
Next, benefits from evolving strains of cultivars were analyzed using the ISAM model run with crop strains fixed as in the 1980s (i.e., with no beneficiary effect of biotechnology improvements thereafter) and the modified result compared to Baseline, where the cultivars actually evolved. The experiment required assembling the Baseline results recorded for crop yield, using the metric shown below:
where ncSFE was the recorded output variable of interest (here crop yield) forced by a non-climate input factor (cultivars) over a starting year (or decade) and ending year (or decade). In some cases, the scenario eliminated completely a particular input variable, for example, engineered wastewater nitrogen treatment, or fixed its values to those recorded for the 1980s. An analog to this metric was used to evaluate the climate impact, by replacing the
When a modified climate time series was part of the MFE scenario, we computed a second category of metric (the Sensitivity Index) to assess and decouple the role of climate from non-climate factors. That index combined two individual Δ measures and was computed as:
where MFE was the aggregate system behavior under the combined scenario, for example, using Approach B for a heatwave plus a single technology variable. NC was the non-climate SFE analog operating under the Baseline climate (multiple non-climate factors can also be considered). The Sd term can give a measure of the importance of climate alone, teasing away the impact of the non-climate factors.
These metrics collectively enabled systematic comparisons to be made across the experiments and were particularly important in understanding how technologies like cultivars enhance (or diminish) resilience. More complex combinations of climate and multiple factors can be accommodated to further probe the nature of FEWS resilience (see Vörösmarty et al., this issue). The System Analytics were also synthesized and used in model calibration and validation and, as needed, served as the basis for model reconfiguration and refinement. Biogeophysical Outputs were also translated into terms fed into a Regional Services Portfolio generator together with an Economic Valuation Model, which we present to collaborating policy advisors and stakeholders. Consultations with these partners can also result in a recasting of scenarios and models, which is especially beneficial to meeting diverse stakeholder needs.
3 Results
Below we present a series of five test cases, illustrating the use of the C-FEWS framework (Table 2). Each example addressed a regionally significant biogeophysical issue that is policy-relevant, considered the impact of climate trends or extreme events, and examined the roles of traditionally-engineered and/or infrastructure in producing or compromising FEWS resilience. Computations were made using the semi-independent assessment models, forced by the same input variables, when necessary. For example, to support analysis of droughts under Approach B assessment models were presented the identical climate time series inputs. While the current C-FEWS model coupling is not formal, the case studies given below show how some key determinants transmit results across one or more sectors, for example, how a management/regulatory limit changed the level of electricity production, which then propagated a response into our estimates of thermal pollution and ultimately into economic costs (in the fifth study). Taken together, the five examples feature a sampling of key results in synoptic form to give a sense of the range of potential results that can be generated by the C-FEWS models. More comprehensive descriptions of the experiments and analysis of the accompanying results are given in a series of companion papers published in this same Frontiers Special Topic on FEWS. These papers describe the C-FEWS assessment models used (Figure 2): Economic Valuation (Chang et al., 2023); ISAM (Integrated Science Assessment Model; Lin et al., 2013); SPARROW (SPAtially Referenced Regression On Watershed attributes; Maxfield et al., 2013); RCM (Reduced Complexity Model; Bokhari et al., 2023); TEM (Terrestrial Ecosystem Model) (TEM; Kicklighter et al., 2023); and, Water Budget/Thermoelectric Power and Pollution Model (WBM/TP2M; Zhang et al., 2023).
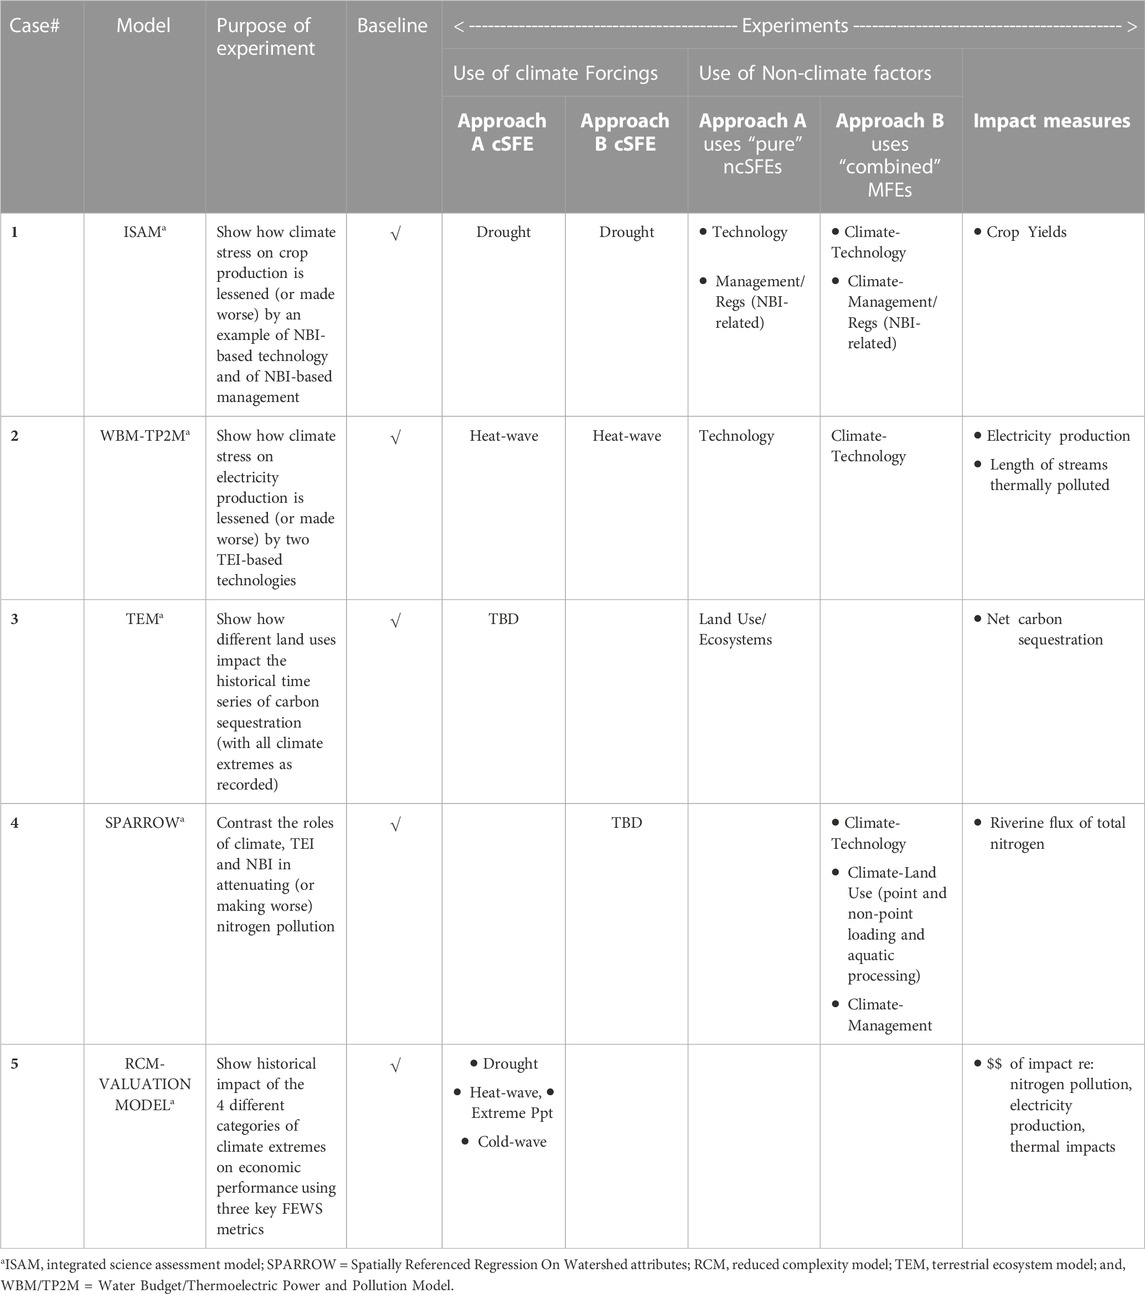
TABLE 2. Summary of initial experiments using the C-FEWS framework, highlighting examples of the major classes of topics addressed in this paper. The experiments are deterministic manipulations of the models, constructed by activating or inactivating particular variables to generate a set of counterfactual findings that lend insight into the importance of each of the determinants alone or in combination with others, as indicated by the sensitivity metrics presented in Eqs. 1–4.
3.1 Test case 1
Example of climate event stress on the food sector and how technology and management applied to an important nature-based infrastructure (i.e., human-controlled land) work to potentially increase climate resiliency.
The purpose of this example was to demonstrate use of the C-FEWS framework to assess: i) the impact on crop yields from one category of climate extreme (drought) simulated by the ISAM model; ii) how one NBI-based technology (use of cultivars) and one NBI-based management action (varying fertilizer application rate) can contribute (or not) to climate resiliency in the context of drought; and, iii) through combined climate and non-climate single factor experiments the capacity of NBI to enhance (or reduce) food-system climate resilience.
We specifically evaluated the impact of the major drought event recorded across the MW that occurred in 2011 but also was in force during the 2012 growing season (Sanyal and Wuebbles, 2023a; Sanyal and Wuebbles, 2023b), under a cSFE employing climate scenario Approach A from 2010 through 2014. Then, over the same time period, we constructed a small set of ncSFEs by manipulating ISAM model inputs to evaluate the influence of improved cultivars (representing a technology) and nitrogen fertilization rates (representing management). This enabled us to demonstrate how such human actions have influenced historical crop production in light of the recorded climate extreme. In addition, we imposed a set of repeated drought sequences using climate Approach B together with a combined cultivar and management scenario. In this way, we could demonstrate the value of a cSFE, ncSFE, and MFE focused on crop production.
Figure 3A shows the expected, negative impact of the 2012 growing season drought on Baseline performance for corn yields, when both cultivar deployment and fertilization rates varied as observed over the full simulation period (1980–2019). Also shown are the negative impacts rendered by the same drought imposed by fixing cultivars or fixing fertilizer levels (each to the 1980s). There was a dramatic difference between drought sensitivity when expansion of the use of cultivars was removed from the Baseline (a 45% decrease relative to 2009), while there was virtually no difference in fertilizer impacts, a result reflecting the fact that application rates showed a narrow range, approximately 140 and 170 kg N ha-1y-1 (USDA-ERS, 2021). While this result has been shown for corn only, it nonetheless suggests that specific inputs to crop production systems could have strikingly different effects on NBI-based system performance. It highlights the value of technology enhancements on the adaptive capacity of cropping systems in the context of a drought extreme.
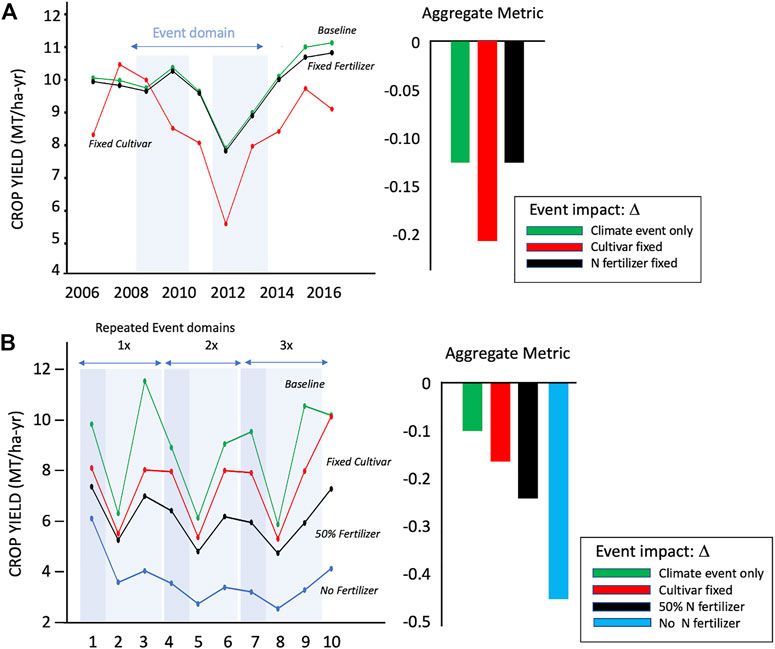
FIGURE 3. (A). Model simulation timeseries, showing Baseline, a scenario removing cultivar development (fixed at 1980s levels), and an experiment removing N fertilizer (also fixed at 1980s) simulating the MW drought of 2011–12 using climate experiment Approach (A) (left) Corn yield in the MW from 2007 to 2016, and (right) Drought impact metrics (Eqs. 1, 2) expressed as bar graphs (B). Climate Approach B experiments showing progressive impacts of repeated drought, loss of cultivars and N fertilization rates. The climate event Δ was computed using the climate-related variant of Eq. 3; all other Δ metric values are computed using the MFE variant, as explained in Section 2.3 and shown on the vertical axes to the right.
We also examined MW regional crop production response under climate Approach B, reapplying and hence intensifying the 3-year drought event sequence (2011–2013; 1x, 2x, 3x in the figure) over the last decade of the historical period. We evaluated system sensitivity through four ISAM simulations, aiming to capture the progressive impact of climate stresses alone, and then modified by cultivar deployment and nitrogen application rates. The first simulation investigated the pure climate effect, with assigned values to all other assessment model inputs as in the Baseline. The second experiment was an MFE, adding to the drought condition a fixed 1980s cultivar technology. The third and fourth experiments progressively applied an additional constraint by reducing nitrogen fertilization rates, first by 50% and then by 100%. This fertilization experiment explored the potential for reducing any potential nitrogen surplus while also maintaining yields during a period of sustained drought.
Figure 3B visually summarizes the 10-year (2010–19) time series and overall system sensitivities to the compound effects of the particular climate, technology, and management input manipulations that we applied to the model. Under all scenarios, corn yields showed the expected pattern of reduction in response to the growing season drought (occurring most prominently in years 2, 5 and 8). Removing new cultivars from the production inputs showed an additional negative impact. Overall, the 50% reduction in nitrogen fertilization had but a modest effect, while the 100% removal of applied nitrogen to cropland was much more consequential, suggesting an important threshold effect to be in play. Interestingly, under both nitrogen scenarios, the impact of nitrogen fertilizer on yields appeared to be less during the extreme drought years as corn production was more limited by water availability than by fertilizer, and gaseous nitrogen losses were similarly lower in the dry versus wetter conditions during each 3-year sequence.
Overall, these model experiments imply that corn yield was historically sensitive to drought, but overall yields were determined much more critically by the presence or absence of technology and fertilizer inputs. According to our experiments, single or repeated drought indeed reduced overall yields, but temporarily, as the crop production system rebounded under the Baseline, cultivar, and fertilization scenarios. Thus, climate played a minor role on long-term productivity relative to the other production factors tested. We therefore see evidence of resilience in MW corn production system and NBI-based benefits, even in the context of repeated drought. The degree to which this can be sustained in the future is the subject of a next phase of ISAM experiments.
3.2 Test case 2
Example of a climate stress on the energy sector, how technology potentially works to increase resiliency, and a simple tradeoff between energy production and thermal pollution, all emphasizing traditionally-engineered infrastructure (TEI) associated with thermoelectricity production.
The purpose of this example is to highlight: i) the impact on TP2M outputs of one category of climate extreme (heat wave); ii) how two TEI-based technologies can contribute (or not) to climate resiliency in the context of that single category of climate extreme; and, iii) show through this example how we can make statements about the role that gray (TEI-based) infrastructure can play in energy system climate resilience.
We first assessed the impact of a major climate event (2012 MW heat wave) using Approach A (Table 3). Then, by conducting experiments of cooling technology and fuel mix deployments (Zhang et al., 2023), we can show how such actions improve or impair electricity production and control the length of streams violating thermal limits under the heat wave. Besides the Baseline scenario, we designed two technology-related ncSFEs: i) a cooling tower (CoolT) scenario in which all once-through cooling was changed to recirculating systems using cooling towers that essentially remove all waste heat discharged to adjoining receiving waters; and, ii) the fixed coal fuel (Fixed-CF) scenario, which assumed that all power stations use coal as the fuel source—a less efficient and water-demanding fuel source than, for example, modern combined cycle gas-fired power plants (Miara and Vörösmarty, 2013). Outputs used in computing sensitivity metrics were electric power production (TW-hr/summer) and thermally polluted stream length (km), tabulated wherever thermal effluents caused a larger than 1 °C increase in river temperature compared to the condition when no power plants were operating. The summer period included June, July, and August.
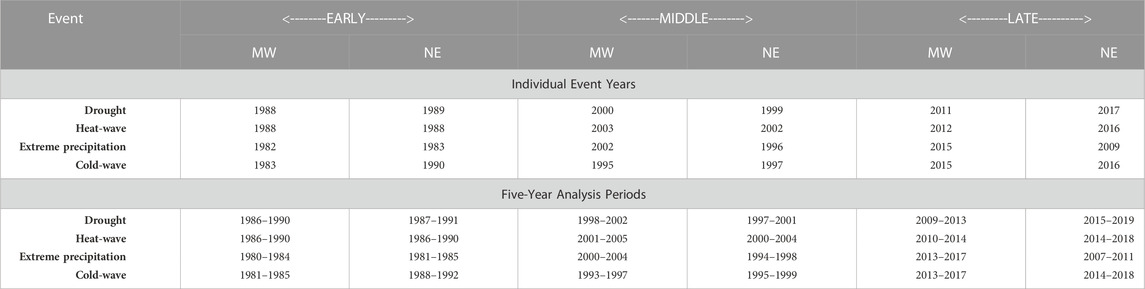
TABLE 3. Target years and associated 5-year analysis periods in the historical record for the Midwest and Northeast during early, middle, and late stages of the historical time period. Individual years representing specific events were identified and applied to specific experiments as summarized in Section 2.3. Individual years can be associated with multiple categories of events recorded (e.g., extreme precipitation and coldwave across MW in 2015; cold-wave and heat-wave in the NE in 2016). See Vörösmarty et al. (this issue) and Sanyal and Wuebbles (2023a), Sanyal and Wuebbles (2023b) for detailed methodology.
Figure 4A shows a time series of power output along with the Δ’s computed using Eq. 1. The 2012 heat wave exerted impact on all three ncSFE time series, albeit moderately. Changing once-through systems to cooling towers reduced power production slightly relative to Baseline, a limited decrement that reflected the small increase in power consumption to pump water between the condenser and cooling towers. In contrast, the Fixed-CF scenario decreased electricity production even more, indicating the importance of fuel mix on total power production. For each of these three conditions, we assessed sensitivities to the 2012 drought in question. In the bar chart, the climate event impacts (Δ values from Eqs. 1, 2) are summarized and found to be approximately the same, on the order of <5%, indicating that despite a relatively small loss of power production (at most ∼10% for the Fixed-CF scenario), the overall system was relatively resilient to the heat wave (see also Miara et al., 2017).
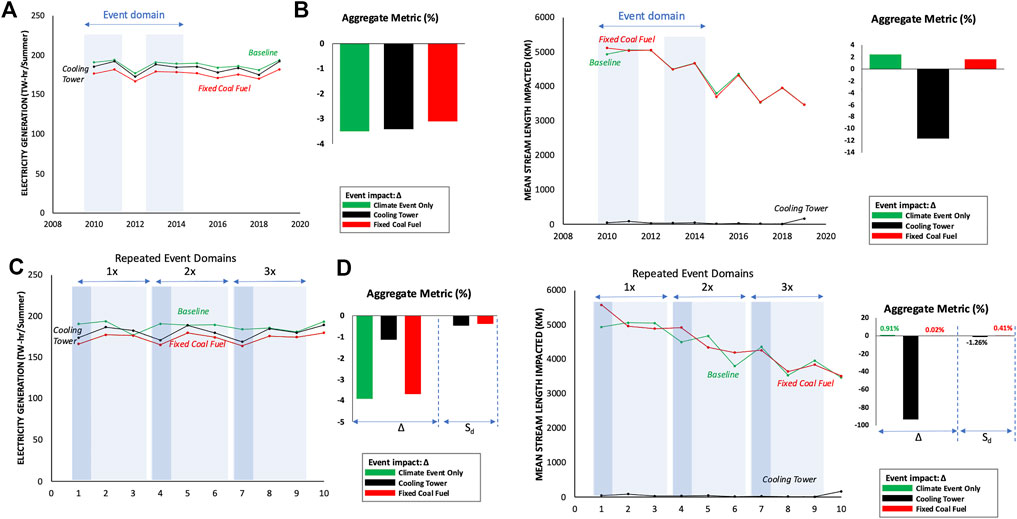
FIGURE 4. (A) and (B). Model simulation timeseries and climate sensitivity statistics for aggregate power production and associated thermal pollution, respectively, across the MW as a result of the imposed 2012 heat wave (Table 3). The panels each show Baseline and two ncSFE (non-climate single factor experiment) scenarios, i.e., removing all cooling towers and fixing the fuel source for all power plants to coal. Climate sensitivity metrics use Eqs 1, 2 under climate experiment Approach (A) (C) and (D). Show analogous results, but with imposition of three sequential heat waves under climate experiment Approach (B). The aggregate regional metrics use variants of Eqs 3, 4 to capture the overall effect of the single cSFE (climate single factor experiment), climate with an additional non-climate factor (constituting with climate effects, an MFE), and attempting to isolate the individual impact of climate under the combined scenarios (Sd); see Section 2.3.
Figure 4B shows the impacts of the climate event on thermal pollution in river corridors receiving thermal effluents. First, it is noteworthy that the impacts declined after 2010 for both the Baseline and Fixed-CF scenario as most of their new power stations were outfitted with recirculating cooling towers (EIA, 2022a). The CoolT scenario itself, although reflecting the extreme assumption of 100% of all power plants using the technology would, nevertheless have eradicated virtually all thermal pollution associated with the regional thermoelectric power system. In addition, the CoolT scenario greatly dampened sensitivity to the heat wave, whereas the Baseline and Fixed-CF scenario each showed a slight increase in sensitivity.
Figure 4C, D illustrates power generation and thermal pollution in response to the repeated heat waves in the last decade (2010–19) under climate scenario Approach B. The experiment consisted of two MFEs—the first for the repeated climate extremes plus CoolT and the second for climate extremes plus Fixed-CF. The climate extreme alone plus the two climate-technology scenarios all generated negative impacts on overall regional power production, with the coal fuel scenario showing the lowest potential production and, as with Approach A, an approximate 10% penalty. The bars on the right side of Figure 4C are the Δ values showing that in our example electricity production was reduced under all scenarios but by less than 5%. The CoolT scenario, in contrast, showed but a 1% sensitivity. The Sd term (Eq. 4) showed the relative sensitivity of the climate effects alone, including the intensified climate scenarios and the historical climate change over the 40-year period. These we found to be minor (<1%), again pointing to the resilience of the overall system.
The thermal pollution time series revealed regional sensitivities that were technology-dependent. This was shown by the Baseline and Fixed-CF scenarios, which progressed along the same (improving) trend discussed above for Approach A, wherein more efficient and less thermally polluting technologies were implemented in the final decade of the 40-year historical period. The Δ bar graphs show that the Baseline, which measures the climate event impact only, and the Fixed-CF yielded virtually no negative sensitivities arising from the repeated heatwaves. The cooling technology scenario, on the other hand, showed an enormous buffering in response to the repeated climate events. The Sd statistic corroborates this fact, that the climate effect alone was virtually erased from the CoolT and Fixed-CF scenarios. These results support the idea that the major forces at work in the thermoelectric power sector over the historical period were fundamentally driven by technology change operating through an evolving TEI.
3.3 Test case 3
Example of how land-use change affects an important nature-based ecosystem service—forest carbon sequestration-with a particular interest in the time-domain of this phenomenon (i.e., legacy effects).
Using TEM, we documented the evolution of forest carbon sequestration as a function of time, decade-by-decade. Our focus is on forests because carbon dynamics in these ecosystems have a dominant effect on the global carbon cycle and generate climate feedbacks (Anderson-Teixeira et al., 2021). We considered here a two-part question: What was the impact of evolving land use on regional carbon sequestration in forests and how did it interact historically with other factors that determined the regional terrestrial ecosystem carbon balance? This is a prime example of a question involving NBI exposure to a climate extreme that requires insight into the response of the NBI to direct human action via land use and cover change but also in the context of additional atmospheric determinants of biotic productivity (e.g., CO2 fertilization, ozone limitation). The experiment informs us on the potential limits that this nature-based service might impose on climate mitigation strategies targeting carbon management.
While analyses of short-term climate events (e.g., single-year drought) can be useful in examining the immediate, direct impacts of land-use change on forest carbon sequestration, they provide little additional information on how these impacts may evolve in a more strategic regional context. This is because forest ecosystems are well known to recover from previous human disturbances over decade-to-century timescales (i.e., bearing strong land-use legacies) and ultimately result from interactions with other changing environmental conditions, which themselves evolve over long periods (e.g., ozone pollution, atmospheric CO2 increases) (Figure 5). Therefore, we looked here over the multi-decade Baseline of 40 years to get a sense of the contributions that forest NBI could make to regional land carbon sequestration.
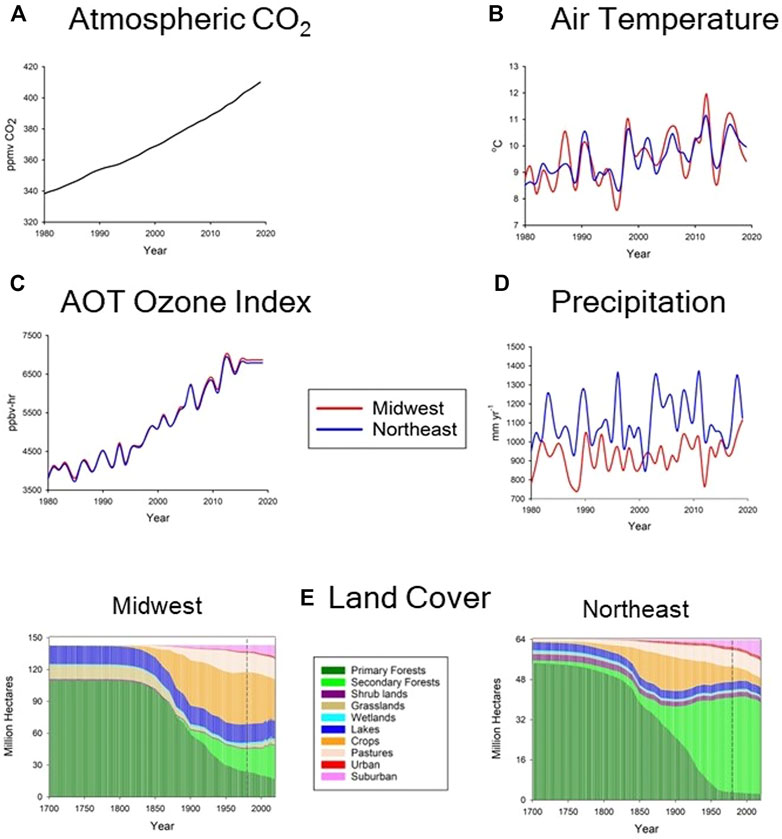
FIGURE 5. Examples of key land use management and other exogenous input variables driving forest carbon dynamics, as used in the Terrestrial Ecosystem Model. Carbon sequestration estimates depend on these inputs with time horizons that reflect long-term land use legacy effects as well as decadal-scale impacts of key atmospheric drivers. NBI-based sequestration also varies spatially with these variables. It is the interactions across this complex amalgam of factors that determines the overall biotic response and cannot be predicted a priori. The long-term carbon sequestration estimates presented here reflect the positive impacts of climate change (through favorable temperature (B), moisture availability (D), CO2 (A)) and forest regrowth, counterbalanced by loss of forest land and sub/urbanization (E) and impacts from atmospheric ozone pollution (C). From: Kicklighter et al. (2023).
Answering our two-part question required comparison of TEM results from the Baseline time series to corresponding results from an ncSFE involving land use. We created for 1980–2019 a Fixed Land Use scenario in which there was no land use conversion of forests to croplands, pastures, or urban/suburban areas and there was no abandonment of such. Only forests disturbed before 1980 were allowed to regrow. These conditions can be contrasted against the Baseline in which timber harvests from rotational forestry and land conversion, and the abandonment of managed land to forests, occurred during the 40-year study period. Thus, the Fixed Land Use estimates allow us to represent the legacy effects of land-use change that occurred before 1980 on carbon sequestration from forest regrowth, including interactions with other environmental factors, coincident during the 40-year study period. The impact of contemporary land-use change on carbon sequestration was estimated by subtracting the Fixed Land Use results, which had no land-use change effects from 1980 to 2019, from those of the Baseline, which included both contemporary (1980–2019) land-use change effects in addition to the legacy effects of land-use change prior to 1980.
Our analysis indicates that the capacity of forest ecosystems to gain or lose carbon was hardly static and changed over the decades (Table 4). For the Baseline scenario, and across both the MW and NE, we see that forests showed net carbon sequestration in all historical decades but one (2010s in the MW). This net carbon sequestration was primarily caused by the legacy effects of forest regrowth from land-use change that occurred before 1980 (revealed by TEM for the Fixed Land Use scenario). In contrast, contemporary land-use change, primarily through expanding suburban areas (Figure 5) from 1980 to 2019, diminished carbon sequestration. With the exception of the 2010s decade in the Midwest, the legacy land-use effects overwhelmed the contemporary land-use change effects such that forests of both regions became net carbon sinks. The relative importance of legacy versus contemporary effects of land-use change on net carbon sequestration showed large excursions across the decades, produced by different combinations of the effects of environmental factors (e.g., climate, atmospheric CO2 concentrations, ozone pollution) and human activities (e.g., agriculture, forestry, urbanization) on biological growth and loss.
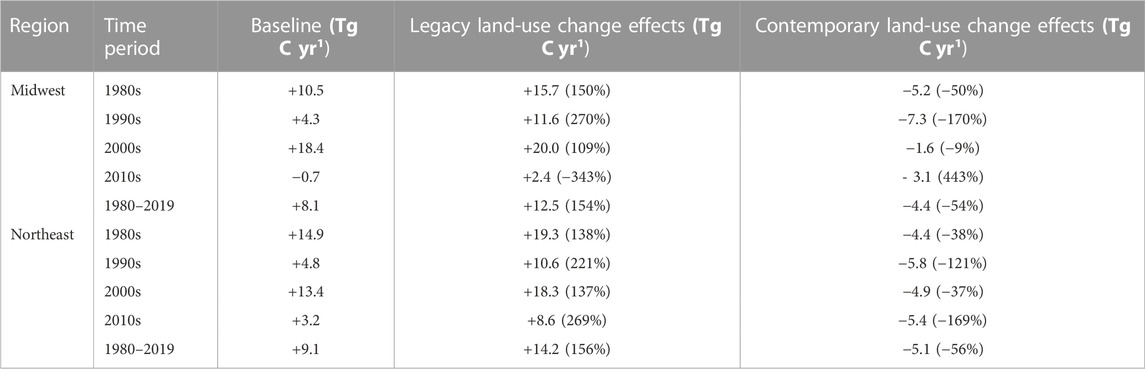
TABLE 4. Relative importance of legacy and contemporary land-use change effects on mean annual net carbon sequestration (Tg C yr-1) for forests in the Midwest and Northeast United States estimated by the Terrestrial Ecosystem Model (TEM) for various time periods. + values depict net carbon sequestration; - values indicate a net carbon source. Values in parentheses are percentage of net carbon sequestration accounted for by legacy or contemporary land-use change effects.
These results using TEM demonstrate well the complex spatial and temporal tracking necessary to evaluate the role of this particular NBI in regional carbon management. The reduced importance of legacy effects compared to contemporary effects on carbon sequestration during the 2010s suggests that the benefits of past land-use activities on forest carbon sequestration experienced in these regions—which have been taken for granted so far—may be diminishing such that carbon management of contemporary land-use change effects becomes a more important nature-based infrastructure management lever. The malleable nature of NBI-based carbon management and how tradeoffs involving different land uses, like forests versus land for housing or food production, need to be understood to formulate sound FEWS management policies.
3.4 Test case 4
Uncovering the individual and differential roles of TEI (wastewater treatment technology) and NBI (aquatic processing) on regional water quality.
Across the NE and MW, over one billion kg of nitrogen (N) each year are loaded into human waste treatment systems, representing a substantial imprint of human interaction with an important biogeochemical cycle. Here, we use SPARROW to examine the water pollution control benefits conveyed by engineered and ecosystem-based infrastructures. We analyze total nitrogen concentrations, defined as the sum of total Kjeldhal nitrogen (organic and ammonia) and dissolved nitrate and nitrite. We use the example of point-source nitrogen pollution because levels of water pollution are determined by the interactions of TEI through wastewater treatment facilities (WWTF) and NBI via instream nitrogen self-purification (alternatively referred to as decay), which our model explicitly simulates. We recognize that non-point sources predominate in many rivers across the two regions, but we focus here on point sources to demonstrate how the simulation capabilities of C-FEWS can be used to explore the geography of a particular, targeted phenomena. Such experiments have been shown to be instructive in identifying cost-effective infrastructure investments (e.g., Alexander et al., 2008). This C-FEWS framework experiment represents an example of two ncSFEs and is hypothetical—but instructive—as both TEI and NBI operate in tandem in the real-world setting.
To determine the importance of each form of infrastructure, Δ values based on Eq. 3 were calculated for all RF-1 catchments (Reach File inter-fluvial areas) (Alexander et al., 1999; EPA, 2007). For the NE, n = 5,547 RF-1 catchments have an average reach length of 15.5 km, while for the MW the corresponding statistics are n = 7,962 and 20 km. Across the NE, we simulated drainage to 250 points along the Atlantic coast through mainly smaller rivers, with a mean drainage area of 1,601 km2 and mean length of 56 km (the largest is the Susquehanna River with 37,752 km2 and 769 km). In contrast, the MW drains to a single point with a drainage area of 2.3 million km2. This region is separated into three large drainage areas: i) Missouri River, 1.3 million km2; ii) Ohio, 0.5 million km2; and iii) Upper Mississippi, 0.4 million km2. These have a mean length of 2,706 km. The statistics illustrate a key geomorphological difference between the regions, with the NE discharging water and nutrients into the sea via relatively small rivers at many coastal locations, with the MW emptying from essentially one large river basin into the Lower Mississippi defined here as the intersection of the Missouri, Arkansas, and Tennessee state boundaries. This has an impact on total water travel times through the two stream/river systems, a key factor in determining removal of nitrogen by NBI. Travel times average 8 days in the NE and 39 days in the MW.
We applied an aquatic nitrogen removal formula at the reach catchment level and, separately, at coastal points for the NE and at the furthest downstream point on the Upper Mississippi River for the MW to evaluate aggregate impacts. For the NE, we saw a total of 380 Mkg N yr-1 loaded into wastewater systems and 105 Mkg N yr-1 transported through rivers to coastal river mouths (Table 5). Internal aquatic processing therefore amounted to 275 Mkg N yr-1 or about 70% of incident loads (cf. Howarth et al., 1996). Almost 90% of this processing was performed by TEI-based facilities, with NBI taking on a distinctly minor role. For the MW, total nitrogen loading totaled about 650 Mkg N/yr-1 and rivers discharged to the Lower Mississippi about 130 Mkg N/yr-1, tabulating a total processing of 515 Mkg N/yr-1, which constituted 80% of the loading. In contrast to the NE, the MW showed TEI-based removal at about 60% and NBI at 40%. These results reflected spatial differences in urban wastewater loading (excluding direct coastal discharges), levels of treatment, and the configuration of the drainage basins and attendant differences in travel times. These differences provide an ideal opportunity to further investigate the relative significance of gray versus green infrastructures in regional pollution control.
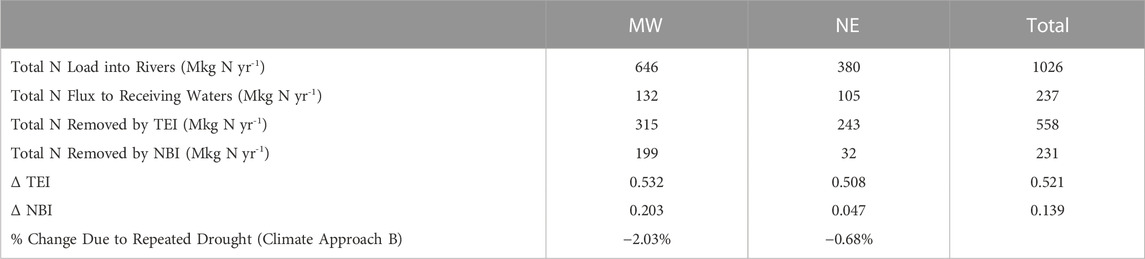
TABLE 5. Key total nitrogen (N) budget statistics for point source pollution for the NE and MW using the SPARROW model. Two single factor experiments, detailed in the narrative, were used to isolate the impact of engineered waste processing versus natural instream ecosystem processes to limit total N flux. Values for the NE refer to rivers draining into ocean receiving waters. For the MW they represent estimates made at the downstream endpoint of the Upper Mississippi River Basin at the intersection of the Missouri, Arkansas, and Tennessee state boundaries. Results are for mean annual conditions over the period 2010–19.
To understand the relative importance of the two types of infrastructure more completely, we constructed two ncSFEs over the period 1980–2019, in which we set to zero the functionality of either TEI or NBI. Because the incapacitation of either TEI and NBI in the ncSFEs resulted in an increase in total nitrogen flux relative to the Baseline, their relative strength could be determined by subtracting ∆TEI from ∆NBI placed onto a common scale. The difference calculation results in values between 1 and -1, with positive numbers indicating greater significance of TEI and negatives showing elevated importance of NBI. It is important to recognize that region-wide nitrogen balances were determined by the balance between point and non-point source loadings, upland and wetland watershed nitrogen sequestration and loss, as well as instream self-purification, but the nature of the experiment here was designed to evaluate the major sources of point source pollution control per se (i.e., natural or engineered). Because TEI-based wastewater treatment acted only on point-source nitrogen, we excluded non-point sources from the simulation, thereby isolating NBI functionality in point source pollution control alone.
The results in Figure 6 show the predominant beneficial impact that TEI had on controlling regional-scale point source nitrogen pollution in both the NE and MW. Nevertheless, the importance of NBI increased with length of travel along rivers, with the longest rivers showing large cumulative effects of aquatic decay (e.g., Upper Mississippi, Missouri Rivers). In these rivers, NBI appeared to have a comparable effect to that of TEI. Given the relative scarcity of similarly long rivers in the NE, the region showed only 14 catchments (<<1%) with a ∆TEI - ∆NBI < −0.5 (90 reaches with a ∆TEI - ∆NBI < −0.2), whereas in the MW, 41 (<1%) did so (305 had values < −0.2). The small number of catchments with predominance of NBI in this experiment was related to the fact that TEI acted immediately upon point sources (the only sources of nitrogen in this experiment), while NBI depended on travel time, occurring gradually during downstream river travel. In contrast, the NE had 603 reaches (11%) and the MW 1,394 (18%) with TEI dominating, that is, ∆TEI - ∆NBI > 0.5 (1,153 (NE) and 2,144 (MW) with ∆TEI - ∆NBI > 0.2). All remaining reaches, the vast majority small-to-medium in size, were intermediate in the level of dominance associated with either of the two infrastructures.
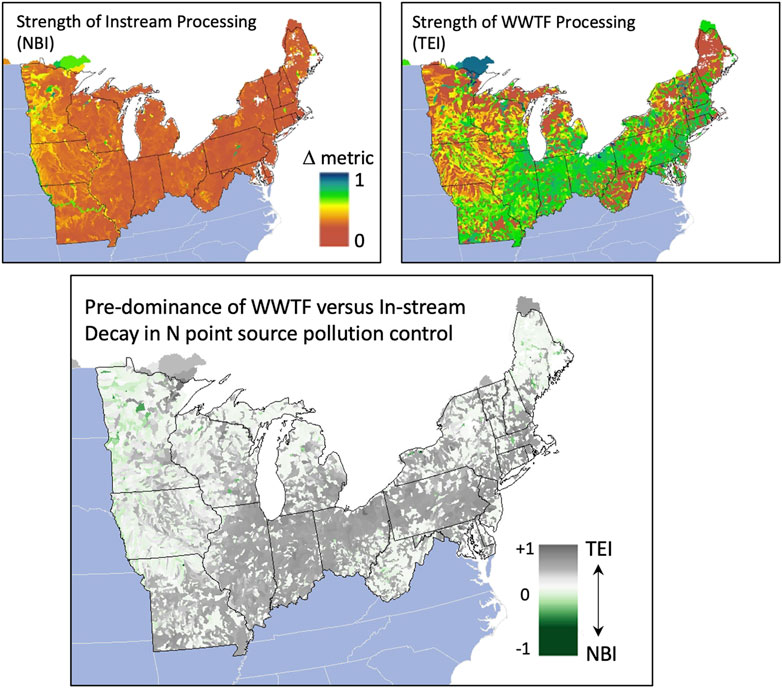
FIGURE 6. Analysis of engineered versus natural aquatic ecosystem infrastructure processing in controlling contemporary total nitrogen pollution from point sources in the NE and MW. The overall dominance of TEI (traditionally-engineered infrastructure) is indicated (with high Δ metric scores in the top right and lower panels), particularly in river reaches downstream of urban settings. However, additional within-basin patterns show many stream and river reaches with NBI (nature-based infrastructure) at parity with or exceeding TEI in importance.
These findings reflect the spatially-varying nature of TEI/NBI infrastructure in pollution control and can be corroborated by a more integrated view afforded by examining the cumulative nitrogen flux estimates at the downstream river endpoints of the two regions. On this basis, the NE showed a slightly lower ∆TEI than the MW (mean 0.508 vs. 0.532), suggesting again a pivotal role of TEI-based treatment as an integrative regional actor (see Table 5). Again, aquatic decay in the NE was shown to have a much less significant role (mean ∆NBI = 0.047), due to the relative abundance of smaller rivers in the region. By comparison, aquatic decay in the MW at the point of entry into the lower Mississippi remained a much more significant factor (∆NBI = 0.203). In both cases, however, we saw regional manifestations of the importance of historical investments in engineered wastewater infrastructure. Additional analysis of the role of aquatic NBI is given in Maxfield et al. (2013).
We continued this assessment by examining the impact of drought on NBI, using climate inputs from the most extreme drought periods (1999–2000 for the NE and 1988–1989 for the MW) as a slight variation of climate Approach B (tripling drought frequency over 10 years). We found that the overall flux of nitrogen to receiving waters decreased by 0.7% in the NE and by 2.0% in the MW, thus modest in both cases. The small decrease in flux in the NE indicated a slightly increased processing capacity by NBI in the region, with longer travel times associated with drought. Similarly, low-flow conditions produced a reduction in river flux in the MW, particularly in the Upper Mississippi and Missouri Rivers, where significant water deficits led to a higher potential processing capacity for NBI, again as a function of elevated travel times associated with drought. These findings are consistent with those of Green et al. (2004), Wollheim et al. (2008), who found that hydraulic residency time is a chief determinant of riverine nitrogen flux. In addition to the sewage inputs we have analyzed here, a complete mass balance requires the addition of non-point sources (Galloway and Cowling, 2002; the subject of Maxfield et al., 2023). We conclude that both types of infrastructure—TEI and NBI—were critical to water quality maintenance (at least for total N). This statement holds true across both regions, but in a highly location-specific and temporally-specific manner.
3.5 Test case 5
We explore here the single and multi-factor impacts of climate extremes, technology, and regulatory policy that demonstrate the C-FEWS framework’s capacity to simulate basin-scale FEWS responses using Reduced Complexity Models (RCMs). Experiments were designed for the Delaware River Basin, where we analyzed system-level sensitivities with respect to thermoelectric power generation and thermal pollution. We used decadal (2010–2019) averages of RCM outputs aggregated from a series of daily variables that were compared across the Baseline and three intensified climate extremes (drought, heat wave, extreme precipitation) using the Approach B climate methodology with three repeated 3-year events (Vörösmarty et al., this issue). In addition to the RCM outputs, a simplified economic valuation module was employed to estimate the economic output associated with electricity generation.
To assess the impact of thermoelectric cooling technology, we formulated a once-through cooling technology scenario (OT) that restricted all of the basin’s power plants to this cooling approach that expels the greatest flux of waste heat into rivers compared to all other cooling alternatives. To assess the impact of an additional regulatory effect, we designed a Clean Water Act (CWA) scenario that imposed strict limits on power plant operation when daily thermal effluent temperatures exceeded designated temperature thresholds (Copeland, 2016). The CWA temperature limits were estimated from defined ranges (1.5°C above ambient river water temperatures or an absolute limit of 28°C) and were also applied with the OT cooling scenario to formulate a combined OT-CWA scenario.
In terms of raw water supply, the intensified climate extremes each yielded intuitive impacts on downstream river discharge across the Delaware River Basin (Figure 7A). Relative to the Baseline climate, discharge decreased by 25% and 16% for the drought and heat-wave scenarios, respectively, while it increased by 15% under the extreme precipitation scenario. The aggregate electricity production across the basin was relatively insensitive to the impact of each of the repeated, decadal-scale climate extremes (see also Zhang et al., 2023). The current cooling technology mix in the basin was dominated by recirculating cooling systems (RCS; i.e., cooling towers), associated with 89% of regional power production (EIA, 2022a, EIA, 2022b). Once-through systems were associated with only 11%. Together, these systems were essentially fully adequate to produce electricity (Figure 7B), contain temperature impacts (Figure 7C), and generate income (Figure 7D) under all of the intensified climate extremes (solid bars), even with CWA limits strictly enforced. The OT scenario alone logged a 4% decline in electricity production and $11.3M financial loss relative to the Baseline, but by far produced the worst performance in terms of thermal pollution, with a 6°C or more increase in average river temperature over all other scenarios and potentially reaching as high as 10°C.
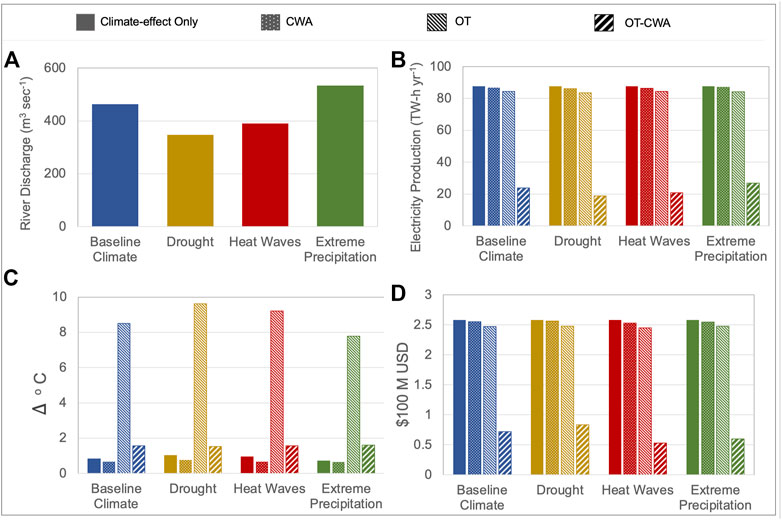
FIGURE 7. The decadal average (2010–2019) of outputs from the RCM framework and Economic Valuation Module for the Delaware River Basin, compared using bar graphs for four climate scenarios: Baseline climate (blue), drought (brown), heat waves (red), extreme precipitation (green). Four technology/policy scenarios were applied to each climate with its corresponding visual coding: “Climate-effect Only” (solid), “CWA” (Clean Water Act) (dotted), “All OT (once-through) Cooling Technology Scenario” (diagonal stripes-right), and “All OT Cooling Technology with CWA Scenario” (wide diagonal stripes-left). Single and multi-factor scenario results are shown for (A) downstream river discharge (B) annual electricity production (C) basin-averaged increase in river temperature from power plant operation (D) economic valuation of annual electricity production.
A tradeoff thus arises with environmental protection and electricity production, should OT cooling dominate. If we impose CWA thermal pollution limits to achieve an improved level of environmental protection, this would require a severe curtailment of electricity production. We thus saw a dramatic decline in electricity production with the combined OT-CWA scenario (Figure 7B) to protect thermal integrity. The severely limited power production associated with the OT-CWA scenario (with drought producing the largest loss at 78% while even extreme precipitation loses 70%) resulted in economic losses that ranged from $175 million to $205 million relative to the full monetary potential of the basin’s Baseline electricity production (Figure 7D).
The significant rise in temperatures, under all extreme climates with the OT scenario, if met by strict adherence to CWA thermal pollution constraints, is a good example of an energy sector-environmental protection feedback. The policy choice is power production versus habitat protection. If the former is selected, there would be little difference from the Baseline in terms of power production and its economic value. If the choice favors environmental concerns, power production would be severely curtailed and its value would plummet from $250M under Baseline to about $60M. This multi-factor scenario highlights the significant inefficiency of the OT cooling technology and stresses the importance of continuing the contemporary evolution of cooling technology towards RCS in the Delaware River Basin. This has the dual benefit of preserving aquatic thermal habitat while showing only modest losses in power production. We also demonstrated, through a preliminary analysis of climate, power plant technology, and regulatory policy impacts, that tradeoffs between thermal pollution and electricity production can be influenced greatly by different combinations of parameters and input variables. This finding motivates our upcoming multi-objective optimization studies using the RCM framework.
4 Discussion and conclusions
The experimental results reported for the five Test Cases highlight some important early findings generated by the C-FEWS framework. We also have demonstrated the value of a regional, sufficiently long time perspective to uncover the broad-scale features of FEWS dynamics using the historical period 1980–2019. Some common themes have come to light, which are being tested in the companion papers cited earlier, but will serve as the focus of subsequent work, in particular as we move to the prognostic phase of the project, exploring future climate, land use, technology, and management scenarios. There are also valuable lessons that were learned as we sought to formulate coherent rules by which to construct the single and multi-factor experiments, configure the models, and interpret the sensitivities of the overall system. A brief synthesis, describing three key findings, is offered below, followed by a discussion on building policy relevance through our stakeholder engagement effort.
4.1 FEWS climate resilience
While not fully comprehensive, the experiments presented here are consistent in showing strong evidence that several elements of the NE and MW regional FEWS are resilient to the episodic climate events that were imposed. Sensitivities were limited mainly to the years in which the imposed climate stresses were in force, with rapid rebound afterwards. This was demonstrated for a broad spectrum of FEWS—in the food sector in terms of corn yield, in the energy sector in terms of thermoelectricity production and thermal pollution, and in the water sector in terms of minimal change to the patterns of inland water nitrogen pollution from point source sewage. This finding held both for the single climate extreme analysis under Approach A, as well as under the repeated sequences for Approach B. While the rebound effect benefits from the transient nature of climate events recorded for the two regions (Sanyal and Wuebbles, 2023a; Sanyal and Wuebbles, 2023b) the impacts are likely to be more severe should a more chronic set of extremes be in play, for example, the recalcitrant drought and heat wave condition currently in the west United States or with an anticipated shift in climate regime to drier conditions in the future (Gutzler and Robbins, 2011; USGCRP, 2017). Thus, our generalization about climate sensitivity presented here may be highly region-specific and dependent on the persistence of the effects considered. We also recognize that the four categories of extremes are spatially complex over more local domains, can shift greatly over short time frames, and include events such as flash droughts (Christian et al., 2019) and episodic flooding. As a result, our assignment of a particularly noteworthy climate event year may have failed to capture the sub-regional dynamics, which operate on important, although shorter, time periods within a year, and affect individual FEWS sectors differently, for example, planting season for crop production or summer heat waves that increase demand for electricity for air conditioning. Future analysis will consider a rescaling to identify more sector-relevant climate extremes that can be applied to the assessment models.
4.2 FEWS performance conditioned by technology and management/regulation
For each of the FEWS sectors analyzed, its performance was strongly dependent on the types of technology and management or regulatory instruments deployed. The results for Test Cases 1 through 5 all showed that the levels of performance, irrespective to transient climate impacts, were mainly determined by non-climate factors, a situation true for both TEI and NBI. This is an important finding insofar as both infrastructures can serve as the policy levers available for FEWS management. The example of WBM/TP2M showing the progressive decrease in thermal pollution from 2010 to 2019 while power production held steady was a testament to TEI technology adoption, in this case recirculating cooling towers and dry cooling systems. Similarly, adoption of cultivars developed through biotechnology and applied in ISAM to cropland (an NBI) was a key determinant of corn yields, well beyond the impact of climate trends or extremes. Long-term, century-scale legacy effects associated with land use change in TEM (i.e., forest clearing, abandonment, regrowth) was the predominant factor determining carbon uptake by NBI at the regional scale and was additionally modified by more modern land conversion processes, such as suburbanization. While natural decay processes in rivers provided an important NBI-based service—and were particularly noteworthy in terms of attenuating non-point source nitrogen loads—they played but a supporting role in controlling point-source pollution, with engineered treatment predominating across both the NE and MW. We also found that regulatory control was context-specific and worked most effectively in concert with appropriate technologies. We demonstrated this with the RCM simulating the impact of CWA thermal pollution limits that imposed a limited burden on power production when recirculating cooling technologies were allowed to evolve (as they did historically). In contrast, the RCM showed an enormous loss in electricity production and affiliated economic value when the regional population of power stations failed to adopt these technologies and used only once-through cooling. The evolution of technology is thus shown to be important in building FEWS system resilience.
4.3 Spatial and temporal effects determine FEWS performance
The suite of C-FEWS assessment models (Figure 2) were purposely designed to capture dynamical processes and to reflect fundamental geospatial patterns (Vörösmarty et al., this issue). Our high-resolution spatial mapping of C-FEWS assessment model outputs as well as our more aggregated summary statistics demonstrated both regional and sub-regional distinctions that vary over time. The strength of TEM-based carbon sequestration, for example, changed over the decades and was distinct across the NE and MW, arising from complex mosaics of land use legacies that operate over time-varying, individually simulated pixels. ISAM summaries of regional crop yields were similarly computed from independent, pixel-based process-level model calculations. In contrast, the SPARROW-based analysis of the relative roles of TEI versus NBI in nitrogen pollution control added an additional dimension to the spatial question, where river network topologies became critical, as nitrogen decay is a sequential process operating along well-organized river corridor pathways. Enormous differences in the geomorphology of the NE and MW, with the landmass of the former discharging across a proliferation of smaller river mouths versus a more-or-less single entry point into the lower Mississippi, defined the relative roles that TEI and NBI played. NBI was favored in the MW due to longer average travel times but non-etheless operated in the context of the predominant effect conveyed by TEI in point source pollution control. This spatial organization therefore yields important considerations on how investments could optimally be made in pollution abatement, for example, in either constructing new wastewater treatment facilities or protecting and rehabilitating existing forms of both types of infrastructures.
4.4 Additional lessons
The next phase of the C-FEWS study will focus on projections into the future and the implications of climate change and other key determinants on FEWS performance over the next many decades. We have demonstrated here the critical roles of both engineered and nature-based infrastructures, which reasonably can be considered as the regionally-significant policy levers that decision-makers, planners, and managers have at their disposal. One important aspect of our general findings is that technology can keep pace with climate change and its affiliated extremes, in large measure buffering the FEWS sectors from climate shocks. Our study has explored individual FEWS sectors and some of their preliminary tradeoffs (e.g., power production versus preserving the thermal integrity of riverine habitat). A more comprehensive analysis using additional multi-factor experiments is still required to more completely test our main hypothesis regarding how interactions across the FEWS elements define the aggregate behavior of the full system.
4.5 Limits of the analysis
Our study was limited by the structure of the framework, the contributing algorithms, and input datasets. First, C-FEWS uses a loosely coupled configuration of models and thus cannot explicitly articulate feedbacks across all of the FEWS sectors simultaneously. However, the assessment models do share common data inputs, time horizons, and experimental manipulations. For example, the climate forcings (i.e., for a single climate scenario Approach) were identically input to all of the models across the cSFEs. Our time frame spanned the decades of 1980–2019 and for that time period we applied historical time series for many of the input variables that were shared identically by one or more of the models (e.g., same time series of fertilizer application, land cover, power plant fuels and cooling technologies). As a consequence of these initial experiments (documented in individual C-FEWS papers in this special issue), we can evaluate the single and multi-factor experiments to assess whether or not the models need to be more tightly coupled. If such a coupling is indicated, we can envision a sequence of more tightly linked simulations, similar to the evolution of our linked modeling of the energy sector in an earlier study (e.g., from Miara and Vörösmarty, 2013 to Miara et al., 2019). Next, the models operate at different spatial and temporal scales and require suitable aggregation. For example, the ISAM model operates at hourly time steps at 0.1° (long/lat) resolution; the TP2M at daily time steps and 0.05°; the economic models annually at the state-level; and, the RCM monthly at the drainage basin scale. Given that the models conserve both mass and energy, we can apply standard techniques to geospatially and temporally aggregate the results, for example, over individual states, basins, the NE or MW (Hill et al., 2004).
4.6 Building policy-relevance: Beyond basic FEWS research
The C-FEWS framework has been useful in developing what we refer to as an actionable knowledge base. It specifically has developed datasets and modeling tools useful to a wide range of stakeholders focusing on energy transitions, sustainable agricultural, watershed management, and water quality and pollution control. The scenario work informs decision making on the most impactful manipulations of TEI and NBI, including strategies that maximize conservation and ecosystem restoration (Figure 2). Our existing engagement efforts focusing on the NE and MW have involved stakeholders drawn from federal, state and local agencies, NGOs and civil society and the private sector (Table 6; Tuler et al., 2023). Our focus has been on developing alternative developmental story lines, that motivate the stakeholders to articulate specific goals for land use management and habitat protection, energy technologies, pollution control strategies for point source pollution and non-point pollution generated by agricultural practices. These storylines are then translated into contrasting scenarios (e.g., business as usual vs. high sustainability targets), which the study team then quantifies as alternative inputs in the C-FEWS assessment models. This co-design process then invokes different combinations of factor inputs to construct specific scenarios (Table 2). Results from these revised experiments are then shared and discussed with the stakeholders. Revisions are then made and the process continues until a suitable set of endpoints reaches a sufficient level of maturity as agreed-to by the parties. Use of the full models in this way requires attention and time to reparameterize and the process is highly asynchronous. For this reason, we are also completing an advanced version of the RCM to handle the full suite of FEWS dynamics, enabling a much shorter turnaround for model set-up and results generation, which will be embedded into the stakeholder workshops.
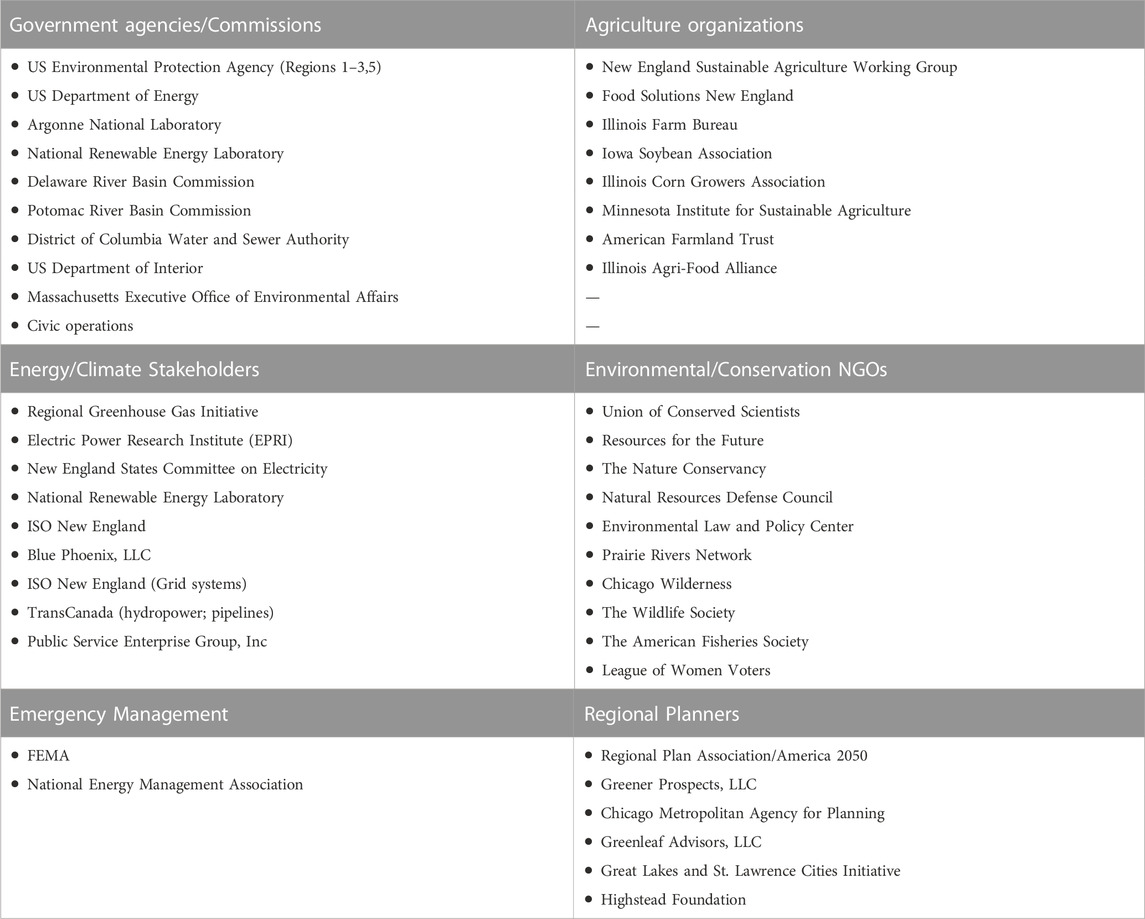
TABLE 6. A partial listing of the C-FEWS Stakeholder Working Group and workshop participants.
In parallel with establishing the C-FEWS Stakeholder Working Group and executing workshops, we have conducted a series of interviews with modelers from the C-FEWS project team and regional policymakers, NGO representatives, and researchers. The purpose has been to gather perspectives and insights into the utility of the regional C-FEWS assessment models, the challenges of creating these models in a planning support context, and the specific types of information needed to improve the management of integrated food, energy, and water systems at the macro-scale (Tuler et al., 2023). The development and application of regional assessment models for FEWS has given rise to many challenges (Webler et al., 2011; Kling et al., 2017) and the C-FEWS project is representative of the approaches that have attempted to integrate existing models of particular sectors and regional sub-systems that ultimately can provide information to stakeholders on policy-relevant dynamics.
The model developers and stakeholders we have interviewed to date generally agree that assessment models need to provide policy and decision-makers with sufficiently practical as well as actionable knowledge. For example, both groups agree that information about economic metrics, thresholds, and inflection points are useful for comparing the impacts of different policy or technology interventions. They also generally agree that information is most helpful when it speaks to stakeholders’ scale of interest in decision-making. The modelers we interviewed have different opinions about whether and how to present uncertainties for stakeholders, while stakeholders expressed a clear desire to be informed about uncertainties. In addition, stakeholders expressed interest in measures of distributional impacts and equity, which typically are not a central focus of assessment models. Some challenges can be traced back to the decision to use a suite of existing (as opposed to de novo) models. For example, the ability to configure models to provide information relevant to stakeholders is constrained by the use of existing algorithms that pre-determine the scales and particular variables that can be simulated. Another challenge relates to the process of linking existing models, a product of the considerable effort modelers must invest to learn about each other’s formulations and to assess the compatibility of assumptions, parameter definitions, and analytic approaches. Reconciling inconsistencies and differences, even within a single modeling team, takes a great deal of work and coordination.
The findings from our interviews reinforce the notion that regional assessment models can be of use to diverse stakeholders, but their promise requires that clear understandings be built between modelers and stakeholders about, for example, relevant spatial and temporal boundaries, measures of impact, and the character of scenarios of change. Stakeholders, in turn, can identify a range of scenarios that the models should be able to analyze and how model outputs could be productively presented and synthesized. Successful development and application of regional assessment models will require dialogue between modelers and stakeholders that honors the knowledge and expertise that both groups bring to the effort and helps them learn from each other. Many of the broad concepts, tradeoffs, opportunities, and limitations summarized in this paper are certain to figure prominently in these interactions.
This regional C-FEWS study sets the stage for a more generalized application of the approach to analysis of patterns across the national domain. The contrasts as well as similarities across the two regions of interest should not obscure the fact that, however unique, the NE and MW do not exist in isolation and their current state and future trajectories will be dictated by larger national (if not global) scale considerations. All C-FEWS models (except the RCM currently) already operate at the continental scale, positioning us to create a prototype CONUS-level version of the framework to support the assessment modeling (e.g., Lin et al., 2023; Maxfield et al., 2023). Such a national perspective using some of the C-FEWS modeling capabilities has been valuable in documenting cross-regional climate-readiness. For example, in earlier work (Miara et al., 2017), we highlighted a dramatically different capacity of the thermoelectric sector to adapt to future climate change, counterintuitively documenting more robust climate resilience across the US Southwest versus the Southeast. The effect arises from larger predicted increases in atmospheric humidity for the Southeast, decreasing vapor pressure deficits between cooling towers and the adjoining atmosphere, thus reducing the efficiency of the cooling process and hence constraining electricity production. The expansion of C-FEWS models to the fully national domain will follow the structure and procedures outlined in Figure 2. As in the NE-MW study, these and other process models will operate using the framework schema, including computation of regional services portfolios based on TEI and NBI, which are then economically evaluated and shared with stakeholders. Pursuing this broader objective enables the NE and MW to serve as the foundational benchmark against which FEWS performance in other regions of the United States can be assessed.
Data availability statement
The raw data supporting the conclusions of this article will be made available by the authors, without undue reservation.
Author contributions
Conceptualization: CV, JM, DW, AJ, AA, MC, EH; method development: CV, MC, SS, EN; formal analysis: MC, DK, BF, HB, JC, T-SL, NM, SS, JZ, ST; writing/review/editing: CV, JM, DW, AJ, AA, ST, RS, DK, AM; framework data and IT support: FC, DV; project administration: CV, MC, EN; student/post-doctoral mentoring: CV, DW, AJ, AA, ST, RS, FC, EN. All authors have read and agreed to the published version of the manuscript.
Funding
Financial support for this work was provided by the U.S. National Science Foundation’s Innovations at the Nexus of Food, Energy and Water Systems Program (INFEWS/T1 Grant #1856012).
Acknowledgments
We also acknowledge V. Puricelli for assistance in formatting the final manuscript.
Conflict of interest
The authors declare that the research was conducted in the absence of any commercial or financial relationships that could be construed as a potential conflict of interest.
Publisher’s note
All claims expressed in this article are solely those of the authors and do not necessarily represent those of their affiliated organizations, or those of the publisher, the editors and the reviewers. Any product that may be evaluated in this article, or claim that may be made by its manufacturer, is not guaranteed or endorsed by the publisher.
References
Alexander, R. B., Brakebill, J. W., Brew, R. E., and Smith, R. A. (1999). “ERF1 – enhanced river reach file 1.2,” in U.S. Geological survey open-file report 99-457 (Reston, VA: U.S. Geological Survey). Available at: https://water.usgs.gov/lookup/getspatial?erf1.
Alexander, R. B., Smith, R. A., Schwarz, G. E., Boyer, E. W., Nolan, J. V., and Brakebill, J. W. (2008). Differences in phosphorus and nitrogen delivery to the gulf of Mexico from the Mississippi River Basin. Environ. Sci. Tech. 42 (3), 822–830. doi:10.1021/es0716103
Anderson-Teixeira, K. J., Herrmann, V., Banbury Morgan, R., Bond-Lamberty, B., Cook-Patton, S. C., Ferson, A. E., et al. (2021). Carbon cycling in mature and regrowth forests globally. Environ. Res. Lett. 16, 053009. doi:10.1088/1748-9326/abed01
ASCE (2016). Policy statement 360-impact of climate change. Energy, environment and water policy committee, public policy committee, board of direction. American Society of Civil Engineers. Available at: https://www.asce.org/advocacy/policy-statements/ps360–climate-change. Rest. VA
ASCE (2021). Report card for America’s infrastructure. American Society of Civil Engineers. Available at: https://infrastructurereportcard.org.
Bokhari, H. H., Najafi, E., Dawidowicz, J., Wuchen, L., Maxfield, N., Vörösmarty, C. J., et al. (2023). Simulating basin-scale linkages of the food-energy-water nexus with reduced complexity modeling. Front. Environ. Sci. (Special Issue on FEWS).
Browder, G., Ozment, S., Rehberger Bescos, I., Gartner, T., and Lange, G.-M. (2019). Integrating green and gray: Creating next generation infrastructure. Washington, DC: World Resources Institute and The World Bank, 140. doi:10.46830/wrirpt.18.00028
Chang, J. W., Ando, A. W., and Chen, M. (2023). Valuing changes in the portfolio of service flows from climate-induced extremes on a linked Food, Energy, Water System (C-FEWS). Front. Environ. Sci. 11. doi:10.3389/fenvs.2023.1069483
Christian, J. I., Basara, J. B., Otkin, J. A., Hunt, E. D., Wakefield, R. A., Flanagan, P. X., et al. (2019). A methodology for flash drought identification: Application of flash drought frequency across the United States. J. Hydromet. 20, 833–846. doi:10.1175/jhm-d-18-0198.1
Copeland, C. (2016). Clean water Act: A summary of the law. Washington, DC: Congressional Research Service. Available at: https://sgp.fas.org/crs/misc/RL30030.pdf.
Díaz, S., Settele, J., Brondízio, E. S., Ngo, H. T., Agard, J., Arneth, A., et al. (2019). Pervasive human-driven decline of life on Earth points to the need for transformative change. Science 366, eaax3100. doi:10.1126/science.aax3100
Ehsani, N., Vörösmarty, C. J., Fekete, B. M., and Stakhiv, E. Z. (2017). Reservoir operations under climate change: Storage capacity options to mitigate risk. J. Hydrol. 555, 435–446. doi:10.1016/j.jhydrol.2017.09.008
EIA (2022a). EIA (U.S. Energy information administration) – electricity data. Washington, DC: EIA. Available at: https://www.eia.gov/electricity/data.php.
EIA (2022b). EIA (U.S. Energy Information Administration) – form EIA-923 detailed data with previous form data (EIA-906/920). Washington, DC: EIA. Available at: https://www.eia.gov/electricity/data/eia923 [Accessed 12 Oct. 2022].
EPA (2007). U.S. EPA reach file 1 (RF1) for the conterminous United States in BASINS. Washington, DC: U.S. Environmental Protections Agency. Available at: https://www.epa.gov/ceam/metadata-reach-file-1.
EPA (2015). EPA science matters newsletter: From gray to green – helping communities adopt green infrastructure. Washington, DC: Environmental Protection Agency. Available at: https://www.epa.gov/water-research/epa-science-matters-newsletter-gray-green-helping-communities-adopt-green.
European Commission (2016). Background on green infrastructure. Available at: http://ec.europa.eu/environment/nature/ecosystems/background.htm.
Fekete, B. M., Cak, A. D., and Vörösmarty, C. J. (2023). The potential of hydropower to mitigate the intermittency of other renewable energy sources:Analysis for the US Northeast and Midwest. Front. Environ. Sci. (Special Issue on FEWS).
Foster, D. R. (2017). Wildlands and woodlands: Farmlands and communities: Broadening the vision for new england. Cambridge, MA: Harvard University Forest.
Galloway, J. N., and Cowling, E. B. (2002). Reactive nitrogen and the world: 200 Years of change. Ambio 31, 64–71. doi:10.1579/0044-7447-31.2.64
Gelfand, I., Sahajpal, R., Zhang, X., Izaurralde, R. C., Gross, K. L., and Robertson, G. P. (2013). Sustainable bioenergy production from marginal lands in the US Midwest. Nature 493, 514–517. doi:10.1038/nature11811
Green, P. A., Vörösmarty, C. J., Meybeck, M., Galloway, J. N., Peterson, B. J., and Boyer, E. W. (2004). Pre-industrial and contemporary fluxes of nitrogen through rivers: A global assessment based on typology. Biogeochemistry 68, 71–105. doi:10.1023/b:biog.0000025742.82155.92
Green, P. A., Vörösmarty, C. J., Harrison, I., Farrell, T., Sáenz, L., and Fekete, B. M. (2015). Freshwater ecosystem services supporting humans: Pivoting from water crisis to water solutions. Glob. Environ. Change 34, 108–118. doi:10.1016/j.gloenvcha.2015.06.007
Gutzler, D. S., and Robbins, T. O. (2011). Climate variability and projected change in the Western United States: Regional downscaling and drought statistics. Clim. Dyn. 37, 835–849. doi:10.1007/s00382-010-0838-7
Hayes, D. J., McGuire, A. D., Kicklighter, D. W., Gurney, K. R., Burnside, T. J., and Melillo, J. M. (2011). Is the northern high-latitude land-based CO2 sink weakening? Glob. Biogeochem. Cycles 25, 1–14. doi:10.1029/2010gb003813
Hayhoe, K., VanDorn, J., Croley, T., Schlegal, N., and Wuebbles, D. (2010). Regional climate change projections for chicago and the US great lakes. Great Lakes. J. Gt. Lakes. Res. 36, 7–21. doi:10.1016/j.jglr.2010.03.012
Hill, C., DeLuca, C., Balaji, V., Suarez, M., and Da Silva, A. (2004). The architecture of the earth system modeling framework. Comput. Sci. Eng. 6 (1), 18–28. doi:10.1109/mcise.2004.1255817
Hirsch, R. M., and Ryberg, K. R. (2012). Has the magnitude of floods across the USA changed with global CO2 levels? Hydrol. Sci. J. 57, 1–9. doi:10.1080/02626667.2011.621895
Howarth, R. W., Billen, G., Swaney, D., Townsend, A., Jaworski, N., Lajtha, K., et al. (1996). Regional nitrogen budgets and riverine N and P fluxes for the drainages to the North Atlantic Ocean: Natural and human influences. Biogeochemistry 35, 75–139. doi:10.1007/bf02179825
Jin, C., Luo, X., Xiao, X., Dong, J., Li, X., Yang, J., et al. (2019). The 2012 flash drought threatened US midwest agroecosystems. Chin. Geogr. Sci. 29, 768–783. doi:10.1007/s11769-019-1066-7
Karl, T. R., Melillo, J. M., and Peterson, T. C. (2009). Global climate change impacts in the United States. Cambridge, UK; New York, NY: Cambridge University Press.
Kicklighter, D. W., Hayes, D. J., McClelland, J. W., Peterson, B. J., McGuire, A. D., and Melillo, J. M. (2013). Insights and issues with simulating terrestrial DOC loading of Arctic river networks. Ecol. Appl. 23, 1817–1836. doi:10.1890/11-1050.1
Kicklighter, D. W., Lin, T.-S., Zhang, J., Chen, M., Vörösmarty, C. J., Jain, A., et al. (2023). Influence of forest infrastructure on the responses of ecosystem services to climate extremes in the Midwest and Northeast United States from 1980 to 2019. Front. Environ. Sci. (Special Issue on FEWS).
Kling, C. L., Arritt, R. W., Calhoun, G., and Keiser, D. A. (2017). Integrated assessment models of the food, energy, and water nexus: A review and an outline of research needs. Ann. Rev. Resour. Econ. 9, 143–163. doi:10.1146/annurev-resource-100516-033533
Kunkel, K. E., Liang, X.-Z., and Zhu, J. (2010). Regional climate model projections and uncertainties of U.S. Summer heat waves. J. Clim. 23, 4447–4458. doi:10.1175/2010jcli3349.1
Kunkel, K. E., Karl, T. R., Brooks, H., Kossin, J., Lawrimore, J. H., Arndt, D., et al. (2013a). Monitoring and understanding trends in extreme storms: State of knowledge. B. Am. Meteorol. Soc. 94, 499–514. doi:10.1175/bams-d-11-00262.1
Kunkel, K. E., Stevens, L. E., Stevens, S. E., Sun, L., Janssen, E., Wuebbles, D. J., et al. (2013b). Regional climate trends and scenarios for the U.S. National climate assessment: Part 1. Climate of the Northeast U.S. Silver Spring, MD: NOAA NESDIS.
Lin, T.-S., Jain, A., Kheshgi, H. S., Song, Y., and Vörösmarty, C. J. (2023). Which crop has the highest bioethanol yield and water use efficiency in the United States of America? Front. Environ. Sci. (Special Issue on FEWS).
Maxfield, N. E., Smith, R. A., Chang, J., Ando, A. W., Lin, T.-S., and Vörösmarty, C. J. (2023). Modeling the impact of technology, management, and policy-related strategies on CONUS water quality and ecosystem services. Front. Environ. Sci. (Special Issue on FEWS).
McDonald, R. I., Weber, K. F., Padowski, J., Boucher, T., and Shemie, D. (2016). Estimating watershed degradation over the last century and its impact on water-treatment costs for the world’s large cities. P. Natl. Acad. Sci. 113, 9117–9122. doi:10.1073/pnas.1605354113
McGuire, A. D., Hayes, D. J., Kicklighter, D. W., Manizza, M., Zhuang, Q., Chen, M., et al. (2010). An analysis of the carbon balance of the Arctic Basin from 1997 to 2006. Tellus B Chem. Phys. Meteorol. 62, 455–474. doi:10.1111/j.1600-0889.2010.00497.x
McKinsey & Company (2006). “Charting our water future: Economic frameworks to inform decision-making,” in The 2030 water resources group (McKinsey, Inc.), 198. Available at: https://www.mckinsey.com/∼/media/mckinsey/dotcom/client_service/sustainability/pdfs/charting%20our%20water%20future/charting_our_water_future_full_report_.ashx.
Melillo, J. M., Reilly, J. M., Kicklighter, D. W., Gurgel, A. C., Cronin, T. W., Paltsev, S., et al. (2009). Indirect emissions from biofuels: How important? Science 326, 1397–1399. doi:10.1126/science.1180251
Miara, A., Vörösmarty, C. J., Stewart, R. J., Wollheim, W. M., and Rosenzweig, B. (2013). Riverine ecosystem services and the thermoelectric sector: Strategic issues facing the northeastern United States. Environ. Res. Lett. 8, 025017. doi:10.1088/1748-9326/8/2/025017
Miara, A., Macknick, J. E., Vörösmarty, C. J., Tidwell, V., Newmark, R., and Fekete, B. (2017). Climate and water resource change impacts and adaptation potential for U.S. power supply. Nat. Clim. Change 7, 793–798. doi:10.1038/nclimate3417
Miara, A., Cohen, S. M., Macknick, J., Vörösmarty, C. J., Corsi, F., Sun, Y., et al. (2019). Climate-water adaptation for future US electricity infrastructure. Environ. Sci. Technol. 53, 14029–14040. doi:10.1021/acs.est.9b03037
Miara, A., and Vörösmarty, C. J. (2013). A dynamic model to assess tradeoffs in power production and riverine ecosystem protection. Environ. Sci. Process. Impacts 15, 1113–1126. doi:10.1039/c3em00196b
Munyasya, B. M., and Chileshe, N. (2018). Towards sustainable infrastructure development: Drivers, barriers, strategies, and coping mechanisms. Sustainability 10 (12), 4341. doi:10.3390/su10124341
Peterson, T. C., Heim, R. R., Hirsch, R., Kaiser, D. P., Brooks, H., Diffenbaugh, N. S., et al. (2013). Monitoring and understanding changes in heat waves, cold waves, floods, and droughts in the United States: State of knowledge. B. Am. Meteorol. Soc. 94, 821–834. doi:10.1175/bams-d-12-00066.1
Pryor, S. C., Scavia, D., Iverson, L., Patz, J., and Robertson, G. P. (2014). “Ch. 18: Midwest,” in Climate change impacts in the United States: The third national climate assessment. Editors J. M. Melillo, T. Richmond, and G. W. Yohe (Washington, DC: U.S. Global Change Research Program), 418–440. Available at: http://nca2014.globalchange.gov/report/regions/midwest.
Sanyal, S., and Wuebbles, D. (2023a). Changing nature of the extremes: 1. Droughts and heat waves in CONUS. Climate. (Special Issue on Extreme Precipitation in a Changing Climate) (in preparation).
Sanyal, S., and Wuebbles, D. (2023b). Changing nature of the extremes: 2. Extreme precipitation, cold waves and compound extremes in CONUS. Climate. (Special Issue on Extreme Precipitation in a Changing Climate) (in preparation).
Stewart, R. J., Wollheim, W. M., Miara, A., Vörösmarty, C. J., Fekete, B., Lammers, R. B., et al. (2013). Horizontal cooling towers: Riverine ecosystem services and the fate of thermoelectric heat in the contemporary Northeast US. Environ. Res. Lett. 8, 025010. doi:10.1088/1748-9326/8/2/025010
Tian, H., Melillo, J., Lu, C., Kicklighter, D., Liu, M., Ren, W., et al. (2011). China’s terrestrial carbon balance: Contributions from multiple global change factors. Glob. Biogeochem. Cycles 25, 1–16. doi:10.1029/2010gb003838
Tuler, S. P., Webler, T., Hansen, R., Vörösmarty, C. J., Melillo, J. M., and Wuebbles, D. (2023). How modelers, planners, and stake holders understand the decision landscape of integrated regional food, energy, and water systems. Front. Environ. Sci.2 (Special Issue on FEWS).
U.S. Census Bureau (2022). Data Try out our new way to explore data. Washington, DC: U.S. Census Bureau. Available at: https://www.census.gov/data.html.
USDA-ERS (2021). Datasets: Fertilizer use and price. Available at: http://www.ers.usda.gov/data-products/fertilizer-use-and-price.aspx.
USGCRP (2017). Climate science special report: Fourth national climate assessment, volume 1. Washington, DC: U.S. Global Change Research Program, 447.
Vörösmarty, C. J., Melillo, J., Wuebbles, D. J., Jain, A. K., Ando, A., Tuler, S., et al. The C-FEWS framework: Supporting studies of climate-induced extremes on food, energy, and water systems at the regional scale. Front. Environ. Sci. 11. doi:10.3389/fenvs.2023.1069613
Vörösmarty, C. J., Rodríguez Osuna, V., Cak, A. D., Bhaduri, A., Bunn, S. E., Corsi, F., et al. (2018). Ecosystem-based water security and the sustainable development goals (SDGs). Ecohydrol. Hydrobiol. 18, 317–333. doi:10.1016/j.ecohyd.2018.07.004
Vörösmarty, C. J., Stewart-Koster, B., Green, P. A., Boone, E. L., Flörke, M., Fischer, G., et al. (2021). A green-gray path to global water security and sustainable infrastructure. Glob. Environ. Change 70, 102344. doi:10.1016/j.gloenvcha.2021.102344
Vose, R. S., Applequist, S., Bourassa, M. A., Pryor, S. C., Barthelmie, R. J., Blanton, B., et al. (2014). Monitoring and understanding changes in extremes: Extratropical storms, winds, and waves. B. Am. Meteorol. Soc. 95, 377–386. doi:10.1175/bams-d-12-00162.1
Walsh, J., Wuebbles, D., Hayhoe, K., Kossin, J., Kunkel, K., Stephens, G., et al. (2014). “Ch. 2: Our changing climate,” in Climate change impacts in the United States: The third national climate assessment. Editors J. M. Melillo, T. Richmond, and G. W. Yohe (Washington, DC: U.S. Global Change Research Program). Available at: hdtp://nca2014.globalchange.gov/report#submenu-report-our-changing-climate.
Weaver, C. P., Lempert, R. J., Brown, C., Hall, J. A., Revell, D., and Sarewitz, D. (2012). Improving the contribution of climate model information to decision making: The value and demands of robust decision frameworks. Wiley Interdiscip. Rev. Clim. Change 4, 39–60. doi:10.1002/wcc.202
Webler, T., Tuler, S., and Dietz, T. (2011). Modellers' and outreach professionals' views on the role of models in watershed management. Environ. Pol. Gov. 21, 472–486. doi:10.1002/eet.587
Werner, S., Lemos, S. R., McLeod, A., Halstead, J. M., Gabe, T., Huang, J.-C., et al. (2019). Prospects for new england agriculture: Farm to fork. Agric. Resour. Econ. Rev. 48, 473–504. doi:10.1017/age.2019.33
Wolfe, D. W., DeGaetano, A. T., Peck, G. M., Carey, M., Ziska, L. H., Lea-Cox, J., et al. (2017). Unique challenges and opportunities for northeastern US crop production in a changing climate. Clim. Change 146, 231–245. doi:10.1007/s10584-017-2109-7
Wollheim, W. M., Vörösmarty, C. J., Bouwman, A. F., Green, P., Harrison, J. A., Meybeck, M., et al. (2008). A spatially distributed framework for aquatic modeling of the Earth system (FrAMES). Glob. Biogeochem. Cycles 22. doi:10.1029/2007gb002963
Wuebbles, D. J., Hayhoe, K., and Parzen, J. (2010). Introduction: Assessing the effects of climate change on chicago and the great lakes. J. Gt. Lakes. Res. 36, 1–6. doi:10.1016/j.jglr.2009.09.009
Wuebbles, D., Kunkel, K., Wehner, M., and Zobel, Z. (2014a). Severe weather in United States under a changing climate. Eos, Trans. AGU 95, 149–150. doi:10.1002/2014eo180001
Wuebbles, D., Meehl, G., Hayhoe, K., Karl, T. R., Kunkel, K., Santer, B., et al. (2014b). CMIP5 climate model analyses: Climate extremes in the United States. B. Am. Meteorol. Soc. 95, 571–583. doi:10.1175/bams-d-12-00172.1
WWAP (2018). The united nations world water development report 2018: Nature-based solutions for water. Paris: World Water Assessment Programme, UNESCO. Available at: https://www.unwater.org/publications/world-water-development-report-2018.
Young, S. C. (2000). The emergence of ecological modernisation: Integrating the environment and the economy? London: Routledge.
Zhang, J., Chen, M., Gao, S., Li, Z., Vörösmarty, C. J., Fekete, B. M., et al. (2023). Examining the policy, technology, and climate impacts on thermoelectric power production and river thermal pollution in the Midwest and Northeast of the United States. Front. Environ. Sci. (Special Issue on FEWS).
Keywords: fews, climate extremes, nature-based infrastructure, engineered infrastructure, regional environmental assessment, regional multi-sectoral planning
Citation: Vörösmarty CJ, Melillo JM, Wuebbles DJ, Jain AK, Ando AW, Chen M, Tuler S, Smith R, Kicklighter D, Corsi F, Fekete B, Miara A, Bokhari HH, Chang J, Lin T-S, Maxfield N, Sanyal S and Zhang J (2023) Applying the framework to study climate-induced extremes on food, energy, and water systems (C-FEWS): The role of engineered and natural infrastructures, technology, and environmental management in the United States Northeast and Midwest. Front. Environ. Sci. 11:1070144. doi: 10.3389/fenvs.2023.1070144
Received: 14 October 2022; Accepted: 31 January 2023;
Published: 08 March 2023.
Edited by:
Lynn Donelson Wright, William & Mary’s Virginia Institute of Marine Science, United StatesReviewed by:
G. Philip Robertson, Michigan State University, United StatesCharles Reid Nichols, Marine Information Resources Corporation, United States
Copyright © 2023 Vörösmarty, Melillo, Wuebbles, Jain, Ando, Chen, Tuler, Smith, Kicklighter, Corsi, Fekete, Miara, Bokhari, Chang, Lin, Maxfield, Sanyal and Zhang. This is an open-access article distributed under the terms of the Creative Commons Attribution License (CC BY). The use, distribution or reproduction in other forums is permitted, provided the original author(s) and the copyright owner(s) are credited and that the original publication in this journal is cited, in accordance with accepted academic practice. No use, distribution or reproduction is permitted which does not comply with these terms.
*Correspondence: Charles J. Vörösmarty, Y3Zvcm9zbWFydHlAZ21haWwuY29t