 Hussain H. Bokhari1*
 Ehsan Najafi1Jorin Dawidowicz1,2Liushan Wuchen1,3
 Nicolas Maxfield1
 Charles J. Vörösmarty1,4
 Balazs M. Fekete1,4
 Fabio Corsi1Swarnali Sanyal5
 Tzu-Shun Lin5†
 Ariel Miara1
 Seth P. Tuler6,7
- 1CUNY Advanced Science Research Center at the Graduate Center, Environmental Sciences Initiative, New York, NY, United States
- 2CUNY City College of New York, Chemical Engineering, New York, NY, United States
- 3CUNY City College of New York, Environmental Engineering, New York, NY, United States
- 4CUNY City College of New York, Civil Engineering, New York, NY, United States
- 5University of Illinois at Urbana Champaign, Department of Atmospheric Sciences, Urbana, IL, United States
- 6Worcester Polytechnic Institute, Department of Integrative and Global Studies, Worcester, MA, United States
- 7Social and Environmental Research Institute, Northampton, MA, United States
There is a rapidly growing need to communicate to the public and policymakers on the nature and impact of climate change and its associated extremes, which manifest themselves across essential Food-Energy-Water Systems (FEWS). The complexity of this nexus demands analytical tools that can capture the essence of FEWS with the climate system, which may be difficult to stage and implement from a computationally efficient point-of-view. Reduced Complexity Models (RCMs) can synthesize important facets of a system quickly and with less dependence on difficult-to-assign inputs. We report on the development of an RCM framework for the FEWS nexus, to serve as a basic research tool in facilitating parameter sensitivity experiments as well as a means to establish more insightful dialogue with stakeholders through joint scenario construction. Three stand-alone and coupled models at the basin scale have been configured using Stella Architect software to simulate: 1) major flows and storage of water, 2) power plant operations and subsequent impacts on river reaches; and 3) nitrogen (N) mobilization and transport from atmospheric and landmass sources to riverine receiving waters. The Delaware River Basin is chosen for a contemporary simulation test case. Modeled results are calibrated and validated using observed stream gauge data, indicating reliable model performance at the monthly and annual time steps (0.57 < NSE < 0.98). A set of single and multi-factor climate, technology, and policy experiments are then explored using the RCM framework. Basin-scale system sensitivities are investigated across a set of intensified climate extremes, revealing the crucial roles of sewage treatment and energy infrastructure for climate resilience, significant exacerbations as well as mitigations of thermal and N pollution under opposing climate extremes, and important tradeoffs between river temperature and electricity production that are explored with technology and policy scenarios.
1 Introduction
The provision, consumption, and security of food, energy, and water define a critical juncture of sustainable human development and the natural environment (UN General Assembly, 2015; Nerini et al., 2017). One of the most significant challenges for the 21st century is the management and distribution of these increasingly constrained resources to meet the growing and shifting demands of global populations and economies (Liu et al., 2018; Grasso, 2019). This challenge is also contextualized in and further exacerbated by an unpredictable and changing climate, which is increasing the frequency and severity of extreme weather events such as droughts, heat waves, cold waves, and extreme precipitation (Brown et al., 2015; USGCRP, 2018; Weiskopf et al., 2020). An interdisciplinary and holistic approach to this local-to-global challenge is offered in the nexus of Food-Energy-Water Systems (FEWS), describing the complex and interdependent linkages among shared natural resources and sector productions and consumptions (Nerini et al., 2017).
In the United States, over 400 billion gallons of water are withdrawn daily for domestic, agriculture, energy generation, and other uses (Copeland and Carter, 2017). The supply and quality of water resources are crucial factors in assessing climate and anthropogenic impacts on the FEWS nexus as well as the tradeoffs that emerge from the diverse uses of the competed resource (Cai et al., 2018; D'Odorico et al., 2018; Izaurralde et al., 2010; Brutsaert, 2005). Water use for thermoelectric power, irrigation, and public supplies amount to 90% of total withdrawals in the U.S., with the two largest sources of water use being thermoelectric power and irrigation (Dieter, 2018). Thermoelectric power plants, which account for nearly 85% of electricity generated and 41% of total water withdrawals in the U.S., rely predominantly on freshwater resources to cool reactors and transport waste heat in order to maintain optimal production efficiencies (Miara and Vörösmarty, 2013a; Miara and Vörösmarty, 2013b; Diehl et al., 2013; Miara et al., 2013; Stewart et al., 2013; Miara et al., 2017). Depending on the cooling technology and water source utilized, power plants primarily discharge waste heat directly into natural water bodies (Once-through Cooling) or consume a fraction of the water, that is, used for cooling (Recirculating Cooling System), resulting in elevated water temperatures and reduced water flows in nearby rivers and coastal zones (Miara and Vörösmarty, 2013a; Miara and Vörösmarty, 2013b; Diehl et al., 2013; Miara et al., 2013; Stewart et al., 2013; Miara et al., 2017). These compounding impacts along shared waterways can manifest not only in reduced cooling efficiencies and subsequent power losses for downstream power plants, but also in the impairment of waterways for downstream aquatic ecosystems by adversely affecting migration patterns, nutrient concentrations, and water visibility (Minshall et al., 1980; Caissie, 2006; EPA, 2015). Recognizing these imperative issues, environmental regulations like the federal Clean Water Act (CWA) impose river temperature thresholds to prohibit intense disruptions to the thermal regime of river systems (Copeland, 2016).
Simultaneously, agriculture and water distribution and treatment, which account for 40% and 12% of total water withdrawals in the U.S. respectively, depend on reliable and affordable energy supplies (Hitaj and Suttles, 2016; Copeland and Carter, 2017). The agriculture and water sectors, together with the industrial sector, also share an additional tradeoff in the form of nitrogen (N) pollution in waterways. Intensive agricultural and industrial development have accelerated productions of reactive N (e.g., synthetic fertilizer use, livestock waste, fossil fuel combustion, materials manufacturing), while poor waste management and population growth have driven reactive N loading through human sewage disposal (Green et al., 2004; Davidson et al., 2012; Baron et al., 2013; Passeport et al., 2013; Khan and Mohammad, 2014). As a result, the U.S. N cycle has been altered to a greater extent than the global average, with anthropogenic sources of N amounting to four times that of natural fixation sources (Davidson et al., 2012). Contaminated waters from excess point and non-point source N pollution have impaired one third of all streams and two fifths of all lakes in the U.S. due to the increased prevalence of hypoxic, turbid, and eutrophic waters (Davidson et al., 2012; Baron et al., 2013; Khan and Mohammad, 2014). These biochemical implications pose severe consequences for commercial fishing, in-land recreation, water treatment costs, human health, and aquatic biodiversity (Baron et al., 2013; Khan and Mohammad, 2014). Potential mitigation strategies include strengthened regulations of N oxide emissions, improved drainage systems and efficient fertilizer use in agriculture, and advanced sewage treatment technology and infrastructure (Davidson et al., 2012; Passeport et al., 2013).
The resource linkages, technologies, policies, and human-nature interactions described here are illustrations of the complex FEWS relationships that are the focus of integrated assessments of the FEWS nexus, which have rapidly gained recognition in the last decade as essential to understanding and promoting socioeconomic and climate resilience (Proctor et al., 2021). A growing body of FEWS modeling literature at many spatiotemporal scales has explored the impacts of technology and infrastructure advancements, opportunities to evaluate tradeoffs among competed resources, and the development of informed strategies and partnerships among public and private stakeholders (Cai et al., 2018; D'Odorico et al., 2018; Proctor et al., 2021; Albrecht et al., 2018; Bazilian et al., 2011a; Dargin et al., 2019; Chang et al., 2016; Keairns et al., 2016; Mohammadpour et al., 2019). While reviews of integrated resource assessment models focused on FEWS substantiate the progress and achievements made in capturing the complex dynamics of individual and coupled systems, a critical limitation is revealed in the application of these modeling tools at local scales and for decision-making purposes (Bazilian et al., 2011b; Leck et al., 2015; Dargin et al., 2019). Modeling tools with greater complexity generally offer more comprehensive analyses with the capacity to study intricate FEWS linkages and features, but they are notably limited by the constraints of model complexity and uncertainty, including the availability of intensive and high-resolution data inputs, reliance on extensive model calibrations, and high computational resource demands and turnaround (Kaddoura and El Khatib, 2017; Dargin et al., 2019). These limitations prove most challenging when engaging with stakeholders, who may work in a wide range of sectors (e.g., government, business, NGO, CSO), have different skillsets and time constraints, and seek assessments and solutions for certain spatiotemporal scales and domains of relevance (Brugnach et al., 2008; Bazilian et al., 2011b; Leck et al., 2015; Kaddoura and El Khatib, 2017; Dargin et al., 2019).
Comparisons of simplified (alternatively ‘moderately-complex’ or ‘reduced complexity’) models with more comprehensive and complex models reveal, unsurprisingly, that simplified modeling is inherently limited in its capacity to simulate more complete spatial distributions and sophisticated features of resource systems. However, when tailored to and calibrated for more specific system applications and spatiotemporal domains, simplified models can demonstrate predictive accuracies on par with or better than their complex counterparts, while benefiting from greater input and feature flexibility and quicker turnaround speeds (Michaud and Sorooshian, 1994; Singh and Marcy, 2017; Birhanu et al., 2018; Nicholls et al., 2020; Nicholls et al., 2021). Simplified water-based models configured in Stella, a dynamic computer modeling package with an easy-to-interpret visual interface (ISEE systems, 2022), have also demonstrated the strong potential of simplified models as practical resource management tools at the basin-scale, with the ability to more seamlessly couple FEWS linkages (Izaurralde et al., 2010), explore socio-environmental scenarios (Izaurralde et al., 2010; Chichakly et al., 2013; Yang et al., 2015), and evaluate multi-objective optimized solutions for tradeoffs (Chichakly et al., 2013). Simplified models working in tandem with complex models can offer an optimal methodology for integrated climate and resource assessments, which both offsets the limitations and highlights the advantages of each modeling approach (Dargin et al., 2019; Nicholls et al., 2020; Nicholls et al., 2021). A diversity in model computing demands, spatial and temporal resolution requirements, and complexities of simulated features, therefore, lends a more applicable set of frameworks in which to design experiments and proposals for the FEWS nexus and seek insightful dialogue with stakeholders.
In this paper, the development and application of a suite of stand-alone and coupled Reduced Complexity Models (RCMs) is presented as part of a larger modeling framework studying Climate-induced extremes on FEWS (C-FEWS) (Vörösmarty et al., 2023). The RCM framework was designed primarily as a diagnostic tool that can be used to more dynamically understand and explore FEWS linkages, where the existing C-FEWS models are otherwise limited by higher computational burdens and spatiotemporal resolution requirements. We aim to configure the RCMs through simplified adaptations of the working and validated functionalities of more complex models, allowing the RCM framework to report on the most significant and generalized assessments produced by these respective counterpart models. With the benefits of coarser resolution characteristics and simplified representations of socioenvironmental features, the RCM framework can also be employed as an experimental tool for scenarios and parameter sensitivities in stakeholder engagement efforts, for which rapid and dynamic model processes are exceptionally valuable (Dargin et al., 2019). Building on the reputed ‘three-way tradeoff’ concept in modeling (Levins, 1966), our principle task in configuring each RCM is to achieve sufficiency among four tradeoffs of model building: realism of bio-geophysical processes being simulated; simplicity in understanding, debugging, and altering simulation conditions; precision in creating reasonable quantitative approximations; and flexibility to spatial, temporal, and input changes. Guided by this methodology, many potential linkages, spatial and temporal scales, and outputs were considered for RCM configuration based on their significance within the FEWS context as well as the potential for formal coupling across individual models. We present here the first stage in our exploration of FEWS dynamics with RCMs, focused on the basin-scale dynamics of hydrology, thermal pollution and energy, and nitrogen mobilization and transport within a linked modeling framework.
Three mass and energy balanced RCMs were adapted in part from three respective complex, fully spatially distributed counterpart models used in the C-FEWS framework: Water Balance Model/Water Transport Model (WBM/WTM) (Vörösmarty et al., 1989; Vörösmarty et al., 1998), Thermoelectric Power & Thermal Pollution Model (TP2M) (Miara and Vörösmarty, 2013a; Miara and Vörösmarty, 2013b; Miara et al., 2013; Stewart et al., 2013), and SPAtially Referenced Regression On Watershed attributes (SPARROW) (Moore et al., 2004; Ator et al., 2011; Hoos et al., 2013; Saleh and Domagalski, 2015). A global constituent transport model developed by Green et al., (2004), which is not used in the current C-FEWS framework, is also an essential part of the RCM adaptation methodology. The three standalone RCMs are coupled via first order linkages using shared hydrological characteristics of a river basin system to simulate: 1) major fluxes and stocks of the terrestrial water cycle, including snowmelt and rainfall runoff, evapotranspiration, river discharge, and reservoir operations at the daily time scale; 2) the impacts of power plant operation on downstream river temperature, water consumption, and power generation at the daily time scale; 3) nitrogen mobilization and transport from atmospheric and landmass sources to riverine receiving waters at the annual time scale. It is important to note that while the food aspect of FEWS is not explicitly simulated in the RCMs (e.g., crop yields, irrigation, etc.), the framework captures N loading attributed to the agricultural sector (i.e., industrial fertilizer application and livestock waste). The RCM framework is built in Stella Architect modeling software, which provides a visual interface of model functionalities, that is, both engaging for unfamiliar users and undemanding when tailoring and exploring new features and scenarios of interest (ISEE systems, 2022). The RCMs also deliver results and analyses in near-real time, with turnarounds ranging from a few seconds to a minute, providing valuable feedback to internal modelers and external stakeholders alike.
The RCM framework is then applied in a simulation test case of the Delaware River Basin. We aggregate climate, infrastructural, social, and hydrological inputs of varied spatial resolution (12 km grid cells to county-level reports) to the basin-scale. The RCM framework is calibrated and validated within a 15-year period (1995-2009) using observed data available for river discharge, river water temperature, and riverine N concentration. The framework is then explored in single and multi-factor experiments in the form of intensified climate extremes (i.e., drought, heat waves, and extreme precipitation), regulatory thermal pollution control by the CWA, power plant cooling technology, and sewage treatment infrastructure. These scenarios are devised to demonstrate the exploratory capacity of the RCM framework in assessing basin-scale system sensitivities to progressive impacts on the FEWS simulated. The multi-factor experiments reveal a multitude of impacts from climate extremes on the Delaware River Basin’s water supply and quality, primarily through the opposing effects of the drought and extreme precipitation climate scenarios. Climate and sewage treatment infrastructure are simulated to have impacts of similar scale regarding N concentration levels downstream of the basin, suggesting that climate-infrastructure links may play a significant role in N pollution abatement. Power plant cooling technology and environmental regulation (CWA) are found to outweigh the impacts of climate with respect to thermal pollution and electricity production in the basin, supporting contemporary shifts from OTC to RCS technologies in the basin. The experiments emphasize, above all, the importance of infrastructure advancements as a beneficial climate resilience strategy.
2 Materials and methods
2.1 Case study: Delaware River Basin
The Delaware River Basin comprises portions of 4 Northeastern states (New York, Pennsylvania, New Jersey, and Delaware), 42 counties, and 868 municipalities, with a total area of 13,549 sq. miles. The basin’s 2,000 tributaries flow into the 330-mile long Delaware River, including the Schuylkill and Lehigh Rivers in Pennsylvania (Delaware River Basin Commission, 2019; Schmidt, 2019). The basin supports a valuable water-based economy (e.g., recreation, water supply, fishing, ecotourism, and agriculture) that generates over $21 billion per year and supports 600,000 jobs (Kauffman, 2011; Kauffman, 2016; Kauffman, 2018; Delaware River Basin Commission, 2019; Schmidt, 2019). The Delaware River is home to a number of freshwater aquatic habitats that support perennial trout fisheries, the migrations of native fish species including striped bass and Atlantic sturgeon, and the breeding of horseshoe crabs (Delaware River Basin Commission, 2019). Land cover in the basin can be broadly described as tree canopy cover in the northern half and developed and agricultural land cover in the lower half (Delaware River Basin Commission, 2019; Schmidt, 2019). The northern section of the Delaware River, 200 miles above Trenton, NJ, is non-tidal, while the river segment below Trenton, including the Delaware Bay where the river meets the Atlantic Ocean, is tidal with a mix of saline and freshwater (Delaware River Basin Commission, 2019; Schmidt, 2019).
The basin is an ideal candidate for our RCM study because it is characterized by socio-environmental conflicts surrounding FEWS linkages, namely, competition for freshwater use. Water withdrawals in the basin total roughly 6.6 billion gallons per day, primarily for thermoelectric power, public supply, and industrial uses, with almost 1 billion gallons of water consumed or diverted as inter-basin transfers (Delaware River Basin Commission, 2019; Schmidt, 2019). The basin’s water supply serves a population of over 13 million people, including water distributed to about 5 million people in New York City and northern New Jersey (Delaware River Basin Commission, 2019; Schmidt, 2019). Owing to the complexity of competing political interests, the nation’s first federal-interstate agreement to regulate basin-scale water management was established in 1961 to create the Delaware River Basin Commission (DRBC) (Delaware River Basin Commission, 2019; Schmidt, 2019). The basin also has a history of water quality issues arising from point and non-point source nutrient pollution, including human and livestock waste and fertilizer and pesticide runoff, that previously stimulated the development of hypoxic dead zones in the Delaware Bay (Kauffman, 2010). Following the passage of the Clean Water Act (CWA), upgraded waste treatment plants and water quality monitoring gauges strongly curtailed nutrient concentrations since the 1970s and largely restored economic activity in the basin (Kauffman, 2018; Delaware River Basin Commission, 2019). However, water quality continues to be a prevalent issue today, with about 97% of rivers and streams in Delaware (downstream of the basin) categorized as impaired for all uses, more than any other state in the U.S. (EIP, 2022).
We compose six sub-basin regions in the Delaware River Basin using 12-digit and 8-digit Hydrologic Unit Boundary (HUC) areas based on the confluences of major rivers in the basin (Figure 1). This allows the RCM framework to simulate human-water activities for each of the major river systems in the basin as individual sub-basin modules within the RCM framework. The modules interact in the order of streamflow direction, transporting discharge, thermal impacts, and N flux downstream of each respective sub-basin region (i.e., regions 1 and 2 flow into region 3 which flows into region 4, and regions 4 and 5 flow into region 6). The remaining estuarian and tidal waters of the basin below region 6, along with their respective catchment areas, are excluded from our study. We simulate infrastructure operations for 8 major reservoirs regulated by the DRBC, as well as 26 instream thermoelectric power plants. The operation of sewage treatment plants is uniformly applied in each sub-basin region using county-level population statistics to determine sewage extent. Two sets of climate data are aggregated to the basin-scale for use in the RCM Framework. Inputs from prescribed climate forcings from the North American Land Data Assimilation System Phase 2 (NLDAS-2) (Xia et al., 2012a; Xia et al., 2012b) are used for a contemporary 15-year simulation test case (1995-2009), used for all model validations and calibrations. A set of intensified climate extremes (drought, heat wave, and extreme precipitation) is then produced for the last decade of a 40 year period (1980-2019) using repeated 3-year intervals beginning at the onset of intense climate extremes (Supplementary Appendix SA1).
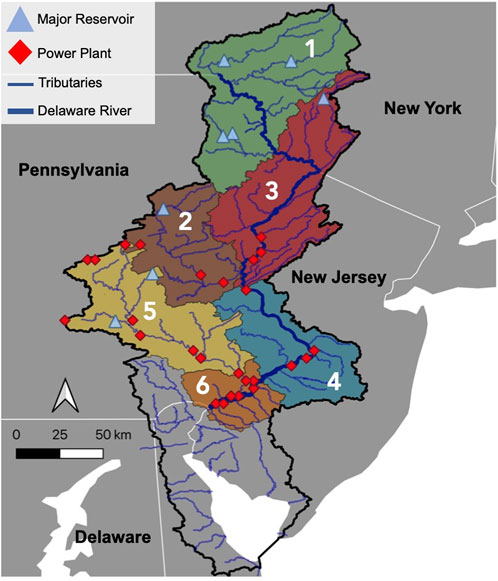
FIGURE 1. Map of the Delaware River Basin identifying six numbered sub-basin regions, major tributaries (thin blue line), and the Delaware River (thick blue line). The locations of 8 major reservoirs (blue triangle) and 26 thermoelectric power plants (red diamond) simulated in the RCM framework are shown. The tidal waters and corresponding catchment areas of the basin below region 6 are excluded from our study.
2.2 RCM methodology and structure
Following extensive literature reviews, the features and equations used in the respective complex counterpart models as well as a series of parameter sensitivity analyses guided the specification of simplified conditions, assumptions, aggregations, and weighted averages in the development of the three deterministic RCMs. The first goal of our RCM configurations was to sufficiently capture expected system behaviors (i.e., for hydrology, thermal pollution and energy, and nitrogen mobilization and transport) for a theoretical river basin, while remaining flexible to future spatial, temporal, and input changes. The models were ultimately fitted with equations and feature attributes, in a mass and energy balanced framework, that perform reliably well under a generalized parameterization at the basin-scale while achieving a dynamic steady state. All inputs are ultimately represented as sub-basin region-wide values, including real terrain characteristics, climate variables, soil and sediment portfolios, geometries of rivers and contributing streams, and the specifications of power plants, sewage treatment plants, and reservoirs (Supplementary Appendix SA2). Spatial aggregations of input variables and parameters were performed in QGIS, calculated as zonal means using shapefiles for each of the six sub-basin regions identified for the Delaware River Basin. Model validations are performed using two statistical variance comparisons: Nash-Sutcliffe model Efficiency coefficient (NSE) (Hirsch and De Cicco, 2015) and modified Index of Agreement (d) developed by Willmott et al. (2012). Model calibrations were performed using Stella Architect’s calibration feature, with available observed data as well as results from the complex counterpart models that used identical climate, land cover, and other inputs. The USGS gauge stations selected are situated on the major river segment of the sub-basin regions, with continuous data availability within the 1995-2009 validation period (USGS, 2021). Three gauge stations provide observed river discharge with positions near the downstream of the sub-basin region (corresponding to regions 2, 3, and 5) and two stations provide ambient water temperature (corresponding to regions 2 and 3). LOADEST software is made available by USGS and provides validated nutrient concentration estimates at the daily time scale based on observed data from water quality monitoring stations (corresponding to regions 2 and 5) (USGS, 2016). Since daily concentrations are not available as a continuous time series, the R software package EGRET is used to calculate long-term trends in total N concentration. Observed USGS river discharges are then applied to these concentrations to compute annual N flux for sub-basin regions 2 and 5 (Hirsch and De Cicco, 2015). All sources and equations used in the following methodology sections are found in the Supplementary Materials (Supplementary Appendix SA3.1–3.3).
2.2.1 RCM “hydrology”
The “hydrology” RCM is derived in part from WBM/WTM (Vörösmarty et al., 1989; Vörösmarty et al., 1998), a water balance and transport model organized by geospatially referenced grid cells and river networks. The RCM adaptation uses aggregated variable inputs (daily averaged precipitation, daily averaged air temperature, annual land cover) as well as parameter inputs (sand-silt-clay soil composition ratio, soil rooting depth, river channel length, basin latitude) at the basin-scale. A number of parameters related to soil characteristics are estimated from ranges associated with each respective sand-silt-clay soil composition (porosity, saturated hydraulic conductivity, saturated and residual water content, field capacity, and wilting point). Land cover is aggregated into four major land cover categories (developed, agricultural, natural, and open water), and a runoff ‘Curve Number’ is estimated from ranges associated with each respective land category. Other parameters are either estimated or calibrated, using reasonable ranges or as defined in technical reports and journal papers when available (river channel width, maximum depth, slope, and roughness; aquifer depth, slope, and porosity; hydraulic head; and a number of associated coefficients). All model outputs are at the daily time step, but are averaged to the monthly and annual scales for validations and reporting. A single river stock for each respective sub-basin region represents the water storage of the major river segment in the sub-basin region, with the assumption that all interconnected streams flow instantaneously to the river segment present.
The RCM simulates distinctly arrayed flows and storages corresponding to each of the four categories of land cover, first distributing precipitation as rainfall or snow (depending on a monthly temperature condition of −1.5°C) to an accumulated snow pack or surface water storage (Figure 2). Within each respective land cover representation, the distributed snowmelt and rainfall are transported as runoff to a collective river storage, or as infiltration to the land cover-distributed soil storage, where deep percolation transports the water to a collective shallow groundwater storage with a base flow to the collective river. River discharge is then computed using a function based on the volume and physical characteristics of the river. Using interacting sub-basin modules, contributing river flows to the river stocks of consecutive downstream sub-basin regions are in the direction of streamflow (i.e., the river stock in sub-basin region 6 receives the collective discharge from all upstream sub-basin regions). Soil evapotranspiration and infiltration are determined from soil retention functions based on soil moisture and precipitation conditions, computed potential evapotranspiration, and a soil drying function. Evaporation is assumed to be equal to the rate of computed potential evapotranspiration and is applied to all above-ground water stocks. A simplified linear reservoir function, which uses storage capacity and residence time to compute inflows and outflows, is used to simulate reservoir operations for an aggregate reservoir. The storage capacity of the aggregate reservoir is equal to the sum of the capacities of each major reservoir present in a given sub-basin region. Due to the spatial variability of reservoirs, with the RCM reporting only the total downstream discharge in a sub-basin region, a weighted average of catchment areas (sum of consecutive HUC 12 areas in the direction of upstream flow) corresponding to the reservoirs is performed using weighted reservoir storage capacities to determine the relative inflow available to the aggregate reservoir, which is used to compute an aggregate residence time. The annual average residence times for the river, soil moisture, and shallow groundwater storage in each sub-basin region are computed using annual average storage and inflows for each respective stock.
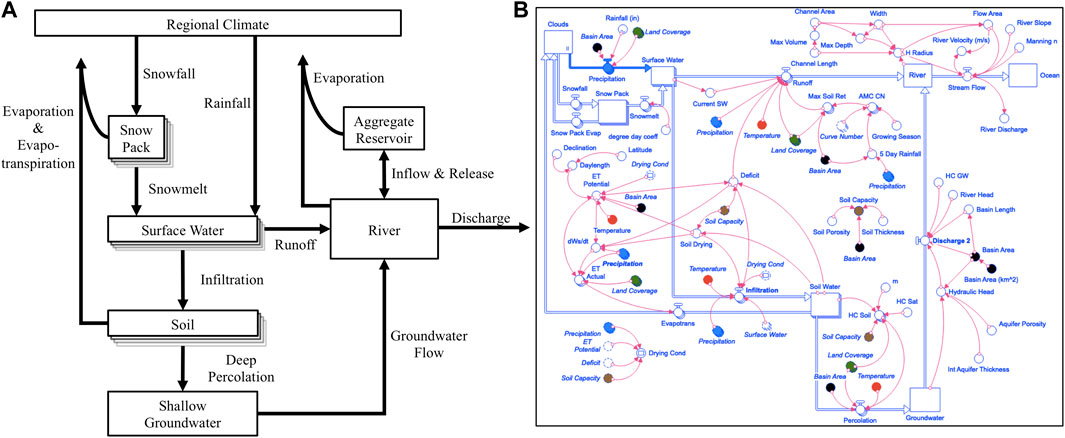
FIGURE 2. Configuration of the “Hydrology” RCM for each sub-basin region, showing primary model functioning in a schematic diagram of the water balance cycle (A), where boxes represent storage stocks, arrows represent water flows, and arrayed boxes show land-cover distributed storage stocks. (B) Sub-basin module in Stella Architect’s visual interface, displaying interconnected variables and parameters.
2.2.2 RCM “thermal pollution and energy”
The “thermal pollution and energy” RCM is adapted from TP2M (Miara and Vörösmarty, 2013a; Miara and Vörösmarty, 2013b; Miara et al., 2013; Stewart et al., 2013), which has previously been coupled with WBM to simulate power plant operations and resulting impacts on power generation and ecosystem degradation in geospatially referenced grid cells and river networks. The RCM adaptation aggregates systems of power plants that are located along a river reach, using power plant specifications (nameplate capacity, power plant thermal efficiency, fuel source, cooling technology, number of power plants, distance between power plants), river specifications obtained from the “hydrology” RCM (river discharge, velocity, depth, and channel length), climate conditions (air temperature, wind speed, and relative humidity), and regulatory constraints (CWA river temperature limits) as inputs. Other input parameters and coefficients (e.g., optimal thermal efficiency) are either estimated from reasonable ranges or obtained from Miara and Vörösmarty, (2013a); Miara and Vörösmarty, (2013b); Miara et al. (2013). For each sub-basin region, the model creates single aggregate power plants corresponding to two widely-used cooling technology categories: once-through cooling (OTC) and recirculating cooling system (RCS). For each cooling technology category in a sub-basin region with power plants in operation, the aggregate plant’s nameplate capacity is taken as the sum of the nameplate capacities of the constituent plants for a given year. Other aggregate plant parameters are computed as weighted averages of the constituent plants’ parameters, with each constituent plant weighted by its respective nameplate capacity. All model outputs are at the daily time step, but are averaged to the monthly and annual scales for validations and reporting. While the RCM has been validated with available observed ambient water temperatures upstream from power plants, there is no observed data available to assess temperature gradients across power plant locations.
The RCM computes the rates of aggregate power generation, heat transfer to the river for OTC, heat dispersion and water consumption in evaporative cooling towers for RCS, alterations to input river discharge, and increases in river water temperature downstream from the river reach simulated (Figure 3). The heat rate on a given day is estimated by considering the derating of a power plant based on climate-water conditions (Miara et al., 2017). The daily power generation and waste heat rejected through the condenser are calculated based on the derating of the plant, using aggregated characteristics including nameplate capacity and cooling technology. Downstream river water temperature is computed using the aggregate thermal effluent rates and the length of the river reach in an exponential decay function, contributing to the upstream river water temperatures in each consecutive sub-basin region in the direction of streamflow, as with river discharge in the “hydrology” RCM. Environmental regulation is simulated using assigned temperature thresholds (the lesser of 1.5°C above ambient river water conditions and an absolute river temperature limit of 28°C). The assigned thresholds are on the more restrictive end of identified CWA temperature ranges in part because of the high spatiotemporal variability of water quality standards within the basin, but also with the intention of yielding more significant impacts of policy on simulated outputs. When daily thermal effluent temperatures, at the outlet of the aggregate plant, are simulated to exceed the CWA imposed temperature thresholds, electricity generation at the aggregate plant is curtailed to a limited generation capacity to minimize thermal pollution and maintain a river temperature below the assumed CWA thresholds, if possible. If the river temperature at the inlet of the plant is already above the temperature limit, the plant is assumed to not be allowed to generate electricity. To assess the degree of thermal pollution in each sub-basin region, the RCM simulates a pristine run without power plants to obtain natural river temperature conditions, and the difference (vs. the run with power plants turned on) represents the increase in river water temperatures due to thermal pollution. The thermal pollution for the basin is reported as the weighted average of each sub-basin region’s resulting increase in river water temperature, weighted by the length of the major river segment in each respective sub-basin region. Electricity production for the basin is computed using aggregate power generation rates with the assumption that all plants are operated with the goal of a 100% capacity factor (24 h and 365 days a year).
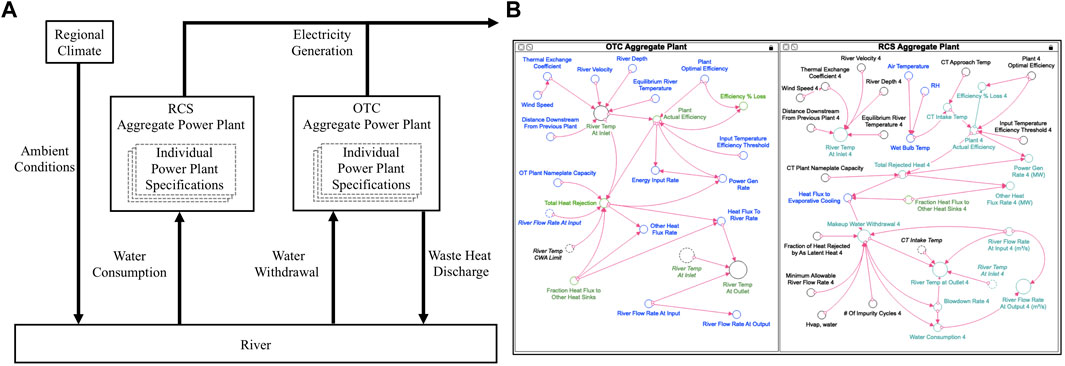
FIGURE 3. Configuration of the “Thermal Pollution and Energy” RCM for each sub-basin region, showing primary model functioning in a schematic diagram (A). The aggregate Once-Through Cooling (OTC) and Recirculating Cooling System (RCS) power plants exchange heat and water with the river to produce electricity. (B) Sub-basin module in Stella Architect’s visual interface, displaying interconnected variables and parameters.
2.2.3 RCM “nitrogen mobilization and transport”
The “nitrogen mobilization and transport” RCM is primarily adapted from the constituent transport model and associated methodologies developed by Green et al. (2004), for a continental and regional scale assessment of reactive N loading using statistical bio-geophysical relationships and geospatially referenced drainage basins. The RCM adaptation aggregates variable inputs (annual N atmospheric deposition, land cover, population, number of livestock, fertilizer application, air temperature), hydrologic specifications obtained from the “hydrology” RCM (residence time for rivers and the combined soil-shallow groundwater storage, runoff-to-precipitation ratio, river discharge), and a number of calculated and calibrated parameters (e.g., N fixation rates, N delivery coefficients, denitrification rates, ammonia volatilization rates, sewage treatment efficiency) to the basin-scale. For each sub-basin region, the model creates distinctly arrayed flows and stocks for four land cover categories (developed, natural, croplands, and grazing lands), distributing spatially uniform atmospheric N deposition to each respective land category, as well as the fixation of non-reactive N for the natural, cropland, and grazing land covers (Figure 4). The model also creates arrayed flows corresponding to organic and inorganic N, as well as point and non-point source loading.
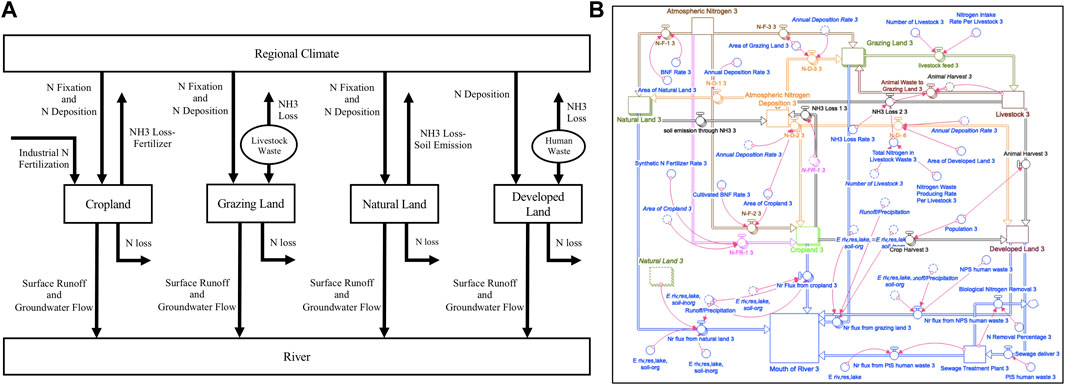
FIGURE 4. Configuration of the “Nitrogen Mobilization and Transport” RCM for each sub-basin region, showing primary model functioning in a schematic diagram (A). Land cover-dependent N fluxes to the river are represented by four boxes (N load) and arrows (N transport). (B) Sub-basin module in Stella Architect’s visual interface, displaying interconnected variables and parameters.
The RCM computes annual organic, inorganic, and total reactive N flux from atmospheric and terrestrial sources to riverine receiving waters. Each land cover category is simulated to have a unique interaction with the basin-scale N cycle. Livestock waste, determined from total cattle, sheep, goat, horse, and hog numbers by county, is assumed to be deposited directly onto grazing lands with resulting average ammonia volatilization rates for livestock manure, yielding non-point source organic loads. Synthetic fertilizer is applied evenly to croplands with resulting average ammonia volatilization rates for fertilizer, yielding non-point source organic loads. Sewage is estimated from total human populations and applied to developed lands, with the assumption of equal accessibility to sewage treatment plants with uniform treatment efficiencies throughout the basin, yielding point source organic loads. Soil emissions through ammonia loss are deducted from N fixation estimates within natural lands, yielding a net input of N contributing sources in non-point source organic loads. A series of delivery coefficients are applied to N mobilization loads through four respective hydrological pathways (soil-shallow groundwater, lakes, reservoirs, and rivers), along with tunable parameters that are used for calibrating the respective flows. Downstream river discharge and N riverine flux are used to compute average N concentration for each sub-basin region’s major river segment. River discharge averaged to the monthly time scale is also used to downscale annual fluxes and concentrations to the monthly time scale.
3 Results
3.1 Model validations
RCM performance is evaluated using available observed data corresponding to three sub-basin regions in the Delaware River Basin, with NSE and Willmott “d” values reported (Figure 5). The validation exercise reveals overall that each standalone RCM is capable of simulating real basin-scale dynamics to a reliable and accurate degree, an impressive feat considering the many spatial aggregations and feature assumptions incorporated in the respective models. River discharges are validated at the monthly and annual scales for sub-basin regions 2, 3, and 5 (0.57< NSE <0.86 and 0.67 < d < 0.83), highlighting the stark differences in model performance by region and time scale (Figure 5A). Modeled discharges are shown to capture the monthly and annual variability of observed discharge very well despite underestimating observed values in most of the plots, perhaps indicating the model’s overestimation in water lost to evaporation and evapotranspiration. Water temperatures are evaluated at the monthly scale for sub-basin regions 2 and 3, evaluating ambient water temperatures (Figure 5B). The water temperature validations for sub-basin regions 2 and 3 are 0.93< NSE <0.98 and 0.88 < d < 0.93, but should not be mistaken for validations of water temperature gradients across power plants (i.e., thermal pollution). The exercise demonstrates that the RCM is able to simulate river temperature conditions, with which thermal pollution and electricity generation metrics are directly calculated. N flux is validated at the annual scale for sub-basin regions 2 and 5, showing a similar regional difference in validation performance as river discharge since the observed N fluxes are also scaled and interpolated using observed river discharge (0.66< NSE <0.80 and 0.67 < d < 0.77) (Figure 5C). In addition to comparisons with observed data, the predictive accuracies of the RCMs were also evaluated using outputs from the respective complex counterpart models where available, as discussed in Supplementary Appendix SA4.
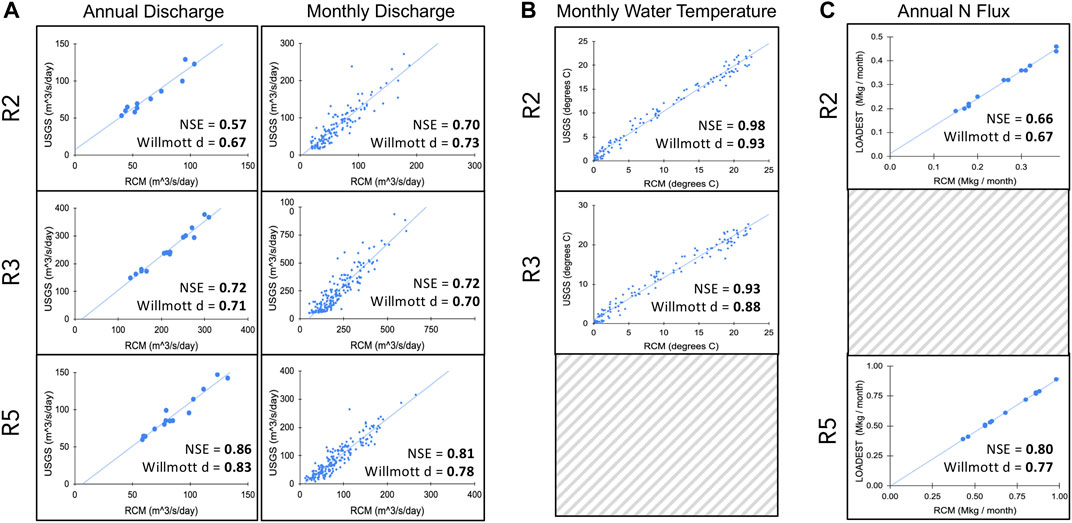
FIGURE 5. RCM validations shown in scatter plots with best-fit line and NSE and Willmott “d” index statistics; RCM outputs on the x-axis and observed values on the y-axis. Plots for sub-basin regions 2, 3, and 5 are ordered from top to bottom across the 3 panels. (A) Annual (left) and monthly (right) averaged discharge; (B) monthly river water temperature; (C) annual N flux, shown as monthly averages of annual flux (Mkg/month).
3.2 Single and multi-factor experiments
The annual and decadal averages (2010-2019) for three RCM outputs are compared across the baseline climate and three intensified climate extremes (drought, heat waves, and extreme precipitation) (Figure 6). The single-factor climate experiment illustrates basin-scale system sensitivities to climate in the Delaware River Basin by evaluating total downstream river discharge at the mouth of the basin, thermal pollution in the form of river temperature increases above ambient river water temperatures (due to power plant operation) for each respective climate, and total downstream N concentration at the mouth of the basin. As the first impact source of input changes within the coupled RCM framework, modeled river discharge and implied water supply immediately reflect the impacts of the intensified climate extremes in the basin. Relative to the baseline climate, the decadal average of discharge decreases by roughly 25% under the drought climate (Figure 6A), which has the lowest annual discharges of all climates for 6 out of 10 years (Figure 6B). The heat wave climate shows similarly low discharges, with a 16% drop in decadal average discharge relative to the baseline climate. On the contrary, decadal average discharge under the extreme precipitation climate increases by roughly 15% relative to the baseline climate, which is emphasized in the three repeated annual discharge peaks of about 755 m3 s-1, which is more than double the annual discharge for the drought climate in 2011.
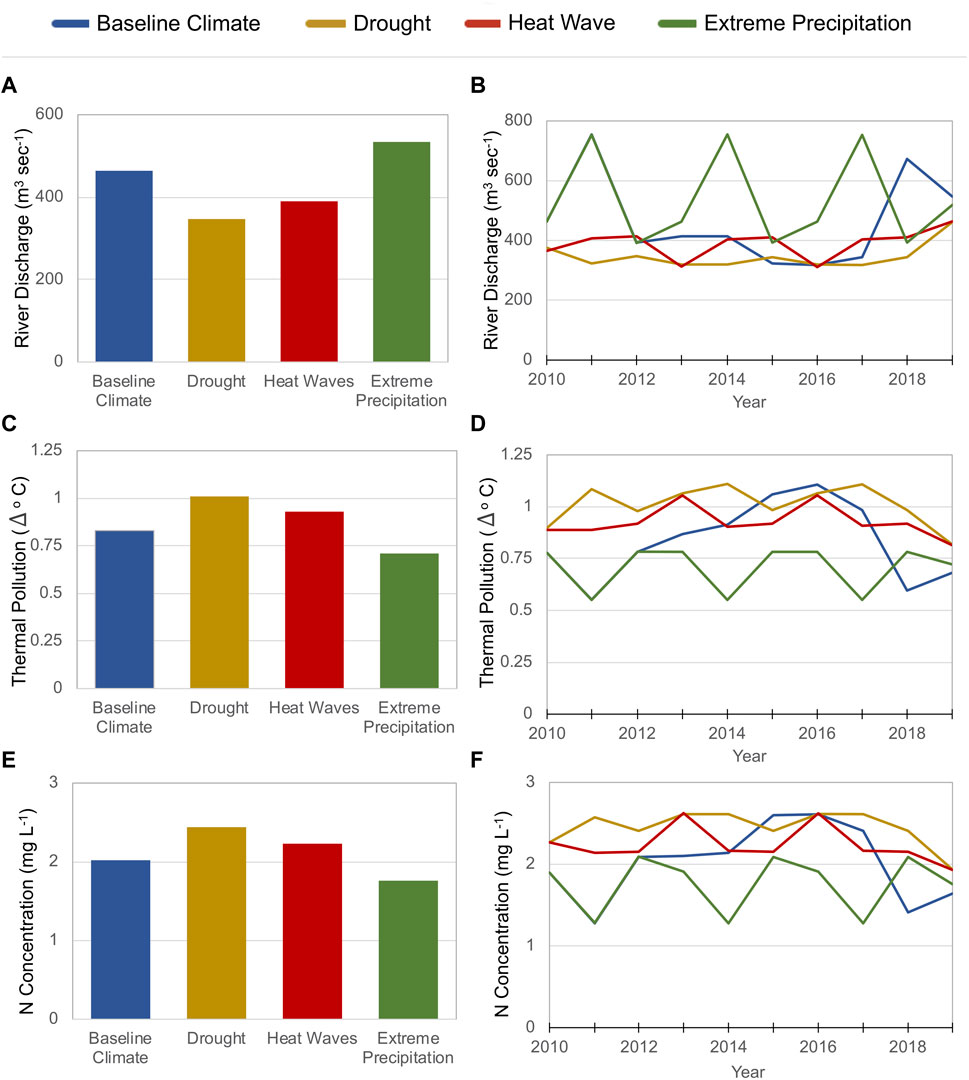
FIGURE 6. Decadal average (2010-2019) (left) and annual average (right) for three RCM outputs applied with four climate scenarios: baseline climate (blue), drought (brown), heat wave (red), extreme precipitation (green). Plots are shown for (A, B) basin downstream river discharge, (C, D) thermal pollution as basin averaged river temperature increases from the ambient conditions of each respective climate, (E, F) basin downstream N concentration.
The substantial climate-induced impacts on the basin’s hydrology translate intuitively to changes in river temperature from the thermal pollution of power plants, although these impacts are attenuated by the large temporal scales reported here (decadal and annual averages). Lower river discharge under the drought climate bolsters the transport of thermal effluents downstream of power plants. This results in the drought climate having decadal average thermal pollution levels greater than that of the baseline climate, by 0.2°C (Figure 6C), while also having the greatest annual thermal pollution levels of all climates for 8 out of 10 years (Figure 6D). Thermal pollution under the extreme precipitation climate experiences the opposite effect, with higher river discharge limiting annual thermal pollution levels to just 0.6°C for 3 out of 10 years, which is nearly half the thermal pollution experienced under the drought climate in 2011. Similar relative changes across the four climate experiments are observed in the decadal and annual averages for N concentration (Figures 6C, D). While the extreme precipitation climate should increase non-point source runoff and loading to the basin’s waterways as compared to the other climates, these impacts are diluted by increased river flows in the computed N concentration levels, leading to a 13% decrease in decadal average N concentration relative to the baseline climate.
The multi-factor impacts of four non-climate scenarios are then assessed across the four climate extreme experiments, reporting the decadal averages of N concentration, thermal pollution, and total electricity production from the basin’s power plants (Figure 7). N concentration considers a ‘No Sewage Treatment’ scenario that simulates the complete absence of sewage treatment plants in the basin, forcing the disposal of human sewage in soils where they are transported to water ways through runoff and groundwater flows (Figure 7B). The importance of sewage treatment infrastructure is immediately realized in the average 40% increase in N concentration when treatment plants are removed for all climates, relative to the ‘Climate Only’ scenario with all treatment plants in place. These results express the prominence of point source pollution in the estuarian and coastal water qualities downstream of the Delaware River Basin, as well as emphasize the important mitigation efforts that target sewage treatment efficiency. This experiment also depicts a fascinating interplay between climate and infrastructure with respect to N pollution abatement. The increased water flows under the extreme precipitation climate are shown to partially mitigate amplified N fluxes without treatment plants, holding relative increases in N concentration to an average 0.7 mg L−1, compared to the average 1 mg L−1 increase under the drought climate. Interestingly, N concentration levels are nearly equivalent for the extreme precipitation climate without sewage treatment plants (2.45 mg L−1) and the drought climate with treatment plants (2.44 mg L−1). This suggests that the prevalence of opposing climate extremes may be as consequential to pollution mitigation efforts as the implementation and advancement of sewage treatment infrastructure.
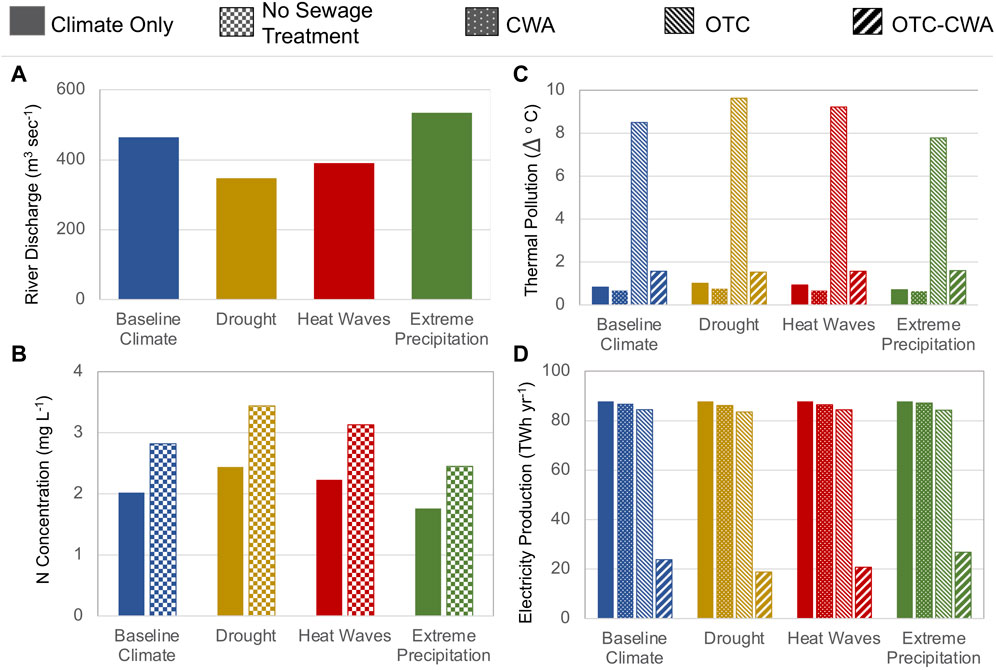
FIGURE 7. Decadal average (2010-2019) of four RCM outputs applied with four climate scenarios in comparative bar charts: baseline climate (blue), drought (brown), heat wave (red), extreme precipitation (green). Plots are shown for (A) basin downstream river discharge, (B) basin downstream N concentration, (C) thermal pollution as basin averaged river temperature increases from the ambient conditions of each respective climate due to power plant operation, (D) annual electricity production. (Solid) fill: “Climate Only” impacts without additional scenarios; (checkered) fill: climate with “No Sewage Treatment” scenario for N concentration; (dotted) fill: climate with “CWA” Temperature Limits; (diagonal stripes-right) fill: climate with all “OTC” plants in the basin; (wide diagonal stripes-left) fill: climate with CWA temperature limits and all OTC plants in the basin “OTC-CWA”.
We also explore three technology and policy scenarios for thermoelectric pollution and electricity production in the form of “CWA” environmental regulations that impose strict river water temperature limits on the basin’s power plants, an “OTC” scenario that converts all cooling technologies in the basin to Once-Through Cooling only, and a combined “OTC-CWA” scenario (Figures 7C, D). We first demonstrate that the current cooling technology mix in the basin (11% and 89% for OT and RCS by power generation capacity, respectively) is fully adequate to curb the impacts of both intensified climate extremes and CWA temperature limits, exhibited by very minor decreases in electricity production (average 1.6% decrease for the ‘CWA’ scenario relative to “Climate Only”). When all plants are restricted to once-through cooling only, thermal pollution rises intensely, with a near 10-fold increase across all climates and an average 9.4°C increase under the drought and heat wave climates, relative to the current technology mix. The severe thermal stresses on the basin’s river systems are reflected in the average 4.4% decrease in annual electricity generated relative to the plants’ full generation capacity, due to thermal efficiency losses alone. The significant rise in thermal pollution for the “OTC” scenario is elaborated in a breakdown by sub-region in Supplementary Appendix SA5, which demonstrates that thermal pollution in sub-basin region 5 (corresponding to the Schuylkill River) drives most of the temperature increase represented by the basin-wide average of thermal pollution. The aggregate power generation capacity in region 5 is the greatest of all 6 regions (43% of the basin’s total power generation capacity) and is entirely attributable to RCS plants during the 2010-2019 simulation period. When these characteristics are considered alongside region 5’s low river discharge (2nd lowest average river discharge of all 6 regions), the “OTC” scenario reveals the sub-basin’s heightened sensitivity to temperature changes that arise from cooling technology deployments. Results from the “OTC” experiment effectively endorse the sub-basin’s 100% utilization of RCS for power generation during the contemporary simulation period, from the standpoint of thermal pollution mitigation. This can also be extended to the Delaware River Basin as a whole, due its considerable dependence on RCS plants for power generation.
If we then apply the CWA temperature regulations to this once-through cooling scenario (OTC-CWA), the elevated thermal pollution levels are truncated to permittable temperature thresholds, but at the cost of significant declines in electricity production. An average 74% loss in annual electricity production is seen across all climates, relative to the full generation capacity of the plants. We also see the only significant differential impacts of climate extremes on electricity production in this scenario, such as the strong exacerbation of the drought climate that causes a 21% loss in electricity produced, relative to the baseline climate. The extreme precipitation climate, instead benefitting from relatively high water flows, experiences 13%, 29%, and 42% more annual electricity produced than the baseline, heat wave, and drought climates, respectively. Similar to the climate-infrastructure interplay discussed for N pollution, this multi-factor experiment highlights important links between climate, infrastructure, and policy in thermal pollution abatement, which are realized more clearly through socio-economic tradeoffs with electricity production. The experiment further stresses the importance of contemporary shifts towards RCS in the Delaware River Basin as well as the regulatory safeguards of the CWA.
4 Discussion and conclusion
The preliminary but overarching goal of the work presented here is to demonstrate, through the acceptable validations and scenario-experimentation of three linked socio-environmental models, that the RCM framework can sufficiently subdue the complexity of FEWS linkages and synthesize important results with region-specific domains, input and feature flexibility, and rapid turnaround. In achieving and surpassing these considerations, the first stage of our development of an RCM framework for FEWS was a resounding success, holding great promise for expected applications of the framework in the future. The individual and coupled models built in Stella Architect preserve model validity and the realism of bio-geophysical processes simulated at the basin-scale, while lending an exploratory capacity to users in which to assess the progressive impacts of climate, infrastructure, technology, and socio-economic drivers on FEWS. In particular, the RCM framework’s capacity to compute outputs in near-real time will be of enormous value in ongoing stakeholder engagement efforts, complimenting the more comprehensive but stringent analyses of existing models in the C-FEWS framework.
The second goal of this paper is to apply the RCM framework through a set of single and multi-factor experiments, designed to assess impacts on the FEWS features captured by the models for a simulation test case of the Delaware River Basin. We demonstrate that important links and tradeoffs emerge among natural (climate extremes) and anthropogenic (infrastructure and regulatory policy) factors, with relevant implications for basin-scale management. The opposing climates of intensified droughts, heat waves, and extreme precipitation are shown to significantly exacerbate as well as mitigate thermal and N pollution in the basin. This suggests that climate-infrastructure links, with respect to sewage treatment infrastructure and power plant cooling technology, play a critical role in understanding and achieving climate resilience in the basin. We also investigate tradeoffs between thermal pollution and electricity production, which can be influenced sizably under combinations of parameters and input variables. This provides the motivation for multi-objective optimization studies that are currently being exercised, such as an evaluation of optimal cooling technologies, spatial distributions of power plants, and regulated river temperature constraints to maximize electricity production and minimize thermal pollution. Importantly, the RCM results reported here are only a fraction of the current framework’s full set of output variables (e.g., reservoir operations, water consumption by power plants, point and non-point source distinctions in N pollution, etc.). Therefore, a more extensive and detailed study of the framework can yield more intricate analyses and unexplored tradeoffs with respect to climate and anthropogenic scenarios.
Future stages of the RCM framework could investigate basin-scale system responses to a variety of socio-environmental levers including land use changes, population growth, sewage treatment efficiency, hydropower implementation, and evolving power plant technologies. These scenarios can be extended into the future with mid-century and late-century climate scenario projections. The current configuration of the RCM framework only considers first-order hydrologic linkages between three respective models, but these can be elaborated to simulate more complex two-way linkages inherent in the FEWS nexus. The RCM framework can also configure additional simplified adaptations of other models used in the CFEWS framework, such as the Terrestrial Ecosystem Model (TEM) (Kicklighter et al., 2023), which simulates land-based infrastructure services including carbon sequestration, and the Integrated Science Assessment Model (ISAM) (Lin et al., 2023), which simulates food and bioenergy crop dynamics. Expanding the RCM framework to the regional scale, as with the models in the C-FEWS framework, would equip the RCMs to study FEWS linkages across the important Northeast and Midwest regions of the U.S. This would also allow for a local-to-regional integration of RCM capabilities that could be streamlined based on stakeholder interests and feedback.
Data availability statement
The original contributions presented in the study are included in the article/Supplementary Material, further inquiries can be directed to the corresponding author.
Author contributions
Conceptualization: CV, ST, EN, and HB; method development: CV, EN, HB, JD, LW, and NM; formal analysis: CV, EN, HB, JD, LW, and NM; model adaptation guidance: CV, NM, BF, FC, and AM; data retrieval and aggregation: EN, HB, JD, LW, NM, FC, SS, and T-SL; first draft: HB; contributed writing: CV, EN, JD, LW, and NM; all authors contributed to manuscript revision, read, and approved the submitted version.
Funding
Financial support for this work was provided by the U.S. National Science Foundation’s Innovations at the Nexus of Food, Energy and Water Systems Program (INFEWS/T1 Grant #1856012).
Conflict of interest
The authors declare that the research was conducted in the absence of any commercial or financial relationships that could be construed as a potential conflict of interest.
Publisher’s note
All claims expressed in this article are solely those of the authors and do not necessarily represent those of their affiliated organizations, or those of the publisher, the editors and the reviewers. Any product that may be evaluated in this article, or claim that may be made by its manufacturer, is not guaranteed or endorsed by the publisher.
Supplementary material
The Supplementary Material for this article can be found online at: https://www.frontiersin.org/articles/10.3389/fenvs.2023.1077181/full#supplementary-material
References
Albrecht, T. R., Crootof, A., and Scott, C. A. (2018). The water-energy-food nexus: A systematic review of methods for nexus assessment. Environ. Res. Lett. 13 (4), 043002. doi:10.1088/1748-9326/aaa9c6
Ator, S. W., Brakebill, J. W., and Blomquist, J. D. (2011). Sources, fate, and transport of nitrogen and phosphorus in the Chesapeake Bay Watershed: An empirical model. Reston, VA: U.S. Geological Survey Scientific Investigations Report, 2011–5167.
Baron, J. S., Hall, E. K., Nolan, B. T., Finlay, J. C., Bernhardt, E. S., Harrison, J. A., et al. (2013). The interactive effects of excess reactive nitrogen and climate change on aquatic ecosystems and water resources of the United States. Biogeochemistry 114 (1), 71–92. doi:10.1007/s10533-012-9788-y
Bazilian, M., Rogner, H., Howells, M., Hermann, S., Arent, D., Gielen, D., et al. (2011). Considering the energy, water and food nexus: Towards an integrated modelling approach. Energ Policy 39, 7896–7906. doi:10.1016/j.enpol.2011.09.039
Bazilian, M., Rogner, H., Howells, M., Hermann, S., Arent, D., Gielen, D., et al. (2011). Considering the energy, water and food nexus: Towards an integrated modelling approach. Energy policy 39 (12), 7896–7906. doi:10.1016/j.enpol.2011.09.039
Birhanu, D., Kim, H., Jang, C., and Park, S. (2018). Does the complexity of evapotranspiration and hydrological models enhance robustness? Sustainability 10 (8), 2837. doi:10.3390/su10082837
Brown, M. E., Antle, J. M., Backlund, P., Carr, E. R., Easterling, W. E., Walsh, M. K., et al. (2015). Climate change, global food security, and the U.S. Food system. Washington, DC: U.S. Global Change Research Program, 146. doi:10.7930/j0862dc7
Brugnach, M., Pahl-Wostl, C., Lindenschmidt, K. E., Janssen, J. A. E. B., Filatova, T., Mouton, A., et al. (2008). Chapter four complexity and uncertainty: Rethinking the modelling activity. Dev. Integr. Environ. Assess. 3, 49–68.
Cai, X., Wallington, K., Shafiee-Jood, M., and Marston, L. (2018). Understanding and managing the food-energy-water nexus–opportunities for water resources research. Adv. Water Resour. 111, 259–273. doi:10.1016/j.advwatres.2017.11.014
Caissie, D. (2006). The thermal regime of rivers: A review. Freshw. Biol. 51, 1389–1406. doi:10.1111/j.1365-2427.2006.01597.x
Chang, Y., Li, G., Yao, Y., Zhang, L., and Yu, C. (2016). Quantifying the water-energy-food nexus: Current status and trends. Energies 9, 1–17. doi:10.3390/en9020065
Chichakly, K. J., Bowden, W. B., and Eppstein, M. J. (2013). Minimization of cost, sediment load, and sensitivity to climate change in a watershed management application. Environ. Model. Softw. 50, 158–168. doi:10.1016/j.envsoft.2013.09.009
Copeland, C., and Carter, N. T. (2017). Energy-water nexus: The water sector's energy use. Congr. Res. Serv. 7, R43200.
Copeland, C. (2016). Clean water Act: A summary of the law. Washington, DC: Congressional Research Service.
D'Odorico, P., Davis, K. F., Rosa, L., Carr, J. A., Chiarelli, D., Dell'Angelo, J., et al. (2018). The global food-energy-water nexus. Rev. Geophys. 56 (3), 456–531. doi:10.1029/2017rg000591
Dargin, J., Daher, B., and Mohtar, R. H. (2019). Complexity versus simplicity in water energy food nexus (WEF) assessment tools. Sci. Total Environ. 650, 1566–1575. doi:10.1016/j.scitotenv.2018.09.080
Davidson, E. A., David, M. B., Galloway, J. N., Goodale, C. L., Haeuber, R., Harrison, J. A., et al. (2012). Excess nitrogen in the US environment: Trends, risks, and solutions. Issues in ecology, (15).
Delaware River Basin Commission (2019). State of the basin 2019 report. Available at: https://www.state.nj.us/drbc/library/documents/SOTBreport_july2019.pdf.
Diehl, T. H., Harris, M. A., Murphy, J. C., Hutson, S. S., and Ladd, D. E. (2013). Methods for estimating water consumption for thermoelectric power plants in the United States (Vol. 2013) Reston, VA, USA: US Department of the Interior, US Geological Survey.
Dieter, C. A. (2018). Water availability and use science program: Estimated use of water in the United States in 2015. Reston, Virginia: Geological Survey.
EIP (2022). The clean water Act at 50: Promises half kept at the half-century mark. Available at https://environmentalintegrity.org/wp-content/uploads/2022/03/Revised-CWA-report-3.29.22.pdf (Accessed Sept 1, 2022).
EPA (2015). Climate change in the United States: Benefits of global action. EPA 430-R-15-001. Available at: https://19january2017snapshot.epa.gov/sites/production/files/2015-06/documents/cirareport.pdf.
Grasso, D. (2019). Environmental engineering for the 21st century: Addressing grand challenges. Environ. Sci. Technol. 53 (13), 7183–7184. doi:10.1021/acs.est.9b03244
Green, P. A., Vörösmarty, C. J., Meybeck, M., Galloway, J. N., Peterson, B. J., and Boyer, E. W. (2004). Pre-industrial and contemporary fluxes of nitrogen through rivers: A global assessment based on typology. Biogeochemistry 68 (1), 71–105. doi:10.1023/b:biog.0000025742.82155.92
Hirsch, R. M., and De Cicco, L. A. (2015). User guide to exploration and graphics for river trends (EGRET) and dataRetrieval: R packages for hydrologic data (No. 4-A10). Reston, Virginia: US Geological Survey.
Hitaj, C., and Suttles, S. (2016). Trends in US agriculture's consumption and production of energy: Renewable power, shale energy, and cellulosic biomass (No. 1476-2017-3906). Darby, PA: DIANE.
Hoos, A. B., Moore, R. B., Garcia, A. M., Noe, G. B., Terziotti, S. E., Johnston, C. M., et al. (2013). Simulating stream transport of nutrients in the eastern United States, 2002, using a spatially-referenced regression model and 1:100,000-scale hydrography. Available at: http://pubs.usgs.gov/sir/2013/5102/.
ISEE systems (2022). Stella Architect [computer software]. Lebanon, NH. Available at: https://www.iseesystems.com/store/products/stella-architect.aspx.
Izaurralde, R. C., Thomson, A. M., Sands, R., and Pitcher, H. M. (2010). Bringing water into an integrated assessment framework (No. PNNL-19320). Richland, WA (United States): Pacific Northwest National Lab.
Kaddoura, S., and El Khatib, S. (2017). Review of water-energy-food Nexus tools to improve the Nexus modelling approach for integrated policy making. Environ. Sci. Pol. 77, 114–121. doi:10.1016/j.envsci.2017.07.007
Kauffman, G. J. (2010). The Delaware river revival: Four centuries of historic water quality change from henry hudson to benjamin franklin to JFK. A J. Mid-Atlantic Stud. 77 (4), 432–465. doi:10.5325/pennhistory.77.4.0432
Kauffman, G. J. (2016). Economic value of nature and ecosystems in the Delaware River Basin. J. Contemp. Water Res. Educ. 158 (1), 98–119. doi:10.1111/j.1936-704x.2016.03222.x
Kauffman, G. J. (2011). Socioeconomic value of the Delaware River basin in Delaware. New Jersey, New York, and Pennsylvania: Gerald Kauffman, Univ. of Del.
Kauffman, G. J. (2018). The cost of clean water in the Delaware River Basin (USA). Water 10 (2), 95.
Keairns, D. L., Darton, R., and Irabien, A. (2016). The energy-water-food nexus. Annu. Rev. Chem. Biomol. Eng. 7, 239–262. doi:10.1146/annurev-chembioeng-080615-033539
Khan, M. N., and Mohammad, F. (2014). “Eutrophication: Challenges and solutions,” in Eutrophication: Causes, consequences and control (Dordrecht: Springer), 1–15.
Kicklighter, D. W., Lin, T.-S., Zhang, J., Chen, M., Vörösmarty, C. J., Jain, A., et al. (2023). Influence of forest infrastructure on the responses of ecosystem services to climate extremes in the Midwest and Northeast United States from 1980 to 2019. Front. Environ. Sci. 11. doi:10.3389/fenvs.2023.1069451
Leck, H., Conway, D., Bradshaw, M., and Rees, J. (2015). Tracing the water-energy-food nexus: Description, theory, and practice. Geogr. Compass 9 (8), 445–460. doi:10.1111/gec3.12222
Levins, R. (1966). The strategy of model building in population biology. Am. Sci. 54 (4), 421–431. http://www.jstor.org/stable/27836590.
Lin, T.-S., Kheshgi, H. S., Song, Y., Vörösmarty, C. J., and Jain, A. K. (2023). Which crop has the highest bioethanol yield in the United States?. Front. Energy Res. 11. doi:10.3389/fenrg.2023.1070186
Liu, J., Hull, V., Godfray, H. C. J., Tilman, D., Gleick, P., Hoff, H., et al. (2018). Nexus approaches to global sustainable development. Nat. Sustain. 1 (9), 466–476. doi:10.1038/s41893-018-0135-8
Miara, A., Macknick, J. E., Vörösmarty, C. J., Tidwell, V. C., Newmark, R., and Fekete, B. (2017). Climate and water resource change impacts and adaptation potential for US power supply. Nat. Clim. Change 7 (11), 793–798. doi:10.1038/nclimate3417
Miara, A., and Vörösmarty, C. J. (2013a). A dynamic model to assess tradeoffs in power production and riverine ecosystem protection. Environ. Sci. Process. Impacts 15 (6), 1113. doi:10.1039/c3em00196b
Miara, A., and Vörösmarty, C. J. (2013b). “Balancing thermoelectric power production and thermal pollution: Power plant cooling specification/decision-making guide,” in Thermal power plant cooling: Context and engineering. Editor C. King (New York, NY: ASME Press), 22–27.
Miara, A., Vörösmarty, C. J., Stewart, R. J., Wollheim, W. M., and Rosenzweig, B. (2013). Riverine ecosystem services and the thermoelectric sector: Strategic issues facing the northeastern United States. Environ. Res. Lett. 8 (2), 025017. doi:10.1088/1748-9326/8/2/025017
Michaud, J., and Sorooshian, S. (1994). Comparison of simple versus complex distributed runoff models on a midsized semiarid watershed. Water Resour. Res. 30 (3), 593–605. doi:10.1029/93wr03218
Minshall, R. V. G., Sedelland, K. C. J., Cushing, C. E., and Sedell, J. R. (1980). The river continuum concept. Can. J. Fish. Aquatic Sci. 37, 130–137. doi:10.1139/f80-017
Mohammadpour, P., Mahjabin, T., Fernandez, J., and Grady, C. (2019). From national indices to regional action — An analysis of food, energy, water security in Ecuador, Bolivia, and Peru. Environ. Sci. Pol. 101, 291–301. doi:10.1016/j.envsci.2019.08.014
Moore, R. B., Johnston, C. M., Robinson, K. W., and Deacon, J. R. (2004). Estimation of total nitrogen and phosphorus in new england streams using spatially referenced regression models. Pembroke, NH: U.S. Geological Survey.
Nerini, F. F., Tomei, J., To, L. S., Bisaga, I., Parikh, P., Black, M., et al. (2017). Mapping synergies and trade-offs between energy and the sustainable development goals. Nat. Energy 3, 10–15. doi:10.1038/s41560-017-0036-5
Nicholls, Z., Meinshausen, M., Lewis, J., Corradi, M. R., Dorheim, K., Gasser, T., et al. (2021). Reduced complexity model intercomparison project phase 2: Synthesizing earth system knowledge for probabilistic climate projections. Earth's Future 9 (6), e2020EF001900. doi:10.1029/2020ef001900
Nicholls, Z. R., Meinshausen, M., Lewis, J., Gieseke, R., Dommenget, D., Dorheim, K., et al. (2020). Reduced complexity model intercomparison project phase 1: Introduction and evaluation of global-mean temperature response. Geosci. Model Dev. 13 (11), 5175–5190. doi:10.5194/gmd-13-5175-2020
Passeport, E., Vidon, P., Forshay, K. J., Harris, L., Kaushal, S. S., Kellogg, D. Q., et al. (2013). Ecological engineering practices for the reduction of excess nitrogen in human-influenced landscapes: A guide for watershed managers. Environ. Manag. 51 (2), 392–413. doi:10.1007/s00267-012-9970-y
Proctor, K., Tabatabaie, S. M., and Murthy, G. S. (2021). Gateway to the perspectives of the Food-Energy-Water nexus. Sci. Total Environ. 764, 142852. doi:10.1016/j.scitotenv.2020.142852
Saleh, D., and Domagalski, J. (2015). SPARROW modeling of nitrogen sources and transport in rivers and streams of California and adjacent states, U.S. U.S. JAWRA 51 (6), 1487–1507. doi:10.1111/1752-1688.12325
Schmidt, K. (2019). An overview of the Delaware River Basin. DRBC. Available at: https://www.state.nj.us/drbc/library/documents/DelawareRiverTour_DoaneAcademy_jan2019.pdf (Accessed Sept 1, 2022).
Singh, S. K., and Marcy, N. (2017). Comparison of simple and complex hydrological models for predicting catchment discharge under climate change. AIMS Geosci. 3 (3), 467–497. doi:10.3934/geosci.2017.3.467
Stewart, R. J., Wollheim, W. M., Miara, A., Vörösmarty, C. J., Fekete, B., Lammers, R. B., et al. (2013). Horizontal cooling towers: Riverine ecosystem services and the fate of thermoelectric heat in the contemporary Northeast US. Environ. Res. Lett. 8 (2), 025010. doi:10.1088/1748-9326/8/2/025010
UN General Assembly (2015). Transforming our world: The 2030 agenda for sustainable development. A/RES/70/1. Available at: https://www.refworld.org/docid/57b6e3e44.html (Accessed Sep 20, 2022).
USGCRP (2018). Impacts, risks, and adaptation in the United States: The fourth national climate assessment, volume II. Washington, DC: U.S. Global Change Research Program, 1515. doi:10.7930/nca4.2018
USGS (2016). Load estimator (LOADEST): A Program for estimating constituent loads in streams and rivers. Available at: https://water.usgs.gov/software/loadest/ (Accessed Jan 1, 2021).
USGS (2021). USGS streamgaging network. Available at: https://www.usgs.gov/mission-areas/water-resources/science/usgs-streamgaging-network#overview (Accessed Jan 1, 2021).
Vörösmarty, C. J., Federer, C. A., and Schloss, A. L. (1998). Potential evaporation functions compared on US watersheds: Possible implications for global-scale water balance and terrestrial ecosystem modeling. J. Hydrol. 207 (3-4), 147–169. doi:10.1016/s0022-1694(98)00109-7
Vörösmarty, C. J., Melillo, J. M., Wuebbles, D. J., Jain, A. K., Ando, A., Tuler, S., et al. (2023). Applying the framework to study climate-induced extremes on food, energy, and water systems (C-FEWS): The role of engineered and natural infrastructures, technology, and environmental management in the United States Northeast and Midwest. Front. Environ. Sci. 11. doi:10.3389/fenvs.2023.1070144
Vörösmarty, C. J., Moore, B., Grace, A. L., Gildea, M. P., Melillo, J. M., Peterson, B. J., et al. (1989). Continental scale models of water balance and fluvial transport: An application to South America. Glob. Biogeochem. Cycles, 3(3), 241–265. doi:10.1029/gb003i003p00241
Weiskopf, S. R., Rubenstein, M. A., Crozier, L. G., Gaichas, S., Griffis, R., Halofsky, J. E., et al. (2020). Climate change effects on biodiversity, ecosystems, ecosystem services, and natural resource management in the United States. Sci. Total Environ. 733, 137782. doi:10.1016/j.scitotenv.2020.137782
Willmott, C. J., Robeson, S. M., and Matsuura, K. (2012). A refined index of model performance. Int. J. Climatol. 32 (13), 2088–2094. doi:10.1002/joc.2419
Xia, Y., Mitchell, K., Ek, M., Sheffield, J., Cosgrove, B., Wood, E., et al. (2012b). Continental-scale water and energy flux analysis and validation for North American land data assimilation system project phase 2 (NLDAS-2): 2. Validation of model-simulated streamflow: Validation of model-simulated streamflow. J. Geophys. Res. Atmos. 117 (D3). doi:10.1029/2011jd016051
Xia, Y., Mitchell, K., Ek, M., Sheffield, J., Cosgrove, B., Wood, E., et al. (2012a). Continental-scale water and energy flux analysis and validation for the North American land data assimilation system project phase 2 (NLDAS-2): 1. Intercomparison and application of model products. J. Geophys. Res. Atmos. 117 (D3). doi:10.1029/2011jd016048
Yang, J., Lei, K., Khu, S., Meng, W., and Qiao, F. (2015). Assessment of water environmental carrying capacity for sustainable development using a coupled system dynamics approach applied to the Tieling of the Liao River Basin, China. Environ. Earth Sci. 73 (9), 5173–5183. doi:10.1007/s12665-015-4230-0
Keywords: FEWS, climate extreme, RCM, hydrology, thermoelecric, nitrogen, Delaware River Basin
Citation: Bokhari HH, Najafi E, Dawidowicz J, Wuchen L, Maxfield N, Vörösmarty CJ, Fekete BM, Corsi F, Sanyal S, Lin T-S, Miara A and Tuler SP (2023) Simulating basin-scale linkages of the food-energy-water nexus with reduced complexity modeling. Front. Environ. Sci. 11:1077181. doi: 10.3389/fenvs.2023.1077181
Received: 22 October 2022; Accepted: 17 April 2023;
Published: 09 May 2023.
Edited by:
Jingke Hong, Chongqing University, ChinaReviewed by:
Nathan Moore, Michigan State University, United StatesYanmin Qin, Nanjing Normal University, China
Copyright © 2023 Bokhari, Najafi, Dawidowicz, Wuchen, Maxfield, Vörösmarty, Fekete, Corsi, Sanyal, Lin, Miara and Tuler. This is an open-access article distributed under the terms of the Creative Commons Attribution License (CC BY). The use, distribution or reproduction in other forums is permitted, provided the original author(s) and the copyright owner(s) are credited and that the original publication in this journal is cited, in accordance with accepted academic practice. No use, distribution or reproduction is permitted which does not comply with these terms.
*Correspondence: Hussain H. Bokhari, SHVzc2Fpbi5oLmJva2hhcmlAZ21haWwuY29t
†Present address: Tzu-Shun Lin, National Center for Atmospheric Research, Boulder, CO, United States