 Yuezhen Xu
 Mingde Shen1,2
 Zhiwei Zhou
 Guoyu Li
 Dun Chen
- 1State Key Laboratory of Frozen Soil Engineering, Northwest Institute of Eco-Environment and Resources, Chinese Academy of Sciences, Lanzhou, China
- 2School of Engineering Science, University of Chinese Academy of Sciences, Beijing, China
Introduction: The embankment in the permafrost zone of the Qinghai–Tibet Railway (QTR) faces the problem of permafrost degradation, especially in the warm and ice-rich permafrost areas. The settlement deformation of the embankment is more serious in these areas.
Methods: This study systematically investigates the settlement deformation characteristics during 16 operational years of three types of typical roadbed structures. The traditional embankment (TE), U-shaped crushed-rock embankment (UCRE), and crushed-rock revetment embankment (CRRE) are the roadbed structures. The long-term monitoring ground temperature and deformation data of the embankment section along the QTR in warm permafrost areas from 2005 to 2020 are utilized in analysis.
Results and Discussion: This study focuses on the influence law of the roadbed structure form, shady–sunny slope effect, and temperature field change on the settlement of the roadbed. The results indicated that the two types of the crushed-rock embankment (CRE) of the long-term cumulative settlement are less than 50% of the cumulative settlement of the TE, and the impact on controlling the settlement is significant. The annual settlements of the three types of embankment structures are related to the artificial permafrost table (APT) and influenced by cyclical climate change at the regional scale. The annual growth rate of the settlement at the left and right shoulders of the UCRE as a result of the effect of the shady–sunny slope does not vary considerably as the number of operational years increases. The impact of the shady–sunny slope on the CRRE for the various settlements before 2008 was negligible. After 2008, the thermal disturbance to the embankment temperature field induced by the preconstruction and the effect of shady–sunny slopes decreased gradually as the number of operational years increased. In some years of operation, a thawed interlayer in the TE and CRRE greatly affected the embankment settlement acceleration. The settlement growth rate of the TE is related to the decline of the artificial permafrost table (APT). During the operational years, there was no thawed interlayer in the UCRE. The development of the settlement rate is unaffected by the temperature field for either the left or right embankment shoulder.
1 Introduction
The Qinghai–Tibet Railway (QTR) traverses approximately 550 km of permafrost areas, including 275 km through permafrost areas with an average annual ground temperature greater than −1.0°C, 221 km in ice-rich permafrost areas, and roughly 134 km in warm and ice-rich overlapping sections (Cheng and He, 2001; Wu et al., 2002; Jin et al., 2008a). The key to the success of the QTR is maintaining the thermal stability of permafrost under the embankment. The target is to make the permafrost table (PT) not decline significantly, controlling the rate of warming of the permafrost temperature. The aim is to avoid excessive thaw settlement deformation and warm permafrost creep settlement deformation of the embankment in the permafrost areas (Cheng, 2003; Ma et al., 2004; Qi et al., 2012; Dore G. et al., 2016; Tai et al., 2017).
To cope with global warming and the degradation of permafrost caused by human activities in the engineering corridor, the “active cooling” methods to the embankment were adopted during the design and construction (Cheng, 2003; Ma et al., 2004). Researchers and designers apply heat transfer mechanisms, such as the regulation of radiation, conduction, and convection, to control the rise of the permafrost temperature, raise the PT, and protect the thermal stability of permafrost under the embankment (Yu et al., 2008; Cheng et al., 2009; Ma et al., 2009; Zhang et al., 2013; Luo et al., 2018). The crushed-rock embankment (CRE), which regulates the heat transfer mechanism of heat conduction, is used in many permafrost zones in various permafrost temperature zones, accounting for over 60% of the operating mileage in the permafrost zone of the QTR (Wu et al., 2005; Cheng et al., 2008; Mu et al., 2012a). The CRE is primarily divided into three distinct structural types: crushed rock-based embankment (CRBE), crushed-rock revetment embankment (CRRE), and U-shaped crushed-rock embankment (UCRE). Schematic diagrams of three embankment structural types are shown in the literature (Mu et al., 2018). Laboratory, numerical simulations, and field-based observation data showed that the permafrost layer under the CRE can be effectively cooled due to the presence of forced convection and natural convection in the crushed-rock layer. The cooling process of the crushed-rock layer is mainly based on the convective heat exchange of air in winter and thermal insulation in summer (Zhang et al., 2006; Cheng et al., 2007; French, 2007; Ma et al., 2008; Mu et al., 2010a). However, it has also been shown that the cooling effect of the CRE is better in the cold permafrost zone and less effective in the warm permafrost region (Ma et al., 2013; Mu et al., 2018; Wu et al., 2020). Most of the permafrost zone of the QTR adopts the CRE; there are still some permafrost zones for the traditional embankment (TE). The field monitoring results show that the TE causes the shady–sunny slope effect; it is relevant with the direction and height of the embankment (Sheng et al., 2005; Chou et al., 2008; Wu et al., 2011; Chou et al., 2015). The shady–sunny slope effect of the TE leads to the asymmetric field of the ground temperature and threatens the stability of the embankment. In addition, due to the impact of thermal disturbance in the embankment construction, deep permafrost of the TE has an accelerated warming trend, and this trend is more obvious in the warm permafrost region (Mu et al., 2012b; Niu et al., 2015; Wang et al., 2019; Mei et al., 2021a).
Meanwhile, there have also been a number of systematic studies conducted on the deformation laws of an embankment which have indicated that the embankment deformation in the permafrost zone is closely related to the ground temperature and ice content of the underlying permafrost. The settlement of the embankment is primarily a result of the thaw settlement, thaw compression, and creep deformation of the ice-rich layer of permafrost near the artificial permafrost table (APT) under the embankment (Cheng et al., 2009; Ma et al., 2011; Qi et al., 2012). The dominant factors of the settlement of the embankment in the permafrost zone are the thickness of permafrost and the associated change in the ground temperature (Sun et al., 2013; Tai et al., 2019). Due to the influence of solar radiation and the wind in the perennial dominant direction on the left- and right-side slopes of the embankment, large thermal variations on the slopes on both sides are generated. This thermal difference induces an uneven ground temperature field on both sides of the embankment, leading to the various settlements of the shady–sunny slope of the embankment (Mu et al., 2010b; Chou et al., 2015). In addition, the overall warming trend of permafrost on the Qinghai–Tibet Plateau produced by global warming is evident, and the thermal disturbance caused by the increase in linear engineering and human activities in the engineering corridor of the Qinghai–Tibet Plateau has negatively impacted the stability of the embankment in the permafrost area of the QTR (Jin et al., 2008b; Ma et al., 2013; Wu et al., 2015; Wu et al., 2021). Since the opening of the QTR in 2006, individual sections of the QTR have shown a large overall settlement or significant settlement difference between the left and right shoulders and other subgrade diseases according to the results of early field monitoring of the embankment (Sun et al., 2013; Sun et al., 2018; Mu et al., 2020). The maintenance department has taken measures such as adding crushed-rock slopes or thermosyphons for the sections with a large settlement. The short-term effects on controlling the deformation of an embankment are effective (Ma et al., 2012; Hou et al., 2015; Mei et al., 2021b). However, further study and analysis are required for the development of the long-term settlement. Warm permafrost areas on the Qinghai–Tibet Plateau have a faster rate of permafrost degradation, more significant thermal instability, and more melt-sink compression settlements and warm permafrost creep settlements than cold permafrost areas. Previous studies focus on short-term field observation data or a single type of a roadbed structure of interest (Sun et al., 2018; Tai et al., 2019; Wang et al., 2019). Therefore, the long-term development characteristics of deformation of various types of embankments in warm permafrost zones must be analyzed to ensure the safe operation and maintenance of the embankment.
This study selects three different types of embankments in the warm permafrost zone of the QTR to investigate the long-period deformation characteristics of the railway embankment. It is based as long as 16 years of long-cycle field monitoring data from 2005 to 2020. It discusses the sources of embankment deformation and the differential settlement of the left and right shoulders. It increases the understanding of the long-term thermal stability of the embankment in warm permafrost zones of the QTR and provides a scientific basis for the maintenance and reinforcement of the embankment in warm permafrost zones of the QTR.
2 Study area and monitoring methods
2.1 Study area
The three monitoring sections selected for this research are placed in the permafrost section of the QTR between the Erdaogou–Ando valley, as shown in Figure 1.
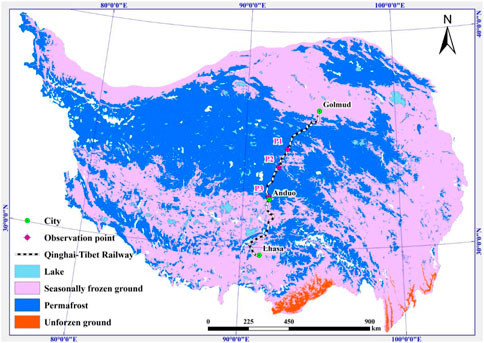
FIGURE 1. Location of the three observation points in the QTR.
The information on the embankment section is listed in Table 1. Three monitoring sections are located in the warm permafrost area with an annual average ground temperature higher than −1°C. The P1 section is TE, situated in the western part of the Erdaogou valley, and the mean average ground temperature (MAGT) of permafrost under the embankment is −0.65°C. The P2 section is UCRE, located on the west bank of the Buqu River, and the MAGT of permafrost under the embankment is −0.46°C. The embankment basement is filled by the crushed-rock layer with a thickness of 1 m, and the diameter of crushed rock is 10–15 cm. The thickness of the crushed rock on the left and right sides of the slopes is 1.0 m and 0.6 m, respectively, and the diameter is 10–15 cm. The P3 section is the CRRE, located on the western slope of the Toju Valley near the southern boundary of permafrost. The MAGT of permafrost under the embankment is −0.20°C, the thickness of the crushed rock on the left and right sides of the slope is 1.2 and 0.8 m, respectively, and the diameter of the crushed rock is 15–20 cm. The purpose of setting different thicknesses of rock revetment on the left and right sides is to reduce the temperature difference between the left and right sides of the embankment by relying on the active cooling effect of the rock layer. It has been confirmed in previous studies (Lai et al., 2004; Zhang et al., 2016).
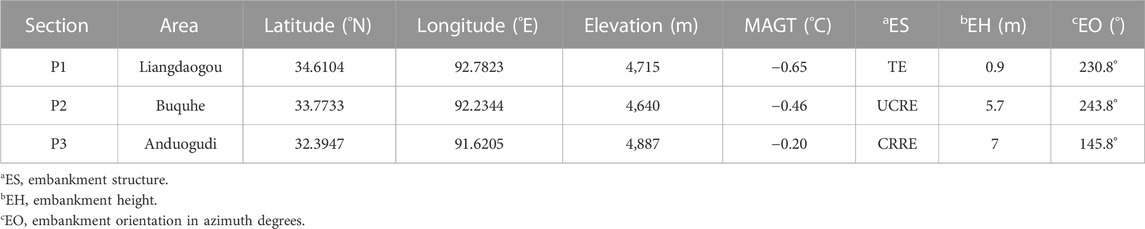
TABLE 1. Information of observation points.
As determined by the drilling survey, the geological condition of permafrost under the three embankment sections is depicted in Figure 2. The TE natural permafrost table (NPT) is about 3.8 m, the volume ice content is between 15% and 40% from 3.8 to 10 m, and the soil consists primarily of gravel sand and gravel clay from the top to bottom. The NPT of the UCRE is roughly 2.4 m, and the volume ice content is between 15% and 35% from 2.4 to 10 m. The soil is composed mainly of silty sand, weathered mudstone, and sandstone from the top to bottom. The NPT of the CRRE is about 2.6 m, and the volume ice content is >50% from 2.6 to 2.8 m. The volume ice content of the soil ice layer ranges between 15% and 30% from 2.8 to 10 m, and the soil consists mainly of silty clay, gravel clay, and weathered mudstone from the top to bottom.
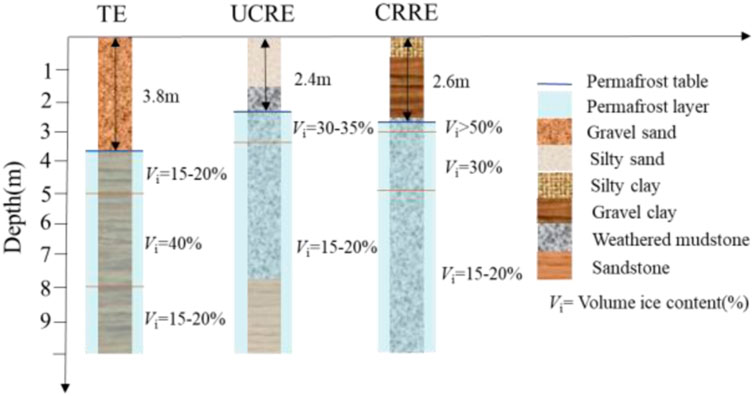
FIGURE 2. Details of the permafrost geology at the three monitoring sites.
2.2 Monitoring methods
This study addresses three different embankment structures in the warm permafrost zone using the embankment ground temperature and deformation data obtained from the long-term monitoring system of the QTR. Figure 3 illustrates the layout of ground-temperature boreholes and deformation monitoring points in each monitoring section. Figure 3A shows the layout of the ground-temperature boreholes. The distance of the natural borehole from the left side of the embankment is 20 m. The depth of the natural borehole is 18 m. The depth of both the left- and right-shoulder boreholes is 20 m. Thermistors are placed in the boreholes at 0.5-m intervals from the ground surface to the depth of 10 m and then at 1.0-m intervals to depths below 10 m. These thermistors were produced by the State Key Laboratory of Frozen Soil Engineering, China, and the measurement accuracy is ± 0.05°C. The ground temperature is automatically collected by the data logger (DT500) on a daily basis. Figure 3B shows the layout of deformation monitoring points at each observation profile. Eight deformation monitoring points and one reference point were installed on the embankment surface. The deformation monitoring points were fixed 20 cm under the embankment surface and embedded into the embankment shoulder; deformation observation points were arranged in four rows, and the distance between rows was 20 m. The reference point was also located on the embankment shoulder, and a longer metal rod was embedded into the embankment by a depth of 20 m with the upper end exposed on the embankment surface. A level instrument with a precision of ± 0.1 mm was utilized to manually measure the difference displacement between the monitoring points and the reference point with at frequency of once a month. Wu et al. (2008), Yu (2008) and Ma et al. (2011) introduced the relevant work on the ground temperature and embankment deformation measurement. A negative value of deformation indicates settlement, while a positive value represents frost heave. In addition, the left and right sides of the embankment are defined in the direction from Golmud to Lhasa; that is, the left side of the embankment corresponds to the sunny side, and the right side corresponds to the shady side. Roughly 16 years of continuous deformation monitoring data were collected from October 2005 to December 2020.
FIGURE 3. Monitoring of the ground temperature and embankment deformation at each observation profile. (A) Layout of ground temperature boreholes in the observation profile and (B) distribution of deformation monitoring points at each observation profile.
3 Analysis of monitoring results
3.1 Overall settlement characteristics
The settlement values of the left and right shoulders in the three monitoring sections for eight monitoring points and the corresponding average values are illustrated in Figure 4. During the 16 years of operation of the TE, the accumulated settlement of the left and right shoulders was 307–382 mm and 126–251 mm, with an average value of 356 mm and 181 mm, respectively. In addition, the accumulated settlement difference between the left and right shoulders was 175 mm (Figure 4A). There is no evident tendency of frost heave or settlement slowdown, and the settlement has been continuously developed without any slowdown trend. For the UCRE (Figure 4B), the cumulative average settlement value of the left shoulder during the 16 years of operation was 92–150 mm, with an average value of 120 mm. In contrast, the cumulative average settlement value of the right shoulder ranged from 45 mm to 65 mm, with an average value of 54 mm, while the cumulative settlement difference between the left and right shoulders was 66 mm. Before 2010, the cumulative deformation curves of the left and right shoulders exhibited a slightly increasing tendency due to the influence of frost heave during the cold season. After 2011, the settlement growth rate in the right shoulder reduced considerably. For the CRRE (Figure 4C), the cumulative settlement value of the left shoulder ranged from 87 mm to 171 mm, with an average value of 127 mm, and the cumulative settlement value of the right shoulder was between 58 and 131 mm, with an average value of 94 mm, and the cumulative settlement difference between the left and right shoulders was only 31 mm. Compared to the UCRE, the CRRE settlement curve fluctuates more. This indicates that the thicker and larger crushed-rock slope absorbs more cold energy from the outside environment in the cold season, and frost heave is larger in the cold season. This phenomenon is consistent with the findings in the literature (Zhang, et al., 2006; Liu, et al., 2017), and it can also be related to external air temperature variation, the water content of the frozen soil under the embankment, the direction of the embankment, and the dominant wind direction of the annual year. However, additional field monitoring data are required to support this hypothesis.
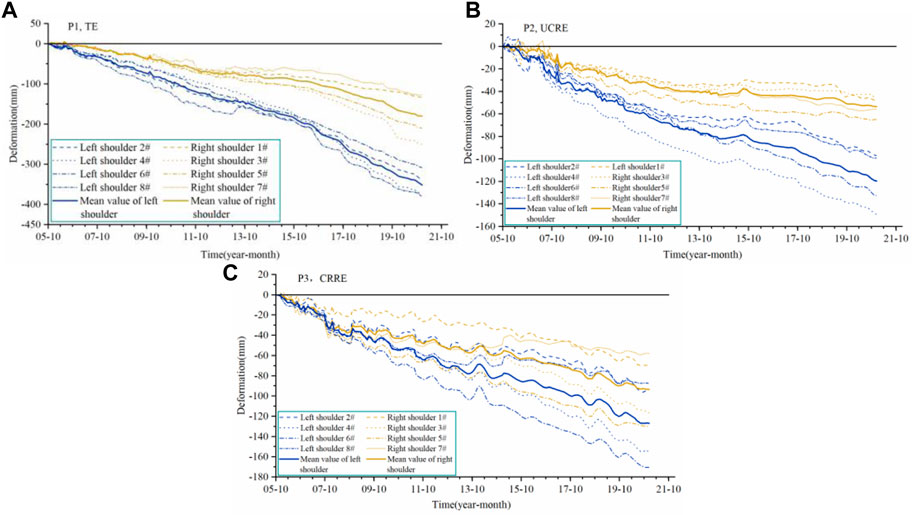
FIGURE 4. Cumulative deformation development process of the left and right embankment shoulders in the three monitoring sections. (A) P1, TE, (B) P2, UCRE, and (C) P3, CRRE.
The statistical values of the annual settlement between the left and right shoulders in the three monitored sections from 2006 to 2020 are displayed in Figure 5. As demonstrated in Figure 5A, the annual settlement of the TE varies widely and has no discernible pattern over 15 years, and the annual settlement of the left shoulder is in the range of 25.0 mm–29.7 mm during the 2016–2019, while the annual settlement of the left shoulder is in the range of 9.7 mm–21.7 mm in all other years. The development pattern of the annual settlement of the right shoulder differed slightly from that of the left shoulder, especially in 2016–2019. In the 3 years, the settlement of the left shoulder was larger (all exceeding 29 mm), while the settlement of the right shoulder was within the range of 11.0 mm–15.2 mm, and the difference in the annual settlement was particularly pronounced. As illustrated in Figure 5B, the settlement in the left shoulder was maintained within the range of 8.3 mm–12.3 mm. In addition, the settlement in the right shoulder was maintained in the range of 1.2 mm–6.2 mm for the first 5 years (2006–2010) of the UCRE, and the disparity in the annual settlement between the left and right shoulders was larger. From 2011 to 2015, the left shoulder settlement remained within the range of 3.5 mm–7.2 mm, while the right shoulder settlement was simultaneously in the range of 0.4 mm–3.8 mm. The annual settlement steadily declines, and the annual settlement of the right shoulder is always smaller than that of the left one in the corresponding years. The annual settlement between the left and right shoulders increased from 2016 to 2020, and the reasons for this phenomenon must be analyzed using ground temperature field data. In contrast, in the case of the approximate water content of permafrost and a greater embankment height (the UCRE is higher than the TE, which indicates a greater self-weight load of the embankment), the annual settlement of the UCRE has been kept at a lower value than that of the TE. It illustrates that the UCRE is effective in controlling the settlement. As depicted in Figure 5C, the settlement of the CRRE was larger in the first 2 years (2006–2007). It demonstrates that the traffic load and the self-weight load brought by the highest embankment (the embankment height is 7 m) caused a greater compression deformation between the active and warm permafrost layers under the embankment. The settlement in the left and right shoulders decreased after 2008 and preserved a more stable settlement rate. Compared to the UCRE, the settlement difference between the left and right shoulders of the CRRE is smaller.
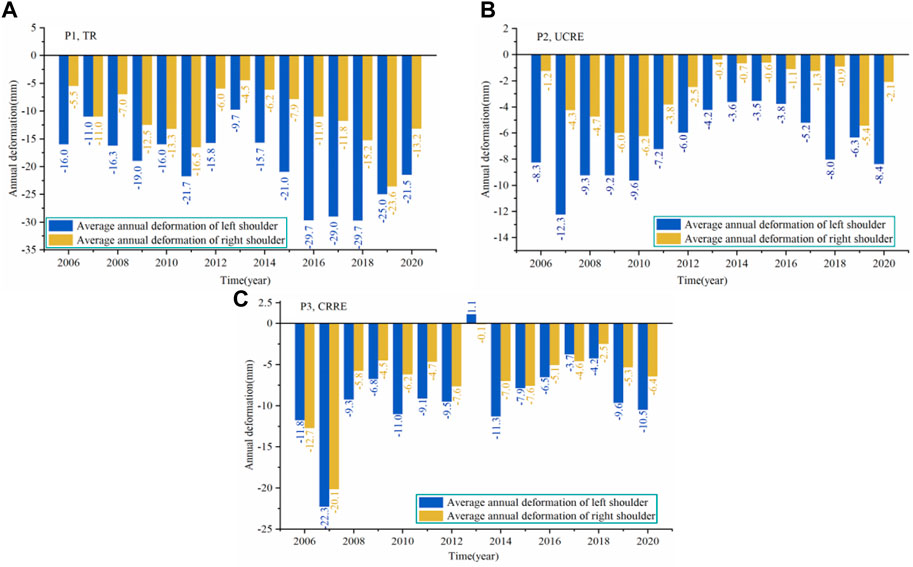
FIGURE 5. Annual deformation of the left and right embankment shoulders in the three monitoring sections. (A) P1, TE, (B) P2, UCRE, and (C) P3, CRRE.
The APT on the left and right shoulders and the difference between them to evaluate the settlement mechanism of the three embankment structures are provided in Figure 6. As shown in Figure 6A, the APT in the left and right shoulders of the TE exhibits a trend of a relatively steady increase along the operational year. It indicated that the downward shift of the APT is a significant factor in the development of the annual settlement in the TE. In addition, except for 1 year (the difference was 1.0 m in 2006), the difference in APT between the left and right shoulders was within the range of 0.5 m, and the impact of the shady–sunny slope on the APT of the TE was not essential. Since the first year of operation was 2006, the lagging impact of thermal disturbance in the preconstruction process persisted, resulting in a greater discrepancy between the APTs of the left and right shoulders. For the remainder of the time, the smaller difference between APTs of the left and right shoulders can be due to the shorter length of the embankment slope in the TE (the height of the embankment is only 0.9 m) and the slight heat difference between shaded and sunny slopes resulting from external factors such as solar radiation. For the UCRE (Figure 6B), the APT in the left and right shoulders varies within a small range over a period of 16 years (6–7 m for the left shoulder, 4.2–4.5 m for the right shoulder, and the difference between APTs of the left and right shoulders is 1.6–2.5 m). It indicated that from 2006 to 2020, the change in the APT in the UCRE was not apparent. It was not the primary reason for the variation in an annual settlement in the UCRE in the operational year. For the CRRE (Figure 6C), the APT under the left shoulder decreases yearly (from 8.6 m in 2005 to 6.8 m in 2020), while the APT under the right shoulder remains relatively constant between 4.7 m and 5.5 m. The difference in APT between the left and right shoulders similarly declines gradually and corresponds to a yearly reduction of the APT in the left shoulder. This implies that the CRRE greatly increases the APT as the operational years increase, and the annual settlement trend positively correlates with the APT change trend.
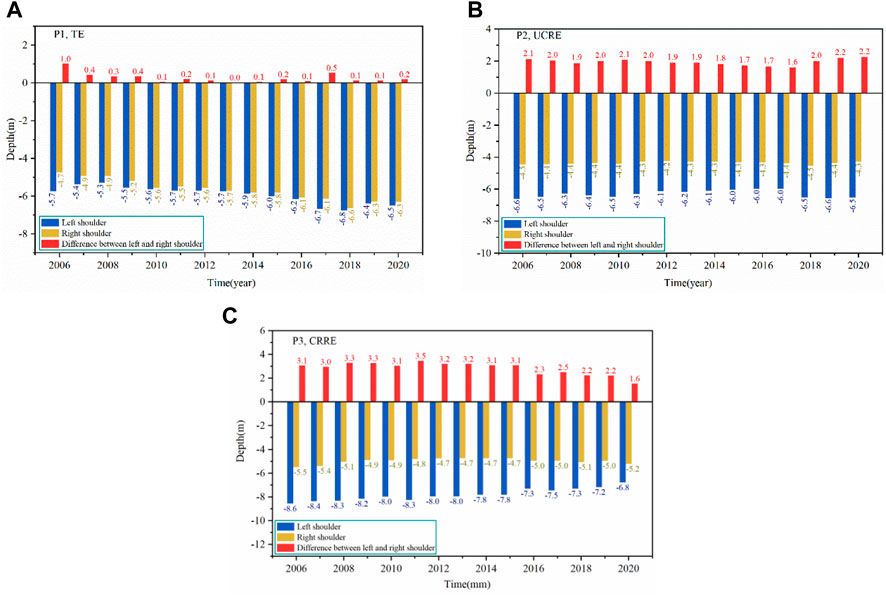
FIGURE 6. APT of the three monitoring sections. (A) P1, TE, (B) P2, UCRE, and (C) P3, CRRE.
3.2 Differential settlement characteristics
The influence of the shady–sunny slope effect on the settlement characteristics of embankment is an issue that needs to be addressed. Figure 7 depicts the cumulative settlement values of the left and right shoulders and their corresponding differential settlement values for the three monitored sections. For the TE (Figure 7A), the differential settlement of the left and right shoulders due to the shady–sunny slope impact has existed since the first operational year, 2006. In addition, the difference in the cumulative average settlement values between the left and right shoulders after 16 years of operation exceeds 160 mm. The differential settlement in the left and right shoulders between October 2005 and December 2018 maintains a rough annual growth rate (approximately 11 mm/a), while the variation of the cumulative settlement values between the left and right shoulders after December 2018 remains between 155 and 163 mm with a significantly slower annual growth rate. This can be due to the warming climate after 2018, when the settlement rates of the left and right shoulders tended to be comparable. After 16 years of operation, the average cumulative settlement value in the left shoulder of the UCRE is 125 mm, while that in the right shoulder is 58 mm (Figure 7B). The difference between the average cumulative settlement values in the left and right shoulders is more than 60 mm. In the second half of 2005, there was no notable difference in the settlement of the left and right shoulders, and the variation between 2006 and 2018 was approximately 11 mm/a. This indicates that the annual growth rate of settlement of the left and right shoulders caused by the effect of the shady–sunny slope during this period does not change significantly with the increase in the operational year. However, the growth rate of the differential settlement after 2018 significantly slowed down, which is similar to the results of the differential settlement of the TE after 2018, and the influence of climate on the differential settlement of shady–sunny slopes is verified. The differential settlement between the left and right shoulders of the CRRE remains within the range of 35 mm after 16 years of operation (Figure 7C). Before 2008, the differential settlement of the left and right shoulders constantly fluctuated at zero, which indicates that the shady–sunny slope effect of the settlement deformation of the block-berm roadbed in the first 3 years of operation was weak. From 2008 to 2012, the differential settlement deformation maintains an annual growth rate of approximately 3.5 mm/a. The influence of the shady–sunny slope effect on the settlement was prominent, and after 2012, the annual growth rate of the differential settlement slowed. In addition, comparing the results of the UCRE and the CRRE reveals that although the accumulated settlement of the left shoulder is the same in both monitoring sections (125 mm and 123 mm), the difference in the settlement of the right shoulder (shady slope side) is greater than 35 mm. This indicates that in addition to the influence of the local hydroclimatic environment on the settlement, UCRE has a greater controlling effect on the settlement than CRRE. Before 2008, the impact of the shady–sunny slope on the settlement of the CRRE was negligible. In contrast, after 2008, the effect gradually became more pronounced, which is different from the TE and the UCRE.
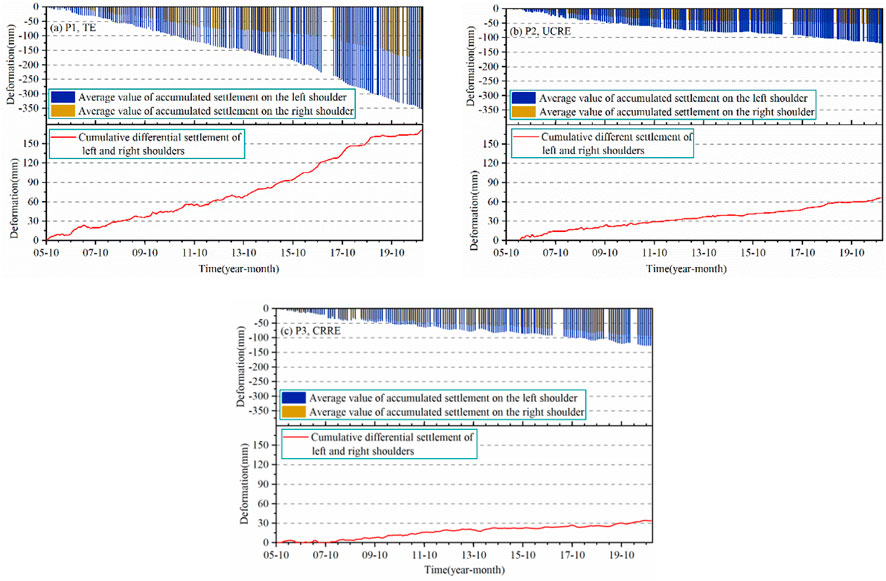
FIGURE 7. Differential settlement trend of the left and right embankment shoulders in the three monitoring sections. (A) P1, TE, (B) P2, UCRE, and (C) P3, CRRE.
3.3 Influence of the ground temperature field on the settlement characteristics
The evolutionary characteristics of the ground temperature field and the settlement under the left and right shoulders of the three monitored sections with the year of operation are depicted in Figure 8. Figure 8A demonstrates that the APT in the left shoulder of the TE decreases significantly as the operational year increases, and the APT also drops annually. However, the seasonal maximum frost depth and the APT cannot be connected after 2014, and the thawed soil layer is created between the seasonal maximum frost depth interface and the APT (Wang et al., 2021). The development of the settlement rate in the years after the formation of the thawed soil is critical, which is verified under the left and right shoulders. Notably, the formation of the thawed interlayer begins at different times in the left and right shoulders of the TE (in the left shoulder, it began at 2014, and in the right shoulder, it began at 2009) (Figures 8A, B), and the thickness of the thawed interlayer gradually grows as the operational year increases. This indicates that under the combined influence of climate warming and engineering activities, the energy balance system of the original natural ground surface is broken, and the net annual heat absorption of permafrost beneath the embankment is higher than before. As the APT declines, the active layer in the permafrost zone becomes thicker. When the shady–sunny slope effect occurs due to the alignment of the embankment, the thawed interlayer under the embankment is affected by the asymmetric temperature field, resulting in the formation of an asymmetric thawed interlayer. The cooling effect of the UCRE has a substantial protective effect on the ground temperature (Figures 8C, B), and the APT under the left shoulder changes very little after 16 operational years, while the APT under the right shoulder does not vary significantly until 2013 and tends to decrease after 2013. This demonstrates that the UCRE considerably impacts permafrost protection as the number of operational years increases. In addition, the settlement rate leads to no significant disturbance in the ground temperature field for both the left and right shoulders. The APT under the left shoulder of the CRRE varies little from year to year (Figure 8E), whereas the thawed interlayer appearance annually disrupts the settlement development. In years without a thawed interlayer, the fluctuation amplitude of the settlement curve is slightly larger, which can be related to the variation in the winter temperature between years. The cooling effect of the CRRE has a pronounced effect on the ground temperature under the right shoulder (Figure 8F). During the 16 years of operation, the APT varied minimally, and the settlement developed at a more constant deformation rate after 2008, except for small fluctuations in the first 3 years of operation. Hence, the change control of the APT under the embankment is more obvious for the CRRE, irrespective of whether the slope is sunny or shady. However, the trend of the accelerated settlement of the embankment due to the formation of a thawed interlayer on the sunny slope side must be considered.
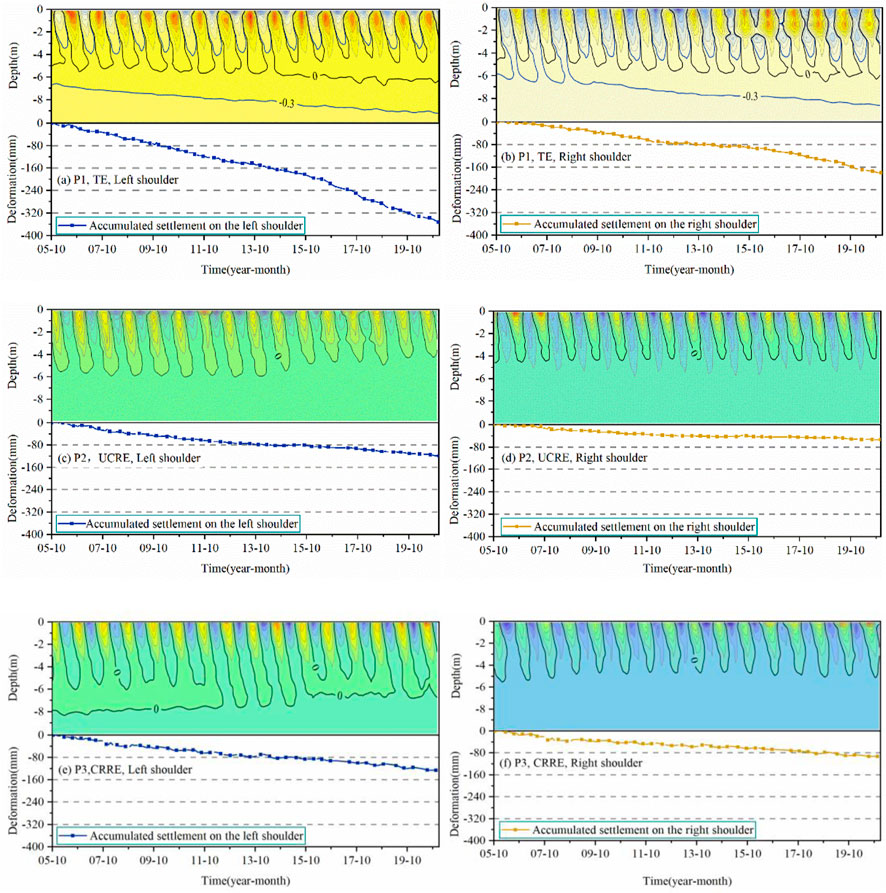
FIGURE 8. Comparison of the ground temperature and settlement deformation of the left and right embankment shoulders in the three monitoring section. (A) P1, TE, Left shoulder, (B) P1, UCRE, Right shoulder, (C) P2, UCRE, Left shoulder, (D) P2, UCRE, Right shoulder, (E) P3, CRRE, Left shoulder, and (F) P3, CRRE, Right shoulder.
4 Discussion
Combined with the changes in the ground temperature field (Figure 8), the settlement sources of three types of embankments are slightly different. For the TE, the thermal disturbance brought by the roadbed construction leads to the appearance of a thawed interlayer. The TE has no “active-cooling” function, which leads to the further development of the thawed interlayer. It accelerated the degradation of permafrost, and the APT drops annually; there exists continuous development of the embankment settlement with no signs of slowing down. The roadbed of QTR has been constructed in 2003; in the first few years after construction, the compression deformation within the active layer was basically completed. The continuous development of settlement in the operational process is mainly due to the thaw settlement deformation of the permafrost layer near the APT and the creep deformation of the warm permafrost layer. For the CRE, it is shown that the diameter of crushed rock determines the porosity. The porosity is a key parameter affecting the air convection effect of the open CRE (He et al., 2006; Liu et al., 2017). The thickness of the crushed rock layer mainly affects the heat insulation effect in summer and the convection pattern inside. The presence of the crushed rock base serves as a good thermal insulation layer in summer and produces an effective cooling effect on the subgrade soil layer in winter due to forced convection and natural convection so that the UCRE can better maintain the thermal stability of underlying permafrost than the CRRE (Mu et al., 2010a; Tai et al., 2019). In the UCRE, the thickness of the crushed rock slope is 1.0 m and 0.6 m, the thickness of the crushed rock base is 1.0 m, and the particle size is 10–15 cm. In the CRRE, the thickness of the crushed rock slope is 1.2 m and 0.8 m, and the particle size is 15–20 cm. When comparing the ground temperature field of the left shoulder (Figures 8C, E), UCRE is better than CRRE for the temperature control of permafrost under the embankment, but the cumulative settlement of both is similar. For the two types of CRE, the total cumulative settlement is less than 50% of the TE after 16 years of operation. The embankment has experienced a large settlement within the first few years after construction. The APT under the embankment basically remained stable in the later years. The continuous settlement of the embankment is mainly caused by creep deformation of the warm permafrost layer. The development of settlement is closely related to the upper load, the ice content of permafrost, the thickness of the ice-rich permafrost layer, etc. Further field survey data are needed to study this law in the future.
5 Conclusion
This study analyzes the settlement data of three typical embankment structures (TE, UCRE, and CRRE) during the 16 operational years of the QTR from 2005 to 2020 in warm permafrost areas. The following conclusions are obtained.
(1) The influence of the UCRE and the CRRE on controlling the settlement is evident during the 16 operational years, and the total cumulative settlement for both is less than 50% of the TE. The local cyclic climate change affects the controlling impact of the two types of CRE on the settlement. The annual settlement of the three types of embankment structures was related to the APT. In reality, the APT of the UCRE fluctuated within 1 m, the APT of the CRRE decreased as the number of operational years rose, and the annual settlement was positively correlated with the APT.
(2) The significant effect of the shady–sunny slope was observed on the settlement characteristics of the three types of embankment structures. The statistical results of the settlement difference between the shady and sunny slopes in the three monitoring sections after 16 operational years are as follows: The TE was greater than 160 mm, the UCRE was more than 60 mm, and the CRRE exceeded 35 mm. For the UCRE, the annual growth rate of the settlement of the left and right shoulders caused by the effect of the shady–sunny slope did not change considerably as the number of operational years increased. Before 2008, the impact of the shady–sunny slope on the CRRE settlement was negligible, and after 2008, it improved. The thermal disturbance of the ground temperature field and the effect of the shady–sunny slope in the early construction declined gradually as the number of operational years increased.
(3) In some operational years for the TE and CRRE, thawed interlayers occurred, and their existence had a major accelerating effect on the settlement of embankments. In particular, the formation of a thawed interlayer in the TE induces an annual increase in active permafrost layer thickness, and the growth rate of its annual settlement is related to the downward shift of the APT. There was no thawed interlayer for the UCRE in 16 years, and the settlement rate was not significantly disturbed by the temperature field for either the left or right shoulders. The effect of the CRRE on the protection of the ground temperature is more evident during the 16 operational years, and the APT varied within a small range. In addition to minor changes in the first 3 years of operation, the settlement curve maintains a constant deformation rate after 2008. The control of the variation in the APT is more apparent, but the rapid settlement trend on the sunny side must be noticed due to the formation of a thawed interlayer.
Data availability statement
The raw data supporting the conclusion of this article will be made available by the authors, without undue reservation.
Author contributions
YX wrote the original manuscript and curated the monitoring data. WM provided the long-term monitoring data and revised the manuscript. MS and ZZ helped to curate the monitoring data, plot the figures, and improve the manuscript. GL and DC helped in improving the manuscript. WM, GL, and DC provided the funding for research activities.
Funding
This work was supported by the Second Tibetan Plateau Scientific Expedition and Research (STEP) program (2019QZKK0905) and the Natural Science Foundation of China (Grant nos. 41630636 and 42201162).
Conflict of interest
The authors declare that the research was conducted in the absence of any commercial or financial relationships that could be construed as a potential conflict of interest.
The reviewer ML declared a shared affiliation with the authors to the handling editor at the time of review.
Publisher’s note
All claims expressed in this article are solely those of the authors and do not necessarily represent those of their affiliated organizations, or those of the publisher, the editors, and the reviewers. Any product that may be evaluated in this article, or claim that may be made by its manufacturer, is not guaranteed or endorsed by the publisher.
References
Cheng, G. (2003). Construction of qinghai-tibet railway with cooled roadbed. Chin. Rail. Sci. 24 (3), 2–5. CNKI:SUN:ZGTK.0.2003-03-001.
Cheng, G., and He, P. (2001). Linearity engineering in permafrost areas. J. Glaciol. Geocryol. 23 (3), 213–217. CNKI:SUN:BCDT.0.2001-03-000.
Cheng, G., Lai, Y., Sun, Z., and Jiang, F. (2007). The ‘thermal semi-conductor’effect of crushed rocks. Permafr. Periglac. Process. 18 (2), 151–160. doi:10.1002/ppp.575
Cheng, G., Sun, Z., and Niu, F. (2008). Application of the roadbed cooling approach in Qinghai-Tibet railway engineering. Cold Reg. Sci. Technol. 53 (3), 241–258. doi:10.1016/j.coldregions.2007.02.006
Cheng, G., Wu, Q., and Ma, W. (2009). Innovative designs of permafrost roadbed for the Qinghai-Tibet Railway. Sci. Chin. Ser. E Tec. Sci. 39 (1), 16–22. CNKI:SUN:JEXG.0.2009-02-036.
Chou, Y., Sheng, Y., Chen, J., and Chen, X. (2015). Analysis on thermal stability and deformation stability of CMR. Cold Reg. Sci. Technol. 110, 215–222. doi:10.1016/j.coldregions.2014.10.004
Chou, Y., Sheng, Y., Wei, Z., and Ma, W. (2008). Calculation of temperature differences between the sunny slopes and the shady slopes along railways in permafrost regions on Qinghai-Tibet Plateau. Cold Reg. Sci. Technol. 53 (3), 346–354. doi:10.1016/j.coldregions.2008.04.004
Doré, G., Niu, F., and Brooks, H. (2016). Adaptation methods for transportation infrastructure built on degrading permafrost. Permafr. Periglac. Process 27 (4), 352–364. doi:10.1002/ppp.1919
He, P., Cheng, G., Ma, W., and Wu, Q. (2006). Researches on ventilation properties of block stones layer. Chin. J. Geotech. Eng. 28 (6), 789–792.
Hou, Y., Wu, Q., Sun, Z., Chen, J., and Liu, Y. (2015). The coupled reinforcing effect of crushed rock slope protection and thermosyphons in Qinghai-Tibet Railway. J. Glaciol. Geocryol. 37 (1), 118–125. doi:10.7522/j.issn.1000-0240.2015.0012
Jin, H., Wen, Z., Wang, S., Yu, Q., Lu, L., Wu, Q., et al. (2008a). Assessment of frozen-ground conditions for engineering geology along the Qinghai-Tibet highway and railway, China. Eng. Geol. 101 (3/4), 96–109. doi:10.1016/j.enggeo.2008.04.001
Jin, H., Yu, Q., Wang, S., and Lu, L. (2008b). Changes in permafrost environments along the Qinghai-Tibet engineering corridor induced by anthropogenic activities and climate warming. Cold Reg. Sci. Technol. 53 (3), 317–333. doi:10.1016/j.coldregions.2007.07.005
Lai, Y., Zhang, S., Zhang, L., and Xiao, J. (2004). Adjusting temperature distribution under the south and north slopes of embankment in permafrost regions by the ripped-rock revetment. Cold Reg. Sci. Technol. 39 (1), 67–79. doi:10.1016/j.coldregions.2004.04.003
Liu, M., Li, G., Niu, F., Zhan, J., and Shang, Y. (2017). Porosity of crushed rock layer and its impact on thermal regime of Qinghai-Tibet Railway embankment. J. Cent. South Univ. 24, 977–987. doi:10.1007/s11771-017-3500-2
Luo, J., Niu, F., Wu, L., Lin, Z., Liu, M., Hou, Y., et al. (2018). Field experimental study on long-term cooling performance of sun-shaded embankments at the Qinghai-Tibet Railway, China. Cold Reg. Sci. Technol. 145, 14–20. doi:10.1016/j.coldregions.2017.09.010
Ma, W., Cheng, G., and Wu, Q. (2009). Construction on permafrost foundations: Lessons learned from the Qinghai-Tibet railroad. Cold Reg. Sci. Technol. 59 (1), 3–11. doi:10.1016/j.coldregions.2009.07.007
Ma, W., Cheng, G., and Wu, Q. (2004). Study and application of idea of dynamic design in Qinghai-Tibet railway construction. Chin. J. Geo. Eng. 26 (04), 537–540. doi:10.3321/j.issn:1000-4548.2004.04.022
Ma, W., Feng, G., Wu, Q., and Wu, J. (2008). Analyses of temperature fields under the embankment with crushed-rock structures along the Qinghai-Tibet Railway. Cold Reg. Sci. Technol. 53 (3), 259–270. doi:10.1016/j.coldregions.2007.08.001
Ma, W., Mu, Y., Li, G., Wu, Q., Liu, Y., and Sun, Z. (2013). Responses of embankment thermal regime to engineering activities and climate change along the Qinghai-Tibet Railway. Sci. Sin. Terrae 43 (3), 478–489.
Ma, W., Mu, Y., Wu, Q., Sun, Z., and Liu, Y. (2011). Characteristics and mechanisms of embankment deformation along the Qinghai-Tibet Railway in permafrost regions. Cold Reg. Sci. Technol. 67 (3), 178–186. doi:10.1016/j.coldregions.2011.02.010
Ma, W., Wen, Z., Sheng, Y., Wu, Q., Wang, D., and Feng, W. (2012). Remedying embankment thaw settlement in a warm permafrost region with thermosyphons and crushed rock revetment. Can. Geo. J. 49 (9), 1005–1014. doi:10.1139/T2012-058
Mei, Q., Chen, J., Wang, J., Hou, X., Zhao, J., Zhang, S., et al. (2021b). Strengthening effect of crushed rock revetment and thermosyphons in a traditional embankment in permafrost regions under warming climate. Adv. Clim. Change Res. 12 (1), 66–75. doi:10.1016/j.accre.2021.01.002
Mei, Q., Chen, J., Zhang, S., Hou, X., Zhao, J., Wang, J., et al. (2021a). Experimental and numerical analyses of the thermal regime of a traditional embankment in permafrost Regions. Adv. Mat. Sci. Eng. 2021, 1–13. doi:10.1155/2021/7185616
Mu, Y., Ma, W., Li, G., Liu, Y., and Mao, Y. (2010b). “Thermal differences between right and left portions of air-convection crushed-rock embankment in permafrost regions,” in Proceedings 63ra Can. Geo. & 6th Can. Permafrost Conference, Calgary, Alberta, Canada, 443–451.
Mu, Y., Ma, W., Li, G., Mao, Y., and Liu, Y. (2020). Long-term thermal and settlement characteristics of air convection embankments with and without adjacent surface water ponding in permafrost regions. Eng. Geol. 266, 105464. doi:10.1016/j.enggeo.2019.105464
Mu, Y., Ma, W., Liu, Y., and Sun, Z. (2010a). Monitoring investigation on thermal stability of air-convection crushed-rock embankment. Cold Reg. Sci. Technol. 62 (2-3), 160–172. doi:10.1016/j.coldregions.2010.03.007
Mu, Y., Ma, W., Niu, F., Liu, Y., Richard, F., and Mao, Y. (2018). Long-term thermal effects of air convection embankments in permafrost zones: Case study of the qinghai-tibet railway, China. J. Cold Reg. Eng. 32 (4), 05018004. doi:10.1061/(ASCE)CR.1943-5495.0000166
Mu, Y., Ma, W., Wu, Q., Sun, Z., and Liu, Y. (2012a). Cooling processes and effects of crushed rock embankment along the Qinghai-Tibet Railway in permafrost regions. Cold Reg. Sci. Technol. 78, 107–114. doi:10.1016/j.coldregions.2012.01.014
Mu, Y., Ma, W., Wu, Q., Sun, Z., Liu, Y., and Qu, G. (2012b). Thermal regime of conventional embankments along the Qinghai-Tibet Railway in permafrost regions. Cold Reg. Sci. Technol. 70, 123–131. doi:10.1016/j.coldregions.2011.08.005
Niu, F., Liu, M., Cheng, G., Lin, Z., Luo, J., and Yin, G. (2015). Long-term thermal regimes of the Qinghai-Tibet Railway embankments in plateau permafrost regions. Sci. China Earth Sci. 58 (9), 1669–1676. doi:10.1007/s11430-015-5063-0
Qi, J., Yao, X., Yu, F., and Liu, Y. (2012). Study on thaw consolidation of permafrost under roadway embankment. Cold Reg. Sci. Technol. 81, 48–54. doi:10.1016/j.coldregions.2012.04.007
Sheng, Y., Ma, W., Wen, Z., and Zhang, M. (2005). Analysis of difference in thermal state between south faced slope and north faced slope of railway embankment in permafrost region. Chin. J. Rock Mech. Eng. 24 (17), 3197–3201.
Sun, Z., Ma, W., Dang, H., Yun, H., and Wu, G. (2013). Characteristics and causes of embankment deformation for Qinghai-Tibet Railway in permafrost regions. Chin. J. Rock Soil Mech. 34 (9), 2667–2671. doi:10.16285/j.rsm.2013.09.036
Sun, Z., Ma, W., Zhang, S., Wen, Z., and Wu, G. (2018). Embankment stability of the Qinghai-Tibet Railway in permafrost regions. J. Cold Reg. Eng. 32 (1), 04018001. doi:10.1061/(ASCE)CR.1943-5495.0000153
Tai, B., Liu, J., Wang, T., Tian, Y., and Fang, J. (2017). Thermal characteristics and declining permafrost table beneath three cooling embankments in warm permafrost regions. Appl. Therm. Eng. 123, 435–447. doi:10.1016/j.applthermaleng.2017.05.031
Tai, B., Wu, Q., Zhang, Z., and Xu, X. (2019). Cooling performance and deformation behavior of crushed-rock embankments on the Qinghai-Tibet Railway in permafrost regions. Eng. Geol. 265, 105453. doi:10.1016/j.enggeo.2019.105453
Wang, H., Sun, Z., Liu, Y., and Wu, G. (2019). The monitoring analysis of the thermal-mechanical response on embankment with thawed interlayer along Qinghai-Tibet Railway. Rock Soil Mech. 40 (7), 2815–2822. doi:10.16285/j.rsm.2018.0620
Wang, H., Sun, Z., Zhang, J., Liu, Y., and Li, G. (2021). Formation and evolution of suprapermafrost taliks beneath earth-filled embankments along the Qinghai-Tibet Railway in permafrost regions. Cold Reg. Sci. Technol. 188, 103300. doi:10.1016/j.coldregions.2021.103300
Wu, Q., Hou, Y., Yun, H., and Liu, Y. (2015). Changes in active-layer thickness and near-surface permafrost between 2002 and 2012 in alpine ecosystems, Qinghai-Xizang (Tibet) Plateau, China. Glob. Planet. Change 124, 149–155. doi:10.1016/j.gloplacha.2014.09.002
Wu, Q., Liu, Y., and Hu, Z. (2011). The thermal effect of differential solar exposure on embankments along the Qinghai-Tibet Railway. Cold Reg. Sci. Technol. 66 (1), 30–38. doi:10.1016/j.coldregions.2011.01.001
Wu, Q., Liu, Y., and Yu, H. (2008). “Monitoring network of the permafrost conditions and embankment performance along the Qinghai-Tibet Railway,” in Pro. 9th Int. Con. Per., Xi’an, China, 1963–1968.
Wu, Q., Liu, Y., Zhang, J., and Tong, C. (2002). A review of recent frozen soil engineering in permafrost regions along Qinghai-Tibet Highway, China. Permafr. Periglac. Process 13 (3), 199–205. doi:10.1002/ppp.420
Wu, Q., Zhang, Z., and Liu, G. (2021). Relationships between climate warming and engineering stability of permafrost on Qinghai-Tibet plateau. J. Eng. Geol. 29 (02), 342–352. doi:10.13544/j.cnki.jeg.2020-084
Wu, Q., Zhao, H., Zhang, Z., Chen, J., and Liu, Y. (2020). Long-term role of cooling the underlying permafrost of the crushed rock structure embankment along the Qinghai-Xizang railway. Permafr. Periglac. Process 31 (1), 172–183. doi:10.1002/ppp.2027
Wu, Q., Zhao, S., Ma, W., Liu, Y., and Zhang, L. (2005). Monitoring and analysis of cooling effect of block-stone embankment for Qinghai-Tibet Railway. Chin. J. Geo. Eng. 27 (12), 1386–1390.
Yu, H. (2008). Evaluation research of roadbed stability in permafrost regions along the qinghai-tibet railway. Ph. D. Dissertation. Beijing, China: Graduate University of the Chinese Academy of Sciences.
Yu, Q., Niu, F., Pan, X., Bai, Y., and Zhang, M. (2008). Investigation of embankment with temperature-controlled ventilation along the Qinghai-Tibet Railway. Cold Reg. Sci. Technol. 53 (2), 193–199. doi:10.1016/j.coldregions.2007.07.002
Zhang, M., Lai, Y., Dong, Y., Jin, L., Pei, W., and Harbor, J. (2013). Laboratory investigation of the heat transfer characteristics of a two-phase closed thermosyphon. Cold Reg. Sci. Technol. 95, 67–73. doi:10.1016/j.coldregions.2013.08.006
Zhang, M., Lai, Y., Li, S., and Zhang, S. (2006). Laboratory investigation on cooling effect of sloped crushed-rock revetment in permafrost regions. Cold Reg. Sci. Technol. 46 (1), 27–35. doi:10.1016/j.coldregions.2006.06.003
Keywords: warm permafrost zones, embankment settlement, embankment types, shady–sunny effect, permafrost temperature
Citation: Xu Y, Shen M, Zhou Z, Ma W, Li G and Chen D (2023) Investigating characteristics of the long-term settlement of railway embankments in warm permafrost areas. Front. Environ. Sci. 11:1082354. doi: 10.3389/fenvs.2023.1082354
Received: 28 October 2022; Accepted: 13 February 2023;
Published: 24 February 2023.
Edited by:
Hong Liao, Nanjing University of Information Science and Technology, ChinaReviewed by:
Minghao Liu, Chinese Academy of Sciences (CAS), ChinaXiaoqing Peng, Lanzhou University, China
Fujun Niu, Fundação Professor Ernesto Morais, Portugal
Copyright © 2023 Xu, Shen, Zhou, Ma, Li and Chen. This is an open-access article distributed under the terms of the Creative Commons Attribution License (CC BY). The use, distribution or reproduction in other forums is permitted, provided the original author(s) and the copyright owner(s) are credited and that the original publication in this journal is cited, in accordance with accepted academic practice. No use, distribution or reproduction is permitted which does not comply with these terms.
*Correspondence: Wei Ma, bWF3ZWlAbHpiLmFjLmNu