 Yingying Xu1
 Yinpeng Zhang
- 1Business School, Wuchang University of Technology, Wuhan, China
- 2School of Economics and Management, University of Science and Technology Beijing, Beijing, China
- 3Law School, Beijing Technology and Business University, Beijing, China
- 4School of Economics and Management, Shandong Agricultural University, Taian, China
Introduction: The global pandemic since 2019 has caused crushing blow to healthy economic developments, particularly the harmonious development of environment and economy. Given the violent contradiction between health and economy, this study focuses on the controversial relationship between inflation and important environmental indicators.
Methods: Specifically, we collect monthly data on inflation and carbon returns from three representative pilots in China and make a comprehensive investigation of the relationship between carbon and inflation within the framework of the Environmental Kuznets Curve (EKC).
Results: Some significant empirical results are found. First, inflation shows a linear impact on carbon returns, despite the signals of inflation vary in pilots. Second, there exists an inverted U-shape connection in Shenzhen and Guangdong pilots. Third, inflation appears to be a non-negligible factor in pilot fluctuations, despite differences exist among pilots.
Discussion: Considering the pressing targets of carbon peaking and carbon neutrality in China, this investigation provides important implications to policy makers in implementing differentiated policies across regions, particularly in the turbulent situations caused by frequent climate policy changes and global pandemic developments.
1 Introduction
The world is in a critical period, as climate change caused by carbon emissions from fossil fuel combustion is beginning to threaten human society. Consequently, the famous Kyoto Protocol was signed in 1997, which aims to protect all human beings from potential damage resulting from climate change (Armstrong et al., 2018). Based on the protocol, countries have implemented different levels of emission reduction measures, the most famous of which is the European Union Emission Trading Scheme (EU ETS). The EU ETS transfers carbon reduction from a technical issue to a financial issue to some extent (Zhou et al., 2023). Since the establishment of EU ETS, it has become a research focus for carbon emission reduction, which has resulted in numerous achievements (Zhang et al., 2022; Zhou et al., 2023). Based on the Kyoto Protocol and other international conventions, the Paris Agreement was ratified by 193 parties in 2015 and pronounces that the global temperature increase in the 21st century was to be limited to 2°C in comparison with preindustrial levels (United Nations, 2015). The Paris Agreement clarifies the emission reduction targets in the post-Kyoto Protocol period and soon became the standard for many countries.
According to the Kyoto Protocol, developing countries, i.e., China, did not have to cut emissions before 2012. Thus, to develop the economy and accumulate carbon trading experience, China’s policymakers shifted toward implementing a domestic emission trading scheme (ETS) in 2011. Until now, the Chinese National Development and Reform Commission had established eight pilots in mainland China under the cost-efficient and effective cap-and-trade framework rather than the conventional command-and-control policies or administrative measures (Goulder et al., 2017). However, carbon trading pilots do not provide sufficient carbon reduction for a large country like China; thus, in 2017, the Chinese National Development and Reform Commission announced the establishment of a national carbon trading market. Currently, as the largest greenhouse gas emitter, China has pledged a 60%–65% reduction in carbon dioxide emissions by 2030, when China aims to achieve a carbon peak (Rhodes, 2016). Meanwhile, as a developing country, China seeks to maintain its rapid economic growth, setting an ambitious goal to reach high-income status by 2035 and to transform itself into a mid-level, high-income economy by 2050 (Cui et al., 2018). Thus, whether China can balance its ambitions to limit carbon emissions and encourage economic growth is an interesting and important topic in China.
Research on the relationship between the environment and economic development is not a new issue globally. Based on cross-country data, previous investigations used GDP and carbon emissions to represent economic growth and the environment to develop the environmental Kuznets curve model, which demonstrated that economic growth and environmental impact indicators show an inverted U-shaped relationship (Baker, 2013; Nasreen et al., 2017). In this hypothetical curve, pollution increases during the first stage of industrialization due to the lack of adequate living conditions and wealth (Dasgupta, 2002; Lin and Du, 2015). As income rises from industrialization, living standards also rise, allowing people to create cleaner workspaces and production. Furthermore, efficient and sustainable energy combined with environmental administrative measures lowers pollution (Qi et al., 2014). In middle-income societies, pollution levels begin to decline, and in high-income societies, they approach preindustrial levels (Dasgupta, 2002).
Although many studies have validated and developed the EKC, all have focused on the relationship between economic development and various environmental indicators (Gao et al., 2019; Shahbaz and Sinha, 2019; Adebayo, 2020), ignoring the booming carbon trading market. China is the largest emitter globally and is developing rapidly, which provides another natural example to test the EKC model. Nevertheless, relevant studies are limited; thus, the present study aimed to fill this potential research gap in the EKC model. This study analyzes monthly data to investigate the EKC problem and extends existing studies by testing the validity of the EKC hypothesis for carbon and inflation in China. Based on regression analysis and monthly data, this study contributes to the literature in two ways. First, to our knowledge, this is the first attempt to investigate the EKC problem in China from the perspective of carbon and inflation. Second, we tested the threshold relationships between carbon and inflation in various pilots to reveal the heterogeneity of different markets.
This study is organized as follows: Section 2 is a literature review. Section 3 provides a theoretical analysis of the relationship between carbon and inflation. Section 4 describes the data and methodology used to conduct the empirical analysis. Section 5 presents empirical results and some related discussion. Section 6 concludes this paper.
2 Literature review
2.1 Carbon prices and carbon emission
Since the beginning of carbon allowance trading, the connection between carbon price and emission demand has become a research focus as the supply of allowances is controlled by the government and is relatively stable (Koch et al., 2014). The theoretical connection suggests that if the demand for carbon emission allowances exceeds the available supply, then the prices of carbon allowance increase (Quemin, 2020). However, the results of empirical investigations vary regarding carbon prices and carbon emissions. For example, Venmans (2012) reported that carbon emissions and carbon prices were positively connected between 2005 and 2012. O’Gorman and Jotzo (2014) argued that higher carbon prices led to a significant reduction in carbon emissions, as observed in the electricity industry. Lin and Jia (2019) applied a dynamic recursive computable general equilibrium model, reporting that higher ETS prices resulted in higher carbon emission reduction. Zakeri et al. (2015) observed a non-linear connection between carbon emission reduction and carbon prices. Laing et al. (2014) reported that rising carbon prices in the EU ETS reduced carbon dioxide emissions by an average of 40–80 million tons annually.
Previous studies were mainly conducted based on the ETS in developed countries or areas, i.e., the EU, US, and Australia. However, few such studies have been conducted in developing countries, i.e., the Chinese ETS.
2.2 Inflation and economic growth
Research on inflation has mainly focused on the New Keynesian Phillips curve (NKPC). However, the theoretical connections and empirical results vary. Numerous studies have reported evidence to challenge this theory. For example, Bardsen et al. (2004) showed that economists do not accept the NKPC; thus, Nason and Smith (2008) questioned the credibility of estimating the political implications of NKPC. The authors provided evidence that it did not also match the NKPC. Galí and Gertler (2005) proposed a hybrid variant of the NKPC to associate inflation with marginal cost. Nason and Smith (2008) outlined single-equation econometric methods for studying NKPC. The two studies reported no close association between inflation and marginal costs. Recently, Mavroeidis et al. (2014) evaluated current research on the NKPC, identified the limitations of current studies, and suggested the need for new approaches and data for further NKPC progress. While new estimations and forms of the NKPC are better, they are still weak indicators of inflation dynamics (Rudd and Whelan, 2005; Abbas et al., 2016).
Although some research on the topic challenges the NKPC, circumstances vary in different situations, and empirical evidence still suggests the existence of a curve; for example, Brissimis and Magginas (2006) reported that real-time data on lagged inflation provide strong evidence in favor of the NKPC. Zobl and Ertl (2021) identified new empirical evidence proving the existence of the original NKPC in emerging, small, and open economies in Central and Eastern Europe.
2.3 Environment and economic growth
Current investigations on the environment and economic growth mainly revolve around the EKC model. However, the results are contradictory. Several studies argue that the relationships between environmental indicators and economic growth do not fit the EKC model (Grossman and Krueger, 1994; Dasgupta et al., 2002). Other research provides empirical evidence showing that the EKC model exists in cross-country contexts. For example, Lieb (2003) showed that the EKC exists for certain pollutants and under certain policy measures. Chow and Li (2014) demonstrated the presence of the EKC between carbon dioxide emissions and GDP per capita. Nasreen et al. (2017) provided evidence to support the EKC hypothesis and argued that economic development and financial stability damage and improve the environment, respectively. Shahbaz and Sinha (2019) provided empirical evidence for NKC from both national and international perspectives. Mazzanti et al. (2007), Shahbaz et al. (2010), Adebayo (2020), and Gao et al. (2019) provided abundant evidence to support the EKC in Indonesia, the Mediterranean region, Portugal, and Italy, respectively.
The results of the literature review indicate a close correlation between carbon prices and carbon emissions as well as a tight proportional relationship between inflation and economic growth. This allows carbon price and inflation to be substituted as variables in the EKC as carbon emissions and economic growth, thus creating a potential for the EKC to exist between these two variables. Grossman and Krueger (1994) argued that as the economy develops, there is an initial deterioration stage, which will change when the per capita income reaches $8,000. Currently, the per capita income in China is >$10,000; however, there is limited evidence in China about a potential EKC; thus, research on this topic is needed. Unfortunately, as the literature review indicates, extensive research in China about the EKC is lacking.
3 Theoretical analysis of the relationship between carbon and inflation
Entities covered by the ETS have allocated emission allowances; if they exceed these limits, the entities are obliged to purchase from other entities with excess allowances. Consequently, the relationship between the demand and supply of carbon allowances formed the concepts of carbon prices and the carbon market in China (Xu, 2021; Xu and Salem, 2021; Xu et al., 2022). The details of economic growth and environmental impact indicators in China’s EKC model are shown as follows: first, the environmental impact indicator, i.e., carbon emission. The relatively stable supply of carbon emission rights suggests that carbon price is a direct indicator of carbon emissions (Lin and Jia, 2019). Second, regarding economic growth, in this study, as described by Woodford (2005), we used inflation to represent the indicator. Thus, research on the EKC problem is transferred to the research on carbon price and inflation. The theoretical connections between carbon price and inflation are derived as follows.
While the supply of carbon emission allowances is relatively stable, the demand fluctuates regularly; therefore, the carbon price is mainly determined by carbon emissions (Quemin, 2020). Based on this, we hypothesized the following price-determining process:
where
The NKPC is deduced by two theories of the unemployment-price Phillips curve and Okun’s Law. The unemployment-price Phillips curve plots the negative relationship between unemployment rates and price which is indicated by the consumer price index (Samuelson and Solow, 1960). However, unemployment rates and economic growth are negatively connected (Noor et al., 2008). Thus, economic growth and price are positively correlated. Specifically, the NKPC theory, which explains the relationship between inflation and economic growth, is summarized as follows (Woodford, 2005):
where
Another theory of the EKC shows the relationship between carbon emissions and economic growth. According to the EKC, the log of carbon emissions per capita
where
4 Data and methodologies
4.1 Data
This study investigated the possible EKC relationship between carbon prices and inflation in China. Regarding carbon price data, we evaluated all eight pilots in China and finally selected three (Xu and Salem, 2021), namely, Shenzhen (SZ), Guangdong (GD), and Hubei (HB). We selected these pilots due to their higher frequency of trading carbon allowances and their representativeness among Chinese carbon pilots. Data on carbon allowance transaction prices are accessible from the regional carbon emission exchange websites of Shenzhen, Guangdong, and Hubei, respectively. We collected data on trading prices in August 2013. Data pre-processing showed that after April 2004, all the pilots had frequent transactions and could be used for empirical investigations.
We obtained CPI data from the Chinese National Bureau of Statistics (http://www.stats.gov.cn/) to represent inflation in China. The calculated returns of carbon prices and CPI and some basic descriptive statistics of the selected data are shown in Table 1.
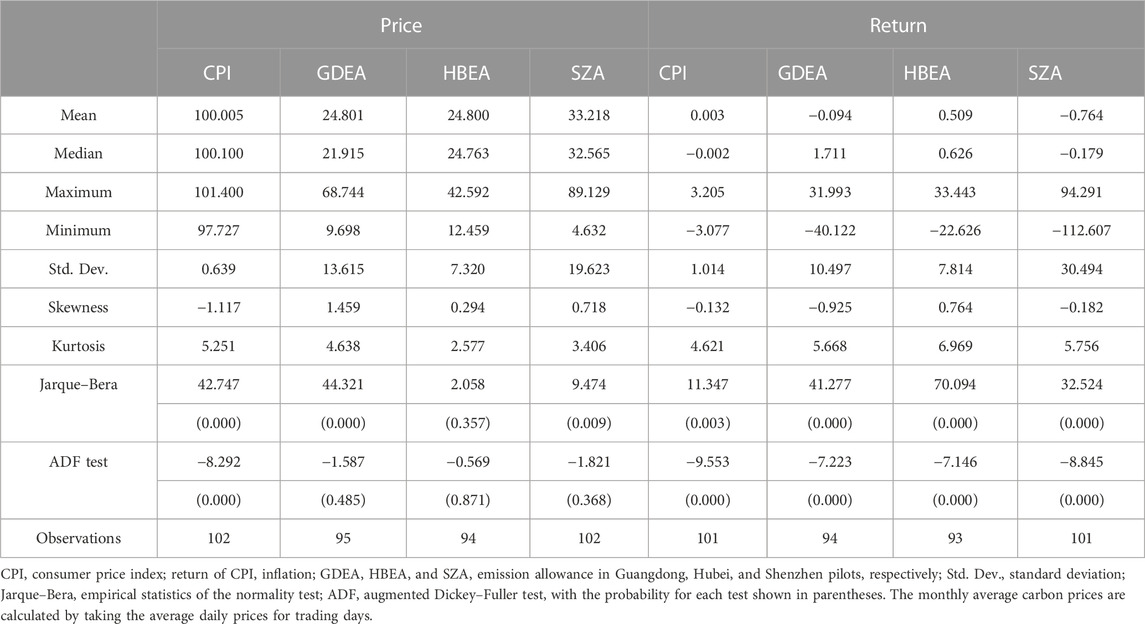
TABLE 1. Descriptive statistics of CPI and carbon prices.
As shown in Table 1, the mean values varied in the three carbon pilots. The mean value of carbon price for Shenzhen was significantly larger than those in Guangdong and Hubei. The Shenzhen carbon pilot had the largest maximum carbon price compared to the other two pilots. While the difference between maximized and minimized values for the Shenzhen pilot is the largest, the standard deviation is also the largest. These two aspects indicate that the carbon prices were more volatile in Shenzhen. The results of the Jarque–Bera tests suggest that the carbon prices in Guangdong and Shenzhen were not normally distributed. The values for skewness and kurtosis as well as the ADF test suggest that the original series is similar to the common financial series. As shown in Table 1, the mean value of CPI is 100.005 and the standard deviation and difference between the maximized and minimized CPI are small. These three aspects suggest that the CPI levels were stable from 2013 to 2022. Furthermore, the CPI does not follow a standard normal distribution and the series for CPI is stationary. Table 1 also shows that Hubei has the highest carbon return, followed by Guangdong and Shenzhen. The absolute values for the maximized and minimized returns are quite large, possibly due to inactive trading in the Chinese carbon trading pilots. The Jarque–Bera and ADF test results showed that the carbon return series have the same characteristics as the common financial time series. The mean value, the difference between maximized and minimized values, and the standard deviation further show that the CPI was stable during our sample period. The negative median growth rate of the CPI indicated negative growth in CPI for more than half of the sample collected.
To allow a more intuitive overlook of the selected data, we visualize the trends of the variables in the following Figures 1, 2. Specifically, Figure 1 shows the behavior of the CPI and carbon prices from 2013 to 2022 and Figure 2 shows the trends in inflation and carbon return. The Shenzhen pilot was the first among the three pilots to begin trading carbon allowances. The carbon prices increased sharply to about 90 yuan per ton and then showed a downward trend until the first half of 2020. Then, the prices increase to more than 40 yuan per ton and fell below 20 yuan. The carbon prices in Guangdong and Hubei showed similar trends except for the sharp increase when Guangdong started carbon trading. The prices showed a downward trend and then showed an upward trend until now. Compared to the fluctuations in Guangdong, Hubei was more stable. The CPI fluctuated from 2013 to 2022. Combining all four series, the behaviors of carbon prices in the Shenzhen pilot were more similar to the CPI trends. In contrast, the Guangdong and Hubei pilots showed their own trends, which may indicate that the prices in the two pilots were not directly associated with the changes in CPI (Figure 1).
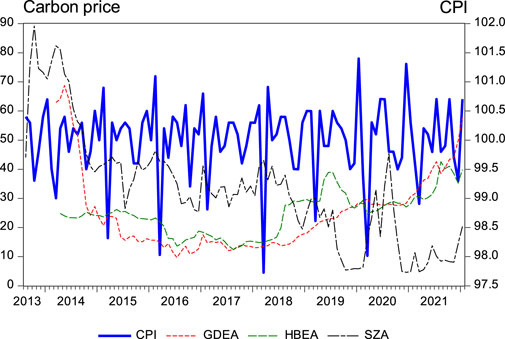
FIGURE 1. CPI (%) and carbon prices (RMB/Ton) for the Guangdong, Hubei, and Shenzhen pilots from 2013 to 2022.
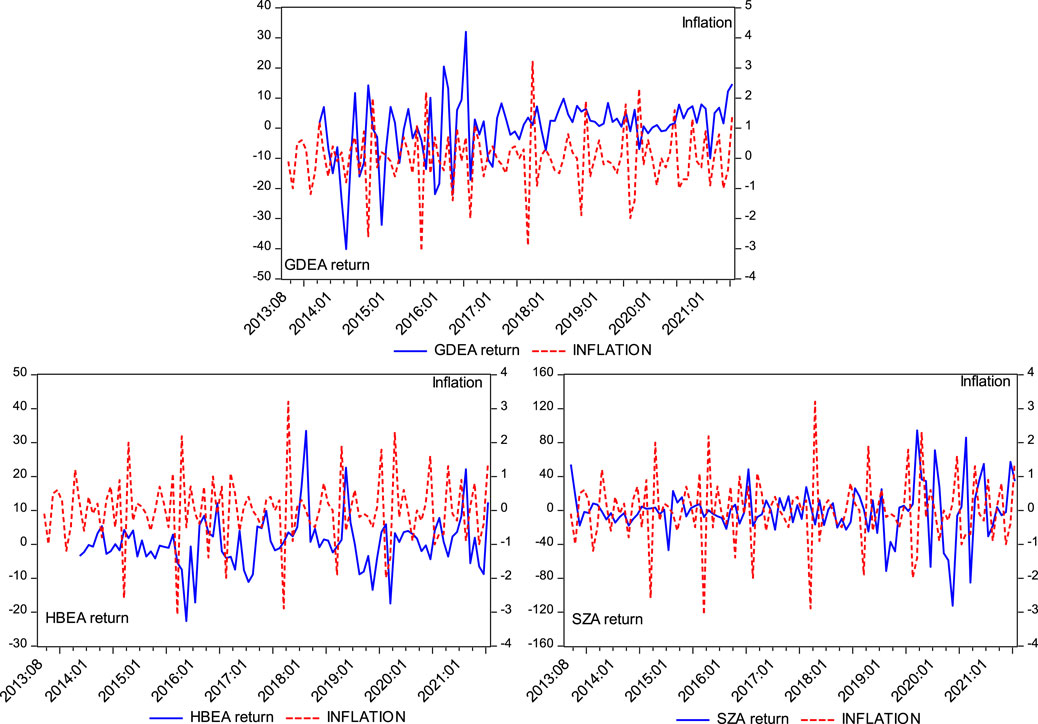
FIGURE 2. Inflation (%) and carbon returns (%) for the Guangdong, Hubei, and Shenzhen pilots from 2013 to 2022.
Figure 2 shows the behavior of inflation and carbon returns from 2013 to 2022. In the Guangdong pilot, the carbon returns fluctuated widely during 2014–2017 and then remained at a positive level after 2017, contrary to the fluctuations in inflation. The Hubei pilot showed regular changes in carbon returns; however, the return rate was notably lower than inflation. The Shenzhen pilot showed trends similar to those in the Guangdong pilot. In general, apart from occasional spikes in inflation, the carbon return levels were consistent with the inflation rates from 2013 to 2022 in the Shenzhen pilot (details on the comparisons are shown in Figure 2).
4.2 Methodologies
4.2.1 Linear model specification between inflation and carbon return
Similar to previous investigations, this paper first refers to linear model specification when investigating the connections between variables (Zhang et al., 2022; Zhou et al., 2022; Zhou et al., 2023), i.e., carbon market and inflation. Linear model specifications show several advantages in evaluating connections. Moreover, as the carbon market is considered a common financial market, it is natural to incorporate a lagged carbon return when investigating the impact of inflation on the carbon market. Specifically, this paper constructed the following linear regression model to explore the impact of inflation on the carbon price growth rate in the three carbon pilot markets:
where
Zhang et al. (2022) demonstrated that one indicator may generate both linear and non-linear impacts on another variable. Moreover, Eq. 4 shows that inflation can have a non-linear impact on the carbon growth rate. Thus, we extended Eq. 5 and introduced a squared term of inflation to the linear regression model. The potential inverted U-shaped relationship implied by the EKC model is also reflected by the parameter of the squared term. The detailed extension is depicted in Eq. 6:
The newly added explanatory variable
According to Zhou et al. (2021), it is possible for one indicator to significantly affect the volatility of another variable. Thus, in this study, based on the measurement of volatility described by Zhou et al. (2021), we calculated a squared term of carbon return and investigated the impact of inflation on carbon volatility. The detailed regression is similar to Eq. 4 and is shown in Eq. 7:
The dependent variable
4.2.2 Threshold regression
The model in Section 4.2.1 can be used to test the linear and non-linear relationships between inflation and the carbon price growth rate by adding several related items to the model to form new model specifications. However, the models cannot effectively consider changes in carbon price growth characteristics or inflation. While Vozlyublennaia (2014) reported a feedback mechanism between variables, according to EKC theory, at different stages of economic development, the connections between the environment and the economy vary. Therefore, we further adopted the threshold effect model proposed by Hansen (2000) to comprehensively investigate the relationships between inflation and carbon returns. Specifically, we set the inflation rate and carbon return as the threshold variables, respectively. In addition, the carbon prices are logarithmically transformed to mitigate data heteroscedasticity in the following empirical investigations. The detailed regression models are shown in Eqs 8–10:
where
5 Empirical analysis and discussion
5.1 Linear connections between carbon return and inflation
In this section, we estimate Eq. 5 to test the connections between inflation and the carbon market. The detailed regression results are shown in Table 2. Table 2 lists the estimation results of the multiple linear regression model. In the three pilots, inflation did not significantly affect the growth rate of carbon prices, indicating no significant linear relationship between the inflation rate and carbon return in general.
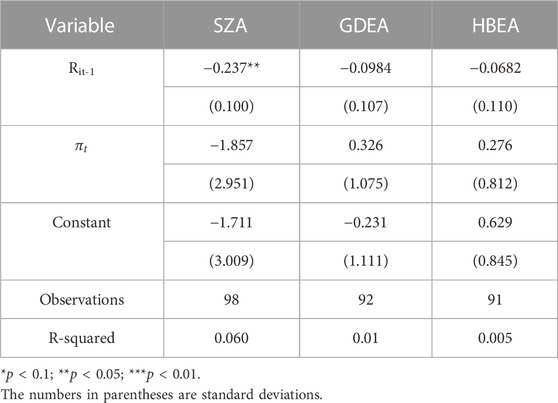
TABLE 2. Regression results of carbon price growth rate and inflation rate.
We set the monthly inflation rate and the price logarithm of carbon markets as the threshold variables to assess the relationship between inflation and the carbon price growth rate. Under different inflation or carbon price levels, the direction and magnitude of the impact of inflation on the growth rate of carbon prices differ. The related estimation results for Eq. 8 are shown in Table 3.
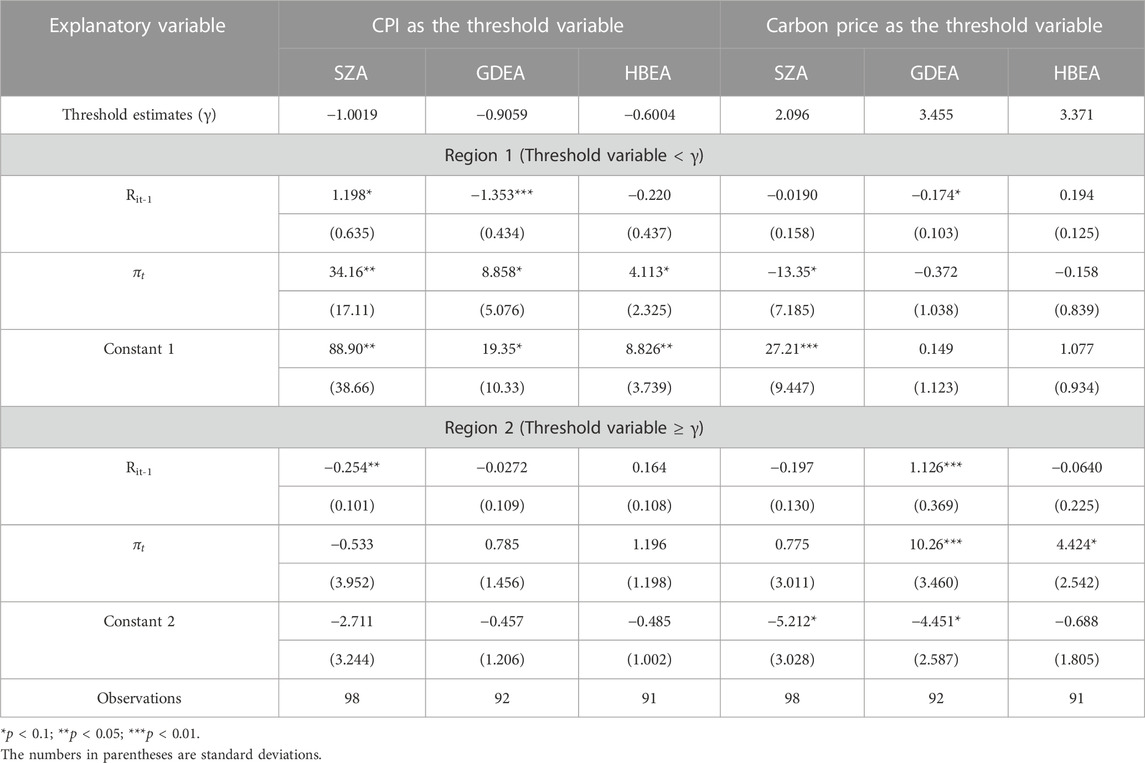
TABLE 3. Threshold regression results of carbon price growth rate and inflation rate.
5.2 Non-linear connections between carbon return and inflation
While Section 5.1 briefly explored the relationship between inflation and carbon return for linear connection, Zhang et al. (2022) showed that one variable may show a non-linear impact on another variable. Thus, according to Zhang et al. (2022), we constructed Eq. 6. The estimation results are shown in Table 4.
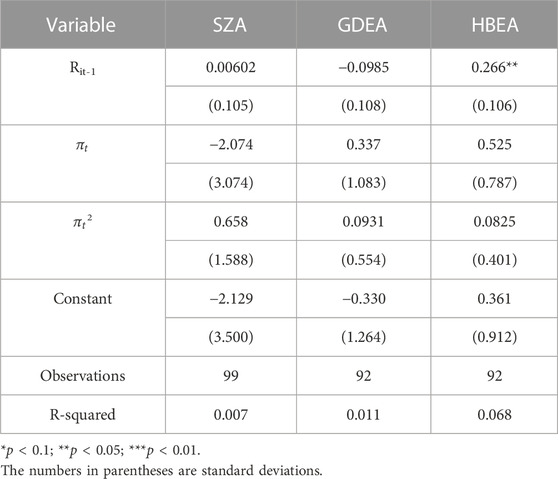
TABLE 4. Regression results of carbon price growth rate and squared inflation.
As shown in Table 4, the impacts of inflation on carbon price growth are insignificant in the three markets, consistent with the estimation results for Eq. 5. Moreover, all the squared terms are insignificant, indicating that there may not exist a U-shaped or inverted U-shaped connection between inflation and carbon return in general. Similar to Section 5.1, we implement threshold regression for Eq. 9, the estimation results of which are shown in Table 5.
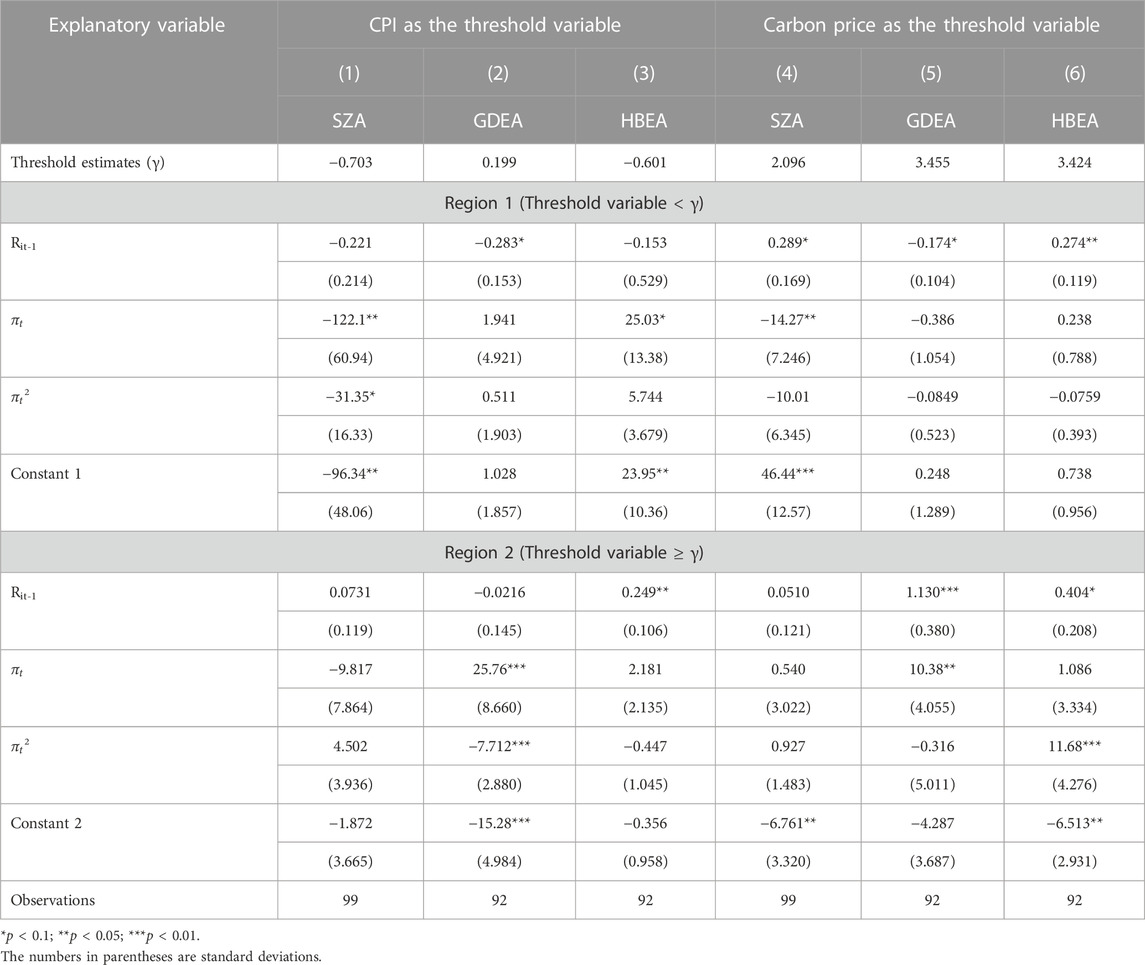
TABLE 5. Threshold regression results of carbon price growth rate and inflation square term.
5.3 Inflation and carbon volatility
Volatility is also an important factor to one asset for its importance in portfolio management and risk mitigation. This increases our interest in exploring the roles of inflation on carbon volatility. Thus, we calculated a squared term of carbon return to represent the volatility of the carbon market and re-implemented the OLS regression between carbon volatility and inflation. The related estimation results are shown in Table 6. While inflation showed negative impacts on carbon volatility in all three carbon pilots, the impacts were not significant as all the coefficients for inflation are insignificant.
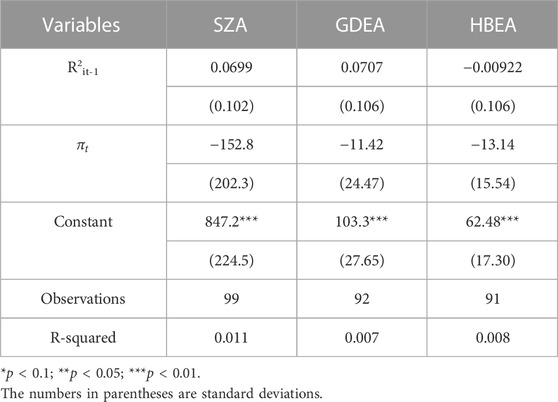
TABLE 6. Regression results of squared carbon price growth rate and inflation rate.
Similar to previous subsections, the threshold regression of Eq. 10 was also implemented. The results are shown in Table 7. The empirical estimations in Sections 5.1, 5.2, and 5.3 suggest that inflation shows both linear and non-linear effects on carbon return; however, whether there exists a U-shaped or inverted U-shaped connection is uncertain. Moreover, inflation is a crucial factor in understanding the carbon volatility in the Chinese carbon market.
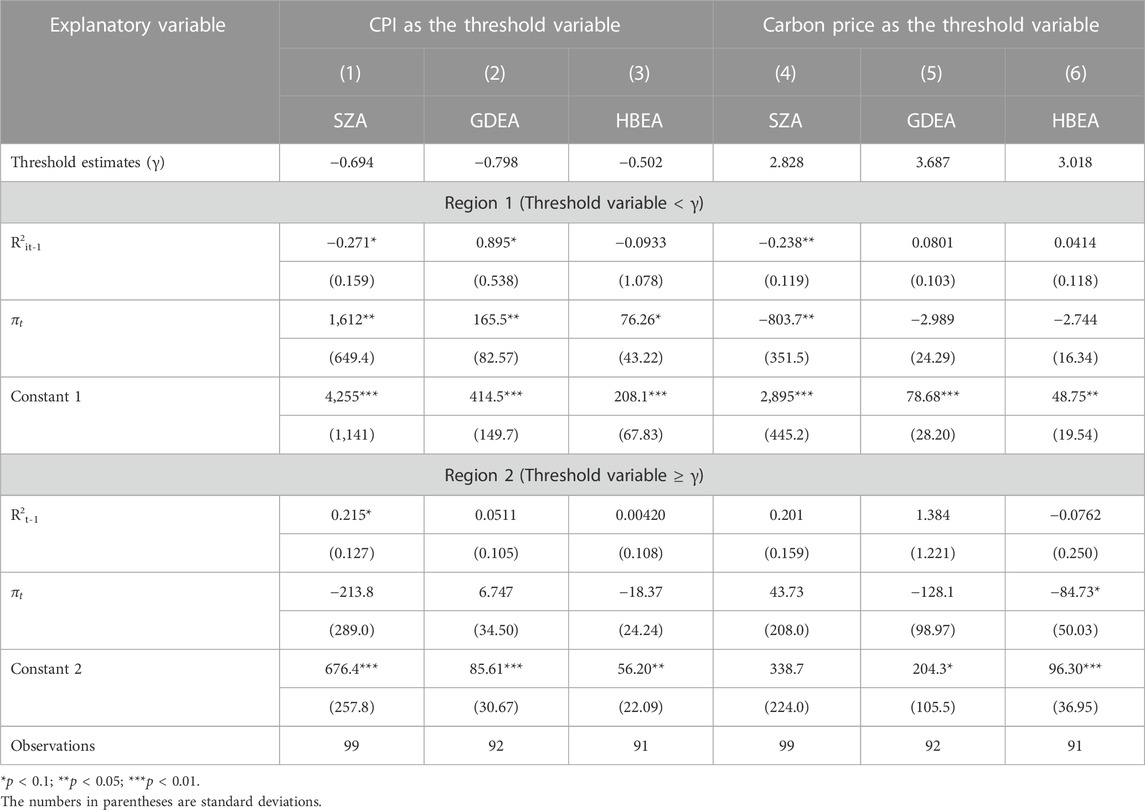
TABLE 7. Regression results of carbon price growth rate squared and inflation rate threshold.
5.4 Discussion
Table 3 reveals several interesting findings regarding the relationship between inflation and carbon return. First, when the indicator of CPI is lower than the threshold, inflation shows a positive impact on the carbon return, as all three coefficients for
Second, when the indicator of CPI is greater than the threshold, inflation does not affect the carbon return, as none of the coefficients are significant, contrary to the theoretical connection. These interesting findings may be explained by the following reasons. A CPI greater than the threshold, despite increased inflation, may indicate increased production and that the allowances allocated to emitters in China are too much in general. Combined with the fact that the carbon trading in the Chinese carbon pilot is not active enough, the carbon return may not reflect changes due to inflation. Moreover, as shown by the descriptive statistic of standard deviation in Table 1, the carbon pilots are violently fluctuating, which may result from an ignorance of inflation-related factors in the carbon market. The two aspects may account for the insignificance of inflation in the carbon market when the CPI is greater than the threshold.
Third, when the carbon return is equal to or smaller than the threshold, the signal is negative in all three pilots; however, the significance levels in the three markets vary. When the value of carbon return is smaller than the threshold, considering the rapid development of the Chinese economy, increased inflation implies that investment will bring more profits. In this case, more capital will exit the carbon pilot to other financial activities, causing a decreased carbon return. Thus, the signal between inflation and carbon return is negative. Generally, Shenzhen seems to be the region with more profit opportunities compared to the other two areas. Thus, the capital exit is more significant, causing a significant coefficient of inflation. Although the coefficients for Guangdong and Hubei are insignificant at the 10% level, the absolute value of the t-value of the coefficient in Guangdong is greater than that in Hubei due to the different economic statuses of the two regions.
Fourth, when the carbon return is equal to or greater than the threshold, the signal is positive in all three pilots, possibly due to increased production expansion caused by inflation. However, the significance levels in the three markets vary. Compared with Guangdong and Hubei, heavy industry is not a focus in Shenzhen; thus, increased inflation may not significantly affect the carbon return. However, as the Guangdong pilot covers the large emitters across Guangdong Province, increased inflation may indicate more production, causing more carbon emission demand to increase the carbon return.
As shown in Table 5, when implementing the threshold regression, the estimation results vary and are controversial compared with the results in Table 3. For example, when the CPI is selected as the threshold variable and the value is smaller than the threshold, after adding the squared term, the signal of
Four findings are indicated by the estimation results in Table 7. First, when the CPI is traded as the threshold variable and the values are smaller than the threshold, inflation shows a significant positive impact on carbon volatility in all three carbon pilots. Combined with the results in Table 3, inflation shows a great impact on carbon return, causing the carbon price to increase sharply. The results support our insights that when the economy is recovering from a recession, production expansion requires huge amounts of carbon allowances, which results in sharp increases in carbon prices. Thus, the coefficients for inflation in the estimation results are all significantly positive.
Second, when the CPI is used as the threshold variable and its values are smaller than the threshold, inflation has no impact on carbon return as all coefficients for inflation are insignificant, consistent with the estimation results in Table 3. This phenomenon may also be explained by the fact that when the economy is recovering to its normal status, the market shows relatively abundant carbon permits. In this case, the willingness of emitters to continuously purchase carbon permits is not strong enough; thus, neither the carbon return nor carbon volatility is significantly affected.
Third, as shown in Table 7,when the carbon return is selected as the threshold variable and the value is smaller than the threshold, the signals of the coefficients for inflation are negative in all three pilots. Furthermore, the impact is significant in Shenzhen, consistent with the results in Table 3. Combined with the results in Tables 3, 7, increased inflation may indicate decreased carbon return; however, due to the limited capital and inactive trading in the carbon market of Shenzhen, the fluctuations of carbon return simultaneously decrease.
Fourth, when the carbon return is selected as the threshold variable and the value is greater than the threshold, the coefficient for inflation turns from significant to insignificant. Moreover, the coefficient is significantly negative in Hubei. These results suggest that when inflation increases, the carbon price in Guangdong is smoothly increasing with a certain trend, while the carbon return in Hubei is gradually converging.
5.5 Comparisons with previous investigations and implications
Numerous studies have assessed the EKC model. Recent studies have explored the issue of inflation and carbon emissions; for example, Andersson (2018) estimates the effects of inflation on carbon prices. The author reported the smaller impact of inflation on carbon prices in developed countries and the large impact in developing countries. Pardo (2021) empirically investigated the connection between inflation and carbon price, showing that inflation negatively affected carbon prices in Germany and the United Kingdom. Moessner (2022) reported that inflation and carbon emissions tend to be positively connected. The connection between inflation and carbon emission was controversial in previous investigations. Compared with international evidence on carbon emission and inflation, our results add additional empirical evidence on the connection between inflation and carbon emissions, although the results in the present study showed that inflation exerted positive or negative impacts on carbon prices. Domestic researchers in China also explored fitness in the EKC model. Zhang et al. (2009) and Peng and Bao (2006) investigated the EKC from the aspects of different pollutants, while Qu et al. (2022) and Feng et al. (2022) explored the EKC model in different industries. The results showed U-shaped or inverted U-shaped connections between the environment and economic development. However, to our knowledge, current investigations on the EKC model in China did not consider the connection between carbon emission and inflation. Thus, our results may provide a new insight for researchers in China to comprehensively explore the EKC theory.
The results of this paper demonstrating that inflation is an important factor when the market is pricing Chinese carbon allowances may show certain theoretical and practical implications, as well as policy recommendations. Theoretically, our results further extend the EKC theory by testing the connections between carbon markets and inflation in China. The results showed U-shaped or inverted U-shaped curves from inflation to the carbon market, which is uncertain, and may warrant further investigation in future research on the EKC model. Practically, the results of traditional investigations suggest that investors considering variations in carbon prices focus on the energy markets as these markets are closely connected. The results of this study provide a novel insight into understanding carbon prices. Specifically, the results remind investors to understand that the carbon market forms macro-inflation. The Chinese government is trying to balance economic growth and carbon emission; thus, our results are useful from the perspective of policy. For example, our results demonstrated that different industrial infrastructures or whether it is a coastal area affects the impacts of inflation on carbon markets. Thus, when authorities try to implement monetary policies, it is better to distinguish target areas to avoid large fluctuations in the carbon market that may be unfavorable for achieving the “carbon peak.”
6 Conclusion
The novelty of this paper lies in two aspects: first, we connected inflation and the carbon return in the framework of the EKC model; second, we selected Chinese carbon markets that are in their infancy, i.e., Shenzhen, Guangdong, and Hubei, as our research object. However, the empirical results related to the EKC model varied in different carbon pilots in mainland China. Our results can be summarized as follows: first, when sampling the original dataset on the three pilots, inflation showed no effect on carbon return, contrary to the EKC model. However, when the threshold was added to the regression model, inflation was a crucial factor for nearly all three pilots. Second, we discovered both U-shaped and inverted U-shaped connections between inflation and carbon return. The relatively developed areas such as Shenzhen and Guangdong showed an inverted U-shaped connection, while the relatively less developed Hubei showed a U-shaped connection. Third, inflation was a crucial factor in the volatility of the carbon pilots; however, possibly due to the different economic structures, the impacts of inflation varied in different pilots. In summary, our results provide evidence to illustrate the importance of inflation on carbon markets and prove the rationality of the EKC model in Chinese carbon pilots.
However, this study has several limitations. First, in this study, the model specification between carbon return and inflation is linear; however, alternative non-linear models such as the GAS model (Xu and Lien, 2020) may be preferred. Second, the Chinese national carbon market will soon operate, with sufficient trading data; thus, it is possible to obtain empirical results that fully conform to the EKC theory. The two aspects may be future research directions.
Data availability statement
The data on carbon allowance transaction prices are accessible from the regional carbon emissions exchange websites of Shenzhen, Guangdong, and Hubei. The data on CPI is from the Chinese National Bureau of Statistics.
Author contributions
YX and YP: conceptualization. YX: methodology, software, data curation, and writing—original draft preparation. YX, XL and YP: data curation and writing—reviewing and editing. YX and YZ: writing—original draft preparation and funding. YP: revising. All authors contributed to the article and approved the submitted version.
Funding
This research was funded by the National Natural Science Fund of China (grant number 72203019).
Conflict of interest
The authors declare that the research was conducted in the absence of any commercial or financial relationships that could be construed as a potential conflict of interest.
Publisher’s note
All claims expressed in this article are solely those of the authors and do not necessarily represent those of their affiliated organizations, or those of the publisher, the editors, and the reviewers. Any product that may be evaluated in this article, or claim that may be made by its manufacturer, is not guaranteed or endorsed by the publisher.
References
Abbas, S. K., Bhattacharya, P. S., and Sgro, P. (2016). The new Keynesian Phillips curve: An update on recent empirical advances. Int. Rev. Econ. Finance 43, 378–403. doi:10.1016/j.iref.2016.01.003
Adebayo, T. (2020). Testing the EKC hypothesis in Indonesia: Empirical evidence from the ARDL-based bounds and wavelet coherence approaches. Appl. Econ. J. 28 (1), 79–100.
Andersson, F. N. G. (2018). Estimates of the inflation effect of a global carbon price on consumer prices, investment prices, export prices and import prices. Lund, Sweden: Department of Economics School of Economics and Management, Lunds University.
Armstrong, A., Krasny, M., and Schuldt, J. (2018). Communicating climate change. Cornell University Press, Ithaca, NY, USA, 7–8.
Baker, D. (2003). The environmental Kuznets curve. J. Econ. Perspect. 17 (1), 226–227. doi:10.1257/089533003321165038
Bardsen, G., Jansen, E., and Nymoen, R. (2004). Econometric evaluation of the new keynesian Phillips curve. Oxf. Bull. Econ. Statistics 66 (1), 671–686. doi:10.1111/j.1468-0084.2004.00097.x
Brissimis, S., and Magginas, N. (2006). Inflation forecasts and the new keynesian Phillips curve. Bank of Greece Printing Works, Athens, Greece.
Chow, G. C., and Li, J. (2014). Environmental Kuznets curve: Conclusive econometric evidence for CO2. Pac. Econ. Rev. 19 (1), 1–7. doi:10.1111/1468-0106.12048
Cui, J., Zhang, J., and Zheng, Y. (2018). Carbon pricing induces innovation: Evidence from China’s regional carbon market pilots. American Economics Association, Nashville, TN, USA, 453–457.
Dasgupta, S., Laplante, B., Wang, H., and Wheeler, D. (2002). Confronting the environmental Kuznets curve. J. Econ. Perspect. 16 (1), 147–168. doi:10.1257/0895330027157
Feng, L., Zhang, W. T., Zhang, J. K., et al. (2022). Analysis on spatial-temporal characteristics and environmental Kuznets curve of non-point source pollution in the three gorges reservoir area. China Environ. Sci. 42 (7), 3325–3333. (In Chinese). doi:10.19674/j.cnki.issn1000-6923.2022.0143
Galí, J., Gertler, M., and David López-Salido, J. (2005). Robustness of the estimates of the hybrid new keynesian Phillips curve. J. Monetary Econ. 52 (6), 1107–1118. doi:10.1016/j.jmoneco.2005.08.005
Gao, J., Xu, W., and Zhang, L. (2019). Tourism, economic growth, and tourism-induced EKC hypothesis: Evidence from the mediterranean region. Empir. Econ. 60, 1507–1529. doi:10.1007/s00181-019-01787-1
Goulder, L. (2017). China’s national carbon dioxide emission trading system: An introduction. JSTOR; economics of energy and environmental policy. 6, 1-18. doi:10.2307/26189175
Grossman, G., and Krueger, A. (1995). Economic growth and the environment. Q. J. Econ. 110 (2), 353–377. doi:10.2307/2118443
Koch, N., Fuss, S., Grosjean, G., and Edenhofer, O. (2014). Causes of the EU ETS price drop: Recession, CDM, renewable policies or a bit of everything?—new evidence. Energy Policy 73, 676–685. doi:10.1016/j.enpol.2014.06.024
Laing, T., Sato, M., Grubb, M., and Comberti, C. (2014). The effects and side-effects of the EU emissions trading scheme. Wiley Interdiscip. Rev. Clim. Change 5 (4), 509–519. doi:10.1002/wcc.283
Lieb, C. (2002). “The environmental Kuznets curve: A survey of the empirical evidence and of possible causes,” in Econstor, 1–64. University of Heidelberg, Department of Economics, Heidelberg, Berlin, Germany.
Lin, B., and Du, K. (2015). Energy and CO2 emissions performance in China’s regional economies: Do market-oriented reforms matter? Energy Policy 78, 113–124. doi:10.1016/j.enpol.2014.12.025
Lin, B., and Jia, Z. (2019). Impacts of carbon price level in carbon emission trading market. Appl. Energy 239, 157–170. doi:10.1016/j.apenergy.2019.01.194
Mavroeidis, S., Plagborg-Møller, M., and Stock, J. H. (2014). Empirical evidence on inflation expectations in the new keynesian Phillips curve. J. Econ. Literature 52 (1), 124–188. doi:10.1257/jel.52.1.124
Mazzanti, M., Montini, A., and Zoboli, R. (2007). Economic dynamics, emission rrends and the EKC hypothesis: New evidence using NAMEA and provincial panel data for Italy, Fondazione Eni Enrico Mattei, Milano, Italy, 1–64.
Moessner, R. (2022). Evidence on climate policy, carbon dioxide emissions and inflation. Int. J. Glob. Warming 28 (2), 136–151. doi:10.1504/ijgw.2022.126059
Nason, J. M., and Smith, G. W. (2008). The new keynesian Phillips curve: Lessons from single-equation econometric estimation. FRB Richmond Economic Quarterly. 94. 4, 361-395.
Nasreen, S., Anwar, S., and Ozturk, I. (2017). Financial stability, energy consumption and environmental quality: Evidence from South Asian economies. Renew. Sustain. Energy Rev. 67, 1105–1122. doi:10.1016/j.rser.2016.09.021
Noor, Z., Nor, N., and Ghani, J. (2008). The relationship between output and unemployment in Malaysia: Does Okun’s Law exist? J. Econ. Manag., 1, 3, 337–344.
O’Gorman, M., and Jotzo, F. (2014). Impact of the carbon price on Australia’s electricity demand, supply and emissions. The Australian National University CCEP Working Paper, Australia.
Pardo, Á. (2021). Carbon and inflation. Finance Res. Lett. 38, 101519. doi:10.1016/j.frl.2020.101519
Peng, S. J., and Bao, Q. (2006). Economic growth and environmental pollution: An empirical test for the Environmental Kuznets Curve Hypothesis in China. Res. Financial Econ. Issues 8, 15. (In Chinese). doi:10.3969/j.issn.1000-176X.2006.08.001
Qi, T., Zhang, X., and Karplus, V. (2014). The energy and CO2 emissions impact of renewable energy development in China. Energy Policy 68, 60–69. doi:10.1016/j.enpol.2013.12.035
Qu, Y., Qin, X. Y., Wang, H. Q., and Xia, Y. F. (2022). A study on the urban synergy path of carbon neutrality in China-Threshold model based on carbon peak heterogeneity. J. China Univ. Geosciences Soc. Sci. Ed. 22 (4), 14. (In Chinese). doi:10.16493/j.cnki.42-1627/c.2022.04.005
Quemin, S. (2020). Using supply-side policies to raise ambition: The case of the EU ETS and the 2021 review. Centre for climate change economics and policy. London, UK, 1–42.
Rhodes, C. (2016). The 2015 Paris climate change conference: COP21. JSTOR; science progress. 99, 97-104. doi:10.2307/26406324
Rudd, J., and Whelan, K. (2005). New tests of the new-keynesian Phillips curve. J. Monetary Econ. 52 (6), 1–30. doi:10.17016/feds.2001.30
Samuelson, P. A., and Solow, R. M. (1960). Analytical aspects of anti-inflation policy. Am. Econ. Rev. 50 (2), 177–194. doi:10.2307/1815021
Shahbaz, M., Jalil, A., and Dube, S. (2010). “Environmental Kuznets curve (EKC): Times series evidence from Portugal,” in Munich personal RePEc archive. MPRA, Portugal.
Shahbaz, M., and Sinha, A. (2019). Environmental Kuznets curve for CO2 emissions: A literature survey. J. Econ. Stud. 46, 106-168. doi:10.1108/JES-09-2017-0249
Venmans, F. (2012). A literature-based multi-criteria evaluation of the EU ETS. Renew. Sustain. Energy Rev. 16 (8), 5493–5510. doi:10.1016/j.rser.2012.05.036
Vozlyublennaia, N. (2014). Investor attention, index performance, and return predictability. J. Bank. Finance 41, 17–35. doi:10.1016/j.jbankfin.2013.12.010
Woodford, M. (2005). Firm-specific capital and the new-keynesian Phillips curve. National Bureau of Economic Research. Cambridge, MA, USA.
Xu, Y., and Lien, D. (2020). Optimal futures hedging for energy commodities: An application of the GAS model. J. Futur. Mark. 40 (7), 1090–1108. doi:10.1002/fut.22118
Xu, Y. (2021). Risk spillover from energy market uncertainties to the Chinese carbon market. Pacific-Basin Finance J. 67, 101561. doi:10.1016/j.pacfin.2021.101561
Xu, Y., and Salem, S. (2021). Explosive behaviors in Chinese carbon markets: Are there price bubbles in eight pilots? Renew. Sustain. Energy Rev. 145, 111089. doi:10.1016/j.rser.2021.111089
Xu, Y., Xu, Z., Zhou, Y., Su, C., and Guo, L. (2022). Interactions between carbon prices and the construction industry in China: Evidence based on Network-SVAR. Build. Environ. 215, 108936. doi:10.1016/j.buildenv.2022.108936
Zakeri, A., Dehghanian, F., Fahimnia, B., and Sarkis, J. (2015). Carbon pricing versus emissions trading: A supply chain planning perspective. Int. J. Prod. Econ. 164, 197–205. doi:10.1016/j.ijpe.2014.11.012
Zhang, H. F., Zhou, F., Yang, H., and Gao, Q. (2009). Regulation performance of the win-win of environmental protection and economic development. Econ. Res. J. 3, 14–26. (In Chinese).
Zhang, Y. P., Chen, Y., Wu, Y., and Zhu, P. P. (2022). Investor attention and carbon return: Evidence from the EU-ETS. Econ. Research-Ekonomska Istraživanja 35, 709–727. doi:10.1080/1331677X.2021.1931914
Zhou, Q., Zhu, P., Wu, Y., and Zhang, Y. (2022). Research on the volatility of the cotton market under different term structures: Perspective from investor attention. Sustainability 14 (21), 14389. doi:10.3390/su142114389
Zhou, Q., Zhu, P., and Zhang, Y. (2023). Contagion spillover from bitcoin to carbon futures pricing: Perspective from investor attention. Energies 16 (2), 929. doi:10.3390/en16020929
Keywords: health economy, environment, carbon, inflation, EKC
Citation: Xu Y, Li X, Yuan P and Zhang Y (2023) Trade-off between environment and economy: The relationship between carbon and inflation. Front. Environ. Sci. 11:1093528. doi: 10.3389/fenvs.2023.1093528
Received: 15 November 2022; Accepted: 28 February 2023;
Published: 22 March 2023.
Edited by:
Simon Grima, University of Malta, MaltaCopyright © 2023 Xu, Li, Yuan and Zhang. This is an open-access article distributed under the terms of the Creative Commons Attribution License (CC BY). The use, distribution or reproduction in other forums is permitted, provided the original author(s) and the copyright owner(s) are credited and that the original publication in this journal is cited, in accordance with accepted academic practice. No use, distribution or reproduction is permitted which does not comply with these terms.
*Correspondence: Peng Yuan, eXVhbm5sQGJ0YnUuZWR1LmNu; Yinpeng Zhang, c2RfenlwQGJ1YWEuZWR1LmNu