 Yuxun Zhang
 Lei Wang1,2*
 Naiping Song
- 1Key Laboratory of Restoration and Reconstruction of Degraded Ecosystem in Northwest China, Ningxia University, Ministry of Education, Yinchuan, China
- 2College of Ecological Environment, Ningxia University, Yinchuan, China
- 3Aerospace Information Research Institute, Chinese Academy of Sciences, Beijing, China
This study investigated the vegetation growth and forage-livestock balance of desert grasslands at the village scale. This study was chosen to be conducted in the Ningxia Hui Autonomous Region, where desert grasslands are widely distributed and fragility of the environment. This paper establishes a model for estimating time series changes of above-ground biomass (AGB) in the study area based on remote sensing images from the Gaofen-6 satellite, combined with canopy spectra and AGB data of vegetated desert steppe areas. Next, the ecological carrying capacity and load of the desert steppe area were analyzed based on the number of sheep raised in different enclosures and the grazing methods employed. The status of the forage-livestock balance in the study area was assessed after measuring the crop yield of farmland. Finally, data and case support for grazing management in desert steppe were provided in combination with the research results. The study concluded that Gaofen-6 satellite images could quickly and accurately obtain information on vegetation growth and changes in desert grassland areas at a village scale. The available grazing time in a single year in the study area is inadequate to support current stocking levels. When ecological stability is the primary consideration, natural forage obtained through natural conditions cannot meet the needs of farmers for normal grazing and production activities. The suitable grazing time in the study area is limited in any year. The suitable maximum grazing intensity among all plots ranged from 0.334 to 2.541 sheep/ha. In the case of the balance between grass and livestock, the forage obtained from natural pastures could only satisfy 41.71% of the current stocking levels for sheep. Rotational grazing and subsidies for farmers help desert steppe to recover and achieve a forage-livestock balance.
1 Introduction
Natural grasslands of various types constitute the most extensive terrestrial global ecosystem (Ren et al., 2016). These natural grasslands occupy more than 30% of the terrestrial ecosystem and are essential for livestock development (Reynolds and Frame, 2005; Ali et al., 2016). Climatic conditions and precipitation of grasslands have resulted in vast areas of desert steppe that is distributed in Asia, Eastern Europe, Africa, and the Americas (Weiss et al., 2004; Pei et al., 2008; Jeddi and Chaieb 2010; Schlesinger and Jasechko 2014; Safronova 2018). As part of the global grassland ecosystem, the low productivity of desert steppe restricts large-area and large-scale grazing production. However, desert steppe plays an irreplaceable role in spatial and forage availability for regional livestock production (Wen et al., 2013). Therefore, the productivity of desert steppe is closely related to the quality of life for the local human population. The livestock rearing and grazing on the grasslands have increased with changes in the local population and the pursuit of improved quality of life. The increase in breeding and grazing pressure has significantly affected the ecological balance of the desert steppe. According to studied cases of environmental change in desert grasslands, the rapid expansion of livestock farming in pursuit of agricultural and social development has brought increasingly significant challenges to managing the fragile ecological environment of desert grasslands (Cao, Chen, and Yu 2009; Jeddi and Chaieb 2010; Chambers et al., 2014). Therefore, studying the productivity and forage-livestock balance of desert steppe is necessary.
The growth state of vegetation in desert steppe will directly affect grassland productivity. Vegetative growth on desert steppe depends mainly on precipitation and temperature (Li F et al., 2014). According to several scholars and field findings, the limitations caused by temperature and precipitation allow vegetation to grow only during part of the year on the desert steppe habitats (Gunin et al., 2019). As a result of these constraints, it is not advisable to conduct grazing activities when vegetation is not growing. When desert steppe has been heavily impacted by excessive grazing, implementing a grazing ban will be beneficial for restoring the grassland ecosystem. However, after a long recovery period, a continuous grazing ban is not conducive to conserving desert steppe resources. Some studies have shown that high-intensity grazing will inevitably affect and damage grassland ecosystems (Wen et al., 2013). By contrast, moderate grazing is conducive to improving grassland biodiversity and can improve the use of grassland resources (Liu et al., 2012; Zarekia et al., 2013), as well as help to maintain the basic structure and function of the soil (Zhan et al., 2020). Therefore, it is necessary to understand grassland productivity by understanding vegetation growth. With that knowledge, it is possible to understand the status of the balance between grassland and livestock grazing and its effects based on grassland productivity and grazing intensity.
Satellite remote sensing technology has unique advantages in monitoring and estimating ecological parameters of surface vegetation (Wan et al., 2012; Zribi et al., 2016; Ruan et al., 2021). Compared with traditional field surveys and statistical methods, remote sensing monitoring can obtain a wider range of data with relatively little basic work reducing the time and personnel need while the frequency of obtaining ground-based information can be increased. Some satellites have a sensors set in the red-edge band; products obtained through these satellites are also widely used, such as those of Sentinel-2/3, RapidEye, and Gaofen-6 (GF-6) satellites (Dhau et al., 2019; Wang et al., 2019; Bigi et al., 2021; Kang et al., 2021; Xia et al., 2022). Among them, the GF-6 wide-frame camera has set two red-edge bands, Red Edge I and II, in the middle of the red and near-infrared bands, respectively. The red-edge band of the spectrum is sensitive to the response of vegetation nutrition, biomass, canopy water content, and phenological changes and is very valuable in analyzing agricultural production. Therefore, using the red-edge band can theoretically effectively improve the sensor’s for crop classification (Li et al., 2017) and physiological parameter estimation (Li J et al., 2014; Xie et al., 2018).
The GF-6 WFV images have been initially explored for use in plant classification, vegetation parameter monitoring, and inversion (Jiang et al., 2021; Kang et al., 2021). The GF-6 satellite with 800 km wide images is additionally advantageous for use in ground-based parametric observation studies in a larger area. The shorter revisit period (4 days) allows GF-6 to acquire ground data at a higher frequency (Deng et al., 2021; Kang et al., 2021).
Generally, the methods of studying various types of ground parameter data through remote sensing data can be divided into physical and empirical models (Sahoo, Ray, and Manjunath 2015). A physical model is based on the radiation transmission mechanism of electromagnetic waves. Therefore, physical models simulate ground parameters close to natural physical processes, and the simulation results are more robust, reliable, and repeatable (Song, Dannenberg, and Hwang 2013). The main problem with a physical model is the acquisition and selection of various physical parameters. In addition, the complexity of the parameter manipulation affects the use of the physical model. Empirical models are generally simpler and mainlyinterrelationship of different parameters from remote sensing products to study ground object information (Eisfelder, Kuenzer, and Dech 2012; Lu and He 2019). These models include researcher-constructed parameters for a specific area and empirical models applicable to a wide area. A comparison of the accuracy between the simulated results and the actual accurate ground-based parameter information needs further validation due to the calculation of a wide range of parameters from a small amount of actual ground-based data. However, using the same type of data and empirical models to estimate region-specific parameters has been extensively studied (Hilker et al., 2014; Zhang et al., 2014; Wang et al., 2022). The artificial neural network (ANN) algorithm is an algorithmic mathematical model that mimics the behavioral characteristics of animal neural networks for distributed parallel information processing. The use of ANN algorithms allows the establishment of relationships between remotely sensed product data and ground parameters in a non-linear manner and has been widely used for the inversion and estimation of various parameters (Almeida et al., 2009; Lei et al., 2020; Liu et al., 2021).
The location of Ningxia Hui Autonomous Region (herein Ningxia) in northwestern China has resulted in the development of arid and semi-arid regions with extensive desert steppe that is distributed in the territory under the influence of continental semi-humid and semi-arid climates (Li et al., 2013; Li F et al., 2014). In the past decades, the desert steppe within Ningxia has also encountered conflicts between the needs for grazing and for desert steppe restoration. This study takes the desert steppe within the village scale of Ningxia as the research object. The growth of desert steppe vegetation was monitored by an analysis of GF-6 remote sensing imagery and ground data, and the productivity of desert steppe was promptly and accurately estimated. The forage-livestock balance of the desert steppe was then assessed with the extent of sheep grazed by farmers and the number of sheep raised. This goal was to use the results of grassland productivity monitoring and forage-livestock balance evaluation to regulate and guide local farmers’ grazing production and management methods.
2 Materials and methods
2.1 Study area
The study area is in Wanjigou Village (107.48°E, 37.84°N), Yanchi County, Wuzhong City, Ningxia Hui Autonomous Region, which has five natural villages under its jurisdiction (Figure 1). This is an ecologically important area where the Loess Plateau transitions into the Ordos platform, that is, from a semi-arid area to an arid area, from steppe to desert steppe, and from agricultural area to rural land (Li et al., 2013; Ji et al., 2021). The vegetation types in the study area are mainly shrublands, grasslands, and meadows.
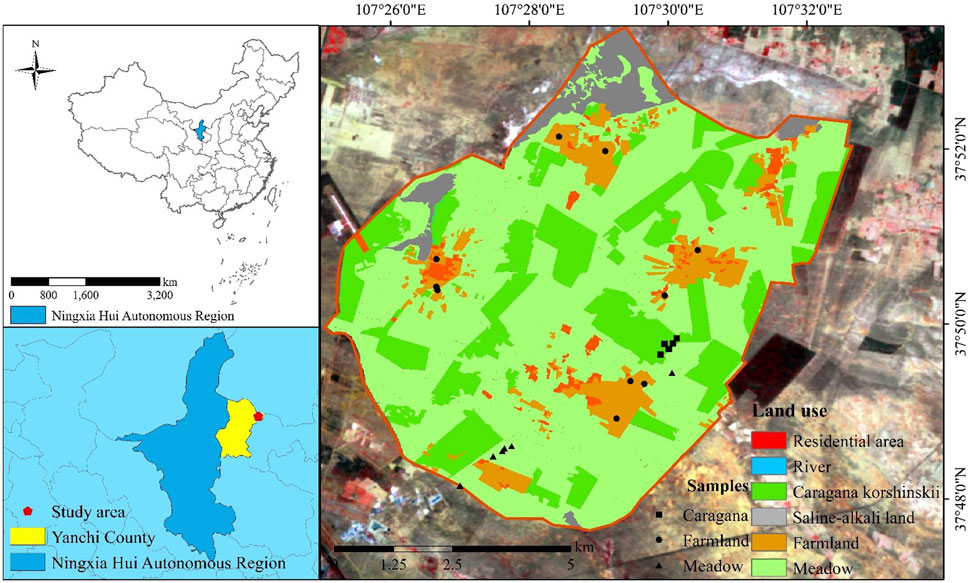
FIGURE 1. Schematic diagram of the study area and sample point distribution.
The natural vegetation in the study area is dominated by herbs and shrubs, including Caragana microphylla L., Sophora alopecuroides L., Stipa capillata L., Pennisetum centrasiaticum Tzvel., and Lespedeza bicolor Turcz. The natural vegetation in the study area does not have a specific pattern of aggregated growth and has a seemingly random distribution of various ecotypes and species. Planted vegetation was maize, potato, bean, and Caragana, which were concentrated in agricultural areas. Except for residential areas and roads, most of the land in the study area is under contract with farmers who produce crops based on their own needs. Yanchi County has had an annual average temperature of 8.91°C in the past 30 years, with cold winters, hot summers, and a significant difference in temperature between day and night. The average annual evaporation is 2,710 mm, but according to the daily 20-20 h average precipitation data for 2020 obtained from the China Meteorological Data Network (https://data.cma.cn/), the average annual precipitation is only 303.63 mm, and precipitation is scarce. Precipitation varies significantly yearly, with a maximum of 402.8 mm in wetter years and only 160.8 mm in dry years. The 205.8 mm of total precipitation received in 2020 was higher than only amounts received in 2003 and 2005 in the last 30 years. Yanchi County is the only rural county in Ningxia. It is also the region’s core production and seed preservation area of Tan sheep, a type of sheep described in Section 4.4. The income of local farmers is dependent on the livestock industry, and precipitation can directly impact the growth of vegetation on the desert steppe (Li J et al., 2014).
2.2 Experiment data
2.2.1 Remote sensing data
Multiple GF-6 remotely sensed images in the study area acquired between March and November 2020 were used in this study. The acquisition time of these remote sensing images and the product serial numbers of the images are shown in Table 1.
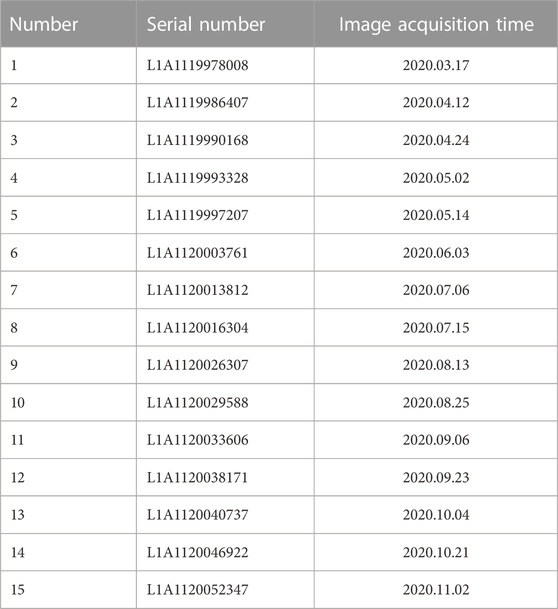
TABLE 1. Parameters of remote sensing image products.
Extensive cloud cover resulted in a relatively large time interval between any two images acquired during March, June, and August. During the remaining time, the time interval between any two images was at most 20 days for GF-6 remotely sensed images covering the research area. The L1A-level remote sensing images of GF-6 in the study were preprocessed using the radiometric calibration of ENVI 5.3 and the FLAASH atmospheric correction module software. The parameters required in the preprocessing process of each image were read from the content of the image header file, and the corresponding earth atmosphere model was selected according to the image acquisition time. The MODTRAN aerosol model was selected as Rural, and the atmospheric visibility was uniformly set to 40 km.
2.2.2 Above-ground biomass (AGB) data
The sample plots on the Meadow and Caragana forest plots were established within the scope of land under contract by farmers. We selected these plots as those under strict grazing prohibition to ensure that large mammals could not eat the grassland resources in the plots. In total, we set up 22 fixed sample plots and 187 random samples in the study area.
Six fixed plots (25 m × 25 m) were established on the grassland, and seven 1 m × 1 m sample subplots were established within the larger plots along two diagonal lines. The mean values of data from the seven subplots were calculated to represent the results of each fixed plot for subsequent validation of the remote sensing image estimation results. In addition, 187 random observation plots of 1 m2 (1 m × 1 m) each were established next to the fixed plots. The random observation samples did not have any selection principles. These random samples were selected to simulate the species composition that may occur in any area of the study area under natural conditions as much as possible.
The main plant maize crops on the Farmland plots were selected and distributed in different areas of the study area. Ten Farmland plots were established as farm observation sites in the study area. When selecting observation sites, the uniformity of maize grown in the plots was the primary indicator; next, we would consider crop growth variability. In each Farmland plot, five maize plants were selected and all plant tissues above the ground were harvested. The average of the biomass of these five maize plants was used to represent the biomass of a plot. Five fixed sample plots were established in these closed areas of Caragana, and standard branch collection methods were used to obtain biomass data of Caragana. Plant samples were processed by drying the plants in an oven initially at 105°C, then drying them at 65°C to a constant weight by measuring the weight several times until the change in weight between the two measurements was within 0.02 g. Repeated sampling at Farmland, Meadow, and Caragana plots was used to validate the estimation results at each sample collection point. Coordinates of the collection points were recorded with a handheld GPS after data collection. Data measurements and plant collections were conducted three times, each time with repeated data collection at a fixed sampling site. Random sample plots were arranged based on the vegetation growth. The three sampling periods were from Jul. 28 to Aug. 03, Aug. 29 to Sept. 2, and Sept. 23 to Sept. 25, 2020. The grassland resources were converted into standard hay according to the livestock use specified in the Chinese national standard “NY/T 635-2015” with a coefficient of 0.9, i.e., 1 kg of experimental hay collected is equivalent to 0.9 kg of standard hay. Data statistics for the three sampling types of AGB are shown in Table 2.
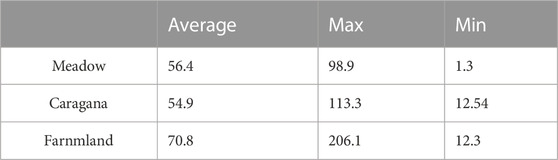
TABLE 2. Above-ground biomass data summary/(g/m2).
2.2.3 Acquisition of canopy hyperspectral data
Canopy hyperspectral data of vegetation were collected at each AGB data collection site. The acquisition time of the spectrum was stipulated to be carried out from 10:30 to 14:00 every day when the weather is clear.
A Fieldspec 4 portable spectrometer (Analytical Spectral Devices) was used for the canopy spectrum measurement, and the probe of the spectrometer was vertically downward and maintained at 2.0 m above the vegetation canopy. Before each spectral acquisition, a white standard plate was used for relative radiometric correction, and five spectral curves were measured at each data acquisition point and averaged. The Fieldspec 4 spectrometer had a spectral range of 350–2,500 nm, a spectral resolution of 3 nm at wavelengths of 350–700 nm, 10 nm of 700–1,400 nm, and a field of view of 25°. Using ENVI 5.3 software, spectral response resampling was performed on the above spectral data to obtain the corresponding GF-6 simulated reflectance data.
2.2.4 Land use and land Cover (LULC) data
The LULC data used in the research are based on 2019 BJ-2 satellite images. The division method was mainly based on visual interpretation combined with the LULC data of previous studies. All land use patterns in the area were divided into seven categories: Meadow, Caragana (mostly brushland species), Farmland, residential land, water body, sandy land, and saline-alkali land. Vegetative growth was distributed on five of these seven types of plots but not on water bodies and residential land.
2.2.5 Other data
Within Wanjigou Village, farmers manage and use most of the desert steppe in the study area by contracting or joint contracting lands and dividing them by fences. However, farmers are responsible for only their respective contracted areas. In the study, the local village government obtained data on the scope and specific boundaries of the grassland contracted by farmers in the region (Figure 2) In addition, the number of sheep raised by each farmer in the village in 2020 was collected (Table 3).
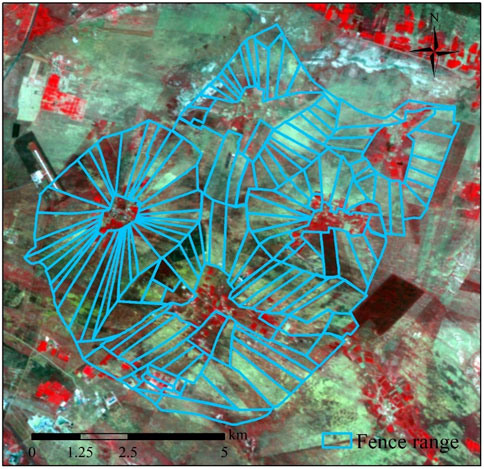
FIGURE 2. Division of grazing lands with fences of farmers in Wanjigou Village.
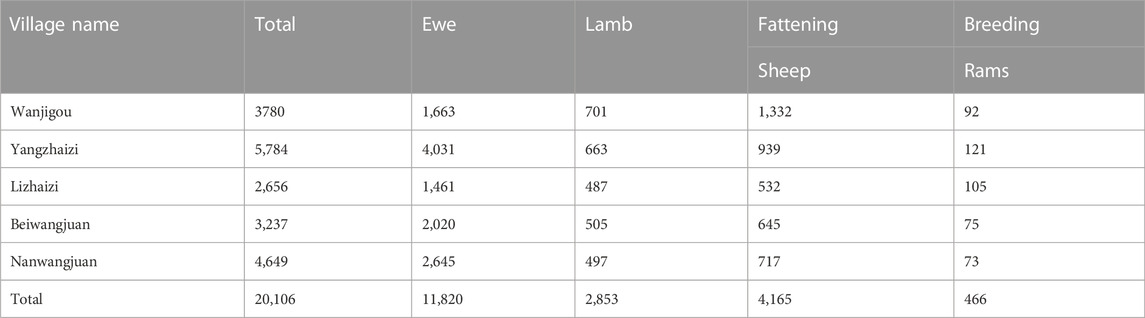
TABLE 3. Statistics of the current situation of sheep breeding in five villages administered by Wanjigou villages and analyzed.
2.3 Experiment methods
2.3.1 Vegetation indices (VIs)
A vegetation index refers to a linear or non-linear combination of the reflectivity of ground objects in two or more wavelength ranges, and the resulting value indicates plant growth and biomass (Wang et al., 2015). A vegetation index is closely related to many vegetation parameters, such as leaf area index, vegetation coverage, and vegetation canopy closure. Therefore, a vegetation index can be used to extract the location of vegetation quite well and has a strong anti-interference ability, which can eliminate the influence of solar altitude angle, satellite observation angle, terrain, cloud, and atmospheric conditions to a certain extent (Beeri and Peled 2006). In this research, a total of seven vegetation indices were used to estimate the maize leaf area index, specifically the Normalized Difference Vegetation Index (NDVI), Ratio Vegetation Index (RVI), Green Normalized Difference Vegetation Index (GNDVI), Green chlorophyll index (CIgreen), and structure insensitive pigment index (SIPI), and two red edge band indices, the constructed Red Edge Normalized Vegetation Index710 and Red Edge Normalized Vegetation Index750. The calculation expressions of each vegetation index are shown in Table 4.
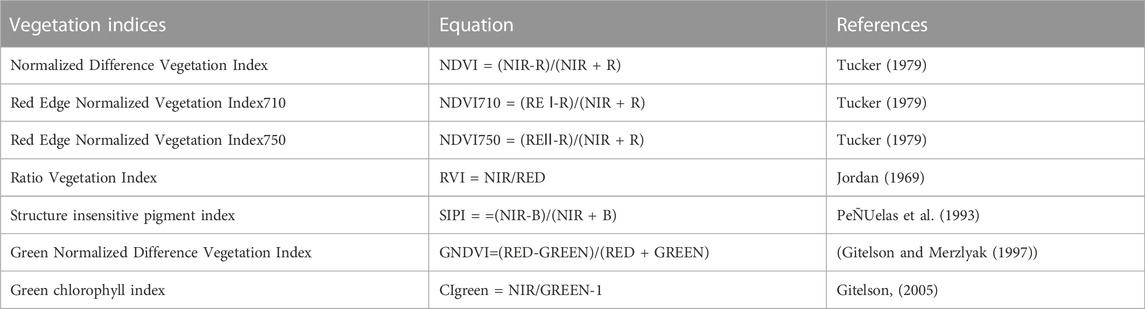
TABLE 4. Vegetation indices, equations, and reference citations.
2.3.2 Artificial neural network algorithm
The neural network structure of an ANN generally includes input, output, and several hidden layers. The structure of a specific neural network is also quite different from the structure of other neural networks based on the different neural network algorithms employed. The AGB data obtained from the Caragana, Meadow, and Farmland plots were randomly divided into training and test samples at a ratio of 4:1. The number of neurons in the hidden layer of a neural network model will directly affect the reliability and accuracy of the model establishment.
2.3.3 Evaluation of grass yield and carrying capacity
Through remote sensing image monitoring, the retained amount of vegetation AGB on the desert steppe at specific times was obtained. The retained amount obtained at any one time is both the result of the livestock activity after grazing the previous day and the supply of AGB on the grassland at the current time. Therefore, the total natural forage supply capacity or Total Natural Supply (TNS) of grassland under different grazing intensities in a growing season should be a complete result considering vegetation ground retention, growth, and grazing consumption. Available Grass Yield (AGY) was calculated based on the total amount and use of the TNS:
AGBmax is Maximum value of AGB; Gcon is the consumption of grazing; Ur is the reasonable utilization rate of grassland resources.
In the pastoral areas of China, the sheep unit is usually used as the standard for measuring various livestock parameters. That is, all types of livestock are converted into their corresponding sheep units based on China’s domestic grazing industry standard, “NY/T635-2015” (https://std.samr.gov.cn/gb/). An adult sheep weighing 45 kg is defined as one standard sheep unit, and each sheep unit consumes 1.8 kg of standard hay per day. The research makes it challenging to convert in sheep units corresponding to each sheep by weight. Therefore, according to the sheep information of the farmers, a typical adult ram and ewe is regarded as one standard sheep unit, lambs are regarded as 0.8 standard sheep units, and fattening sheep are regarded as 1.2 standard sheep units.
2.3.4 Outcome evaluation and evaluation index
After applying the estimation model to calculate the AGB, an estimation of the extracted AGB of the corresponding position in the image was conducted, and then the measured AGB data was compared with the estimation result to analyze and evaluate the accuracy of the estimation result. In the present study, the coefficient of determination (R2) and root mean square error (RMSE) were used to evaluate the accuracy of the estimation model and the estimated results. R2 can characterize the degree of correlation between real and estimated AGB, and RMSE can reflect the degree of deviation between real and estimated AGB. The larger the value of R2 and the smaller the RMSE, the better the model accuracy and the fitting effects of the estimation results. A smaller R2 value and a larger the RMSE indicate a poorer model accuracy and fitting effect of the estimation results. The R2 and RMSE calculation expressions are shown below.
3 Results and analysis
3.1 Construction and analysis of vegetation biomass monitoring model
In the process of vegetation growth, differences in the AGB per unit area of Meadow, Caragana, and Farmland in a desert steppe. However, due to the influence of factors such as growth cycle, planting conditions, or “using the same spectrum” (Beeri and Peled 2006), the vegetation indices constructed based on the spectrum on different land units may be staggered at some time. The results of the remote sensing indices over time show that Meadow, Farmland, and Caragana have a high degree of similarity in spectral characteristics at most times (Figure 3). This determines that the estimation models for the AGB of different ground feature units on the desert steppe should be carried out separately.
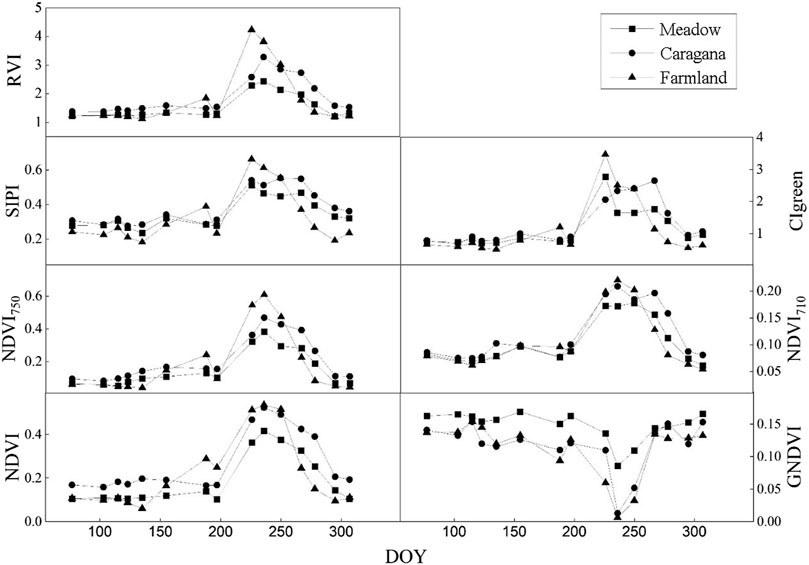
FIGURE 3. Time series change chart of vegetation indices in 2020.
In constructing the AGB estimation model of the Meadow, Caragana, and Farmland, the tansig function was selected as the excitation function. After numerous training and screening attempts, the number of neurons in the hidden layer of biomass estimation models for Meadow, Caragana, and Farmland was set to 11, 10, and 10, respectively. The accuracy of the training and test samples of the model is shown in Table 5.
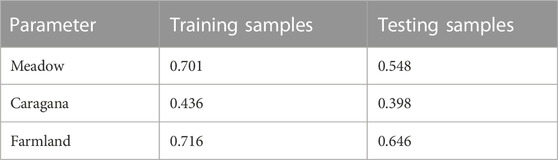
TABLE 5. Accuracy assessment of the biomass neural network model for three parameters.
The accuracy of the biomass estimation model for Farmland and Meadow was better than that for Caragana.
Due to the substantial interference and limitation of human activities in the plant growth in Farmland, the vegetation types are relatively simple because the biomass measurement of the corn crop in the field includes the weight of leaves, stalks, and seeds simultaneously. Therefore, although there is only one vegetation type, the biomass estimation model for Farmland area does not show that the accuracy is significantly higher than that of the Meadow biomass model. Compared with Meadow and Farmland, the stalk volume of Caragana was extremely large. However, the model did not separately consider the effect of branching on the biomass of Caragana, resulting in lower model accuracy.
3.2 Result and analysis of GF-6 satellite remote sensing image data
The biomass estimation models of meadow, caragana and farmland were applied to GF-6 WFV image data to obtain the time series results of grassland productivity in the study area in 2020. The changes in vegetation AGB on non-public lands in the study area in 2020 are shown in Figure 4. According to the actual planting, growth, and harvest of corn in the Farmland, only the above-ground biomass of the crop was estimated from Jun. 3 to Oct. 4. Therefore, outside the crop growth time, the biomass estimation results for the farm zone area are not shown in Figure 4.
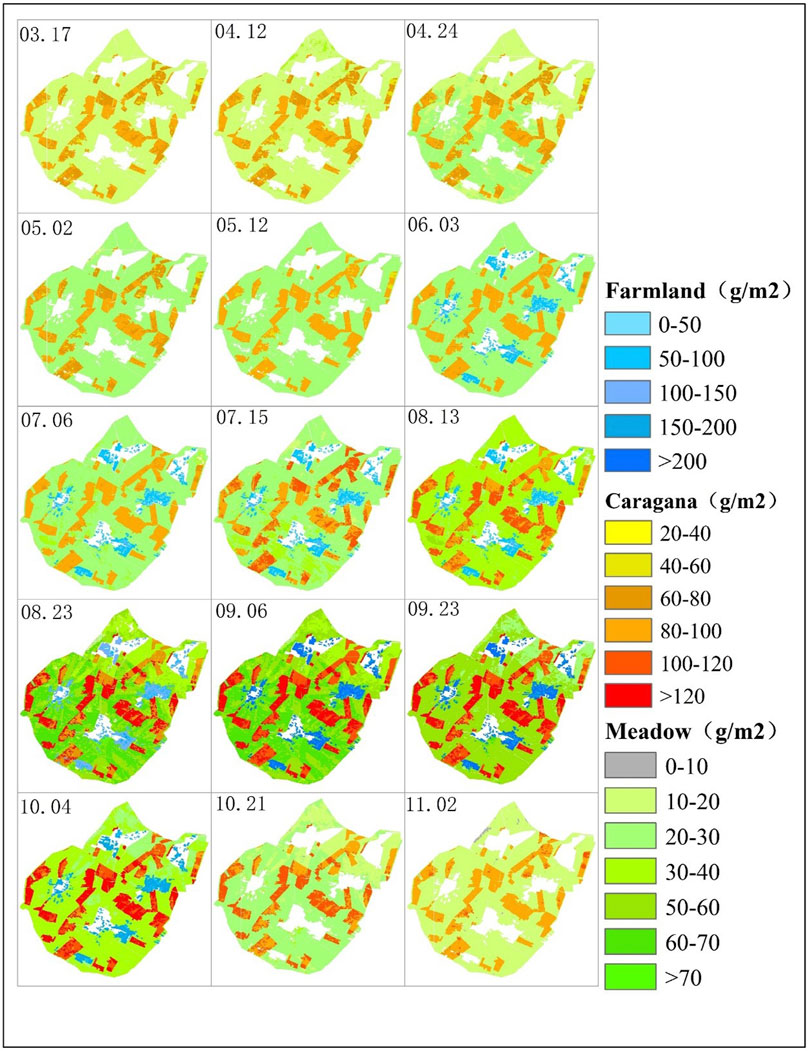
FIGURE 4. Time series diagrams of vegetation biomass in Wanjigou Village in 2020.
The extracted estimates for the 2020 growing season were compared with the AGB data collected on the ground. The comparison results are shown in Figure 5.
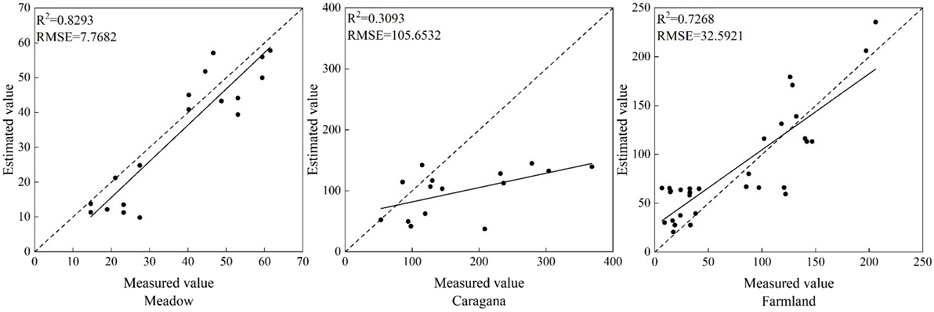
FIGURE 5. Comparison chart of estimation results.
After applying the estimation model to the GF-6 image data migration, it was found that the AGB data in the Meadow and the Farmland had very little difference, and R2 exceeded 0.7. After model migration and application, the application ability of GF-6 data was good, which can meet the requirements of AGB estimation in different periods. The comparison results of biomass data in the Caragana plots showed that R2 was only 0.3093, and the application ability of the data was weak. The data of AGB and changes in 2020 precipitation in fixed sample plots extracted from the estimation results are shown in Figure 6. The estimated results of the AGB time series in the Meadow, Caragana forest, and farmland in the study area of the desert steppe are shown in Figure 6.
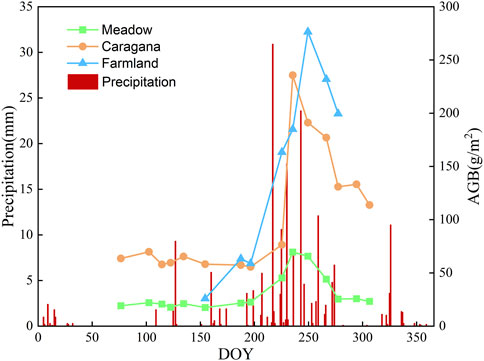
FIGURE 6. Monitoring results of biomass time series in Wanjigou Village in 2020 showing timing of precipitation and aboveground biomass (ABG) for meadow, Caragana, and farmland.
Combining the results of Figures 4, 6, during the 2020 desert steppe growing season within the administrative village of Wanjigou, the AGB on the Meadow, Caragana, and Farmland plots peaked around the time of Sept. 6.
From the perspective of the Meadow alone, the above-ground AGB in the northern and northeastern regions of the study area was lower; the saline-alkali land is mainly distributed in these areas of the study area, which is the main reason for this phenomenon. In the rest of the Meadow habitat, the retention and change in AGB estimation results in different seasons are close to this same trend. During the same period, the estimated data of AGB of Caragana groves in different regions varied little. The variation in AGB size was more closely related to the growth cycle and planting density.
The differences in AGB on the same vegetation land type land in the same period were minor. By contrast, the differences in AGB in the areas with different vegetation types were relatively significant. According to the time series estimation results of AGB in the study area (Figure 6), more vegetation grows on the desert steppe between July and October 2020, and vegetation growth is closely linked to precipitation. Combined with the results of our sampling and observation in the study area, before Jul. 15, due to the lack of precipitation, most of the remaining surface vegetation was vegetation residues and litter from the previous year. After Jul. 15, with growth and natural degradation of vegetation, the surface gradually changed from vegetation residues such as litter to fresh vegetation. After Oct. 21, the vegetation on the grassland gradually died and withered under the limitation of precipitation and temperature, and the surface vegetation gradually changed to a dry state. Before time Jul. 15 and after time Oct. 21 in 2020, no apparent change in AGB was observed for desert steppe vegetation. Therefore, grazing during these periods will leave more land bare. This activity may increase the evaporation of soil moisture on the grassland, increasing the risk of soil erosion, and may be detrimental to the stability of the grassland ecosystem. Therefore, according to the abovementioned analysis, it is considered that the suitable grazing time for the desert steppe in the study area is Jul. 15 to Oct. 21.
3.3 Available grass yield of grassland and livestock carrying capacity
The biomass of vegetation growing on grasslands differs from the total amount of plants provided to livestock in a forage situation. Therefore, the available amount of forage should be further calculated based on the growth of prepared forage. The distribution of AGY in 2020 in different enclosures based on the results of monitoring vegetation growth is shown in Figure 7. Our survey of grazing production by farmers revealed that farmers have a more uniform approach to managing the land within their contracted fences. The locations and numbers of livestock in the study area did not affect this management approach. Therefore, we averaged the total production of Meadow and Caragana within each fence. In calculating AGY for each enclosure, we excluded the area of Farmland and crop production. Caragana had a higher AGB per unit area within the same fence than did Meadow. Looking at the fenced area as the main body, the AGY reached a lower level due to the slow growth of vegetation or the smaller proportion of the Caragana planted area. About 89.62% of the fenced areas in the study area could have an AGY of more than 80 kg/ha, of which 72.89% of the land could provide a total of 80–170 kg/ha of natural forage. A large percentage of Caragana was planted in only a few fences, resulting in high AGY in these areas. Based on grazing time and hay consumption, the reasonable maximum grazing intensity for each fenced area in the grassland ranged from 0.334 to 2.541 sheep/ha during the period Jul. 15 to Oct. 21. Production and breeding data for farmers obtained from Wanjigou Village; the number of sheep entering slaughter was used as the standard. Moreover, the status of each farmer who had contracted land for livestock, and the actual grazing intensity of sheep is shown in Figure 8. This was done by comparing the time series estimation results of AGB (Figure 4) with the current grazing intensity (Figure 8). In the northeastern part of the study area, the grazing intensity was relatively high, which was consistent with the AGB estimates. In areas with higher grazing intensity, the retention of above-ground vegetation was relatively lower than the maximum amount of AGB of vegetation in a natural year.
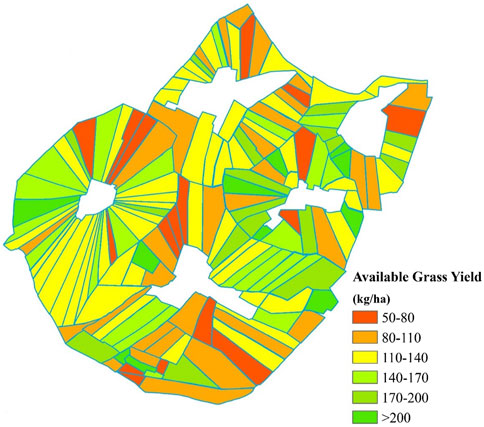
FIGURE 7. Distribution map of feed supply based on available grass yield in desert grassland in 2020.
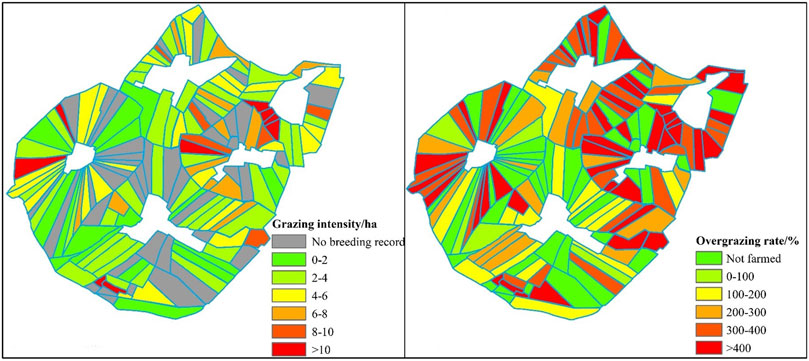
FIGURE 8. Schematic diagram of grazing intensity and overload rate in Wanjigou region in 2020.
When calculating the grazing carrying capacity, the fenced Farmland was divided into corresponding plots, and the amount of unfenced Farmland was uniformly calculated. As shown in Figure 8, when considering the balance between forage and livestock, the grazing activities in the pens of all farmers who recorded sheep breeding were severely overgrazed. When excluding unrecorded data of the number of sheep breeding pens, a total of 4,701 sheep were held in all pens in the study area during Jul. 15 to Oct. 21, meaning the total number of sheep involved in overgrazing was 16,183. The calculation of grassland overgrazing in Figure 8 does not take into account the feed supply of Farmland. Based on the time series estimation results, the total amount of silage that can be obtained from the Farmland AGB on Sept. 6 as a village was 751.82 t. It is assumed that the number of sheep that can be fed with silage during the 98 days suitable for grazing was 4,262 based on human management and control. We consider 15% of the grassland resources in desert grasslands were used rationally. Combined with the total silage from local farmland, there was a breeding deficit of 11,921 sheep, which can only meet 41.71% of the current total breeding volume. The remaining feed deficit would need to be met by purchasing feed and by other means to meet the needs of the sheep in the study area.
4 Discussion
4.1 Deviation of AGB estimation results of Caragana
Due to the limitation of AGB data and spectral collection methods in ground experiments, the estimation ability of the AGB of Caragana is still weak. We could average the biomass data of Caragana to the corresponding fences based on the planting density. However, the issue of spectral reflectance at ground level and from satellite observation scales still affects the model results. A single shrub in a Caragana grove was relatively large, and when using a spectrometer to photograph the canopy of the canopy spectrum of a particular clump of Caragana was only roughly collected and estimated. The canopy spectral data are relatively reliable in reflecting the reflectance of the canopy of Caragana in a uniform growth position. However, limited by the growth method of Caragana planted in a row, it is difficult to consider the spectral reflectance of the non-vegetation canopy between the rows in the collection of spectral data for the Caragana Chinensis forest canopy.
In the present study, averaging the AGB of Caragana based on planting density to an enclosure where it grew could reduce the observation error. Using a non-destructive method to calculate biomass requires individual sampling plants using the standard branch method. The non-destructive sampling approach also introduces errors that take time to resolve. More accurate AGB data for Caragana can be obtained in further studies by improving data collection statistics and estimation methods (MacFarlane et al., 2014). Since the AGB models for different types of vegetation in the present study were estimated separately, the bias in AGB estimation for Caragana will not affect the estimation of AGB for grassland and Farmland. However, it may affect the calculation of AGY and suitable grazing intensity.
4.2 Consider when AGB accounting data should be Used
Changes in AGB follow a pattern in temperate grasslands due to relatively suitable climate and precipitation in different areas (Piao et al., 2006; Muro et al., 2022). However, for a desert steppe ecosystem, the time suitable for vegetation growth is shorter and the variation of AGB is more dramatic (Liu et al., 2013; Han et al., 2015). The maximum value of AGB for desert steppe fundamentally limits the upper limit of grazing carrying capacity. In the present study, the estimated result of Sept. Six was taken as the maximum value of AGB in the study area. This treatment mainly considered the effects of high-intensity grazing in the desert steppe on the peak timing of AGB because in grasslands, areas that are more heavily overgrazed tend to receive more dramatic damage and, therefore, require more attention (Zhang et al., 2018; Huang et al., 2021).
According to the results of the time series AGB data collection (Figure 4), in the northern and northeastern regions of the study area, the AGB estimates for Sept. Six were higher than Aug. 23. Outside these regions, the AGB estimates for both times stayed the same or were slightly lower for Sept. Six than Aug. 23. The results of changes in AGB in these regions conflict with the trends in the fixed sample plots. Determining the time of occurrence of the peak values for AGB can directly affect the accounting of total grassland resources. Therefore, we need to pay attention to this phenomenon.
First, we extracted AGB data from the time series estimation results of the fixed observation plots. Next, we selected two Meadow plots in the study area, one located in the northeastern part and the other in the southeastern part of the study area. The two plots we selected had similar maximum estimated values of AGB (between 50 and 60 g/m2) but differed in grazing intensities (7.02 and 3.32 sheep/ha, respectively). Here, we defined them as light and heavy grazing, respectively. The specific differences in the variation between the three different plots mentioned above are shown in Figure 9. The grazed plots could not reach the maximum AGB of the ungrazed plots, and the differences in the results were similar to results from existing grazing studies (Yan, Zhou, and Zhang 2013). Next, in the lightly grazed and experimental plots, the maximum value of AGB occurred on Aug. 23. On Sept. 06, the AGB in the fixed plots decreased rapidly while the AGB in the lightly grazed plots decreased slowly, which was close to the value of the AGB on Aug. 23.
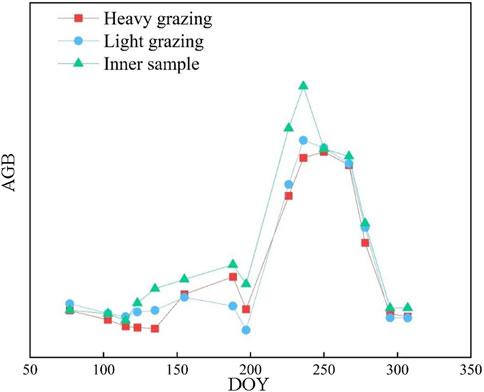
FIGURE 9. Time series changes (day of year, DOY) of the above ground biomass (ABG) vegetation index on different lands.
In addition, on the plot for heave grazing, the maximum AGB occurred on Sept. 06. From the current situation of the distribution of grazing intensity in the study area, some fences with high grazing intensity were in the northern and northeastern parts of the study area. The reason for the difference in the time of the peak of AGB is in the disturbance of AGB by high-intensity grazing. Therefore, the estimation results indicate that the maximum value of AGB in the northeast and north occurred on Sept. Six instead of Aug. 23. In our study, to consider the balance of forage and livestock in high-intensity grazing areas, we used the estimated result of Sept. 6 as the maximum value of AGB during the annual growing season. However, continuous overgrazing affects the interannual variability of grass production very significantly in a major way. Therefore, Finding the most suitable grazing intensity on different lands is an appropriate solution to problems related to overgrazing (Luo et al., 2011).
4.3 The total amount of grassland resources in the growing season
The present study used the estimated peak value of AGB during the growing season and the total theoretical maximum consumption calculated over the growing season as the grassland production capacity. Then, the results of this limited condition were analyzed to estimate the AGY of the desert steppe. This statistical approach addresses a practical and unavoidable problem when grassland resources are oriented toward production.
Current research on grass production in grasslands used for grazing using remote sensing technology still focuses on the steps needed to estimate biomass (Reinermann, Asam, and Kuenzer 2020; Zhao et al., 2020; Li et al., 2022). The results of these studies are reliable and well worthwhile in terms of the accuracy of estimation. The results of estimating grassland production are based on the state of the grassland at a given moment. However, for grazing production, more needs to be known about the growth state of the vegetation. When calculating the AGY and grazing carrying capacity of grassland, the estimation of the AGB at a specific moment still needs to be completed. The vegetation growth on the grassland at a specific moment will result from the combined effects of vegetation growth and livestock foraging. In addition, from the perspective of the forage-livestock balance, all biomass on grassland cannot simply be considered a grassland resource. This is because not all vegetation is available for livestock use in maintaining the ecological balance of grasslands (Yu et al., 2021; Han, Wang, and Yang 2022). This is especially true in desert grasslands where natural conditions provide very limited resources. However, paradoxically, grazing is a continuous activity rather than a transient behavior. Therefore, the process of grazing activity should be considered a whole over time.
In this case, the estimates of AGB in the study were both the AGB on the sampling date and the result of the grazing behavior that occurred the day before. Based on the results of changes in AGB in the desert steppe, the AGB at the beginning and the end of the growing season was approximately the same. In addition, AGB began to decline after the time when the vegetation was considered outside of the growing season. Since the number of sheep in each pen was fixed, the total grass production could be simplified to analyze the relationship between the maximum value of AGB during the growing season and the total consumption of sheep. When grazing intensity was low, the maximum value of AGB was higher, and the consumption value was smaller; when grazing intensity was high, the inverse was true. Although the unit feed intake of grazing sheep may change when grazing intensity changes, the abovementioned results and derived calculations may be different from the actual situation. However, the specifics of sheep foraging behavior under different grazing intensities have yet been fully considered (Baumont et al., 2004; Bonanno et al., 2007), and further studies are needed. The way in which we studied parameters such as AGB per unit in the study area, the effect of grazing intensity will eventually be restricted to specific areas or farmer units. Due to the heterogeneity of grazing intensity across the region, grazing intensity will only cause unpredictable errors in some parts of the study area. Combining the comprehensive resources of grasslands to analyze the carrying capacity of grasslands is the most reasonable method. However, by the abovementioned inference, it is still possible to get a general idea of the suitable carrying capacity of grasslands just by the maximum AGB value on desert grasslands.
The variation of the peak AGB and suitable grazing intensity in 2020 for fences with sheep in the study area is shown in Figure 10. The “actual grazing intensity” in the figure is only calculated based on the statistical data of the area of each fence and the number of sheep in the fence. When we excluded the data of farmers with a sheep density of more than 10 sheep/ha in the study area, 79.26% of the farmers in the remaining land had a suitable grazing intensity in the range of 0.501.48 sheep/ha. The relationship between suitable grazing intensity and the maximum AGB value in a growing season is in the limited area between the dashed lines in Figure 10. When the natural conditions are limited and the climate is similar, simply understanding the maximum production of AGB in a growing season may help us quickly and easily understand the general situation of the stocking levels of livestock that can be carried in an area. We can plan the intensity of sheep grazing on the grassland for the following year based on the vegetation growth in a given year.AGB.
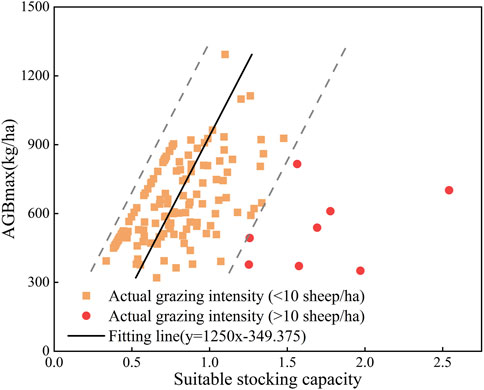
FIGURE 10. The relationship between AGBmax and the change of suitable grazing intensity.
4.4 Agro-pastoral system and pasture management
Since 2002, to better protect natural grasslands, the government of Ningxia has implemented a strict grazing ban policy. Compared with the situation in 2000, water conservation and soil protection in the desert steppe of the eastern region of Ningxia have been restored to a reasonable level and has improved to different degrees in recent years (Li F et al., 2014; Zhao et al., 2018; Zhong et al., 2020; Ji et al., 2021). The grazing ban has contributed to the restoration of the desert steppe in Ningxia in the past 2 decades (Li et al., 2013; Li J et al., 2014; Wei et al., 2020). However, the policy of a grazing ban has objectively affected the rational use of desert steppe livestock resources. Tan sheep are an essential source of income for local farmers. Based on the characteristics of this commodity, allowing sheep to forage freely in the desert steppe is a necessary process. However, according to our estimation results, arbitrary free grazing of any number of sheep on the grassland would ultimately result in overstocking that would only result in a serious overgrazing situation. Therefore, referring to the current research related to forage-livestock balance in different grasslands (Hamza and Anderson 2005; Su et al., 2005; Chu, Hou, and Jiang 2022), the conservation of grassland ecosystems can be achieved in the study area by dividing sheep into multiple batches for rotational grazing. The amount and proportion of sheep in rotational grazing can be determined based on relevant results such as the maximum biomass on the grassland. Of course, additional fodder consumption is inevitable with rotational grazing. In view of this problem, government agencies can provide feed or financial subsidies based on the need to restore the grassland contracted by farmers and the scale of farming (Bullock and King 2011; Ross et al., 2016).
In the desert steppe, the grazing behavior of farmers is spontaneous, and farmers mainly employ free foraging without fencing. These factors lead to a certain lag in the understanding farmers have related to grassland conditions. During desert steppe restoration, satellite monitoring can provide more direct and readily available information than can be acquired through field surveys. When the results of remote sensing monitoring and estimation of grassland biomass reveal that grassland vegetation is severely disturbed, farmers can be guided to graze only in suitable areas. Through guidance, irreversible damage to the desert steppe can be avoided.
Furthermore, through timely monitoring of the grassland, the number of sheep allowed to graze freely can be arranged based on the growth of vegetation. The research results of vegetation monitoring and forage-livestock balance can help land managers maintain ecologically balanced conditions of desert steppe with the help of policies and management methods designed to make full and reasonable use of grassland resources. Information technology can also contribute to grazing management and the forage-livestock balance using spatial positioning instruments to document sheep movement routes to obtain a precise picture of the area impacted by grazing (Kawamura et al., 2005; Gonzalez et al., 2015).
The focus of AGB estimation for Farmland vegetation in desert-steppe areas is on the total yield that can be harvested (including seeds and straw) rather than the taste of seeds. Therefore, when the AGB of Farmland is found to reach or exceed the maximum value, the crop should be mown in time to meet the demand for livestock. Our survey found that farmers mainly chose to harvest their crops from mid-to late-September to early-October based on their experience. However, according to our estimation of AGB, it was more appropriate to choose to harvest crops from Sept. Six to Sept. 23, 2020. Therefore, depending on the phenology of crop growth in the villages, the frequency of monitoring the crop production area can be increased during the season of crop maturity. When the yield is found to have peaked or starts to decline, farmers can be guided to harvest the crop in time to meet the production demands.
5 Conclusion
The present study collected AGB and canopy spectral data of different land use types in Wanjiagou village, Yanchi County, in 2020. The vegetation growth of the desert steppe was analyzed by estimating model pairs. The grazing activities and carrying capacity of the desert steppe were studied in conjunction with the current grazing status used by farmers in the study area.
Machine learning algorithms and GF-6 remote sensing images can quickly acquire vegetation growth in desert grassland areas. The ability of estimating AGB of grassland and farmland in the study is strong, but the ability of estimating AGB of Caragana is weak. The estimation results showed a significant difference in AGB of Meadow, Caragana, and Farmland at the same time. Under conditions of forage-livestock balance, the grassland resources obtained through desert grasslands can supply only 41.71% of the total sheep population. The reasonable maximum grazing intensity for all fences ranges from 0.334 sheep/ha to 2.541 sheep/ha.
This study can provide examples to guide farmers in the rational use of grassland resources, restoration of desert grasslands and grazing-livestock balance. These examples can serve the sustainable development of agriculture and livestock. However, this study still has potential for further exploration when faced with more specific grazing use. We will also further realize vegetation monitoring and grazing studies at larger spatial scales to support grassland grazing in large regions.
Data availability statement
The raw data supporting the conclusion of this article will be made available by the authors, without undue reservation.
Author contributions
YZ: Conceptualization, methodology, formal analysis, writing—original Draft. LW: Conceptualization, methodology, supervision, writing—review and editing, funding acquisition. XY: Supervision, writing—review and editing. YS: Resources, funding acquisition. NS: Supervision, funding acquisition.
Funding
The National Natural Science Foundation of China (No. 31760707), Key Research and Development Program of Ningxia Hui Autonomous Region (No. 2021BEG03008), Common Application Support Platform for Land Observation Satellite of National Civil Space Infrastructure (No. Y930280A2F) provided funding for this study.
Conflict of interest
The authors declare that the research was conducted in the absence of any commercial or financial relationships that could be construed as a potential conflict of interest.
The reviewer LY declared a shared parent affiliation with the author YS to the handling editor at the time of review.
Publisher’s note
All claims expressed in this article are solely those of the authors and do not necessarily represent those of their affiliated organizations, or those of the publisher, the editors and the reviewers. Any product that may be evaluated in this article, or claim that may be made by its manufacturer, is not guaranteed or endorsed by the publisher.
References
Ali, I., Cawkwell, F., Dwyer, E., Barrett, B., and Green, S. (2016). Satellite remote sensing of grasslands: From observation to management. J. PLANT Ecol. 9 (6), 649–671. doi:10.1093/jpe/rtw005
Almeida, A. C., Barros, P. L. C., Monteiro, J. H. A., and Rocha, B. R. P. (2009). Estimation of above-ground forest biomass in amazonia with neural networks and remote sensing. IEEE Lat. Am. Trans. 7 (1), 27–32. doi:10.1109/TLA.2009.5173462
Baumont, R., Cohen-Salmon, D., Prache, S., and Sauvant, D. (2004). A mechanistic model of intake and grazing behaviour in sheep integrating sward architecture and animal decisions. Animal Feed Sci. Technol. 112 (1-4), 5–28. doi:10.1016/j.anifeedsci.2003.10.005
Beeri, O., and Peled, A. (2006). Spectral indices for precise agriculture monitoring. Int. J. REMOTE Sens. 27 (9-10), 2039–2047. doi:10.1080/01431160612331392950
Bigi, V., Vigna, I., Pezzoli, A., and Comino, E. (2021). Multi-Temporal evaluation of quantitative and phenological vegetation dynamics using sentinel-2 images in north horr (Kenya). SUSTAINABILITY 13 (24), 13554. doi:10.3390/su132413554
Bonanno, A., Grigoli, A., Stringi, L., Miceli, G., Giambalvo, D., Tornambe, G., et al. (2007). Intake and milk production of goats grazing Sulla forage under different stocking rates. Ital. J. Anim. Sci. 6, 605–607. doi:10.4081/ijas.2007.1s.605
Bullock, A., and King, B. (2011). Evaluating China's slope land conversion Program as sustainable management in tianquan and wuqi counties. J. Environ. Manag. 92 (8), 1916–1922. doi:10.1016/j.jenvman.2011.03.002
Cao, S. X., Chen, L., and Yu, X. X. (2009). Impact of China's grain for green project on the landscape of vulnerable arid and semi-arid agricultural regions: A case study in northern shaanxi province. J. Appl. Ecol. 46 (3), 536–543. doi:10.1111/j.1365-2664.2008.01605.x
Chambers, J. C., Bradley, B. A., Brown, C. S., D'Antonio, C., Germino, M. J., Grace, J. B., et al. (2014). Resilience to stress and disturbance, and resistance to bromus tectorum L. Invasion in cold desert shrublands of western north America. ECOSYSTEMS 17 (2), 360–375. doi:10.1007/s10021-013-9725-5
Chu, L. Q., Hou, M. Y., and Jiang, Z. D. (2022). How does the fragmentation of pasture affect grassland ecology?- Evidence from typical pastoral areas in China. Ecol. Indic. 136, 108701. doi:10.1016/j.ecolind.2022.108701
Deng, Z. D., Lu, Z., Wang, G. Y., Wang, D. Q., Ding, Z. B., Zhao, H. F., et al. (2021). Extraction of fractional vegetation cover in arid desert area based on Chinese GF-6 satellite. OPEN GEOSCI. 13 (1), 416–430. doi:10.1515/geo-2020-0241
Dhau, I., Adam, E., Ayisi, K. K., and Mutanga, O. (2019). Detection and mapping of maize streak virus using RapidEye satellite imagery. GEOCARTO Int. 34 (8), 856–866. doi:10.1080/10106049.2018.1450448
Eisfelder, C., Kuenzer, C., and Dech, S. (2012). Derivation of biomass information for semi-arid areas using remote-sensing data. Int. J. REMOTE Sens. 33 (9), 2937–2984. doi:10.1080/01431161.2011.620034
Gitelson, A. A., and Merzlyak, M. N. (1997). Remote estimation of chlorophyll content in higher plant leaves. Int. J. Remote Sens. 18 (12), 2691–2697. doi:10.1080/014311697217558
Gitelson, A. A. (2005). Remote estimation of canopy chlorophyll content in crops. Geophys. Res. Lett. 32 (8), L08403. doi:10.1029/2005gl022688
Gonzalez, L. A., Bishop-Hurley, G. J., Handcock, R. N., and Crossman, C. (2015). Behavioral classification of data from collars containing motion sensors in grazing cattle. Comput. Electron. Agric. 110, 91–102. doi:10.1016/j.compag.2014.10.018
Gunin, P. D., Dedkov, V. P., Danzhalova, E. V., Bazha, S. N., Zolotokrylin, A. N., and Kazantseva, T. I. (2019). NDVI for monitoring of the state of steppe and desert ecosystems of the gobi. Arid. Ecosyst. 9 (3), 179–186. doi:10.1134/S207909611903003X
Hamza, M. A., and Anderson, W. K. (2005). Soil compaction in cropping systems. Soil and Tillage Res. 82 (2), 121–145. doi:10.1016/j.still.2004.08.009
Han, C. J., Wang, G. G., and Yang, H. B. (2022). Study on the coupling system of grain-grass-livestock of herbivorous animal husbandry in agricultural areas: A case study of najitun farm of hulunbuir agricultural reclamation in China. LAND 11 (5), 691. doi:10.3390/land11050691
Han, F., Zhang, Q., Buyantuev, A., Niu, J. M., Liu, P. T., Li, X. H., et al. (2015). Effects of climate change on phenology and primary productivity in the desert steppe of Inner Mongolia. J. ARID LAND 7 (2), 251–263. doi:10.1007/s40333-014-0042-4
Hilker, T., Natsagdorj, E., Waring, R. H., Lyapustin, A., and Wang, Y. J. (2014). Satellite observed widespread decline in Mongolian grasslands largely due to overgrazing. Glob. CHANGE Biol. 20 (2), 418–428. doi:10.1111/gcb.12365
Huang, L., Ning, J., Zhu, P., Zheng, Y. H., and Zhai, J. (2021). The conservation patterns of grassland ecosystem in response to the forage-livestock balance in North China. J. Geogr. Sci. 31 (4), 518–534. doi:10.1007/s11442-021-1856-6
Jeddi, K., and Chaieb, M. (2010). Changes in soil properties and vegetation following livestock grazing exclusion in degraded arid environments of South Tunisia. FLORA 205 (3), 184–189. doi:10.1016/j.flora.2009.03.002
Ji, B., He, J. L., Wang, Z. J., and Jiang, Q. (2021). Characteristics and composition of vegetation carbon storage in natural grassland in Ning-xia, China. Chin. J. Appl. Ecol. 32 (4), 1259–1268. doi:10.13287/j.1001-9332.202104.005
Jiang, X. Q., Fang, S. H., Huang, X., Liu, Y. H., and Guo, L. L. (2021). Rice mapping and growth monitoring based on time series GF-6 images and red-edge bands. REMOTE Sens. 13 (4), 579. doi:10.3390/rs13040579
Jordan, C. F. (1969). Derivation of leaf-area index from quality of light on the forest floor. ECOLOGY 50 (4), 663–666. doi:10.2307/193625610.2307/1936256
Kang, Y. P., Hu, X. L., Meng, Q. Y., Zou, Y. F., Zhang, L. L., Liu, M., et al. (2021). Land cover and crop classification based on red edge indices features of GF-6 WFV time series data. REMOTE Sens. 13 (22), 4522. doi:10.3390/rs13224522
Kawamura, K., Akiyama, T., Yokota, H.-o., Tsutsumi, M., Yasuda, T., Watanabe, O., et al. (2005). Quantifying grazing intensities using geographic information systems and satellite remote sensing in the Xilingol steppe region, Inner Mongolia, China. Agric. Ecosyst. Environ. 107 (1), 83–93. doi:10.1016/j.agee.2004.09.008
Lei, F., Yu, Y., Zhang, D. J., Feng, L., Guo, J. S., Zhang, Y., et al. (2020). Water remote sensing eutrophication inversion algorithm based on multilayer convolutional neural network. J. INTELLIGENT FUZZY Syst. 39 (4), 5319–5327. doi:10.3233/JIFS-189017
Li, F., Miao, Y. X., Feng, G. H., Yuan, F., Yue, S. C., Gao, X. W., et al. (2014). Improving estimation of summer maize nitrogen status with red edge-based spectral vegetation indices. FIELD CROPS Res. 157, 111–123. doi:10.1016/j.fcr.2013.12.018
Li, J. Y., Yang, X. C., Jin, Y. X., Yang, Z., Huang, W. G., Zhao, L. N., et al. (2013). Monitoring and analysis of grassland desertification dynamics using Landsat images in Ningxia, China. REMOTE Sens. Environ. 138, 19–26. doi:10.1016/j.rse.2013.07.010
Li, J. Y., Zhao, L. N., Xu, B., Yang, X. C., Jin, Y. X., Gao, T., et al. (2014). Spatiotemporal variations in grassland desertification based on landsat images and spectral mixture analysis in Yanchi county of Ningxia, China. IEEE J. Sel. Top. Appl. EARTH OBSERVATIONS REMOTE Sens. 7 (11), 4393–4402. doi:10.1109/JSTARS.2014.2348612
Li, Q., Wang, J. L., Xie, H. Q., Ochir, A., and Davaasuren, D. (2022). Applicability of grassland production estimation using remote sensing for the Mongolian plateau by comparing typical regions in China and Mongolia. SUSTAINABILITY 14 (5), 3122. doi:10.3390/su14053122
Li, X. J., Chen, G., Liu, J. Y., Chen, W. T., Cheng, X. W., and Liao, Y. W. (2017). Effects of RapidEye imagery's red-edge band and vegetation indices on land cover classification in an arid region. Chin. Geogr. Sci. 27 (5), 827–835. doi:10.1007/s11769-017-0894-6
Liu, G. F., Xie, X. F., Ye, D., Ye, X. H., Tuvshintogtokh, I., Mandakh, B., et al. (2013). Plant functional diversity and species diversity in the Mongolian steppe. PLOS ONE 8 (10), e77565. doi:10.1371/journal.pone.0077565
Liu, J. P., Xue, H. R., Pan, X., Gao, J., and Jiang, X. H. (2021). Marine water quality detection based on neural network. DESALINATION WATER Treat. 219, 66–70. doi:10.5004/dwt.2021.26873
Liu, N., Zhang, Y. J., Chang, S. J., Kan, H. M., and Lin, L. J. (2012). Impact of grazing on soil carbon and microbial biomass in typical steppe and desert steppe of inner Mongolia. PLOS ONE 7 (5), e36434. doi:10.1371/journal.pone.0036434
Lu, B., and He, Y. H. (2019). Evaluating empirical regression, machine learning, and radiative transfer modelling for estimating vegetation chlorophyll content using Bi-seasonal hyperspectral images. REMOTE Sens. 11 (17), 1979. doi:10.3390/rs11171979
Luo, W. T., WuyunnaZhang, F. J., Huo, G. W., and Lu, J. Z. (2011). Root characteristics under different grazing intensities in Stipa krylovii steppe. Chin. J. Ecol. 30 (12), 2692–2699.
MacFarlane, D. W., Kuyah, S., Mulia, R., Dietz, J., Muthuri, C., and Van Noordwijk, M. (2014). Evaluating a non-destructive method for calibrating tree biomass equations derived from tree branching architecture. TREES-STRUCTURE Funct. 28 (3), 807–817. doi:10.1007/s00468-014-0993-2
Muro, J., Linstadter, A., Magdon, P., Wollauer, S., Manner, F. A., Schwarz, L. M., et al. (2022). Predicting plant biomass and species richness in temperate grasslands across regions, time, and land management with remote sensing and deep learning. REMOTE Sens. Environ. 282, 113262. doi:10.1016/j.rse.2022.113262
Pei, S. F., Fu, H., and Wan, C. G. (2008). Changes in soil properties and vegetation following exclosure and grazing in degraded Alxa desert steppe of Inner Mongolia, China. Agric. Ecosyst. Environ. 124 (1-2), 33–39. doi:10.1016/j.agee.2007.08.008
PeÑUelas, J., Filella, I., Biel, C., Serrano, L., and SavÉ, R. (1993). The reflectance at the 950–970 nm region as an indicator of plant water status. Int. J. Remote Sens. 14 (10), 1887–1905. doi:10.1080/0143116930895401010.1080/01431169308954010
Piao, S. L., Fang, J. Y., Zhou, L. M., Ciais, P., and Zhu, B. (2006). Variations in satellite-derived phenology in China's temperate vegetation. Glob. CHANGE Biol. 12 (4), 672–685. doi:10.1111/j.1365-2486.2006.01123.x
Reinermann, S., Asam, S., and Kuenzer, C. (2020). Remote sensing of grassland production and management-A Review. REMOTE Sens. 12 (12), 1949. doi:10.3390/rs12121949
Ren, Y. J., Lu, Y. H., and Fu, B. J. (2016). Quantifying the impacts of grassland restoration on biodiversity and ecosystem services in China: A meta-analysis. Ecol. Eng. 95, 542–550. doi:10.1016/j.ecoleng.2016.06.082
Reynolds, S. G., and Frame, J. (2005). “Grasslands: Developments opportunties perspectives,” in Grasslands: Developments opportunties perspectives. Editors S. G. Reynolds, and J. Frame (Enfield, Nh 03748 USA: Science Publishers Inc, May St, Po Box 699).
Ross, L. C., Austrheim, G., Asheim, L. J., Bjarnason, G., Feilberg, J., Fosaa, A. M., et al. (2016). Sheep grazing in the north atlantic region: A long-term perspective on environmental sustainability. AMBIO 45 (5), 551–566. doi:10.1007/s13280-016-0771-z
Ruan, Y. J., Zhang, X. C., Xin, Q. C., Sun, Y., Ao, Z. R., and Jiang, X. (2021). A method for quality management of vegetation phenophases derived from satellite remote sensing data. Int. J. REMOTE Sens. 42 (15), 5811–5830. doi:10.1080/01431161.2021.1931534
Safronova, I. N. (2018). “The Desert steppes of eastern Europe: Common regularities and specific features,” in Fourth international scientific conference ecology and geography of plants and plant communities. Editors A. S. Tretyakova, and D. V. Veselkin (U Arab Emirates). In KnE Life Sciences, 182-189. Knowledge E, Office 4402, X2 Tower, Jlt, Po Box 488239, Dubai, 00000.
Sahoo, R. N., Ray, S. S., and Manjunath, K. R. (2015). Hyperspectral remote sensing of agriculture. Curr. Sci. 108 (5), 848–859.
Schlesinger, W. H., and Jasechko, S. (2014). Transpiration in the global water cycle. Agric. For. METEOROLOGY 189, 115–117. doi:10.1016/j.agrformet.2014.01.011
Song, C. H., Dannenberg, M. P., and Hwang, T. (2013). Optical remote sensing of terrestrial ecosystem primary productivity. Prog. Phys. Geogr. Environ. 37 (6), 834–854. doi:10.1177/0309133313507944
Su, Y.-Z., Li, Y.-l., Cui, J.-Y., and Zhao, W.-Z. (2005). Influences of continuous grazing and livestock exclusion on soil properties in a degraded sandy grassland, Inner Mongolia, northern China. Catena 59 (3), 267–278. doi:10.1016/j.catena.2004.09.001
Tucker, C. J. (1979). "Red and photographic infrared linear combinations for monitoring vegetation. Remote Sens. Environ. 8 (2), 127–150. doi:10.1016/0034-4257(79)90013-0
Wan, H. M., Li, X., and Dung, D. R. (2012). Estimation of desert vegetation coverage based on multi-source remote sensing data. Chin. J. Appl. Ecol. 23 (12), 3331–3337.
Wang, G. X., Jing, C. Q., Dong, P., Qin, B. Y., and Cheng, Y. (2022). Spatiotemporal dynamics of aboveground biomass and its influencing factors in xinjiang's desert grasslands. SUSTAINABILITY 14 (22), 14884. doi:10.3390/su142214884
Wang, J., Xiao, X. M., Bajgain, R., Starks, P., Steiner, J., Doughty, R. B., et al. (2019). Estimating leaf area index and aboveground biomass of grazing pastures using Sentinel-1, Sentinel-2 and Landsat images. ISPRS J. PHOTOGRAMMETRY REMOTE Sens. 154, 189–201. doi:10.1016/j.isprsjprs.2019.06.007
Wang, L., Yang, R. R., Tian, Q. J., Yang, Y. J., Zhou, Y., Sun, Y., et al. (2015). Comparative analysis of GF-1 WFV, ZY-3 MUX, and HJ-1 CCD sensor data for grassland monitoring applications. REMOTE Sens. 7 (2), 2089–2108. doi:10.3390/rs70202089
Wei, X., Zhou, L. H., Yang, G. J., Wang, Y., and Chen, Y. (2020). Assessing the effects of desertification control projects from the farmers' perspective: A case study of Yanchi county, northern China. Int. J. Environ. Res. PUBLIC HEALTH 17 (3), 983. doi:10.3390/ijerph17030983
Weiss, J. L., Gutzler, D. S., Coonrod, J. E. A., and Dahm, C. N. (2004). Long-term vegetation monitoring with NDVI in a diverse semi-arid setting, central New Mexico, USA. J. Arid Environ. 58 (2), 249–272. doi:10.1016/j.jaridenv.2003.07.001
Wen, H. Y., Niu, D. C., Fu, H., and Kang, J. (2013). Experimental investigation on soil carbon, nitrogen, and their components under grazing and livestock exclusion in steppe and desert steppe grasslands, Northwestern China. Environ. EARTH Sci. 70 (7), 3131–3141. doi:10.1007/s12665-013-2376-1
Xia, T., He, Z., Cai, Z. W., Wang, C., Wang, W. J., Wang, J. Y., et al. (2022). Exploring the potential of Chinese GF-6 images for crop mapping in regions with complex agricultural landscapes. Int. J. Appl. EARTH OBSERVATION GEOINFORMATION 107, 102702. doi:10.1016/j.jag.2022.102702
Xie, Q. Y., Dash, J., Huang, W. J., Peng, D. L., Qin, Q. M., Mortimer, H., et al. (2018). Vegetation indices combining the red and red-edge spectral information for leaf area index retrieval. IEEE J. Sel. Top. Appl. EARTH OBSERVATIONS REMOTE Sens. 11 (5), 1482–1493. doi:10.1109/JSTARS.2018.2813281
Yan, L., Zhou, G. S., and Zhang, F. (2013). Effects of different grazing intensities on grassland production in China: A meta-analysis. PLOS ONE 8 (12), e81466. doi:10.1371/journal.pone.0081466
Yu, H., Liu, B. T., Wang, G. X., Zhang, T. Z., Yang, Y., Lu, Y. Q., et al. (2021). Grass-livestock balance based grassland ecological carrying capability and sustainable strategy in the Yellow River Source National Park, Tibet Plateau, China. J. Mt. Sci. 18 (8), 2201–2211. doi:10.1007/s11629-020-6087-2
Zarekia, S., Arzani, H., Jafari, M., Javadi, S. A., Jafari, A. A., and Esfahan, E. Z. (2013). Changes of vegetation structure and biomass in response to the livestock grazing in steppe rangelands of Iran. J. ANIMAL PLANT Sci. 23 (5), 1466–1472.
Zhan, T. Y., Zhang, Z. C., Sun, J., Liu, M., Zhang, X. B., Peng, F., et al. (2020). Meta-analysis demonstrating that moderate grazing can improve the soil quality across China's grassland ecosystems. Appl. SOIL Ecol. 147, 103438. doi:10.1016/j.apsoil.2019.103438
Zhang, H. Y., Fan, J. W., Wang, J. B., Cao, W., and Harris, W. (2018). Spatial and temporal variability of grassland yield and its response to climate change and anthropogenic activities on the Tibetan Plateau from 1988 to 2013. Ecol. Indic. 95, 141–151. doi:10.1016/j.ecolind.2018.05.088
Zhang, Y. L., Qi, W., Zhou, C. P., Ding, M. J., Liu, L. S., Gao, J. G., et al. (2014). Spatial and temporal variability in the net primary production of alpine grassland on the Tibetan Plateau since 1982. J. Geogr. Sci. 24 (2), 269–287. doi:10.1007/s11442-014-1087-1
Zhao, H., Zhao, Y., Gao, G. Y., and Ho, P. (2018). China's desertification deconstructed: Towards a scientists' model based on long-term perceptions of grassland restoration (1995-2011). Restor. Ecol. 26, S26–S36. doi:10.1111/rec.12555
Zhao, Z., Bai, Y. P., Deng, X. Z., Chen, J. C., Hou, J., and Li, Z. H. (2020). Changes in livestock grazing efficiency incorporating grassland productivity: The case of hulun buir, China. LAND 9 (11), 447. doi:10.3390/land9110447
Zhong, J. T., Wang, B., Mi, W. B., Fan, X. G., Yang, M. L., and Yang, M. X. (2020). Spatial recognition of ecological compensation standard for grazing grassland in Yanchi county based on InVEST model. Sci. Geogr. Sin. 40 (6), 1019–1028. doi:10.13249/j.cnki.sgs.2020.06.018
Keywords: desert steppe, above-ground biomass estimation, Gaofen-6, grassland productivity, grazing carrying capacity
Citation: Zhang Y, Wang L, Yang X, Sun Y and Song N (2023) Sustainable application of GF-6 WFV satellite data in desert steppe: A village-scale grazing study in China. Front. Environ. Sci. 11:1093664. doi: 10.3389/fenvs.2023.1093664
Received: 09 November 2022; Accepted: 10 January 2023;
Published: 02 February 2023.
Edited by:
Stephen M. Mureithi, University of Nairobi, KenyaReviewed by:
Anlu Zhang, Huazhong Agricultural University, ChinaLin Zhang, Institute of Tibetan Plateau Research (CAS), China
Copyright © 2023 Zhang, Wang, Yang, Sun and Song. This is an open-access article distributed under the terms of the Creative Commons Attribution License (CC BY). The use, distribution or reproduction in other forums is permitted, provided the original author(s) and the copyright owner(s) are credited and that the original publication in this journal is cited, in accordance with accepted academic practice. No use, distribution or reproduction is permitted which does not comply with these terms.
*Correspondence: Lei Wang, V0w4OTk5QDE2My5jb20=