 Mohammed Kajee1,2,3*
 Dominic A. W. Henry4,5
 Helen F. Dallas2,6Charles L. Griffiths1
 Josephine Pegg3,7Dewidine Van der Colff8Dean Impson2Albert Chakona9Domitilla C. Raimondo8
 Nancy M. Job8
 Bruce R. Paxton2
 Martine S. Jordaan9,10,11Roger Bills9Francois Roux12
 Tsungai A. Zengeya8,13Andre Hoffman12
 Nick Rivers-Moore2
 Jeremy M. Shelton2
- 1Department of Biological Sciences, University of Cape Town, Cape Town, South Africa
- 2Freshwater Research Centre, Cape Town, South Africa
- 3DSI/NRF Research Chair in Inland Fisheries and Freshwater Ecology, South African Institute for Aquatic Biodiversity (SAIAB), Makhanda, South Africa
- 4Endangered Wildlife Trust, Johannesburg, South Africa
- 5Centre for Statistics in Ecology, Environment and Conservation, University of Cape Town, Cape Town, South Africa
- 6Faculty of Science, Formerly Port Elizabeth, Nelson Mandela University, Gqeberha, South Africa
- 7Department of Ichthyology and Fisheries Science, Rhodes University, Makhanda, South Africa
- 8Kirstenbosch Research Centre, South African National Biodiversity Institute, Cape Town, South Africa
- 9NRF-South African Institute for Aquatic Biodiversity (NRF-SAIAB), Makhanda, South Africa
- 10CapeNature Biodiversity Capabilities Unit, Stellenbosch, South Africa
- 11Center of Excellence for Invasion Biology, CapeNature Biodiversity Capabilities Unit, Stellenbosch, South Africa
- 12Scientific Services, Mpumalanga Tourism and Parks Agency, Mbombela, South Africa
- 13Centre for Invasion Biology, Department of Zoology and Entomology, University of Pretoria, Pretoria, South Africa
In South Africa, anthropogenic pressures such as water over-abstraction, invasive species impacts, land-use change, pollution, and climate change have caused widespread deterioration of the health of river ecosystems. This comes at great cost to both people and biodiversity, with freshwater fishes ranked as the country’s most threatened species group. Effective conservation and management of South Africa’s freshwater ecosystems requires access to reliable and comprehensive biodiversity data. Despite the existence of a wealth of freshwater biodiversity data, access to these data has been limited. The Freshwater Biodiversity Information System (FBIS) was built to address this knowledge gap by developing an intuitive, accessible and reliable platform for freshwater biodiversity data in South Africa. The FBIS hosts high quality, high accuracy biodiversity data that are freely available to a wide range of stakeholders, including researchers, conservation practitioners and policymakers. We describe how the system is being used to provide freshwater fish data to a national conservation decision-support tool—The Department of Forestry, Fisheries, and the Environment (DFFE) National Environmental Screening Tool (NEST). The NEST uses empirical and modelled biodiversity data to guide Environmental Impact Assessment Practitioners in conducting environmental assessments of proposed developments. Occurrence records for 34 threatened freshwater fishes occurring in South Africa were extracted from the FBIS and verified by taxon specialists, resulting in 6 660 records being used to generate modelled and empirical national distribution (or sensitivity) layers. This represents the first inclusion of freshwater biodiversity data in the NEST, and future iterations of the tool will incorporate additional freshwater taxa. This case study demonstrates how the FBIS fills a pivotal role in the data-to-decision pipeline through supporting data-driven conservation and management decisions at a national level.
Introduction
Freshwater ecosystems are among the most biodiverse habitats on earth, covering less than 1% of the planet’s total surface area, but accounting for nearly 25% of all vertebrates and more than 50% of all fishes (Hughes et al., 2021; Fricke et al., 2022). However, despite providing essential ecosystem services, protection of freshwater habitats and their associated biodiversity remain a low priority for policymakers when developing protected areas and legislation (Hughes et al., 2021). Recent global studies (Abell et al., 2007; Adams et al., 2015; Hughes et al., 2021; Williams-Subiza and Epele, 2021) have highlighted significant gaps in protected area networks for freshwater systems, and freshwater biodiversity is declining twice as fast as in marine and terrestrial ecosystems (Grooten and Almond, 2018), with nearly a third of freshwater fishes now threatened with extinction (WWF, 2020; IUCN Red List, 2020; Hughes et al., 2021).
In South Africa, freshwater fishes are recognised as the country’s most threatened species group (Skowno et al., 2019). Of the 106 formally described native fish species, 27 are threatened with extinction (classified as Vulnerable, Endangered or Critically Endangered according to the IUCN), with at least eight reported to be in decline over the last decade (Chakona et al., 2022). Ongoing taxonomic revisions indicate that several endemic taxa are genetically distinct and have narrower distribution ranges than previously thought (Chakona et al., 2022). As such, some threatened endemic ‘species suites’ are likely to be split taxonomically, resulting in individual species being more vulnerable to extinction and raising the total number of threatened taxa in the country (Chakona et al., 2022). The key anthropogenic pressures impacting freshwater fishes in South Africa are land-use change (O’Brien et al., 2019; Chakona et al., 2020a), pollution (Wepener et al., 2011; Horak et al., 2021), excessive abstraction of water (Dallas and Rivers-Moore, 2014; Cerrilla et al., 2022; Evans et al., 2022), spread of invasive species (Ellender and Weyl, 2014; Weyl et al., 2020; Zengeya et al., 2020; Cerrilla et al., 2022) and climate change (Dallas and Rivers-Moore, 2014; Ziervogel et al., 2014). Consequently, there is an urgent need to develop current, data-driven conservation plans and policies to guide effective management and protection of freshwater habitats in South Africa, to safeguard their unique biodiversity and to sustain their essential ecosystem services.
South Africa’s protected area network (Republic of South Africa, 2004a; Republic of South Africa, 2004b; Chakona et al., 2022), covers less than 10% of South Africa’s total land area (Skelton et al., 1995; Russell, 2011; Skowno et al., 2019). Whilst protected areas generally provide some level of protection for freshwater fishes, few protect entire catchments (Skelton et al., 1995; Acreman et al., 2019; Jordaan et al., 2020), which is problematic given the linear nature of river ecosystems (Jordaan et al., 2020). Of the country’s rivers, only 18% are regarded as Well Protected and 12% as Moderately Protected, with the remainder of the being classified as Not or Poorly Protected (Department of Environmental Affairs, 2016). Even rivers considered as Well or Moderately Protected are often not in a pristine or healthy condition. For example, Kleynhans (2000) and Nel et al. (2009) found that almost half of the river systems falling within protected areas in South Africa are already degraded upstream as a result of human activities (Kleynhans, 2000; Nel et al., 2009). Russell (2011) found that of the 19 national parks managed by South African National Parks, only 13 included habitat for freshwater fishes, with protection often being an unintended by-product of the targeted protection of threatened terrestrial plants and mammals. Moreover, protection of freshwater fishes within protected areas is compromised by human-linked impacts such as climate change, invasive species and habitat degradation impacts further upstream (Impson et al., 2002; Abell et al., 2007), with 84% freshwater fish regarded as under-protected (Jordaan et al., 2020). As such, South Africa’s current network of protected area network does not adequately protect freshwater fishes (Nel et al., 2004; Abell et al., 2007; Jordaan et al., 2020).
Having recognised the limitations of the current protected areas network, expansion of these areas in South Africa is supported through the country’s commitment to the Convention on Biological Diversity (CBD) in The National Protected Area Expansion Strategy (NPAES, 2016; Republic of South Africa, 2010; Department of Environmental Affairs, 2016). In conjunction with the NPAES, the Government of South Africa also published amendments (24 (5) (a) and 24 (5) (h)) to the National Environmental Management Act, 1998 (Act 107 of 1998; Republic of South Africa, 1998), stipulating that future developments will need to be guided by an objective Environmental Impact Assessments (EIA) process that takes into consideration presence or absence of threatened taxa (South African National Biodiversity Institute (SANBI), 2021). As such, the Department of Forestry, Fisheries, and the Environment (DFFE) developed a National Environmental Screening Tool (screening.environment.gov.za; SANBI, 2021)—hereafter, the ‘NEST’. The NEST is a national web-enabled application that allows applicants seeking environmental authorisation for development to screen their proposed development site for any environmental sensitivities, for example, the presence of threatened species (DFFE, 2021). The NEST uses empirical and modelled biodiversity data (packaged as ‘sensitivity layers”) to guide EIAs of proposed developments—a process that has in the past been criticized for not being sufficiently transparent or robust (i.e., data-driven). A brief description of the NEST and an explanation of the species distribution layers are outlined below.
The NEST consists of theme-specific spatial datasets, which have been assigned various sensitivity levels (SANBI, 2021), allowing for pre-screening of the proposed development footprint. The NEST assesses the likelihood that a proposed development will have a negative impact on either the environment or any threatened species that may occur in the same area. One of the main components of the NEST is the Plant and Animal Sensitivity Layers, which uses a four-tiered sensitivity rating system to identify and classify habitat where threatened species occur (SANBI, 2021). These layers are briefly described below (SANBI, 2021).
• Very high layer–Habitat for highly range-restricted threatened taxa that has an extent of occurrences of less than or equal to 10 km2. For each taxon, critical habitat is manually mapped at a fine scale by taxon experts. Combined data for all taxa are combined into a single spatial layer: Very high sensitivity layer.
• High layer–The current distribution of threatened taxa are included in the high sensitivity level by developing spatial polygons around known recent occurrence records (defined by the NEST as records collected since the year 2002 with reasonably high spatial accuracy). Combined data for all taxa are combined into a single spatial layer: High sensitivity layer.
• Medium layer–Species distribution models (SDMs), which use species occurrence records combined with multiple environmental variables to quantify and predict areas of suitable habitat, were used to model suitable habitat areas where threatened species are expected to occur. Combined data for all taxa are combined into a single spatial layer: Medium sensitivity layer.
• Low sensitivity layer–Areas where no threatened taxa are currently known or expected to occur.
Whilst the NEST and associated Species Assessment Guidelines (SANBI, 2021) do currently include aquatic habitat sensitivity layers, they do not currently include any freshwater species-specific layers (SANBI, 2021). Developing sensitivity layers for freshwater taxa requires access to reliable and comprehensive freshwater biodiversity data. However, despite a wealth of current and historic biodiversity data existing for South Africa’s freshwater ecosystems, access to these data has been limited by the lack of a dedicated and resourced freshwater information system (Dallas et al., 2022).
Several databases have been developed in South Africa in the past for collating and preserving freshwater biodiversity data at both national and provincial levels (Dallas et al., 2022). However, these databases are generally difficult to access, use different data formats and standards, and are not always maintained due to limited resources and funds (Dallas et al., 2022)—a problem also experienced in both terrestrial and marine ecosystems. Some South African organisations (such as the South African Institute for Aquatic Biodiversity and the Albany Museum) publish their freshwater biodiversity data to the Global Biodiversity Information Facility (GBIF), but the data currently available on GBIF under-represent what is actually available for South African freshwater fish, and require substantial time and effort to clean, format and analyse. Whilst these platforms all contribute valuable data, none of them adequately meet the needs for national freshwater conservation and decision-making in a South Africa (Dallas et al., 2022). However, such information is critical for informing national and international biodiversity assessments, measuring the impact of anthropogenic activities (such as climate change), and enhancing our ability to make informed policy, management, and conservation decisions at both provincial and national levels (Dallas et al., 2022). As such, access to comprehensive and reliable freshwater biodiversity data is imperative and will help to safeguard critical freshwater biodiversity from anthropogenic threats, and will allow freshwater resources in South Africa to be sustainably used and managed.
The Freshwater Biodiversity Information System (FBIS; freshwaterbiodiversity. org), an open-access, online platform for freshwater biodiversity data in South Africa launched in 2017, was developed by the Freshwater Research Centre (FRC) in partnership with SANBI and Kartoza to bridge this data gap by improving access to comprehensive and reliable freshwater biodiversity data. The FBIS is a powerful, open-access system for hosting, standardising, analysing and serving freshwater biodiversity data for South Africa. As such, the FBIS functions as a repository for South African freshwater data, and has been populated with data from key available sources including data mobilised through manual literature searches, and data pulled in via links with existing online platforms such as GBIF (Dallas et al., 2022). The FBIS represents the first comprehensive, accessible, national-level resource for freshwater biodiversity data records in South Africa, and thus provides an opportunity for national-level freshwater biodiversity data to be utilised by researchers, policymakers, and conservation practitioners in real time (Dallas et al., 2022).
Here we describe how the FBIS was recently used to provide freshwater fish data for informing a national-level conservation decision-support tool (the NEST), and we evaluate the role of the FBIS in the data-to-decision pipeline. Specifically, we examine how data extracted from the FBIS were used to develop national freshwater fish sensitivity layers—core components of the NEST—thereby allowing for the first inclusion of freshwater species spatial coverage in the tool, and the potential for improved freshwater biodiversity conservation at a national scale. This case-study demonstrates the importance of collecting and collating comprehensive, high quality biodiversity data sets, and being able to synthesize these data and make them accessible for analysis and uptake and use in conservation planning and decision making at a national scale. We also highlight the importance of expert consultation and multi-disciplinary stakeholder engagement during various stages of this process.
Methods
Data source
The development of the NEST sensitivity layers for freshwater fish was a collaborative effort that included contributions from several organisations: FRC, SANBI, NRF-South African Institute for Aquatic Biodiversity (NRF-SAIAB), CapeNature, Endangered Wildlife Trust (EWT), DFFE, Mpumalanga Tourism and Parks Agency (MTPA), Free State Department: Economic, Small Business Development, Tourism and Environmental Affairs, and University of Cape Town (UCT), as well as multiple other individuals and organisations via SANBI’s National Freshwater Fish Observation Group (see Supplementary S3 and S4). Occurrence records for 34 threatened (Vulnerable, Endangered and Critically Endangered classified as per the IUCN) freshwater fishes occurring in South Africa (Table 1) were downloaded on 14 September 2022 from the FBIS online database (FBIS, 2022). These 34 fish taxa included 27 formally described species and seven lineages, yet to be formally described (Chakona et al., 2022). Formally described species have been assessed both globally (on the IUCN Red List) and nationally (Red List of South African Species; SANBI, 2022), whereas undescribed lineages have only been assessed nationally (SANBI, 2022). Only primary, secondary, and catadromous threatened freshwater fishes were included, while marine peripheral/sporadic and primary marine fishes were excluded.
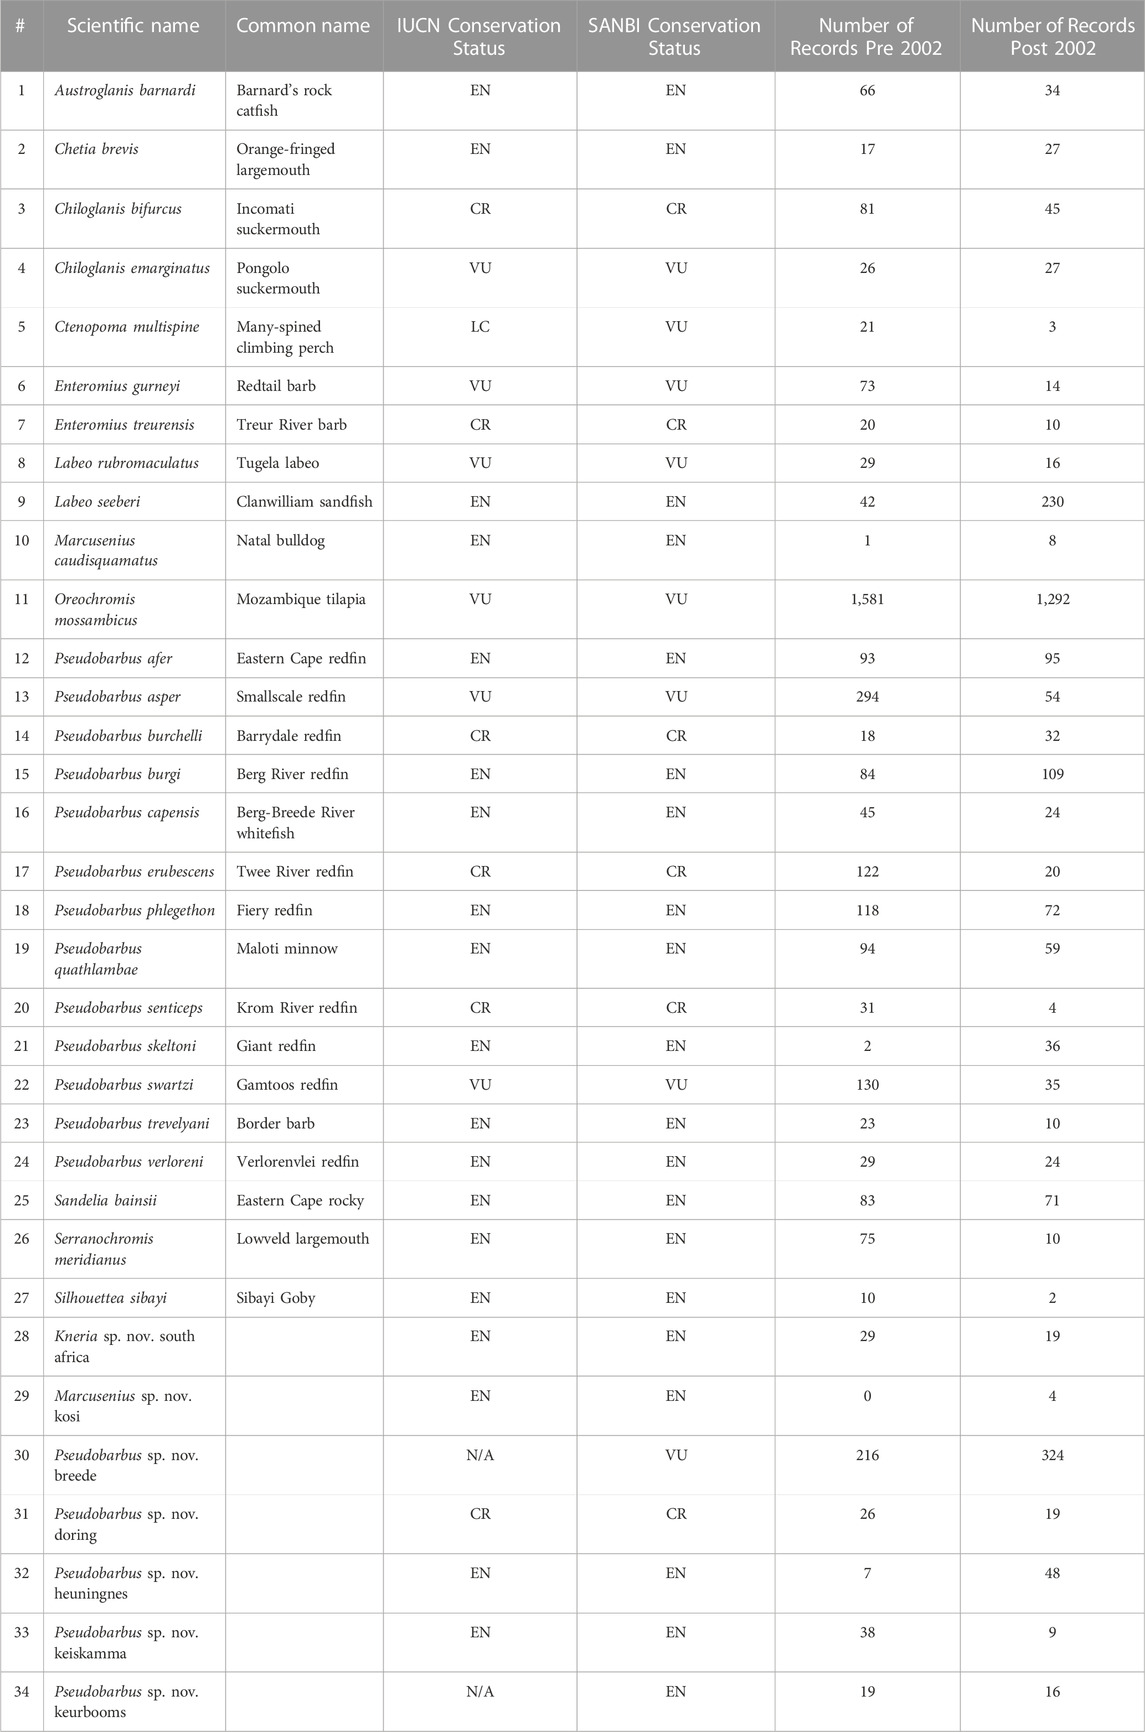
TABLE 1. List of threatened (Vulnerable, Endangered and Critically Endangered) South African freshwater fish taxa included in the NEST analysis. Conservation status and the number of occurrence records sourced from the Freshwater Biodiversity Information System (FBIS) pre and post 2002 are shown. Taxa #1–27 are formally-describes species, while taxa #28–34 represent recognised genetically-distinct lineages. Threat categories are: VU = Vulnerable; EN = Endangered; CR = Critically Endangered.
Data cleaning and validation
A series of online workshops were held with freshwater fish taxon specialists from across South Africa during 2021 to verify the quality and comprehensiveness of the data downloaded from the FBIS (see Supplementary Table S1). Relevant experts were identified for each threatened fish taxon, based on prior involvement in species Red-Listing assessments, and consulted. Occurrence records for each fish taxon from the FBIS were thoroughly scrutinized, erroneous records were removed, and missing data sets identified and added. Resultant occurrence data sets were used to generate updated distribution maps for each taxon, and these were sent to all specialists for approval prior to further analysis.
Data analysis
All data cleaning, processing and analyses were conducted using R Software (R Core Team, 2020; Version 3.5.0). Data visualizations and final maps were produced using R Software (R Core Team, 2020; Version 3.5.0) and ArcGIS Pro (Esri Inc, 2022). Cleaned and validated occurrence records were used to produce different sensitivity layers, for inclusion into the NEST. The protocols for developing the different sensitivity layers followed those described by DFFE (2021). A brief description of how each sensitivity layer was developed is outlined below. Final data and spatial layers were presented to taxon specialists for review before being combined and submitted for inclusion in the NEST.
Very high sensitivity layers
The ‘very high’ sensitivity category only applied to freshwater fishes that were assessed as Critically Endangered. Given that freshwater fish occur in linear river systems, the criteria used to develop the Very high sensitivity layer were adapted as follows: All historic (pre-2002) and current (post-2002) occurrence records of freshwater fish taxa that are categorised as Critically Endangered. As such, all known, valid, historic occurrence records were used to build the very high sensitivity layer. Occurrences were intersected with the FEPA Sub-Quaternary Catchment layer (Nel, 2011; SANBI, 2011) to create catchment-specific occurrence polygons, indicating the presence of a Critically Endangered freshwater fish in that catchment.
High sensitivity layers
The high sensitivity category only applied to freshwater fishes that were assessed as Vulnerable or Endangered. The ‘high’ sensitivity layer is comprised of all valid, post-2002 occurrence records (SANBI, 2021). Occurrence records for each freshwater fish (i.e., the assumed, current distribution of the species) were plotted in R (R Core Team, 2020; Version 3.5.0). Occurrence data were then intersected with the River Freshwater Ecosystem Priority Areas (FEPA) Sub-Quaternary Catchment layer (Nel, 2011; SANBI, 2011) to create catchment-specific occurrence polygons, indicating the recent presence of a Vulnerable or Endangered freshwater fish in that catchment.
Medium sensitivity layers
Taxa that qualify for inclusion in the ‘medium’ sensitivity layer were categorised as either Vulnerable or Endangered. For these taxa, species distribution models (SDMs) were used to generate predictive geographic ranges. All valid occurrence records for each freshwater fish were used to independently develop a unique, accurate SDM for each taxon using a Bayesian additive regression trees (BART) algorithm via functions from the embarcadero R package (Carlson, 2020). A comprehensive suite of environmental and hydrological variables was used to generate these SDMs (see Supplementary Table S2). Modelled distributions were converted to a binary output (presence/absence) for each species using a threshold that maximizes the true skill statistic from the species SDM.
Results
Initially, 6 068 records were downloaded from the FBIS (Figure 1; FBIS, 2022). Data cleaning, guided by expert consultation, resulted in the deletion of 354 erroneous records (Figure 1). An additional 946 records provided by the experts originating from private, unpublished datasets owned by relevant experts (Figure 1) were uploaded to the FBIS. The final cleaned dataset was also tagged in FBIS as “DFFE Screening Tool 2022”, which will ensure that expert input and feedback will not be lost and will help streamline this process in the future.
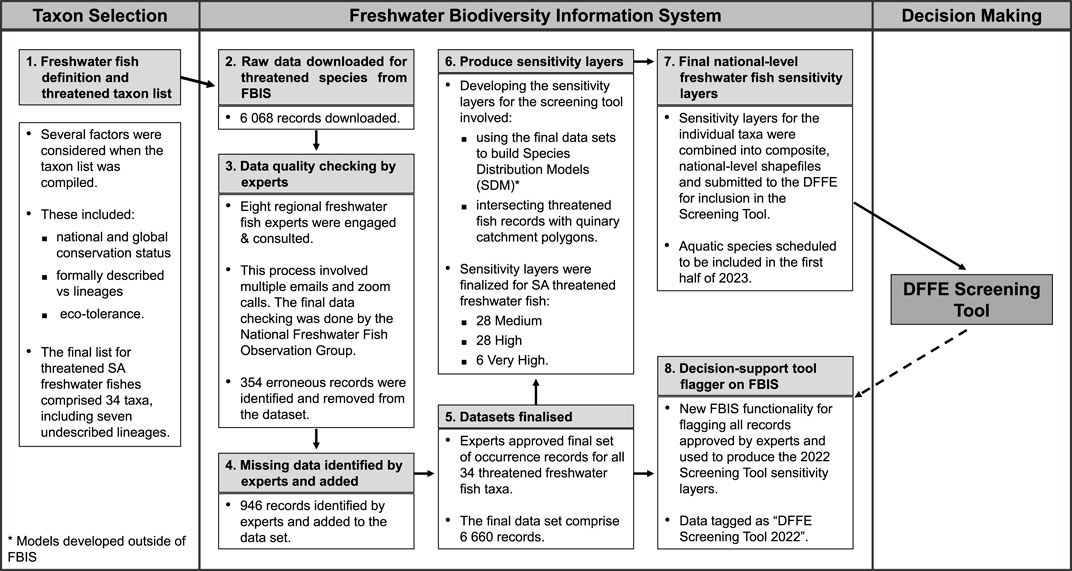
FIGURE 1. Schematic illustrating the data flow from the Freshwater Biodiversity Information System (FBIS) into the Department of Forestry, Fisheries and Environment (DFFE) Screening Tool and for developing the necessary functionality to improve the ease of future such projects.
In total, 6 660 occurrence records for the 34 threatened (Vulnerable = 8; Endangered = 20; Critically Endangered = 6) freshwater fishes were used to develop the NEST layers (Table 1; Figure 1). Of the 34 threatened freshwater fishes included in the NEST, 14 had fewer than 50 records in South Africa (Table 1). Three threatened taxa, Marcusenius caudisquamatus (n = 9), Marcusenius sp. nov. kosi (n = 4) and Silhouettea sibayi (n = 12) were found to have less than 20 records. Only two taxa, Oreochromis mossambicus (n = 2 873) and Pseudobarbus sp. nov. breede (n = 540), had more than 500 records (Table 1).
Modelled taxon distribution maps (contributing to the medium sensitivity layer) and current taxon distribution maps (high sensitivity layer) were produced for all taxa classified as Vulnerable and Endangered, except for S. sibayi, which had no records post-2002. For Critically Endangered taxa, occurrence data were used to develop a single distribution map for each of the seven taxa (making up the very high sensitivity layer). Example outputs are presented for two fish species, namely, Labeo seeberi (Endangered; Figure 2) and Pseudobarbus erubescens (Critically Endangered; Figure 2), illustrating finalised occurrence data (Figures 2A, E), SDMs derived from these data (Figures 2B, F), and how these were used to develop the medium (Figure 2C), high (Figure 2D) and very high (Figure 2G) sensitivity layers for the DFFE Screening Tool.
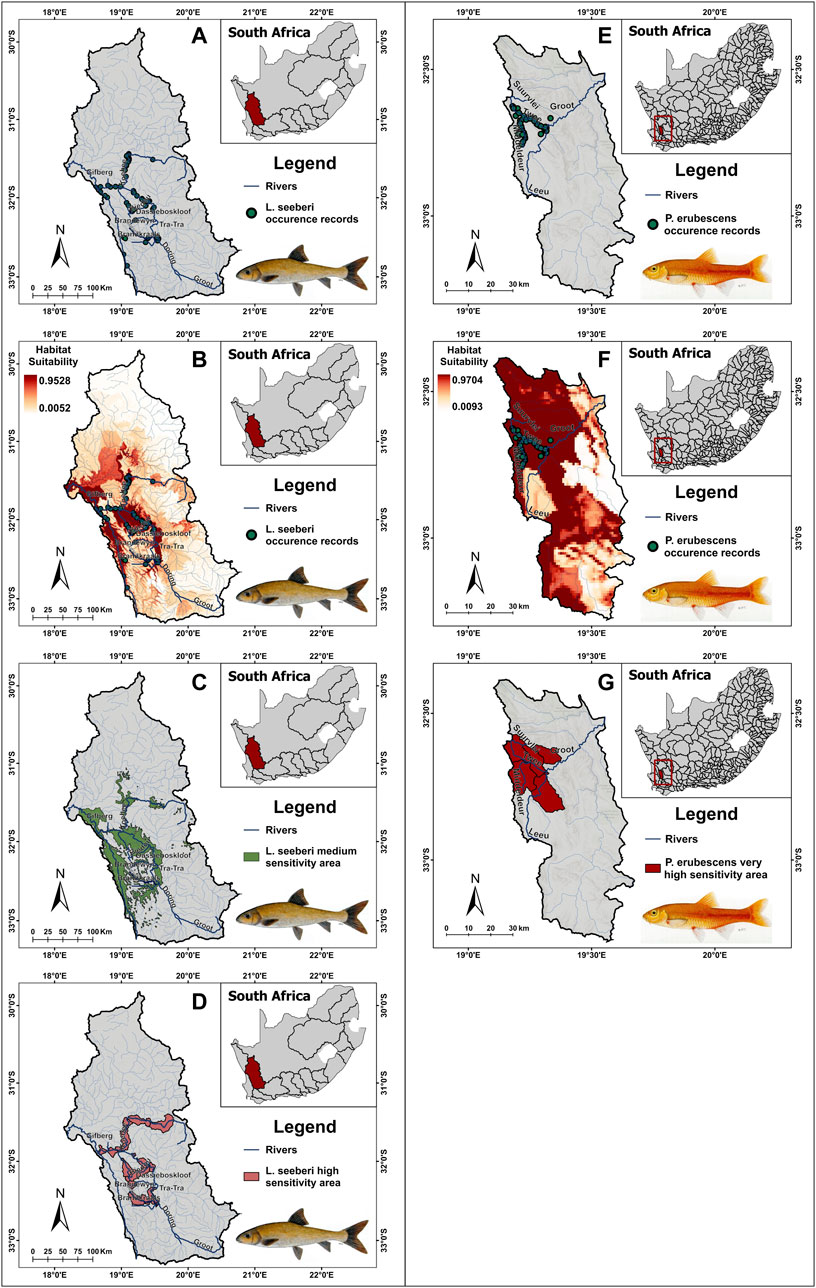
FIGURE 2. Labeo seeberi occurrence records (A), species distribution model (B), medium sensitivity area (C) and high sensitivity area (D) located in the Olifants-Doring primary catchment area of South Africa. Pseudobarbus erubescens occurrence records (E), species distribution model (F), and very high sensitivity area (G) located in tertiary catchment E21.
The final composite (combined across all taxa) national sensitivity layers (medium, high, and very high) for all threatened freshwater fishes are presented in Figure 3. The medium sensitivity layer for freshwater fish spans 49 385 km of river and covers a total catchment area of 251 264 km2, whilst the high sensitivity layer spans 15 162 km of river and covers a catchment area of 117 412 km2, with the very high sensitivity layer providing much-needed protection for Critically Endangered freshwater taxa spanning 1,024 km of river and covering a total catchment area of 5 992 km2.
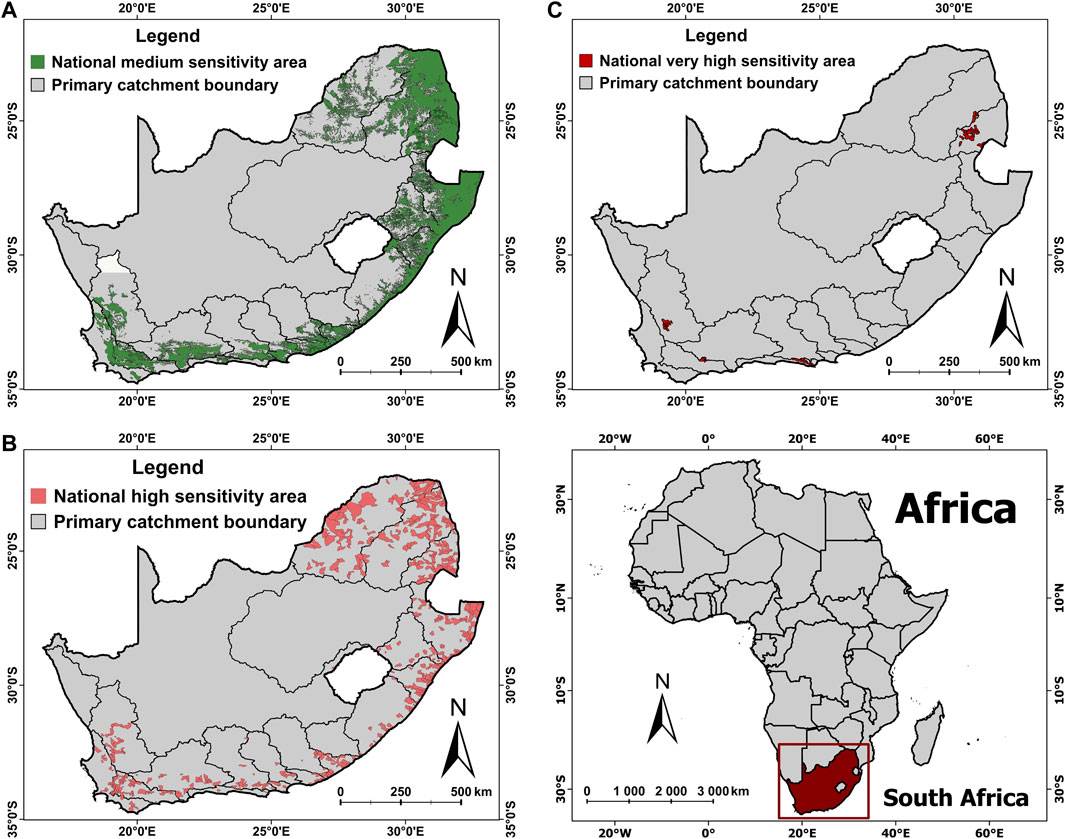
FIGURE 3. Sensitivity layers for freshwater fishes included in the Department of Forestry, Fisheries and Environment (DFFE) Screening Tool showing medium sensitivity area coverage (A), high sensitivity area coverage (B), and very high sensitivity area coverage (C) across South Africa.
Discussion
We present the first inclusion of freshwater species coverage in a key national conservation decision-support tool—the DFFE EIA NEST—and describe how data from the FBIS were used as the basis for threatened fish sensitivity layers (core elements of the tool) through a multi-stakeholder, collaborative approach (see Supplementary S3 and S4). Sensitivity layers were successfully developed for 34 threatened freshwater fishes occurring in South Africa and combined to produce national-level sensitivity layers for inclusion into the tool. Given that the majority of South Africa’s rivers are either poorly protected or not protected (Department of Environmental Affairs, 2016), the updated coverage of freshwater fishes in the NEST should provide much-needed protection for the country’s threatened freshwater fishes by preventing or minimising further destruction of critical freshwater habitats due to new developments.
Importantly, all new applications for development under the EIA regulations will be compelled to make use of the tool before authorisations are granted. This will identify and protect sensitive catchment areas that in the past would have been overlooked due to a lack of access to freshwater biodiversity data. This will no doubt support future conservation efforts, especially in locations where threatened taxa occur outside of formal, protected areas (Impson et al., 2002; Nel et al., 2004; Abell et al., 2007; Russell, 2011; Jordaan et al., 2020). In addition to the conservation and policy benefits, the distribution maps produced for the medium, high and very high sensitivity layers can also help guide expansion of protected areas and stewardship initiatives and can be used in future national biodiversity assessments and IUCN Red List assessments.
The FBIS supported the development of freshwater fish sensitivity layers through providing quick and easy access to reliable and comprehensive freshwater fish occurrence records for South Africa. The relatively large number of records provided by the FBIS is especially noteworthy given that most distribution modelling and mapping of threatened taxa are heavily hampered by limited access to occurrence records (Stockwell and Peterson, 2002; Wisz et al., 2008). A substantial percentage of these data originating from published literature and private data repositories would not have been available had it not been for a platform like the FBIS. Whilst databases like GBIF and FishBase do provide opportunities for the scientific community to share and access freshwater fish data, there are not any concerted efforts to drive the data collation process (especially within freshwater systems in South Africa). In this regard, the FBIS has a proven advantage over global biodiversity databases, through leveraging personal relationships and thorough ongoing stakeholder engagement to ensure that both the quantity and quality of records uploaded to the FBIS are maximised. Furthermore, the inclusion of various taxon specialists, government organisations and conservation authorities (see Supplementary S1) via multiple online workshops ensured that the final occurrence dataset was cleaned efficiently and included only verified, high-certainty records. This culture of cooperation and collaboration was one of the cornerstones of success in developing the freshwater fish sensitivity layers for the NEST and should be adopted by all future bioinformatics projects that seek to impact conservation management and planning on a national scale.
Understandably, we did encounter some limitations whilst developing the NEST sensitivity layers. Firstly, there were 14 taxa with fewer than 50 records in South Africa, with three taxa having less than 20 records each (Table 1). Data scarcity increased the difficulty of producing accurate SDMs (Stockwell and Peterson, 2002; Wisz et al., 2008) potentially reducing the accuracy of the sensitivity layers for these taxa. This highlights the urgent need to increase threatened species monitoring efforts at both provincial and national levels (Chakona et al., 2022). We recommend, based on their low numbers of recent records, that the following taxa be considered as a very high priority for baseline data collection and monitoring: Chetia brevis, Ctenopoma multispine, Enteromius treurensis, Kneria sp. nov. south africa, Labeo rubromaculatus, Marcusenius caudisquamatus, Marcusenius sp. nov. kosi, Pseudobarbus senticeps, Pseudobarbus skeltoni, Pseudobarbus sp. nov. doring, Pseudobarbus sp. nov. keiskamma, Pseudobarbus sp. nov. keurbooms, Amatolacypris trevelyani, and Silhouettea sibayi. In this regard, a standardised sampling protocol for freshwater fishes is currently under development in South Africa.
Secondly, the NEST sensitivity layers are only restricted to the modelled and current distribution of threatened taxa. Several studies have highlighted the importance of ensuring that catchment-level impacts (Skelton et al., 1995; Kleynhans, 2000; Nel et al., 2004; Abell et al., 2007), specifically upstream-impacts of anthropogenic activities, also be considered when developing protected areas for freshwater systems. The current iteration of the NEST does not fully account for this, providing protection for threatened taxa at the sub-quaternary catchment level only. Future iterations of the tool should consider ways to provide upstream protection at a larger primary catchment scale. Lastly, the overall success in terms of providing on-the-ground protection to South Africa’s threatened freshwater fishes will be dependent on local government authorities correctly and competently interpreting the outputs of the NEST and making responsible land-use change decisions by preventing developments where the risk to threatened taxa is deemed to be too high.
The freshwater fish component of the NEST provides a critical first step towards adequately incorporating threatened freshwater taxa into the EIA and development application process. However, there are additional steps that could improve upon and update the tool, thereby supporting more effective freshwater conservation in the future. Firstly, there is an urgent need to update and resolve the taxonomy of South Africa’s freshwater fishes, as there are a number of distinct genetic lineages that await formal description (Chakona et al., 2015, 2020b; Martin and Chakona, 2019; Bronaugh et al., 2020; Kambikambi et al., 2021; Mazungula and Chakona, 2021; Ramoejane et al., 2021). Once the taxonomy of South Africa’s freshwater fishes has been revised, the FBIS and NEST can be updated accordingly. Secondly, the NEST process described here can now be replicated for other species groups such as freshwater invertebrates. Although anurans are already included in the NEST (SANBI, 2021), there is also the potential to use the FBIS and the methodology developed here to improve upon these sensitivity layers. Lastly, distribution mapping used for threatened species should be repeated for non-native freshwater species (specifically invasives) occurring in South Africa—the primary threat to native freshwater fishes in the country (Weyl et al., 2020; Zengeya and Wilson, 2020; Chakona et al., 2022). Worryingly, the distributions of many of the country’s non-native fish species are not well known, and a lack of spatial data is holding back reliable system-wide invasive species assessments (De Moor, 1996; Ellender and Weyl, 2014; Zengeya and Wilson, 2020). Although mapping non-native species distributions falls beyond the scope of the NEST, this could provide insights into non-native species impacts on native taxa, and assist with identifying key areas for alien species management interventions (Weyl et al., 2020). Actioning these next steps will amplify the impact that the NEST may have on preventing further population declines in South Africa’s freshwater fish fauna.
This case study demonstrates how the FBIS has been used successfully to provide spatial data on threatened freshwater fishes to inform a national-level conservation decision-support tool in South Africa. Key to the success of this project was investing substantial time and effort into manually identifying, collating and cataloguing historic biodiversity data into a standardised, digital format. This generated comprehensive, high-quality biodiversity data sets that, through the FBIS, were then made accessible for analysis and uptake into national conservation planning and decision-making. Collaboration, networking and stakeholder engagement from the outset encouraged data-sharing and facilitated inter-disciplinary skill-sharing (e.g., modelling, mapping and data management skills)—two critical elements of the projects’ success - and we recommend this approach to similar bioinformatics efforts elsewhere, particularly in developing countries.
Data availability statement
The datasets presented in this study can be found in online repositories. The names of the repository/repositories and accession number(s) can be found in the article/Supplementary Material. Alternatively, the dataset can be accessed via the Freshwater Biodiversity Information System (freshwaterbiodiversity.org).
Author contributions
MK is the primary author and was involved in all aspects of publishing this manuscript. JS, CG, and HD contributed to the conception and design of the project as well as assisting with writing the first draft of the manuscript. DH contributed to conception and design of the work as well performing statistical analysis and assistance with writing the first draft of the manuscript. JP, DV, DI, AC, DR, NJ, BP, MJ, RB, FR, TZ, AH, and NR-M all assisted with data cleaning and provided conceptual design and advice throughout the project. All authors contributed to manuscript revision, read, and approved the submitted version.
Funding
Funding for the development of the Freshwater Biodiversity Information System (FBIS) was provided by the JRS Biodiversity Foundation (Grants 60606 and 60919) and the South African National Biodiversity Institute (SANBI). This work is based on the research supported in part by the National Research Foundation (NRF) of South Africa (Grant Number: MND2000621534710–UID: 133692) and the NRF-SAIAB DSI/NRF Research Chair in Inland Fisheries and Freshwater Ecology (UID 110507). Student funding, in the form of an MSc bursary, was also provided by the Freshwater Biodiversity Unit of the South African National Biodiversity Institute (SANBI).
Acknowledgments
We would like the acknowledge the contributions of the FRC staff and interns, specifically Aneri Swanepoel and Toni Olsen, who provided invaluable assistance with data collection and cleaning. We would also like to thank Cecilia Cerrilla for providing moral support during drafting and editing of this manuscript.
Conflict of interest
The authors declare that the research was conducted in the absence of any commercial or financial relationships that could be construed as a potential conflict of interest.
Publisher’s note
All claims expressed in this article are solely those of the authors and do not necessarily represent those of their affiliated organizations, or those of the publisher, the editors and the reviewers. Any product that may be evaluated in this article, or claim that may be made by its manufacturer, is not guaranteed or endorsed by the publisher.
Supplementary material
The Supplementary Material for this article can be found online at: https://www.frontiersin.org/articles/10.3389/fenvs.2023.1122223/full#supplementary-material
References
Abell, R., Allan, J. D., and Lehner, B. (2007). Unlocking the potential of protected areas for freshwaters. Biol. Conserv. 134, 48–63. doi:10.1016/j.biocon.2006.08.017
Acreman, M., Hughes, K. A., Arthington, A. H., Tickner, D., and Dueñas, M. A. (2019). Protected areas and freshwater biodiversity: A novel systematic review distils eight lessons for effective conservation. Conserv. Lett. 13, 1–14. doi:10.1111/conl.12684
Adams, V. M., Setterfield, S. A., Douglas, M. M., Kennard, M. J., and Ferdinands, K. (2015). Measuring benefits of protected area management: Trends across realms and research gaps for freshwater systems. Philos. Trans. R. Soc. B Biol. Sci. 370, 20140274. doi:10.1098/rstb.2014.0274
WWF (2020). in Living planet report 2020 - bending the curve of biodiversity loss. Editors R. E. A. Almond, M. Grooten, and T. Petersen Gland (Switzerland).
Bronaugh, W. M., Swartz, E. R., and Sidlauskas, B. L. (2020). Between an ocean and a high place: Coastal drainage isolation generates endemic cryptic species in the cape kurper Sandelia capensis (Anabantiformes: Anabantidae), Cape region, South Africa. J. Fish. Biol. 96 (5), 1087–1099. doi:10.1111/jfb.14182
Carlson, C. J. (2020). Embarcadero: Species distribution modelling with Bayesian additive regression trees in r. Methods Ecol. Evol. 11 (7), 850–858. doi:10.1111/2041-210X.13389
Cerrilla, C., Afrika, J., Impson, D., Kotze, N., Paxton, B. R., Reed, C., et al. (2022). Rapid population decline in one of the last recruiting populations of the endangered Clanwilliam sandfish (Labeo seeberi): The roles of climate change and non-native fish. Aquatic Conservation Mar. Freshw. Ecosyst. 32 (5), 781–796. doi:10.1002/aqc.3785
Chakona, A., Gouws, G., Kadye, W. T., Mpopetsi, P. P., and Skelton, P. H. (2020b). Probing hidden diversity to enhance conservation of the endangered narrow-range endemic Eastern Cape rocky, Sandelia bainsii (Castelnau 1861). Koedoe Afr. Prot. Area Conserv. Sci. 62, 1–6. doi:10.4102/koedoe.v62i1.1627
Chakona, A., Gouws, G., Kadye, W. T., Jordaan, M. S., and Swartz, E. R. (2020a). Reconstruction of the historical distribution ranges of imperilled stream fishes from a global endemic hotspot based on molecular data: Implications for conservation of threatened taxa. Aquat. Conserv. Mar. Freshw. Ecosyst. 30, 144–158. doi:10.1002/aqc.3251
Chakona, A., Jordaan, M. S., Raimondo, D. C., Bills, R. I., Skelton, P. H., and van Der Colff, D. (2022). Diversity, distribution and extinction risk of native freshwater fishes of South Africa. J. Fish. Biol. 100, 1044–1061. doi:10.1111/jfb.15011
Chakona, A., Malherbe, W. S., Gouws, G., and Swartz, E. R. (2015). Deep genetic divergence between geographically isolated populations of the goldie barb (Barbus pallidus) in SouthSouth Africa: Potential taxonomic and conservation implications. Afr. Zool. 50, 5–10. doi:10.1080/15627020.2015.1021164
Dallas, H., and Rivers-Moore, N. (2014). Ecological consequences of global climate change for freshwater ecosystems in South Africa. S. Afr. J. Sci. 110, 48–58. Discovery Service for Rhodes University Library. doi:10.1590/sajs.2014/20130274
Dallas, H., Shelton, J., Sutton, T., Tri Cuptura, D., Kajee, M., and Job, N. (2022). The Freshwater Biodiversity Information System (FBIS)–mobilising data for evaluating long-term change in South African rivers. Afr. J. Aquat. Sci. 47, 291–306. doi:10.2989/16085914.2021.1982672
De Moor, I. J. (1996). Case studies of the invasion by four alien fish species (Cyprinus carpio, Micropterus salmoides, Oreochromis macrochir and O. mossambicus) of freshwater ecosystems in southern Africa. Trans. R. Soc. S. Afr. 51, 233–255. doi:10.1080/00359199609520609
Department of Environmental Affairs (2016). National protected area expansion Strategy for SouthSouth Africa 2016. Available at: http://bgis.sanbi.org/protectedareas/Nationa_Protected_Area_Expansion_Strategy.pdf.
Department of Forestry Fisheries and the Envrionment (2021). National web based environmental screening tool. Available at: https://screening.environment.gov.za/screeningtool/#/pages/welcome (Accessed August 22, 2022).
Ellender, B., and Weyl, O. (2014). A review of current knowledge, risk and ecological impacts associated with non-native freshwater fish introductions in South Africa. Aquat. Invasions 9, 117–132. doi:10.3391/ai.2014.9.2.01
Esri Inc (2022). ArcGIS Pro (version 3.0). Available at: https://www.esri.com/en-us/arcgis/products/arcgis-pro/overview.
Evans, W., Downs, C. T., Burnett, M. J., and O’Brien, G. C. (2022). Assessing fish community response to water quality and habitat stressors in KwaZulu-Natal, South Africa. Afr. J. Aquat. Sci. 47, 47–65. doi:10.2989/16085914.2021.1952158
FBIS (2022). Freshwater biodiversity information system (FBIS). FBIS version 3. Available at: https://freshwaterbiodiversity.org/(Accessed September 14, 2021).
Fricke, R., Eschmeyer, W. N., and Van der Laan, R. (2022). Eschmeyer’s catalog of fishes: Genera, species, references. San Francisco. Available at: http://researcharchive.calacademy.org/research/ichthyology/catalog/fishcatmain.asp.
Grooten, M., and Almond, R. E. A. (2018). Living planet report-2018: Aiming higher. Gland, Switzerland: WWF international.
Horak, I., Horn, S., and Pieters, R. (2021). Agrochemicals in freshwater systems and their potential as endocrine disrupting chemicals: A South African context. Environ. Pollut. 268, 115718. doi:10.1016/j.envpol.2020.115718
Hughes, K., Harrison, I., Darwall, W., Lee, R., Muruven, D., Revenga, C., et al. (2021). The world’s forgotten fishes. Gland, Switzerland. Available at: https://c402277.ssl.cf1.rackcdn.com/publications/1460/files/original/wwfintl_freshwater_fishes_report.pdf?1617110723.
Impson, N. D., Bills, I. R., and Cambray, J. A. (2002). “A conservation plan for the unique and highly threatened freshwater fishes of the Cape Floral Kingdom,” in Conserv. Freshw. Fishes options futur (Hoboken, New Jersey: Oxford Blackwell Sci), 432–440.
IUCN Red List (2020). International Union for the Conservation of Nature (IUCN) Red List of Threatened Species. Available at: https://www.iucnredlist.org/ (Accessed December 1, 2020).
Jordaan, M. S., Chakona, A., and Colff, D. V. D. (2020). Protected areas and endemic freshwater fishes of the cape fold ecoregion: Missing the boat for fish conservation? Front. Environ. Sci. 8, 1–13. doi:10.3389/fenvs.2020.502042
Kambikambi, M. J., Kadye, W. T., and Chakona, A. (2021). Allopatric differentiation in the Enteromius anoplus complex in South Africa, with the revalidation of Enteromius cernuus and Enteromius oraniensis, and description of a new species, Enteromius mandelai (Teleostei: Cyprinidae). J. Fish. Biol. 99, 931–954. doi:10.1111/jfb.14780
Kleynhans, C. J. (2000). Desktop estimates of the ecological importance and sensitivity categories (EISC), default ecological management classes (DEMC), present ecological status categories (PESC), present attainable ecological management classes (present AEMC), and best attainab. Pretoria: Quaternary Catchments In South Africa.
Martin, M. B., and Chakona, A. (2019). Designation of a neotype for Enteromius pallidus (smith, 1841), an endemic cyprinid minnow from the cape fold ecoregion, South Africa. Zookeys 848, 103–118. doi:10.3897/zookeys.848.32211
Mazungula, D. N., and Chakona, A. (2021). An integrative taxonomic review of the Natal mountain catfish, Amphilius natalensis Boulenger 1917 (Siluriformes, Amphiliidae), with description of four new species. J. Fish. Biol. 99, 219–239. doi:10.1111/jfb.14714
Nel, J. L., Reyers, B., Roux, D. J., and Cowling, R. M. (2009). Expanding protected areas beyond their terrestrial comfort zone: Identifying spatial options for river conservation. Biol. Conserv. 142, 1605–1616. doi:10.1016/j.biocon.2009.02.031
Nel, J. L. (2011). Technical report for the national freshwater ecosystem priority areas project: Report to the water research commission. Pretoria. Available at: https://www.karooforever.org.za/images/NFEPA_Technical_Report.pdf.
Nel, J., Maree, G., Roux, D., Moolman, J., Kleynhans, N., Silberbauer, M., et al. (2004). South African national spatial biodiversity assessment 2004: Technical report. Volume 2. Stellenbosch: River component.
O’brien, G. C., Ross, M., Hanzen, C., Dlamini, V., Petersen, R., Diedericks, G. J., et al. (2019). River connectivity and fish migration considerations in the management of multiple stressors in South Africa. Mar. Freshw. Res. 70, 1254–1264. doi:10.1071/MF19183
R Core Team (2020). R core Team. 2020. R: A language and environment for statistical computing. Vienna, Austria: R Foundation for Statistical Computing.
Ramoejane, M., Weyl, O. L. F., Swartz, E. R., and Gouws, G. (2021). Identifying multiple geographically restricted phylogeographic lineages of moggel (Cyprinidae: Labeo umbratus) in South Africa. Afr. J. Aquat. Sci. 46, 225–235. doi:10.2989/16085914.2020.1818546
Republic of South Africa (1998). National environmental management Act 107 of 1998. doi:10.4324/9781315664262-18
Republic of South Africa (2004a). National environmental management: Biodiversity Act (10/2004): Threatened or protected species regulations. Available at: https://www.gov.za/documents/national-environmental-management-biodiversity-act-0.
Republic of South Africa (2004b). National environmental management: Protected areas Act, No. 57 of 2003. Available at: http://www.nsw.gov.au/sites/default/files/Government_Gazette_2_December.pdf#page=15.
Russell, I. A. (2011). Conservation status and distribution of freshwater fishes in South African national parks. Afr. Zool. 46, 117–132. doi:10.1080/15627020.2011.11407485
South African National Biodiversity Insitute (2021). Species environmental assessment guideline. Guidelines for the implementation of the terrestrial fauna and terrestrial flora species protocols for environmental impact assessments in South Africa. Pretoria, South Africa: South African National Biodiversity Insitute.
Skelton, P. H., Cambray, J. A., Lombard, A., and Benn, G. A. (1995). Patterns of distribution and conservation status of freshwater fishes in South Africa. South Afr. J. Zool. 30, 71–81. doi:10.1080/02541858.1995.11448375
Skowno, A. L., Poole, C. J., Raimondo, D. C., Sink, K. J., Van Deventer, H., van Niekerk, L., et al. (2019). National Biodiversity Assessment 2018: The status of South Africa’s ecosystems and biodiversity. Pretoria. doi:10.1017/CBO9781107415324.004
South African National Biodiversity Insitute (2011). GIS metadata: Detailed report. Stellenbosch: ESRI.
South African National Biodiversity Institute (2022). Red list of South African species. Available at: www.speciesstatus.sanbi.org (Accessed September 14, 2022).
Stockwell, D. R. B., and Peterson, A. T. (2002). Effects of sample size on accuracy of species distribution models. Ecol. Modell. 148, 1–13. doi:10.1016/S0304-3800(01)00388-X
Wepener, V., van Dyk, C., Bervoets, L., O’Brien, G., Covaci, A., and Cloete, Y. (2011). An assessment of the influence of multiple stressors on the Vaal River, South Africa. Phys. Chem. Earth 36, 949–962. doi:10.1016/j.pce.2011.07.075
Weyl, O. L. F., Ellender, B. R., Wassermann, R. J., Truter, M., Dalu, T., Zengeya, T. A., et al. (2020). “Alien freshwater fauna in South Africa,” in Biological invasions in South Africa. Editors B. W. van Wilgen, J. Measey, D. M. Richardson, J. R. Wilson, and T. A. Zengeya (Switzerland: Springer), 153–183. doi:10.1007/978-3-030-32394-3
Williams-Subiza, E. A., and Epele, L. B. (2021). Drivers of biodiversity loss in freshwater environments: A bibliometric analysis of the recent literature. Aquat. Conserv. Mar. Freshw. Ecosyst. 31, 2469–2480. doi:10.1002/aqc.3627
Wisz, M. S., Hijmans, R. J., Li, J., Peterson, A. T., Graham, C. H., and Guisan, A. (2008). Effects of sample size on the performance of species distribution models. Divers. Distrib. 14, 763–773. doi:10.1111/j.1472-4642.2008.00482.x
Zengeya, T. A., and Wilson, J. (2020). “The status of biological invasions and their management in South Africa in 2019,” in Stellenbosch: South African National Biodiversity Institute, Kirstenbosch and DSI-NRF Centre of Excellence for Invasion Biology. Editors T. A. Zengeya, and J. R. Wilson doi:10.5281/zenodo.3947613
Zengeya, T. A., Kumschick, S., Weyl, O. L. F., and van Wilgen, B. W. (2020). An evaluation of the impacts of alien species on biodiversity in South Africa using different assessment methods. Biol. invasions S. Afr. 14, 487–512. doi:10.1007/978-3-030-32394-3_17
Keywords: freshwater fish, South Africa, FBIS, screening tool, conservation, SDM (species distribution model), threatened species, decision-making
Citation: Kajee M, Henry DAW, Dallas HF, Griffiths CL, Pegg J, Van der Colff D, Impson D, Chakona A, Raimondo DC, Job NM, Paxton BR, Jordaan MS, Bills R, Roux F, Zengeya TA, Hoffman A, Rivers-Moore N and Shelton JM (2023) How the Freshwater Biodiversity Information System (FBIS) is supporting national freshwater fish conservation decisions in South Africa. Front. Environ. Sci. 11:1122223. doi: 10.3389/fenvs.2023.1122223
Received: 12 December 2022; Accepted: 22 February 2023;
Published: 22 March 2023.
Edited by:
Cang Hui, Stellenbosch University, South AfricaReviewed by:
Jeyaraj Antony Johnson, Wildlife Institute of India, IndiaRui Manuel Vitor Cortes, University of Trás-os-Montes and Alto Douro, Portugal
Copyright © 2023 Kajee, Henry, Dallas, Griffiths, Pegg, Van der Colff, Impson, Chakona, Raimondo, Job, Paxton, Jordaan, Bills, Roux, Zengeya, Hoffman, Rivers-Moore and Shelton. This is an open-access article distributed under the terms of the Creative Commons Attribution License (CC BY). The use, distribution or reproduction in other forums is permitted, provided the original author(s) and the copyright owner(s) are credited and that the original publication in this journal is cited, in accordance with accepted academic practice. No use, distribution or reproduction is permitted which does not comply with these terms.
*Correspondence: Mohammed Kajee, a2p4bW9oMDA3QG15dWN0LmFjLnph