- 1School of Economics, Capital University of Economics and Business, Beijing, China
- 2School of Economics and Management, Jiangsu University of Science and Technology, Zhenjiang, China
There is no consensus on whether state-owned enterprises (SOEs) or privately-owned enterprises (POEs) pollute more. This study explores the impact of ownership on pollution emission intensity using micro-data from Chinese industrial enterprises. From the perspective of energy efficiency, the mechanism of ownership affecting pollution emissions is explored further. Research results show that the pollution emission intensity of SOEs is significantly higher than that of POEs. The underlying reason is the low energy efficiency of SOEs, and energy efficiency plays an important mediating role in the relationship between ownership and pollution emissions. Among industrial waste gas, nitrogen oxides (NOx) and dust emissions, energy efficiency plays the largest mediating effect between ownership and NOx emissions. Additionally, in both high-polluting and low-polluting industries, SOEs’ pollutant emission intensity is higher than that of POEs, however, the mediation effect of energy efficiency is greater in low-polluting industries. In cities with high growth pressure, SOEs’ pollutant emission intensity is more significant than that of POEs. On the contrary, there are no noticeable differences in pollutant emission intensity between SOEs and POEs in cities with low growth pressure. But the mediation effect of energy efficiency is more significant in cities with high growth pressure. Industrial enterprises are the ultimate sources of industrial pollution. Therefore, the formulation of effective environmental policies cannot be separated from the analysis of enterprises’ emission behaviors and the assessment of micro factors affecting emissions. The conclusions of this study provide a basis for developing countries to formulate environmental policies for industrial enterprises.
1 Introduction
The ownership structure is an essential factor affecting an enterprise’s objective functions, and it may also be the main factor determining the choice of the environmental behavior of an enterprise. Based on the “national key pollution sources self-monitoring information disclosure platform” in China, the average number of days exceeding the standard in 2016 for emissions of industrial NOx, industrial dust, and industrial sulfur dioxide (SO2) by enterprises under different types of ownership are compared in Figure 1. It can be seen that the average number of days for the three groups that exceeded the emissions standard were 32.60 days for SOEs, 37.73 days for foreign-invested enterprises, and 32.71 days for POEs. It can be seen that there are obvious differences in pollutant discharge behavior among enterprises with different types of ownership. These differences indicate that enterprises with different types of ownership may have different environmental behavior.
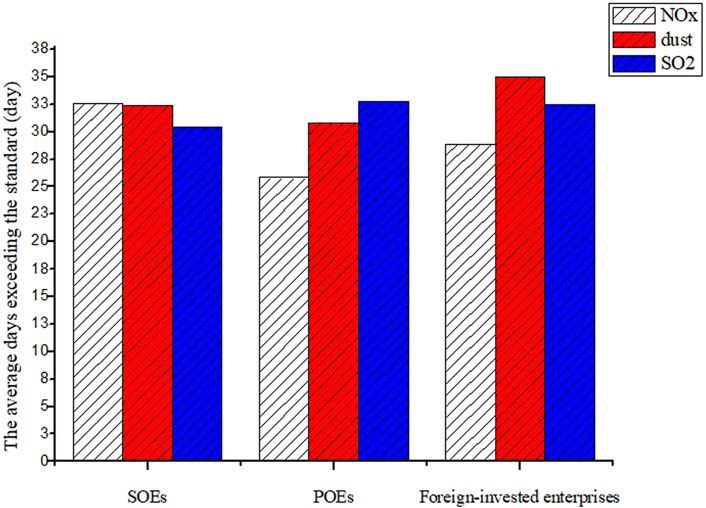
FIGURE 1. The average number of days exceeding the standard emissions in different ownership enterprises in China.
The empirical tests are different because existing studies have not thoroughly analyzed the mechanism of ownership affecting enterprises’ pollutant emissions. Therefore, this study attempts to ascertain the internal mechanism of ownership affecting enterprises’ pollutant emissions from the perspective of energy efficiency. And it hopes to provide a new perspective to understand the relationship between ownership and pollution. The reason for starting with energy efficiency is that pollution emissions are the result of energy consumption. According to World Health Organization, the main contributor to air pollution is the inefficient consumption of energy by household, industrial, agricultural, and transport sectors. Several studies have found significant differences in energy efficiency between SOEs and POEs (Lin and Wang, 2014; Lin and Long, 2015). Therefore, energy efficiency is deemed to be a critical path for studying the internal relationship between ownership and pollution. Thus, is there any difference in energy efficiency between SOEs and POEs? Is this difference a mediating factor affecting pollutant emissions? If energy efficiency plays a mediating role between ownership and pollution, how big is the contribution of this mediating role?
The marginal contribution of this research may mainly exist in the following two aspects. First of all, starting from energy efficiency, this paper provides a new perspective to analyze the relationship between ownership and air pollution emissions, which not only enriches the research in related fields of corporate environmental behavior, but also deepens the understanding of the differences between SOEs and POEs, forming a useful supplement to existing theories. Secondly, this paper further carefully examines the differences in the mechanism of energy efficiency in industries with different pollution levels and regions with different economic growth pressures, so as to provide theoretical bases and policy inspiration for developing countries to improve corporate environmental performance according to different local conditions.
Based on the above research background and motivation, this paper takes Chinese micro-enterprises as the research object, and empirically explores the differences in pollution emissions of enterprises with different ownership. By constructing the mediation effect model, this paper attempts to examine the mediation effect of energy efficiency between ownership and pollution emissions. Furthermore, based on industries with different pollution levels and regions with different economic growth pressures, the heterogeneity of the mediation effect of energy efficiency is explored in groups. The rest of the paper is structured as follows: Section 2 reviews the relevant literature, and Section 3 presents theoretical hypotheses. Meanwhile, Section 4 introduces the research sample, data collection, the analysis framework and data description. Section 5 discusses the empirical results. Section 6 is the conclusion and policy implications.
2 Literature reviews
Do SOEs or POEs pollute more? There is no agreement over this, and this is a question worth further study. Many former studies unveil that SOEs have better environmental performance than POEs (Earnhart and Lizal, 2006; Calza et al., 2016; Clò et al., 2017). Some researchers, however, claimed that privatization benefits environmental protection (Craig and Dibrell, 2006; Wang and Jin, 2007; Berrone et al., 2010; Meyer and Pac, 2013). While other studies indicate no linear relation between ownership and environmental pollution and there is no proof of a relationship between ownership and environmental performance (Calza et al., 2013; Li and Chan, 2016; Wang and Dear, 2017). Thus, the debate about corporate ownership as a potential impetus of enterprises’ environmental concerns and performance is still open. The conclusions can be categories into four groups:
The first group suggests that environmental performance is better and that pollution emissions are lower in SOEs (Earnhart and Lizal, 2006; Calza et al., 2016; Clò et al., 2017). Using an unbalanced panel dataset of Czech enterprises from 1993 to 1998, the study analyzed the effects of ownership structure on corporate environmental performance. It shows that state ownership improves environmental performance (Earnhart and Lizal, 2006). Using 778 European enterprises in 2012 (Calza et al., 2016), it investigated the explanatory power of corporate governance issues, including ownership. The results show that enterprises with a higher percentage of shares owned by the state exhibited superior green proactivity. Also, using a cross-country panel dataset of 29 power markets in Europe from 1990 to 2012 (Clò et al., 2017), it investigated how ownership affected environmental performance in developed countries. They found that increasing public ownership, as measured by the OECD, ETCR index, was associated with reducing greenhouse gas emissions and carbon intensity.
The second group asserts that SOEs’ environmental performance is worse than that of POEs (Craig and Dibrell, 2006; Wang and Jin, 2007; Berrone et al., 2010; Meyer and Pac, 2013). The study investigated different environmental performances with diverse ownership structures using data from 396 enterprises in the United States (US) (Craig and Dibrell, 2006). They posited that family enterprises could better facilitate environmentally-friendly enterprise policies than are their non-family competitors. By using a survey of approximately 1,000 industrial enterprises in China, some studies explored the differences in pollution control performance among industries with different types of ownership in China (Wang and Jin, 2007). In their study, enterprises under foreign direct investment (FDI) and either collectively or community-owned enterprises exhibited better environmental performance in terms of water pollution discharge intensity, whereas state- and private-owned enterprises in China were the worst performers. Also, some studies used the US and Eastern Europe enterprises data (Berrone et al., 2010; Meyer and Pac, 2013), one compared the environmental performance of family and non-family public corporations between 1998 and 2002, using data from 194 US enterprises, and found that the family-controlled public enterprises exhibited better environmental performance than their non-family counterparts. Another compared the environmental performance of state-owned and privatized energy utility plants in Eastern Europe using a novel panel dataset. It demonstrated that state-owned plants emitted more sulfur dioxide than did privately-owned plants.
The third group asserts that the relationship between ownership and environmental performance or pollutant emissions is non-linear (Li and Chan, 2016). They tested the relationship between ownership and environmental performance using a survey of over 1,000 industrial enterprises in 12 Chinese cities in 2006. The results showed that, compared with POEs and foreign-invested enterprises, small and medium-sized SOEs were less likely to achieve national emissions standards. However, the environmental performance of the largest SOEs matches that of their private and foreign counterparts.
The fourth group finds no evidence suggesting a relationship between ownership structure and environmental performance (e.g., (Calza et al., 2013; Wang and Dear, 2017)). One of them examined the influence of ownership structure on enterprises’ environmental performance using 12 European energy-listed enterprises. The results showed that enterprises with more diffuse ownership exhibited the worst environmental performance, measured as the capability to reduce CO2 emissions. However, the relationship between ownership structure and environmental performance was not significant. Another investigated the enterprise-level determinants of environmental regulation violations based on 629 cases reported in Chongqing, China, from 2011 to 2014. Still, the regression coefficient that represented ownership was not significant.
To sum up, the research on the relationship between ownership and pollution emissions is inconsistent, but with energy efficiency as an intermediary variable, there are few literatures exploring the internal mechanism of ownership affecting corporate pollutant emissions. Therefore, based on the analysis perspective of energy efficiency, this paper carefully explores the mechanism of the ownership structure on air pollution, which not only forms a useful supplement to existing research, but also provides insights for more developing countries to improve their environmental performances.
3 Theoretical hypotheses
Who pollutes more: SOEs or POEs? The debate on ownership type and pollution has gone on for years, but no agreement has been reached. To discuss the relationship, it is needed to analyze the differences between SOEs and POEs in terms of the objective function, social responsibility, environmental regulation, technology level, and energy efficiency and ascertain how these features affect pollution emissions. Thus, we put forward three hypotheses.
Hypothesis 1. The pollutant emission intensity of SOEs is significantly lower than is that of POEs.
Compared with POEs, SOEs are more likely to incorporate environmental protection into their objective function for the following four reasons. First, the government is the biggest shareholder in SOEs, and it does not concern about profits. For example, SOEs in the transportation industry often serves as an operator of the social infrastructure to guarantee the smooth transport for the society. Thus, these enterprises would focus on how to maximize the number of passengers transferred rather than the profit for the enterprises. So, SOEs would not have an incentive to pollute more, though this may increase profits. Second, the cost of environmental violations for SOEs is higher than for POEs because the cost for SOEs includes economic costs, such as fines, and reputational and political costs for the managers, which is their most crucial concern. The performance measure of managers is not based on either revenue or profit but on whether SOEs have maximized social welfare. Third, SOEs are always critical monitoring objects for environmental protection and are supervised by many departments regarding pollution control, emission reduction, and environmental information disclosure. Fourth, SOEs have better endurance to financial constraints that have a strong negative and significant impact on environmental protection investment (Zhang et al., 2019). Thus, SOEs may emit less because of their adequate environmental protection funds, social responsibility, higher violation costs, and stricter environmental supervision.
Hypothesis 2. The pollutant emission intensity of SOEs is significantly higher than is that of POEs.
SOEs have more bargaining power and better relationships with the local and central governments, and POEs have less bargaining power concerning the payment of the pollution levy (Wang et al., 2003). SOEs are more likely to escape environmental supervision because of the collusion between the government and enterprises (Wang and Jin, 2007). In particular, the administrative ranking of some SOEs may be higher than that of the local government. Thus, the local environmental protection departments are often faced with difficulties during supervision. Moreover, SOEs are usually protected and, compared with POEs, have no motivation to improve energy efficiency (Lin and Long, 2015). More and more evidence has been found that SOEs’ productivity levels are below those of all other ownership categories (Jefferson et al., 2003). Thus, SOEs may emit more because of their greater bargaining power, lower energy efficiency, and lower technical level.
Hypothesis 3. Energy efficiency plays a significant mediating role between ownership and pollution intensity.
What role does energy efficiency play in the relationship between ownership and environmental pollution? Many previous studies focus on comparing energy efficiency between foreign-invested enterprises and local enterprises and the impact of FDI on energy efficiency (Earnhart and Lizal, 2006; Huang and Chang, 2019). However, few studies have analyzed the differences in energy efficiency between SOEs and POEs for local enterprises using data from developing countries, especially China. Most studies only consider that the energy efficiency of SOEs is low and that of POEs is high (Lin and Wang, 2014; Lin and Long, 2015; Andersson et al., 2018; Wang and Yuan, 2018). That is because SOEs in developing countries have soft budget constraints. When SOEs are faced with loss, bankruptcy, and other problems, they often enjoy various kinds of government subsidies. This soft budget constraint induces moral hazard for enterprises, which weakens energy conservation and emission reduction motivation. Conversely, as POEs face hard budget constraints, energy-saving and emission reduction are consistent with their goal of maximizing profits.
4 Methodology and model specification
4.1 Sample selection
Our objective is to identify the relationship between ownership, energy efficiency, and environmental pollution. So we selected industrial enterprises’ data in China because pollution is not the main problem for enterprises in the agriculture and service sectors. Taking air pollution as an example, in 2015, the total sulfur dioxide (SO2) emissions in China were 18.591 million tons. The industrial SO2 emissions accounted for 83.73%1, which proves that the industrial sector is the main contributor to air pollution. It is reasonable to exclude enterprises in the agricultural and service sectors from the sample.
4.2 Data collection
Our analytical database is derived from two enterprise-level data sources: China’s Environmental Statistics Database (CESD) and Annual Surveys of Industrial Enterprises (ASIF). The CESD is compiled by the Ministry of Environmental Protection (MEP) of the People’s Republic of China. It contains annual emission data, energy data, and environmental investment data for the industrial sectors. The ASIF is compiled by China’s National Bureau of Statistics (NBS). It contains much information on all state-owned and non-state-owned industrial enterprises’ production and finances with an annual sale above 10 million CNY in 2013. The ASIF is one of the key micro-data sets used widely by China’s researchers, and the CESD has only recently become available to researchers. Recently, more and more researchers have been using these two comprehensive datasets to study enterprises’ environmental behavior (e.g., (Liu et al., 2017; Huang and Chang, 2019; Zhang et al., 2019)).
For baseline regressions, two datasets were matched and 15,229 observations were obtained in total. To ensure the accuracy of the data, the researcher’s team also performed a random comparison between the data in the database and the annual reports or information on the enterprises’ websites.
4.3 The analysis framework
To investigate the relationship between ownership and pollution emissions and the mediation effect of energy efficiency, the researchers established the econometric model as follows:
The dependent variable is pollu, which represents environmental behavior. The independent variable is soe, which represents ownership. The controlling variables are size, profit, lev, age, and treatment, representing the enterprise size, the state of operation, assets structure, the enterprises’ duration, and the environmental investment for pollution reduction. i = 1, … , n identifies the enterprise, t = 1, … , 39 refers to each industry, and ɛ is the error term. The regression model (1) is used to check the total direct effect of ownership on pollutant intensity.
The dependent variable pollu is defined as the pollution intensity of industrial waste gas emissions, the pollution intensity of NOx emissions, and the pollution intensity of industrial dust emissions. The units of three air pollution intensities are million cubic meters per thousand CNY, tons per million CNY, and tons per ten thousand CNY. Here, the pollutant emissions are measured by three gas emission intensities for two reasons. First, following urbanization, the discharge of wastewater is increasingly greater from residential sources than from manufacturing. For example, in 2015, the volume of household wastewater discharge was approximately 535,204 million tons, accounting for 72.78% of the total wastewater discharge volume2. Therefore, as regards water pollution, the primary source of pollution is living and not producing, which is why we use air pollution, rather than water pollution, to represent the environmental behavior. Second, the pollutant emissions are measured by air pollution intensity rather than by total pollutant discharge. To a great extent, the total volume of emissions will be affected by the production scale, which cannot reflect environmental performance quality. To eliminate the influence of scale on pollution, the researchers used emission intensity to characterize pollution emission.
The independent variable soe is also defined as a dummy. Based on previous researches, SOE samples are defined as the share of state ownership exceeding 30% (Huang et al., 2017). If the percentage is more than 30%, the enterprise is considered state-owned; otherwise, it is considered privately-owned. The 30% threshold is chosen because it indicates relative state control based on available government documents.
The controlling variables include size, profit, lev, age, and treatment. size refers to the natural logarithm of total assets. On the one hand, large-scale enterprises are more innovative because they have extra financial resources to improve production technology and environmental technology (Arora and Cason, 1995; Hamilton, 1995). The regulators are often successful in pressing them to pollute less (Lei et al., 2017). On the other hand, large-scale enterprises are influential, and they may have the bargaining capacity to avoid environmental punishment. So, as yet, enterprise size and pollution intensity are not directly comparable. profit is a comprehensive reflection of enterprise management, which may influence the cash flow and investment for environmental protection. lev refers to the ratio of total liabilities to total assets of an enterprise, reflecting whether the basic financial structure of enterprises is stable. The stability of the financial structure is essential to ensure environmental protection investment. age is measured by the observation year minus the year that the enterprise was established. treatment is measured by the operational cost of industrial waste gas treatment facilities. The higher the operating cost, the more environmental investment and pollution treatment required.
The regression model (2) is used to check the influence of ownership on energy efficiency.
The dependent variable is energy. In order to facilitate the aggregation of different types of energy consumption, this paper converts the industrial coal consumption, fuel oil consumption and natural gas consumption in the database into standard coal consumption and sums them up3. At the same time, energy efficiency is defined as the standard coal consumption per unit income value of an enterprise, that is, the standard coal consumption of an enterprise divided by its total income (Lyubich et al., 2018). The controlling variables are similar to model (1). The regression model (3) is used to check the indirect influence of ownership and energy efficiency on pollutant intensity.
Combined with the research theme of this paper, this paper adopts the classic mediation effect test (Baron and Kenny, 1986), the test steps based on the “Causal Steps Approach” are as follows: The first step is to estimate the empirical model (1) and check the total effect of ownership on environmental pollution. If
4.4 Summary statistics
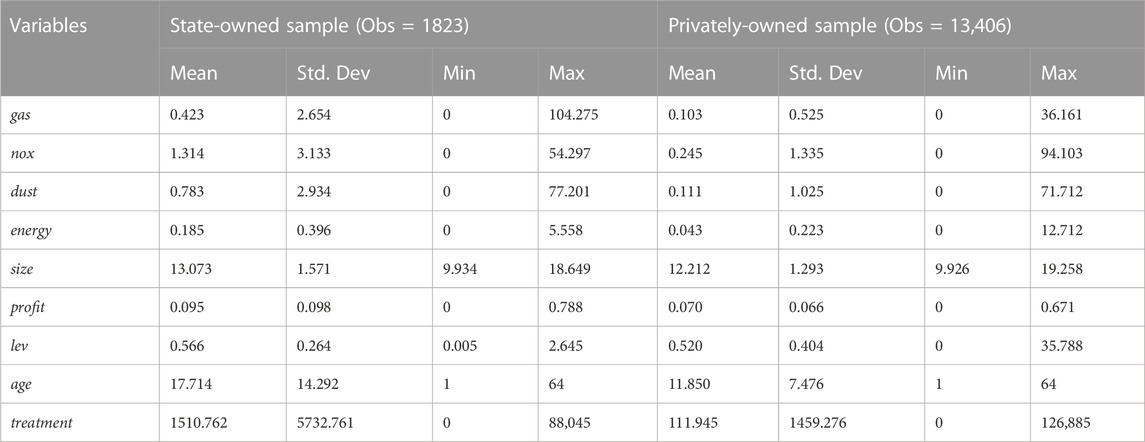
The summary statistics of key variables in the state-owned sample and the private-owned sample are compared in Table 1. As shown, the average industrial waste gas emission intensity is 0.423 million cubic meters per thousand CNY for SOEs and 0.103 million cubic meters per thousand CNY for POEs. The average industrial NOx emission intensity is 1.314 tons per million CNY for SOEs and 0.245 tons per million CNY for POEs. The average industrial dust emission intensity is 0.783 tons per ten thousand CNY for SOEs and 0.111 tons per ten thousand CNY for POEs. Overall, SOEs’ gas pollution intensity is much higher than that of POEs, suggesting that SOEs’ environmental behavior is relatively low.
As shown in Table 1, there is a significant difference between SOEs and POEs, and the average emission intensity of SOEs is much higher than that of POEs. Whether the ownership structure causes the different environmental performances of SOEs and POEs needs further analysis. The pollutant emission of industrial enterprises depends on many factors, such as production, technology, energy efficiency, etc., and all the factors are closely related to the industry. Whether the different emission intensities of SOEs and POEs are not attributed to the ownership but enterprises’ distribution? In other words, whether more SOEs distribute in high-pollution industries and more POEs distribute in low-polluting industries?
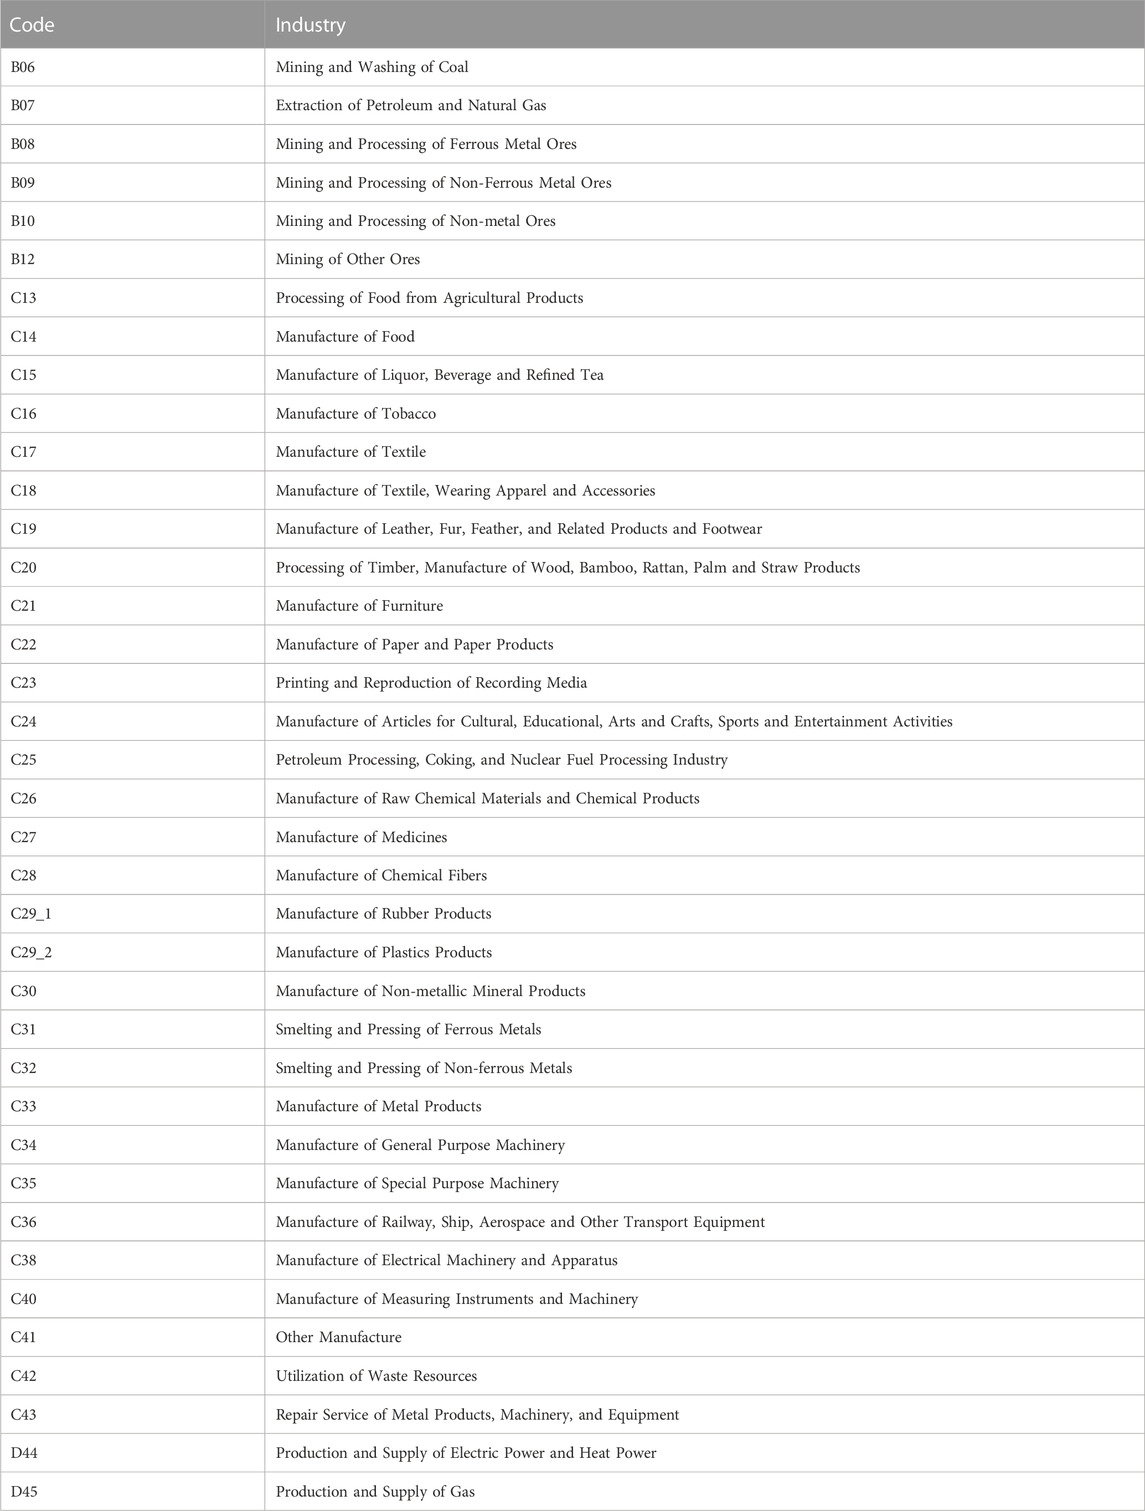
The proportion of SOEs and POEs in 39 industries in China is calculated and shown in Figure 2. As can be seen, the numbers of SOEs and POEs in different industries are quite different. In several industries, the proportions of SOEs exceed 50%, such as “Manufacture of Tobacco” (C16), “Extraction of Petroleum and Natural Gas” (B07), “Mining and Washing of Coal” (B06), “Production and Supply of Electric Power and Heat Power” (D44), “Repair Service of Metal Products, Machinery, and Equipment” (C43), and “Production and Supply of Gas” (D45). In other industries, the proportions of SOEs are not so high. Even in several industries, the number of SOEs is less than five. For example, there is only one SOE in four industries, including “Utilization of Waste Resources” (C42), “Manufacture of Furniture” (C21), “Other Manufacture” (C41), and “Manufacture of Articles for Cultural, Educational, Arts and Crafts, Sports and Entertainment Activities” (C24). The unbalanced distribution of SOEs in China shows that SOEs may not enter the industry randomly. During the development of Chinese SOEs, most SOEs are from high-polluting industries. Because the heavy industry has become the first industry to develop in the 1950s, making SOEs become leaders in these industries. Following the gradual progress of China’s reform and opening up, POEs have gradually developed. However, most POEs entered the light industries instead of heavy industries because SOEs occupy most heavy industries. Consequently, there are significant differences in the distribution of Chinese SOEs and POEs in different industries.
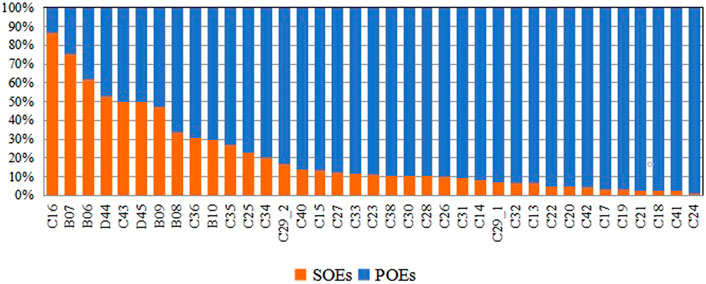
FIGURE 2. Enterprises distribution of 39 industrial sectors in China. Notes: the industry code is shown in Appendix A.
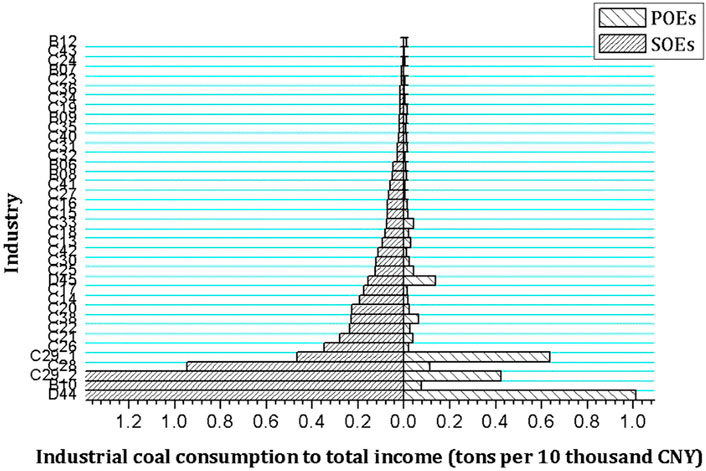
Furthermore, Figure 3 compares the ratio of average industrial coal consumption to total gross turnover between SOEs and POEs in 39 industrial sectors. As shown in Figure 3, the ratio of coal consumption to the gross revenue in SOEs is relatively higher than that in POEs in most sectors except for “Manufacture of Rubber Products” (C29_1). The coal consumption intensity of SOEs is ten times that of POEs in the following sectors: “Mining and Processing of Non-metal Ores” (B10) and “Manufacture of Plastics Products” (C29_2).
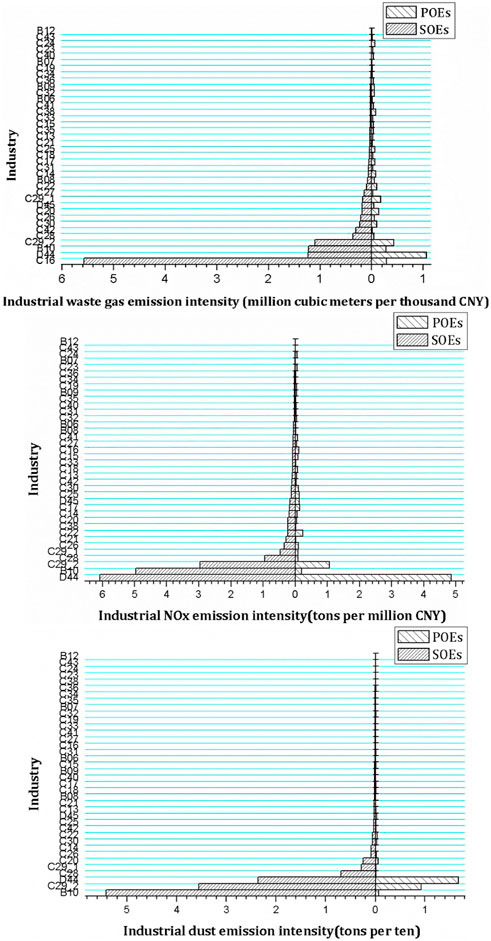
Does the difference in energy consumption between SOEs and POEs cause the divergence in pollution emission? Whether the different industrial distribution causes the gap in pollution emission intensities of SOEs and POEs? To determine whether there are significant differences in environmental behavior between SOEs and POEs in an industry, the research team investigated the average intensities of releasing industrial waste gases (NOx and industrial dust) into the air from SOEs and POEs in 39 industrial sectors. As shown in Figure 4, there are wide variations in the intensities of emitting air pollutants in different industrial sectors. The air pollutant emission intensities in some sectors are incredibly high, such as “Production and Supply of Electric Power and Heat Power” (D44), “Mining and Processing of Non-metal Ores” (B10), and “Manufacture of Plastics Products” (C29_2).
Nevertheless, the air pollutant emission intensities are relatively low in some industries, such as “Printing and Reproduction of Recording Media” (C23), “Manufacture of Articles for Cultural, Educational, Arts and Crafts, Sports and Entertainment Activities” (C24), and “Repair Service of Metal Products, Machinery, and Equipment” (C43). The air pollutant emission intensities of SOEs and POEs indicates even gaping differences in the same sector. 11 industries bear signs of higher waste gas emission intensities in SOEs than in POEs, while 16 lower. Therefore, there are still some differences in the air pollutant emission intensities between SOEs and POEs in spite of not an entirely random industrial distribution of SOEs and POEs in China. However, why do SOEs discharge higher pollution emissions? Does it have something to do with their varying energy efficiencies? That requires the mediation effect test.
5 Results and discussion
5.1 Benchmark regression results
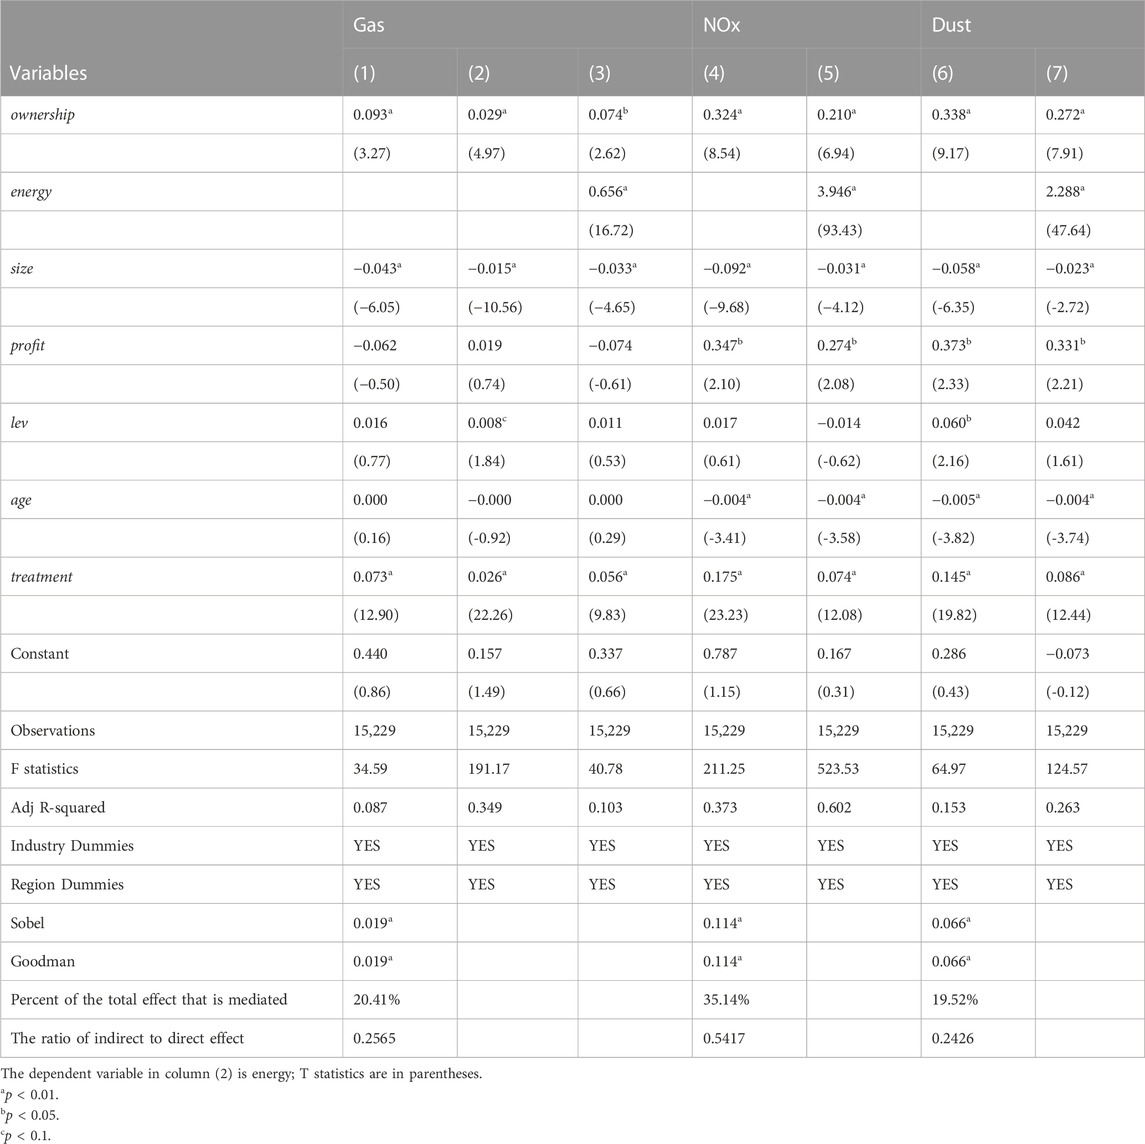
Based on the above research design, the baseline regression results of this paper are shown in Table 2. Columns (1), (2), and (3) showcase the statistical results of fixed OLS regressions, using the industrial waste gas emission intensity to represent environmental pollution, Columns (4) and (5) using industrial NOx, and the last two Columns using industrial dust. The estimation results of empirical Equation 2 are consistent since it does not matter which pollutant is used to characterize environmental pollution, so the estimation results of Equation 2 are reported only in Column (2).
As shown in Table 2, in Columns (1), (4), and (6), ownership has a positive and significant coefficient, suggesting that the pollutant emission intensity in SOEs is higher than that in POEs, and the environmental behavior of the SOEs is worse than that of POEs. In Column (2), when energy is the dependent variable, the regression coefficient of ownership is also significantly positive, indicating that the energy consumption of SOEs is higher than that of POEs and it also shows that the energy efficiency of SOEs is lower. In Column (3), both the estimated coefficients of ownership and energy are significantly positive. Based on the estimation results of Columns (1), (2), and (3), it can be concluded that the pollution emission intensity of SOEs is higher than that of POEs, and energy efficiency plays an important mediating role in the impacts of ownership on pollution emission intensity. Therefore, it is fair to say that SOEs have relatively higher energy consumption that leads to greater pollution emission intensity. The reason why SOEs generate higher pollution emission intensity is that their energy efficiency is low. Similarly, regression results in Columns (4), (5), (6), and (7) are robust where the pollutant emission intensity is represented by either industrial NOx or dust.
The extent to which the energy efficiency mediates the impact of ownership on three pollutants is different. First, as for the relationship between ownership and industrial waste gas emission intensity, the energy efficiency contributes 20.41% to the total mediation effect with the ratio of indirect effect to direct effect at 0.2565. Second, in terms of the relationship between ownership and industrial NOx emission intensity, energy efficiency contributes 35.14% to the total mediation effect with the ratio of indirect effect to direct effect at 0.5417. Last, the energy efficiency contributes 19.52% to the total mediation effect in the relationship between ownership and industrial dust emission intensity, and the indirect-to-direct ratio is 0.2426. It can be seen that the degree of the energy efficiency mediating the relationship between ownership and waste gas intensity is similar to that in the relationship between ownership and dust emission intensity since both of the contribution rates are close to 20%. However, NOx is different from waste gas and dust since its contribution rate of mediation effect is the largest which reaches 35.14%. That shows that when enterprises emit different types of pollutants, compared with waste gas and industrial dust emissions, improving the energy efficiency of enterprises is the most conducive to reducing NOx emissions, especially for SOEs with low energy efficiency.
Besides, research on the control variables brought some valuable findings. Size has a significant and negative coefficient, suggesting that businesses of the larger size normally emit fewer gas pollutants at a lower intensity, so from this point of view, the larger, the better. That may be because large businesses invest more in environmental treatment that enjoys a scale effect. Air pollution treatment facilities, such as desulfurization and denitration units, can generate larger output and bring a greater total amount of pollution treatment, yet with lower costs. Therefore, large businesses have more cost-effective environmental treatment, which is consistent with the conclusions of many studies (e.g., (Arora and Cason, 1995; Hamilton, 1995; Lei et al., 2017)). In Columns (4), (5), (6), and (7), profit has a significant and positive coefficient, suggesting that businesses with higher profit rates have higher pollution emission intensity. The reason may be that businesses with higher profit rates are generally in the initial or growth stage of their life cycle when the top priority is to occupy the market. Compared with this, it is not essential to fulfill social responsibilities, such as environmental protection. In Columns (2) and (6), lev has a significant and positive coefficient, indicating that the higher the proportion of debt to total assets, the greater the pollution emission intensity. Therefore, increasing the proportion of debt is not conducive to the improvement of environmental behavior. Except for Columns (1), (2), and (3), age has a significant and negative coefficient, suggesting that older enterprises have relatively low pollution emission intensity, and the environmental behavior of newly-established enterprises is poor. Finally, treatment always has a significant and positive coefficient since huge environmental treatment costs often accompany high pollution emission intensity.
5.2 Industries with different levels of pollution
There are some differences between the environmental behavior of enterprises in high-polluting industries and that of enterprises in low-polluting industries. To investigate the different mediation effects in these two industries, the researchers split the whole sample into high-polluting industries and low-polluting ones. According to the “Guidelines for Environmental Information Disclosure of Listed Enterprises” issued by the MEP, the high-polluting industries include six industries: “Electric Power Thermal Production and Supply Industry”, “Ferrous Metal Smelting and Calendering Industry”, “Non-metallic Mineral Products Industry”, “Non-ferrous Metal Smelting and Calendering Industry”, “Chemical Raw Materials and Chemical Products Manufacturing Industry” and “Petroleum Processing, Coking, and Nuclear Fuel Processing Industry”. The rest 33 industries are low-polluting. In 2013, the above six heavy-polluting industries released 90% of all industrial waste gas emission approximately.
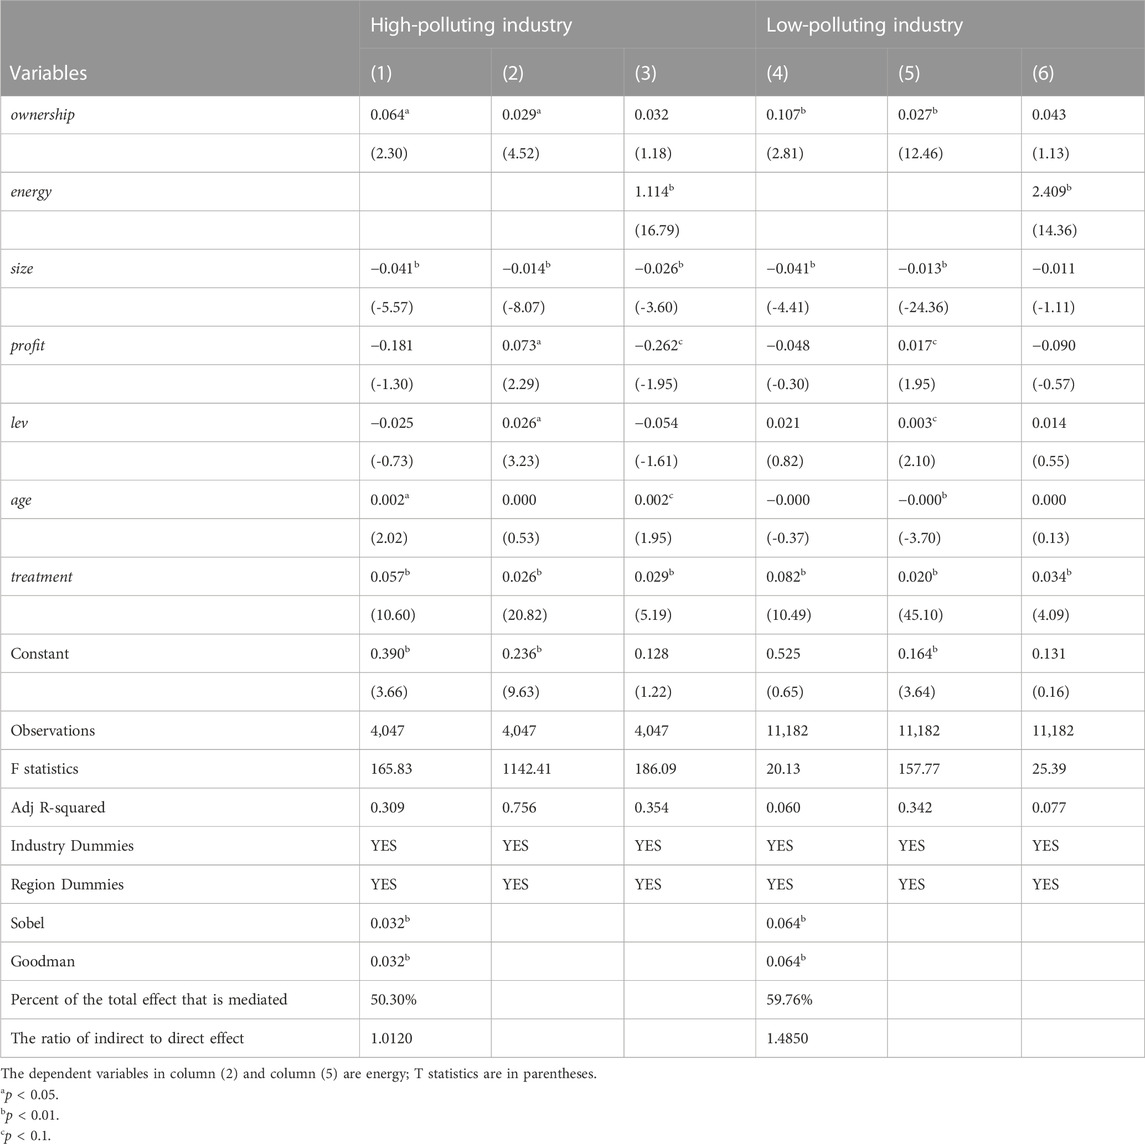
The regression results for high-polluting industries and low-polluting industries are presented separately in Table 3. The regressions for high-polluting industries are in Columns (1), (2), and (3), and the regressions for low-polluting industries are in Columns (4), (5), and (6). In every column in Table 3, environmental pollution is represented by industrial waste gas emission intensity. As shown in Table 3, in Columns (1) and (4), ownership has a positive and significant coefficient, suggesting that the waste gas emission intensity of SOEs is higher, and the environmental behavior of POEs is better in both high-polluting and low-polluting industries. In Column (2) and (5), the regression coefficients of ownership are also significantly positive, which fully shows the energy efficiency of SOEs is lower than that of POEs in both high-polluting and low-polluting industries. In Column (2) and (5), the regression coefficients of ownership are also significantly positive, which fully shows the energy efficiency of SOEs is lower than that of POEs in both high-polluting and low-polluting industries. At the same time, combined with the regression results in columns (3) and (6), it is verified that the mediating role of energy efficiency is significantly established in both high-polluting and low-polluting industries, with a 50.30% mediation effect in the high-polluting industries and 59.76% in the low-polluting industries. And whether it is a high-polluting industry or a low-polluting industry, the contribution rate of mediation effect has both exceeded its contribution rate of the direct effect according to the regression results.
These empirical results illustrate two findings: First, the mediating role of energy efficiency cannot be ignored in both high-polluting and low-polluting industries. An in-depth analysis of energy efficiency is essential for comparing enterprises’ environmental behavior with the different ownership structures. Second, the less polluted the industry, the greater the mediation effect of energy efficiency. For this reason, to achieve the goal of pollution treatment in the low-polluting industries, more efforts should be devoted from the perspective of energy, such as improving the efficiency of energy use and optimizing the structure of energy consumption.
5.3 Regions with different economic growth pressures
An increasing number of studies have found that the relationship between the government and enterprises is very delicate, especially in developing countries like China. To pursue the growth of local economies, the local government may relax environmental regulation on local businesses, especially SOEs. Similarly, POEs are normally willing to benefit from relaxed environmental regulation policies by building political connections. In this way, the local government and the regulated enterprises may form a certain balance where each side satisfies its own needs through political connections, but the balanced consequences may deteriorate environmental performance.
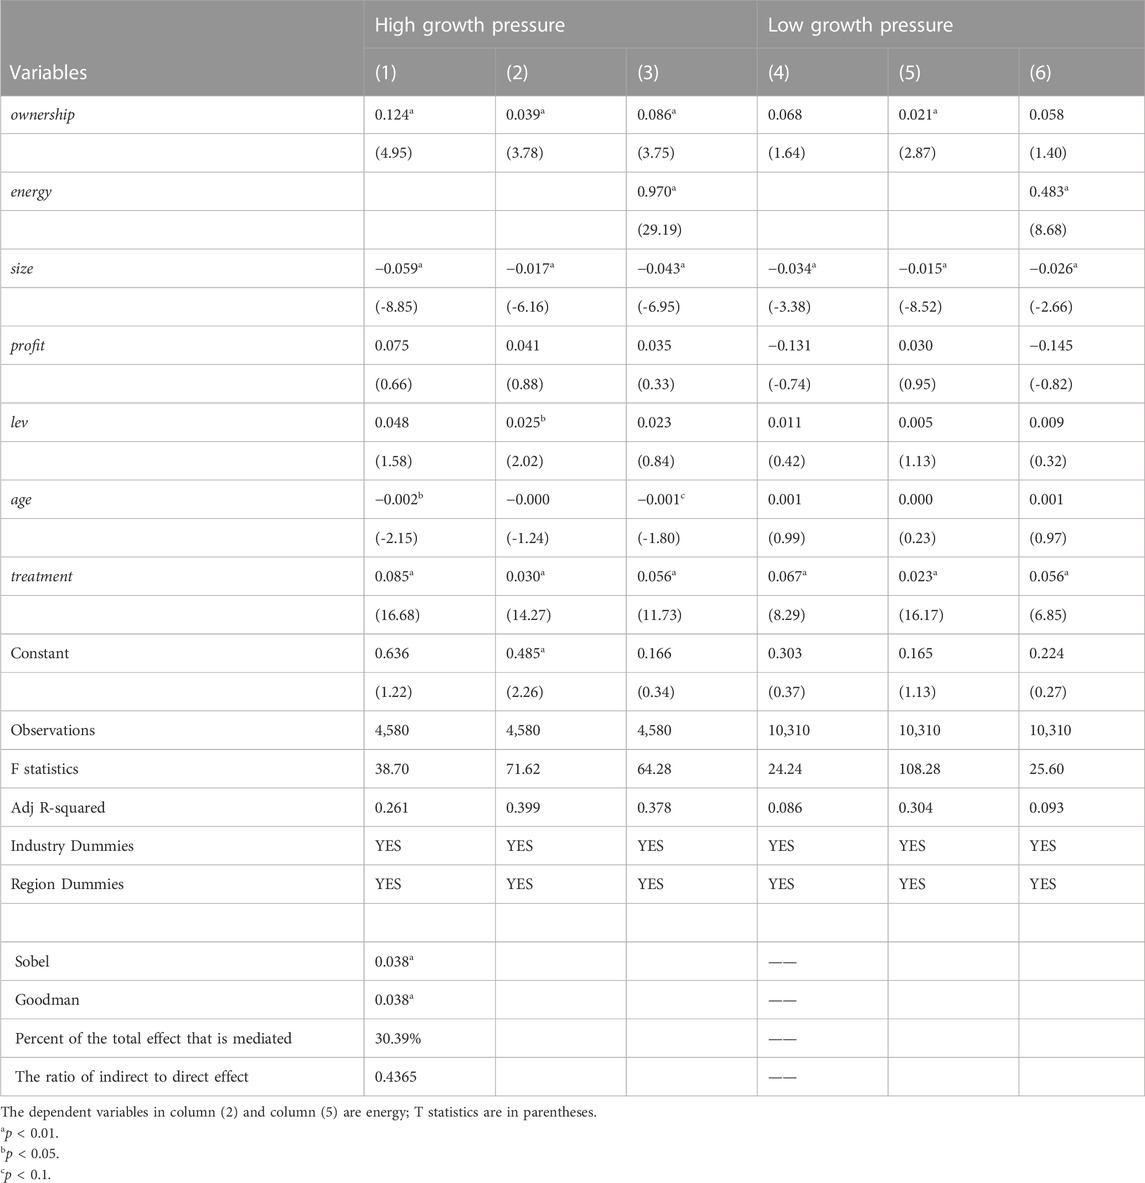
Therefore, the lower the level of economic development and the greater the pressures of growth, the more the local government tends to pursue economic growth instead of environmental protection. To analyze whether the relationship between ownership and environmental pollution is different under different growth pressures and whether the mediating effect of energy efficiency is still valid, the researchers divided the samples into two groups: a high growth pressure group and a low growth pressure group. First and foremost, the city where each sample business is located is identified. Then, the research team calculated the GDP growth rate of each sample city according to the “China Urban Statistics Yearbook” in 2013. As a result, if the city’s GDP growth rate is lower than the average of the province where it locates, the growth pressure is considered to be high; otherwise, the growth pressure is not considered as high. Finally, the regressions for Eqs. 1–3 are repeated.
The regression results of the high growth pressure group and the low growth pressure group are presented in Table 4 respectively. The regressions of high growth pressure samples are in Columns (1), (2), and (3), and the regressions for low growth pressure samples are in Columns (4), (5), and (6). Also. in every column in Table 4, the environmental pollution is represented by industrial waste gas emission intensity. Firstly, as shown in Column (1) in Table 4, ownership has a positive and significant coefficient, but in Column (4), the estimated coefficient of ownership is not significant. Thus, in the cities with high growth pressure, SOEs’ pollutant emission intensity is more than that of POEs. Conversely, there is no noticeable difference in the pollutant emission intensity between SOEs and POEs in the cities with low growth pressure. This may be on account that the local government is more likely to first relax environmental regulations on SOEs in cities with high growth pressure, leading to increased pollutant emission intensity and deterioration of SOEs’ environmental behavior. In cities with little growth pressure, it is not necessary for the local governments to relax environmental regulations to boost the economy. The environmental behavior of SOEs and POEs depends mainly on their characteristics. If it is assumed that the characteristics of enterprises are distributed randomly, then the environmental behavior of SOEs and POEs should be similar. Besides, from the regression results in columns (1) to (4), it can be seen that the mediating effect of energy efficiency is more significant in cities with high growth pressure, but not significant in cities with low growth pressure. The reason may be that, for cities with low growth pressure, since the economic growth pressure itself is low, and there is not enough motivation to further develop the economy, so the environmental pollution problems accompanying economic growth are also less. At this time, there is no obvious difference in the pollution emission intensity of SOEs and POEs, which further leads to the insignificant mediating effect of energy efficiency.
5.4 Robustness tests
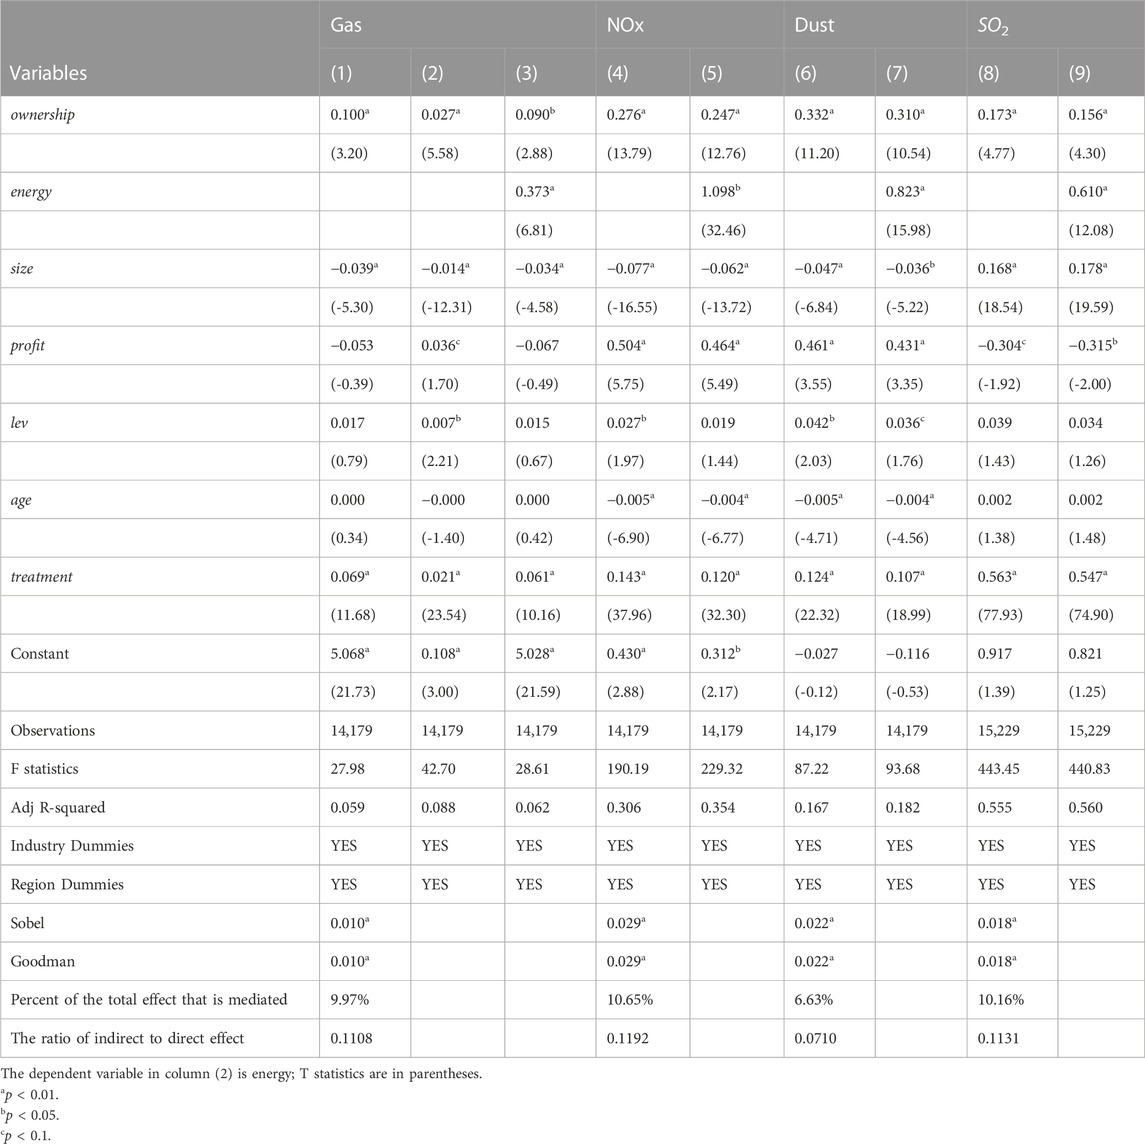
To ensure the robustness of the regression results, the research team also carried out the following robustness tests, the test results are shown in Table 5. On the one hand, we only retain the manufacturing industry sample and re-estimate the mediation effect model in columns (1)–(7). Columns (1), (2), and (3) use industrial waste gas emission intensity to represent pollu, columns (4) and (5) using industrial NOx, and columns (6) and (7) using industrial dust. The results illustrate that the regression results hardly changed. On the other hand, the industrial SO2 emission intensity is used to characterize the pollution emission intensity, and the mediation effect model is tested repeatedly. The regression results are shown in columns (8) and (9). Similarly, the results are still robust.
6 Conclusion and policy implications
Enterprises with different ownership structures have varying goals, decision-making methods, and risk attitudes, therefore conducting different environmental behaviors (Meyer and Pac, 2013; Li and Chan, 2016; Clò et al., 2017). Will POEs pay more attention to economic profits and undermine environmental responsibility, thus exacerbating environmental pollution? Will SOEs pay more attention to environmental protection and strengthen social responsibility to reduce environmental pollution? Behind the differentiated environmental behavior of enterprises with different ownership types, what factors play a key role? The answers to these questions will help people understand the environmental behavior and environmental performance of different ownership enterprises and provide some references for the formulation of differentiated environmental policies.
This study explores the impact of ownership on pollution emission intensity with the adoption of micro-data of Chinese industrial enterprises. From the perspective of energy efficiency, the mechanism of ownership affecting pollution emissions is investigated further. Besides, the different mediation effects are compared in high and low-polluting industries and high and low-growth pressure cities. The findings show that the pollution emission intensity of SOEs, including industrial waste gas, NOx and dust emission intensity, is significantly higher than that of POEs. The underlying reason is the low energy efficiency of SOEs, and energy efficiency plays an important mediating role in the relationship between ownership and pollution emissions. Compared with industrial waste gas and dust emissions, energy efficiency plays the largest mediating effect between ownership and NOx emissions. Additionally, in both high-polluting and low-polluting industries, SOEs’ pollutant emission intensity is higher than that of POEs, however, the mediation effect of energy efficiency is greater in low-polluting industries. In cities with high growth pressure, SOEs’ pollutant emission intensity is higher than that of POEs. On the contrary, there are no noticeable differences in pollutant emission intensity between SOEs and POEs in cities with low growth pressure. But the mediation effect of energy efficiency is more significant in cities with high growth pressure.
The conclusions of this study provide a theoretical basis and policy inspiration for developing countries to formulate environmental policies for industrial enterprises. Firstly, the pollutant emission intensity of SOEs is higher than that of POEs, which indicates that more attention should be paid to SOEs in the formulation of environmental policies. So, we should strengthen the constraints and improve the environmental performance of SOEs, including strengthening budget constraints, optimizing energy consumption structures, improving energy consumption efficiency, and promoting the upgrading of production technology. Secondly, the mechanism of “ownership-energy-pollution” shows that energy efficiency plays an important role in enterprises’ environmental governance, especially for SOEs. Therefore, on the one hand, enterprises should optimize the way of energy utilization, transform environmental governance from end-to-end management to source prevention and control, and minimize the unnecessary consumption of energy. On the other hand, enterprises should actively introduce foreign capital and learn from the excellent production technology and management methods of foreign-funded enterprises in energy production and utilization so as to improve energy efficiency. Finally, the focuses of concern should be not only industrial enterprises but also the local government. Empirical studies show that when local governments face growth pressures, SOEs are likely to become tools to relieve growth pressures at the cost of environmental protection. Therefore, the central government should optimize the development concepts of local governments, continuously strengthen the importance of environmental protection, and provide appropriate policies and financial support in environmental protection to achieve a balance between economic growth and environmental protection.
However, this paper still has some limitations. The dataset used in this study consists of cross-industrial data because of data restrictions, making it impossible to explore more mechanisms between ownership and environmental pollution through dynamic methods. In addition, there are other potential factors, other than energy efficiency, such as soft budget constraints and differential law enforcement by the local government, that may mediate the relationship between ownership and pollution. This will be a horizon for future studies to scale.
Data availability statement
Publicly available datasets were analyzed in this study. This data can be found here: The data source is the “China Statistical Yearbook on Environment 2016” complied by China’s NBS and MEP. Since 2017, the relevant data on sources of pollution emissions have not been released, so these are the latest data available.
Author contributions
YL wrote this article and did the empirical analysis. YZ and BC contributed to the data analysis. CM and YM modified the language of the article. All authors contributed to the article and approved the submitted version.
Funding
We thank the financial supports provided by the Project Social Science Foundation of Jiangsu Province (Grant No.22EYC001), the National Natural Science Foundation of China (Grant No. 72003131) and MOE (Ministry of Education in China) Project of Humanities and Social Sciences (Grant No. 20YJA790009).
Conflict of interest
The authors declare that the research was conducted in the absence of any commercial or financial relationships that could be construed as a potential conflict of interest.
Publisher’s note
All claims expressed in this article are solely those of the authors and do not necessarily represent those of their affiliated organizations, or those of the publisher, the editors and the reviewers. Any product that may be evaluated in this article, or claim that may be made by its manufacturer, is not guaranteed or endorsed by the publisher.
Footnotes
1The data source is the “China Statistical Yearbook on Environment 2016” complied by China’s NBS and MEP. Since 2017, the relevant data on sources of pollution emissions have not been released, so these are the latest data available.
2The data source is the “China Statistical Yearbook on Environment 2016” complied by China’s NBS and MEP. Since 2017, the relevant data on sources of pollution emissions have not been released, so these are the latest data available.
3According to the “China Energy Statistical Yearbook”, the conversion coefficient of raw coals is 0.7143, that of fuel oil is 1.4286, and that of natural gas is 12.143 tons per 10,000 cubic meters.
References
Andersson, F. N., Opper, S., and Khalid, U. (2018). Are capitalists green? Firm ownership and provincial CO2 emissions in China. Energy Policy 123, 349–359. doi:10.1016/j.enpol.2018.08.045
Arora, S., and Cason, T. N. (1995). An experiment in voluntary environmental regulation: Participation in epa’s 33/50 program. J. Environ. Econ. Manag. 28, 271–286. doi:10.1006/jeem.1995.1018
Baron, R. M., and Kenny, D. A. (1986). The moderator–mediator variable distinction in social psychological research: Conceptual, strategic, and statistical considerations. J. personality Soc. Psychol. 51, 1173–1182. doi:10.1037/0022-3514.51.6.1173
Berrone, P., Cruz, C., Gomez-Mejia, L. R., and Larraza-Kintana, M. (2010). Socioemotional wealth and corporate responses to institutional pressures: Do family-controlled firms pollute less? Adm. Sci. Q. 55, 82–113. doi:10.2189/asqu.2010.55.1.82
Calza, F., Profumo, G., and Tutore, I. (2016). Corporate ownership and environmental proactivity. Bus. Strategy Environ. 25, 369–389. doi:10.1002/bse.1873
Calza, F., Profumo, G., and Tutore, I. (2013). Does corporate ownership structure affect firms’ environmental performance? Evidence in the European energy industry. Int. J. Glob. Small Bus. 5, 58–77. doi:10.1504/ijgsb.2013.050487
Clò, S., Ferraris, M., and Florio, M. (2017). Ownership and environmental regulation: Evidence from the European electricity industry. Energy Econ. 61, 298–312. doi:10.1016/j.eneco.2016.12.001
Craig, J., and Dibrell, C. (2006). The natural environment, innovation, and firm performance: A comparative study. Fam. Bus. Rev. 19, 275–288. doi:10.1111/j.1741-6248.2006.00075.x
Earnhart, D., and Lizal, L. (2006). Effects of ownership and financial performance on corporate environmental performance. J. Comp. Econ. 34, 111–129. doi:10.1016/j.jce.2005.11.007
Hamilton, J. T. (1995). Pollution as news: Media and stock market reactions to the toxics release inventory data. J. Environ. Econ. Manag. 28, 98–113. doi:10.1006/jeem.1995.1007
Huang, C.-H., and Chang, H.-F. (2019). Ownership and environmental pollution: Firm-level evidence in China. Asia Pac. Manag. Rev. 24, 37–43. doi:10.1016/j.apmrv.2018.09.002
Huang, Z., Li, L., Ma, G., and Xu, L. C. (2017). Hayek, local information, and commanding heights: Decentralizing state-owned enterprises in China. Am. Econ. Rev. 107, 2455–2478. doi:10.1257/aer.20150592
Jefferson, G., Albert, G., Xiaojing, G., and Xiaoyun, Y. (2003). Ownership, performance, and innovation in China’s large-and medium-size industrial enterprise sector. China Econ. Rev. 14, 89–113. doi:10.1016/s1043-951x(03)00003-8
Judd, C. M., and Kenny, D. A. (1981). Process analysis: Estimating mediation in treatment evaluations. Eval. Rev. 5, 602–619. doi:10.1177/0193841x8100500502
Lei, P., Tian, X., Huang, Q., and He, D. (2017). Firm size, government capacity, and regional environmental regulation: Theoretical analysis and empirical evidence from China. J. Clean. Prod. 164, 524–533. doi:10.1016/j.jclepro.2017.06.166
Li, X., and Chan, C. G.-W. (2016). Who pollutes? Ownership type and environmental performance of Chinese firms. J. Contemp. China 25, 248–263. doi:10.1080/10670564.2015.1075718
Lin, B., and Long, H. (2015). A stochastic frontier analysis of energy efficiency of China’s chemical industry. J. Clean. Prod. 87, 235–244. doi:10.1016/j.jclepro.2014.08.104
Lin, B., and Wang, X. (2014). Exploring energy efficiency in China’ s iron and steel industry: A stochastic frontier approach. Energy Policy 72, 87–96. doi:10.1016/j.enpol.2014.04.043
Liu, M., Shadbegian, R., and Zhang, B. (2017). Does environmental regulation affect labor demand in China? Evidence from the textile printing and dyeing industry. J. Environ. Econ. Manag. 86, 277–294. doi:10.1016/j.jeem.2017.05.008
Lyubich, E., Shapiro, J. S., and Walker, R. (2018). Regulating mismeasured pollution: Implications of firm heterogeneity for environmental policy. AEA Pap. Proc. 108, 136–142. doi:10.3386/w24228
MacKinnon, D. P., Krull, J. L., and Lockwood, C. M. (2000). Equivalence of the mediation, confounding and suppression effect. Prev. Sci. 1, 173–181. doi:10.1023/a:1026595011371
Meyer, A., and Pac, G. (2013). Environmental performance of state-owned and privatized eastern European energy utilities. Energy Econ. 36, 205–214. doi:10.1016/j.eneco.2012.08.019
Wang, H., and Jin, Y. (2007). Industrial ownership and environmental performance: Evidence from China. Environ. Resour. Econ. 36, 255–273. doi:10.1007/s10640-006-9027-x
Wang, H., Mamingi, N., Laplante, B., and Dasgupta, S. (2003). Incomplete enforcement of pollution regulation: Bargaining power of Chinese factories. Environ. Resour. Econ. 24, 245–262. doi:10.1023/a:1022936506398
Wang, Q., and Yuan, B. (2018). Air pollution control intensity and ecological total-factor energy efficiency: The moderating effect of ownership structure. J. Clean. Prod. 186, 373–387. doi:10.1016/j.jclepro.2018.03.106
Wang, Z., and Dear, K. (2017). Region and firm level determinants of environmental regulation violations: An empirical study in chongqing, China. J. Clean. Prod. 141, 1011–1022. doi:10.1016/j.jclepro.2016.09.090
Appendix A
Keywords: ownership, environmental performance, energy efficiency, mediation effect model, air pollution
Citation: Le Y, Zhang Y, Chen B, Meng C and Ma Y (2023) Ownership structure and air pollution: The mediation effect of energy efficiency. Front. Environ. Sci. 11:1122924. doi: 10.3389/fenvs.2023.1122924
Received: 13 December 2022; Accepted: 28 February 2023;
Published: 09 March 2023.
Edited by:
Xin Deng, Sichuan Agricultural University, ChinaReviewed by:
Lu Xiao, Jiangsu University, ChinaShah Fahad, Leshan Normal University, China
Russell Pittman, United States Department of Justice, United States
Copyright © 2023 Le, Zhang, Chen, Meng and Ma. This is an open-access article distributed under the terms of the Creative Commons Attribution License (CC BY). The use, distribution or reproduction in other forums is permitted, provided the original author(s) and the copyright owner(s) are credited and that the original publication in this journal is cited, in accordance with accepted academic practice. No use, distribution or reproduction is permitted which does not comply with these terms.
*Correspondence: Bo Chen, Y2hlbmJvMDcwOUAxMjYuY29t
 Yang Le
 Yifei Zhang
 Bo Chen2*
 Chunyun Meng
 Yinghui Ma