 Shuxing Xu
 Juanle Wang
 Ochir Altansukh4
- 1State Key Laboratory of Resources and Environmental Information System, Institute of Geographic Sciences and Natural Resources Research, Chinese Academy of Sciences, Beijing, China
- 2College of Resources and Environment, University of Chinese Academy of Sciences, Beijing, China
- 3Jiangsu Center for Collaborative Innovation in Geographical Information Resource Development and Application, Nanjing, China
- 4Environmental Engineering Laboratory, Department of Environment and Forest Engineering, National University of Mongolia, Ulaanbaatar, Mongolia
- 5Institute for Sustainable Development, National University of Mongolia, Ulaanbaatar, Mongolia
Land degradation is the most serious environmental challenge in the Mongolian Plateau, an important arid and semiarid region east of the Eurasian continent. The Selenge River Basin is not only the main catchment area of Baikal Lake, the largest fresh water lake, but also the main concentration area of agriculture and animal husbandry in Mongolia. Under the common influence of global warming and human activities, desertification has become more prominent in this basin, threatening the ecological security and sustainable development of the Mongolian Plateau. In this study, we selected NDVI, Modified Soil Adjusted Vegetation Index, topsoil grain size index and Albedo as feature space indicators, and retrieved the desertification process from 1990 to 2020 in the Selenge River Basin of Mongolia based on a novel feature space monitoring index. A 30-m resolution desertification map of the Selenge River Basin was retrieved based on optimal feature space models for 1990, 1995, 2000, 2005, 2010, 2015, and 2020. Then, the spatial-temporal dynamic changes and driving mechanism of desertification. The results show that: 1) Compared with the other four feature space models, the point-to-line Albedo-MSAVI feature space model has the highest recognition accuracy of 84.89% for desertification in the basin. 2) The desertification level of the Selenge River basin is mainly low and medium on the whole, the high desertification is mainly located in BULGAN and HOVSGOL provinces in the middle-upper reaches of the basin, and the severe desertification is mainly located in TOV province and Ulaanbaatar in the middle-lower reaches of the basin. 3) From 1990–2020, desertification degree in the Selenge River Basin has further deteriorated, and the area of high and serve desertified land has expanded significantly. Within the stage, 1990–2015 was a period of rapid increase in desertification. However, from 2015–2020, recovery takes the dominant position. The regions with high conversion frequency of desertification degree are mainly concentrated in the central and southeastern of the Selenge River basin. The joint effects of large fluctuations in temperature, overgrazing and population migration aggravate the desertification degree in this region. The research results can provide the desertification retrieving method recommendation and land degradation nutrition measures decision support in the Selenge River Basin and the whole Mongolian Plateau.
1 Introduction
Desertification refers to land degradation in arid, semi-arid, and dry sub-humid areas caused by various factors, such as climate change and human activities (UNCCD, 1994), usually leading to a reduction in biodiversity, soil fertility, and even the loss of ecological carrying capacity (Oh et al., 2005; van den Elsen and Jetten, 2015). The Selenge River Basin, as the main water source of Lake Baikal, is a sensitive area for global change and is a key area in Mongolian Plateau. The ecological environment pattern in this region is complex and diverse. Under the joint effects of global warming and irrational human activities such as overgrazing, species richness and above-ground biomass is decreasing in the Selenge River Basin (Zorigt et al., 2019), and the problem of desertification in this region is becoming increasingly serious. More than 72% of Mongolia’s land was affected by desertification, and the scope of desertification continued to expand (Ministry of Natural Environment and Tourism of Mongolia, 2007). Approximately 90% of the land is facing desertification risks in the future (Wang et al., 2020). Therefore, there is an urgent need to monitor the status and evolution of desertification, which has great scientific and practical significance for the decision of desertification control strategies in the local Selenge River Basin and whole Mongolian Plateau.
The fine-resolution desertification distribution data are the basis for desertification pattern analysis and combatting measures decision. In recent years, remote sensing has provided an important means for monitoring desertification at different temporal and spatial scales (Ajaj et al., 2017; Liang et al., 2021; Li et al., 2022; Yue et al., 2023). The main methods for remote sensing monitoring desertification are remote sensing visual interpretation and the desertification index retrieving methods. Wei et al. (2007) carried out dynamic monitoring of land desertification in Minqin County, west China, through visual interpretation of satellite images combined with field investigation. Xue et al. (2013) evaluated the evolution of aeolian desertification in the northwestern Shanxi Province of Northern China from 1975 to 2010 by visually interpreting Landsat MSS and TM images. Qiu. (2008) established interpretation markers of different desertification landscapes using multi-period Landsat TM and China-Brazil Earth Resource Satellite data, and evaluated the desertification status of Maowusu Sandy Land in the Loess Plateau using a supervised classification model. Visual interpretation has relatively high accuracy, but it requires a lot of manpower and time; therefore, it is only suitable for small areas and cannot meet the needs of desertification monitoring in large regions (Duan et al., 2019).
Facing large-scale applications, the index retrieving method is the main way of long-term desertification monitoring at present. Desertification is expressed on remote sensing images as the enhancement of bare land information and the weakening of vegetation information. The surface albedo (Albedo), vegetation index (VI) and topsoil grain size index (TGSI) obtained from remote sensing inversion can be used as typical indicators to characterize the degree of desertification. VI can reflect the spatial distribution intensity of above-ground plants and indicate the growth status of plants. Albedo determines the amount of radiation absorbed by the subsurface, and its variation is influenced by vegetation cover, moisture and other factors. TGSI reflects the texture of topsoil and the size of soil surface particles. With the increase of desertification, the surface vegetation is severely damaged, the surface biomass is reduced, the surface soil roughness decreases, which leads to the increase of surface albedo, which is expressed in the remote sensing image as the VI decreases, the Albedo increases and the TGSI increases. Guo et al. (2021) used vegetation coverage to classify the desertification grade in the Mongolian Plateau. Liu et al. (2018) applied the TGSI to evaluate the desertification degree based on MODIS images in Mongolian plateau. Zeng et al. (2007) constructed an Albedo-NDVI feature space model to identify the desertification degree in the Yellow River source area. However, desertification is caused by the joint actions of natural factors and human activity (Li et al., 2012; Wang et al., 2020; Guo et al., 2021; 2022), the method of extracting desertification information by considering only one set of combination indicators, such as NDVI and Albedo, cannot better identify the desertification information and tend to obtain low accuracy (Wei et al., 2018).
In recent years, feature space model that consider the interactions between a couple of desertification indicators can effectively distinguish between different degrees of desertification land. Firstly, only NDVI and Albedo is considered, ignores important surface factors, such as soil information, leading to a low accuracy of classification results (Wei et al., 2018). Huete (1988) introduced MSAVI to monitor the desertification degree to avoid the impacts of soil background. Wu et al. (2019) established the Albedo-MSAVI spatial model for quantitative monitoring of desertification in semi-arid grasslands. Then, multi couples of features are used for desertification reversion. Wei et al. (2018) constructed three feature space models, Albedo-NDVI, Albedo-MSAVI, and Albedo-TGSI, and obtained adaptation conditions in northwestern Mongolia. These progress shows that the feature space model is feasible for desertification retrieving in local areas. Owing to the differences in the geographical environments in different regions, selecting feature space indicators and the construction method of the desertification index is crucial.
This study aims to construct an optimal feature space model for the long-term rapid monitoring of desertification in the Selenge River Basin and to understand the dynamic changes of desertification over the past 30 years. Based on Landsat images from 1990 to 2020, a 30-m resolution desertification map in the Selenge River Basin will be obtained for every 5 years. The desertification evolution trends will be discovered in this rich natural resources region and its driving mechanism will be discussed as well Materials and methods.
1.1 Study areas
The Selenge River originates from the northern slope of the Khan Gai Mountain in Mongolia, with a total length of 1,024 km and a drainage area of 447,060 km2, accounting for 82% of the drainage area of Baikal Lake. It is the largest tributary of Baikal Lake in northern Mongolia and Russia. This study selected the Selenge River basin in Mongolia, covering the capital city of Ulaanbaatar and 12 provinces (Figure 1). The climate in the middle and upper reaches of the Selenge River Basin is mild and humid, while the climate in the middle and lower reaches is dry and low-temperature (Dawasuren, 2018). This basin is the main agricultural and animal husbandry area in Mongolia. More than 60% of Mongolian agricultural products are produced in the Selenge River basin. By 2020, livestock in this basin accounted for 58% of Mongolia’s animal population. People population accounted for approximately 79% of the total population of Mongolia (Ren et al., 2022).
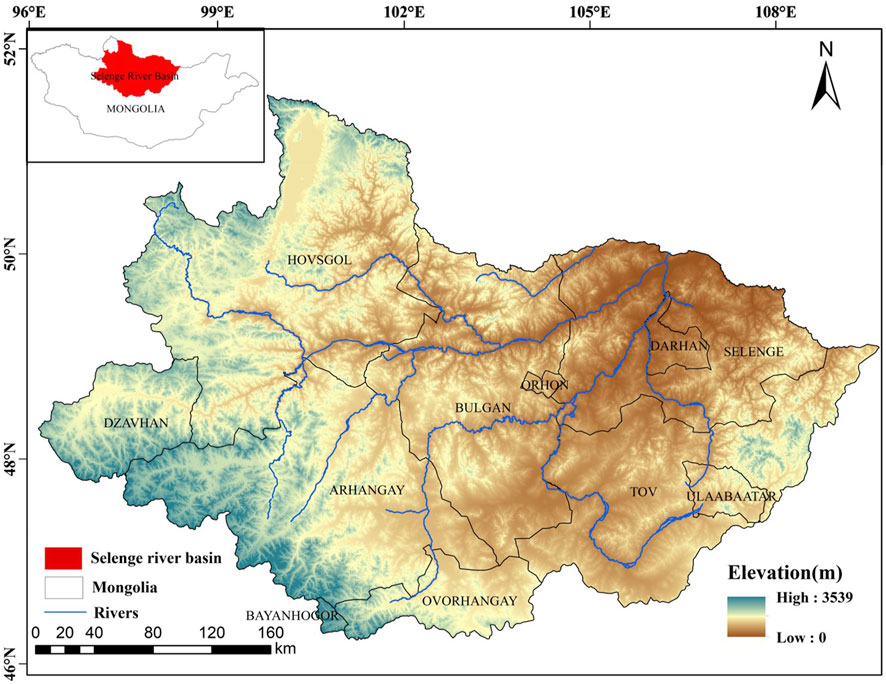
FIGURE 1. Geographic location of the study area.
1.2 Data sources
Landsat images with a spatial resolution of 30 m were selected since 1990, which is the beginning of the transformer of social and economic system of Mongolia followed by the collapse of former-Soviet Union. In order to capture the dynamic features of the desertification change trends, every 5 years images were selected for desertification retrieving. This interval is coupled with most of the global or continental scale land use and land cover datasets in the world, such as GLC_FCS30(Zhang et al., 2021)and FROM-GLC (Gong et al., 2013). Because images in the growing season can reflect the biological and physical parameters relatively clearly, such as NDVI, MSAVI. Thus, landsat images were used to identify desertification information and analyze spatiotemporal pattern changes from June to September of 1990(Landsat 5), 1995(Landsat 5), 2000(Landsat 7), 2005(Landsat 7), 2010(Landsat 7), 2015 and 2020(Landsat 8). Landsat data were provided by the Google Earth Engine (GEE) platform. Supported by GEE, image cloud removal, mosaic, and clipping were completed, and seven cloud-free high-quality images covering the entire basin were obtained.
In order to avoiding water bodies and urban construction areas are misclassified as desertified areas, the Joint Research Centre’s Global Surface Water Dataset (Pekel et al., 2016) and an artificial impervious surface dataset (Li et al., 2020) were used to exclude water bodies and urban construction areas. The above images were taken from the open dataset provided by the GEE platform as well.
The accuracy validation data is mainly from high-resolution Google Earth images and fieldwork data in 2015, with a total of 128 validation points. The measured record of the field points included the longitude, latitude, vegetation cover, surface albedo, and topsoil grain size information. Temperature, precipitation, livestock load and population data are collected from the Mongolia Statistics website (http://1212.mn/).
1.3 Materials and methods
1.3.1 The desertification classification in the Selenge River Basin of Mongolia
The desertification classification criteria usually was divided into five levels: non, low, medium, high, and severe desertification (Han et al., 2010; Lamchin et al., 2017; Jiang et al., 2019). In Mongolian Plateau study, we also took this classification standard, i.e., dividing them into five levels (Table 1). Based on the five desertification indices obtained from the inversion of different feature spaces, the Jenks Natural Break method was used to divide them into five categories. This dividing method effectively aggregates similar classes and maximizes the differences between classes, and automatically selects the classification situation with the minimum variance values, so as to obtain the optimal classification result.
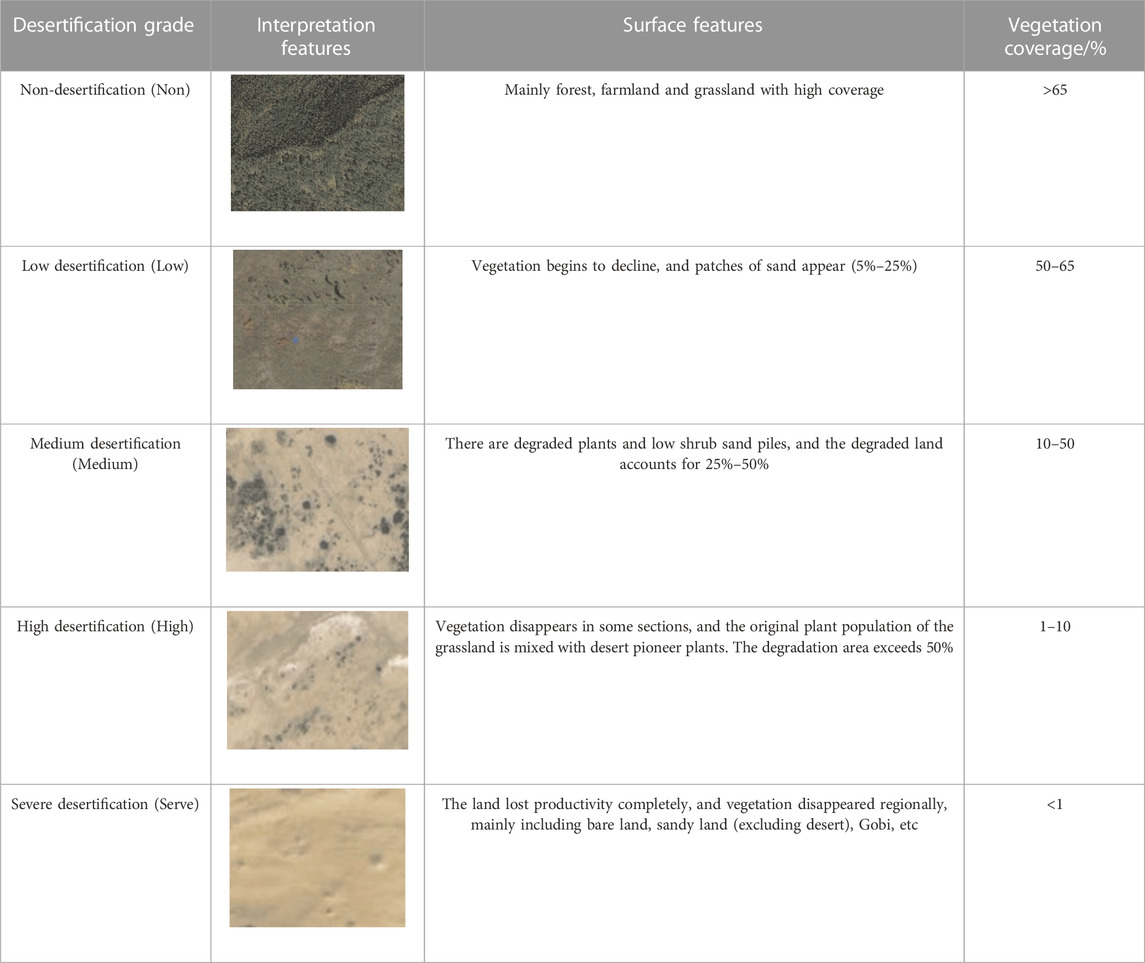
TABLE 1. Classification standard of desertification.
1.3.2 The principle of feature space
Feature space method is used to monitoringdesertification in this study. The feature space division method is determined by the distribution of two typical surface parameters in 2D space. Long-term research has shown that vegetation coverage, surface albedo, and surface soil particle size are three typical indicators for evaluating desertification. The normalized vegetation index can reflect the spatial distribution intensity of aboveground plants indicating the growth status of plants. The amount of aboveground vegetation decreased, and the normalized vegetation index decreased, indicating that the degree of desertification intensified. However, owing to the great influence of soil background, NDVI cannot adequately represent the vegetation status in sparsely vegetated areas. Therefore, the Modified Soil Adjusted Vegetation Index (MSAVI) was introduced to eliminate the impact of soil and vegetation canopy background. The surface albedo determines the amount of radiation absorbed by the underlying surface. The albedo increases with the intensification of desertification, resulting in a reduction in surface water and surface roughness. In addition, owing to the different degrees of desertification, there are different topsoil properties. A more serious desertification corresponds to a coarser surface soil particle composition. Taking the Albedo-NDVI feature space as an example, a large number of studies have shown that Albedo and NDVI are significantly negatively correlated. As shown in Figure 2, the upper boundary line AD refers to the high-albedo line, representing the maximum albedo under certain vegetation coverage. The lower boundary BC line refers to the low line of albedo, reducing the minimum value of albedo for a given vegetation.
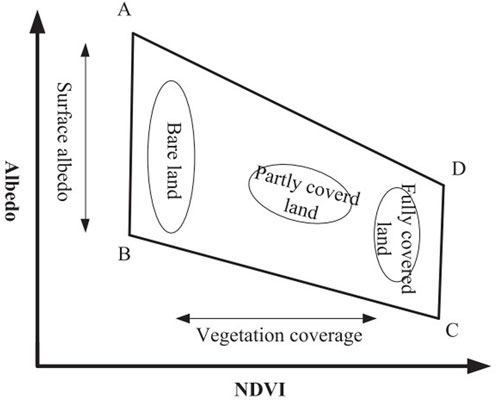
FIGURE 2. Principle of feature space (Taking Albedo-NDVI as an example).
1.3.3 Selection of feature space index
In this study, NDVI, MSAVI, Albedo, and TGSI were selected as the feature space indicators for desertification inversion in the Selenge River Basin. Each feature space indicator was calculated based on the GEE platform. The calculation formulas are shown as follows: NDVI = (BNIR − BRED)/(BNIR+BRED)
where
1.3.4 Construction of feature space model
According to four typical desertification indicators, NDVI, MSAVI, Albedo, and TGSI, five desertification inversion feature spaces (Figure 3) were constructed using the ENVI 5.2 2D scatter tool. Depending on the distribution form of the typical desertification indicators in the feature space, three desertification index inversion methods were selected: point-to-point, point-to-line, and vertical direction division of the trend line. Based on the research findings of Verstraete and Pinty (1996), the Albedo-NDVI feature space is divided in the vertical direction of the trend line representing the degree of desertification, effectively distinguishing land with different desertification degrees (Figure 3A). The position of the vertical direction in the Albedo-NDVI feature space can be expressed by adding a simple binary linear polynomial in the Albedo-NDVI feature space:
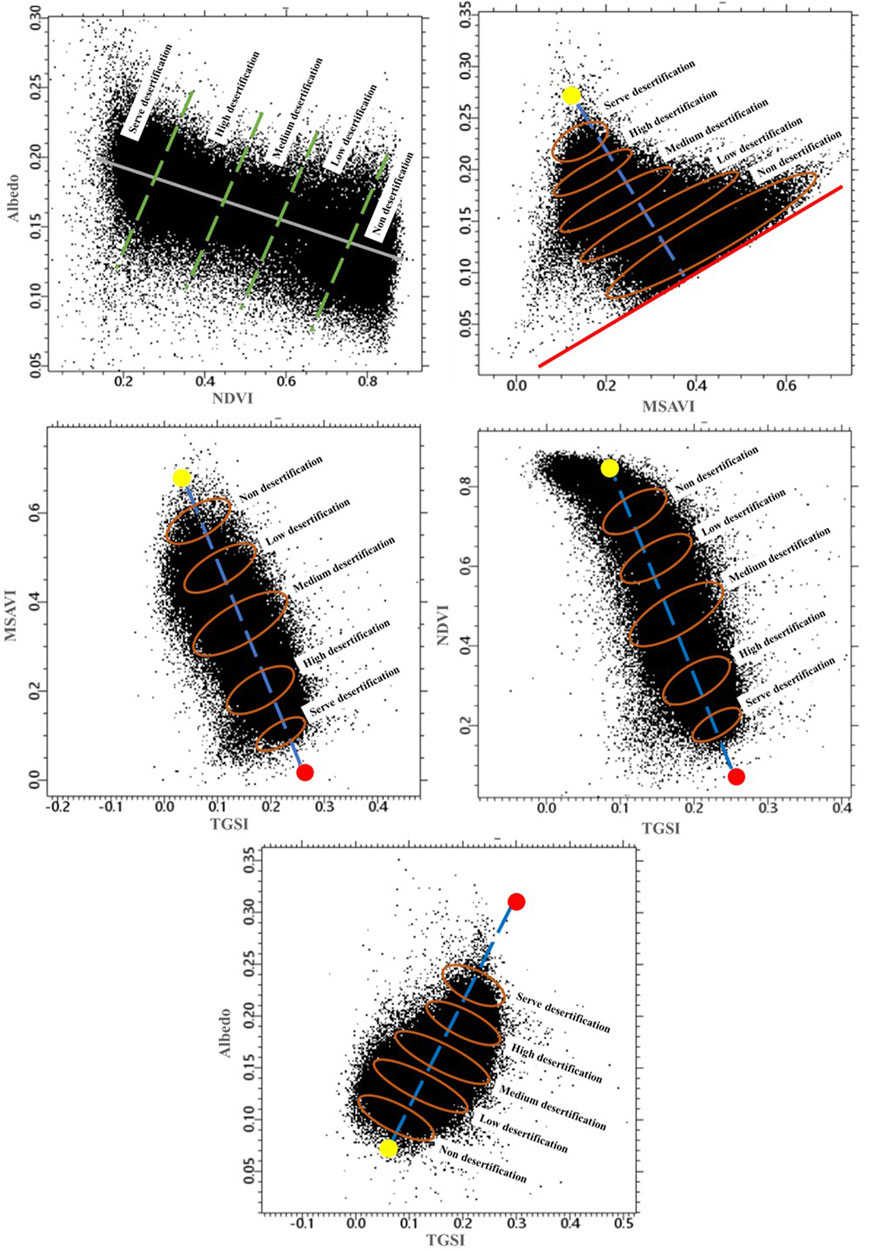
FIGURE 3. Different desertification inversion feature spaces. (A) Albedo-NDVI; (B) Albedo-MSAVI; (C) MSAVI-TGSI; (D) NDVI-TGSI; and (E) Albedo-TGSI. Note: brown and green lines mean the trend line for distinguish the desertification degree. The red point means certain point (start point), and the yellow point on behalf of any point. The closer to red point means more severe desertification level, and vice versa.
AN = a
Where a is determined by the slope of the trend line in the Albedo-NDVI feature space.
In this study, the specific expression is:
The distance between any point (yellow point) and a certain line (red line) can effectively divide the Albedo-MSAVI feature space into desertification lands of different degrees (Figure 3B); the farther the distance between the point and the red line, the more serious is the desertification. The desertification index retrieved from the Albedo-MSAVI feature space model is called AM, and its calculation formula is as follows:
where k is the slope of a specific line (red line), and b is its intercept.
In this study, the specific expression is:
As shown in Figures 3C–E, the distance between any point (yellow point) and a certain point (red point) can effectively divide the TGSI-MSAVI, TGSI-NDVI, and TGSI-Albedo feature spaces into desertification lands of different degrees; the closer the distance between any point and red point, the more serious the desertification. The desertification indexes retrieved from the TGSI-MSAVI, TGSI-NDVI, and TGSI-Albedo feature space models are TM, TN, and TA, respectively. The calculation formula is as follows (taking TM as an example).
where M and N are the TGSI and MSAVI of the specific points, respectively (red point).
In this study, the specific expressions of TM, TN, and TA are:
2 Results
2.1 Classification accuracy of different feature space models
Based on the 2015 field site data and high-resolution Google Earth images, 128 validation sites were selected to determine the actual desertification degree. We used the confusion matrix method to evaluate the desertification results under different feature space models (Table 2). The results show that the overall accuracy of the point-to-line Albedo-MSAVI feature space model was the highest, reaching 84.89%.
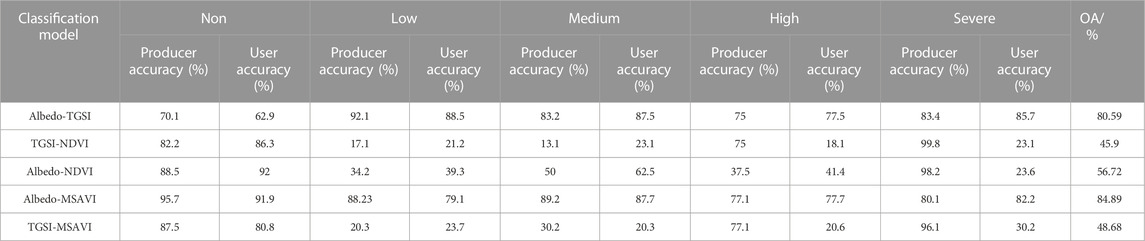
TABLE 2. Precision comparison of different feature space models.
2.2 Spatial-temporal dynamic pattern of desertification in the Selenge River Basin
Figure 4 depicts the spatial distribution of the degrees of desertification in different periods. The desertification degree is mainly low and medium on the whole, and the high desertification is located in BULGAN and HOVSGOL provinces in the middle-upper reaches of the basin, and the severe desertification is mainly located in TOV province and Ulaanbaatar in the middle-lower reaches of the basin. Severe and high desertification shows an expansion trend in the middle and northwest regions. Medium and low desertifications are mainly distributed in the northern grassland and southwest areas. Non-desertification areas are mainly distributed in forested areas in the upper reaches of the Selenge River Basin. From 1990 to 2005, the severity of land desertification in the southeast and northwest regions increased rapidly. Severe desertification begins to shift from a scattered distribution to a continuous patchy distribution. The low and medium desertification land was further transformed into high and severe desertification land in 2005–2015. From 2015 to 2020, the degree of desertification decreased in the northern grassland areas and the central region, but the situation in the southeast remains critical.
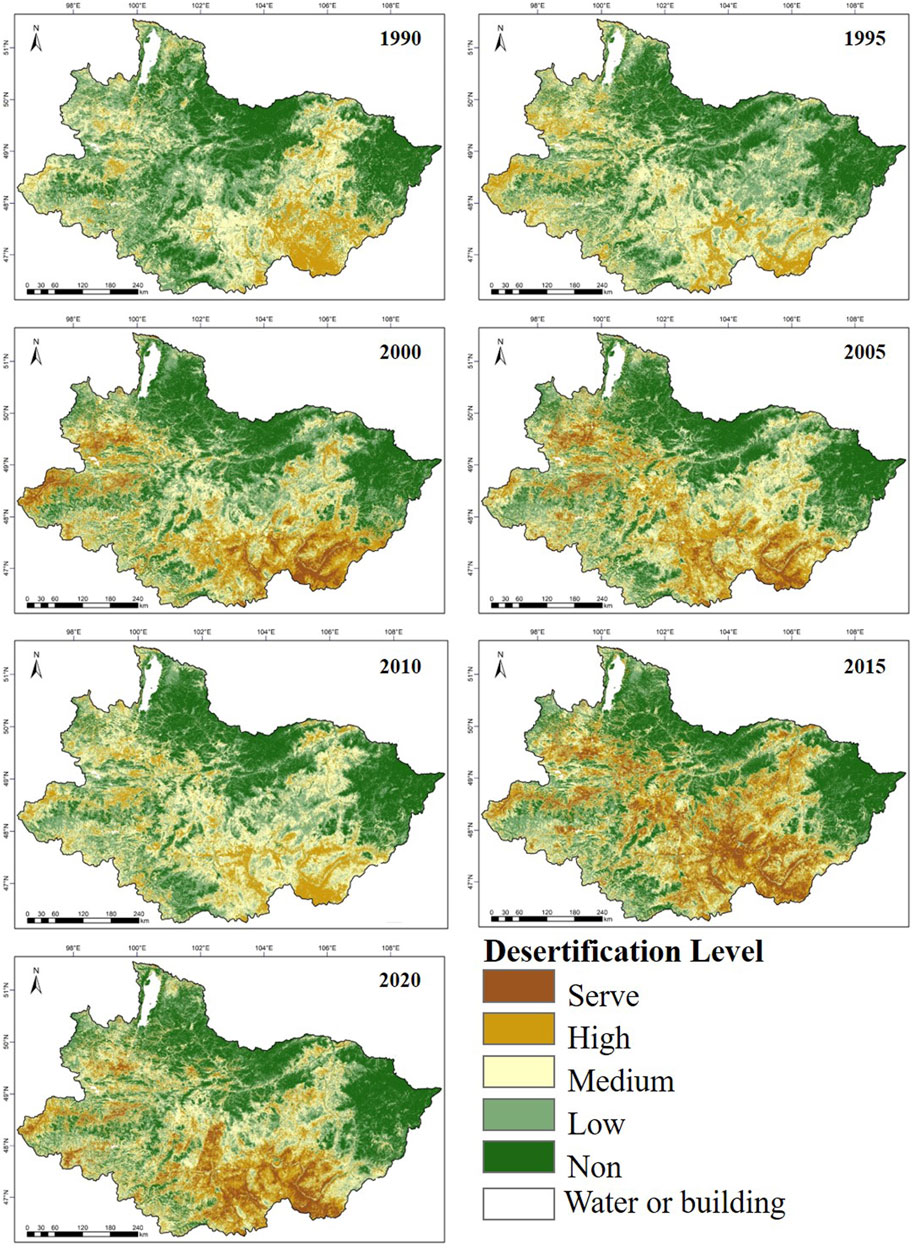
FIGURE 4. Spatial distribution of desertification in the Selenge River Basin of Mongolia from 1990 to 2020.
As shown in Table 3, over the past 30 years, the total area of desertified land in the Selenge River Basin in Mongolia as a proportion of the total land area has been high and remains relatively stable, ranging from 72% to 74%. However, there is a clear changing trend in the area of different desertification degrees, mainly a decrease in the area of light and moderately desertified land and an increase in the area of high and desertified land. From 1990 to 2020, the area of severely desertified land increased to 20,762 km2, an increase rate of 7.03%. The area of high desertification increased from 34,879 km2–53,346 km2, an increase rate of 6.25%. In 2015, severe and high desertification peaked at 29,650 km2 and 66,468 km2, respectively, accounting for 10.04% and 22.51%, respectively. The area of low desertification decreased significantly, from 94,399 km2 in 1990 to 63,980 km2, a decrease rate of 10.30%.
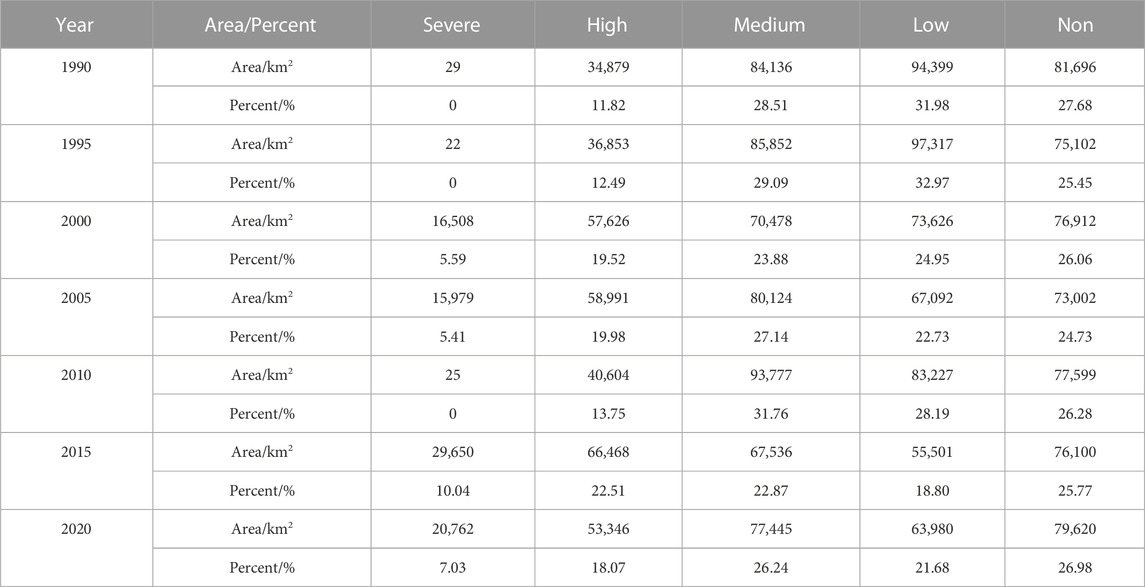
TABLE 3. Area of different desertification degrees from 1990 to 2020.
2.3 Conversion trend of desertification degree in the Selenge River Basin
To better understand the spatial dynamic changes of desertification in the study area from 1900 to 2020, the changes in the spatial pattern of desertification were divided into five categories: strong deterioration (desertification intensifies by two or more levels), deterioration (desertification intensifies to the adjacent level), stability (desertification degree remains unchanged), recovery (desertification reduces to the adjacent level), and significant recovery (desertification is reduced by two or more levels).
From 1990–2020, the overall desertification evolution trends were deterioration, deterioration, deterioration, recovery, deterioration, and recovery in the Selenge River Basin during different periods, respectively. The evolution of desertification was dominated by transitions between adjacent types in the Selenge River basin (such as light to moderate), and other transition areas are very small (Figure 5; Table 4). Further deterioration of low and medium desertified land is the main type of deterioration for all periods. In 2010–2015, desertified land experienced the largest area of deterioration with 114,522 km2, which was 5.35 times than recovery land. Recovery of medium and high desertified land is the main type of recovery. In 2005–2010, desertified land occurred in the largest area of recovery with 94,996 km2 (Table 4). The active desertification area is mainly concentrated in the central and southeastern of the Selenge River basin, and the deterioration and recovery show a clear alternation. For example, the desertification in 2000–2005 and 2005–2010 were two diametrically opposed transitions, with deterioration and recovery, respectively (Figure 5).
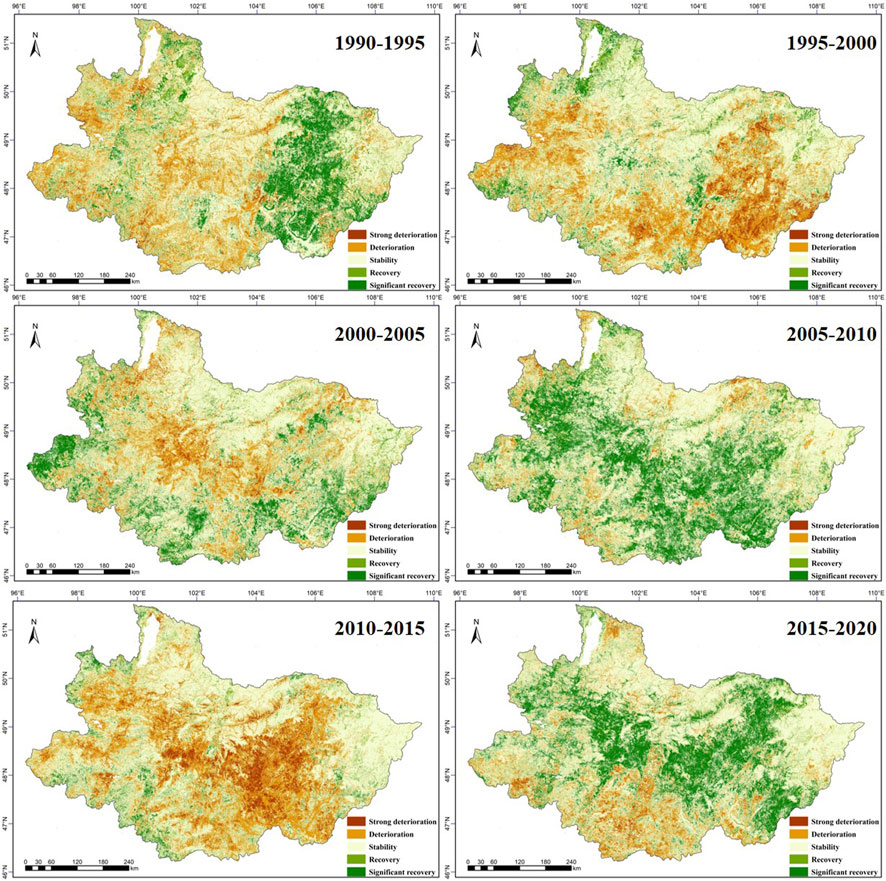
FIGURE 5. Changes in the spatiotemporal pattern of desertification.
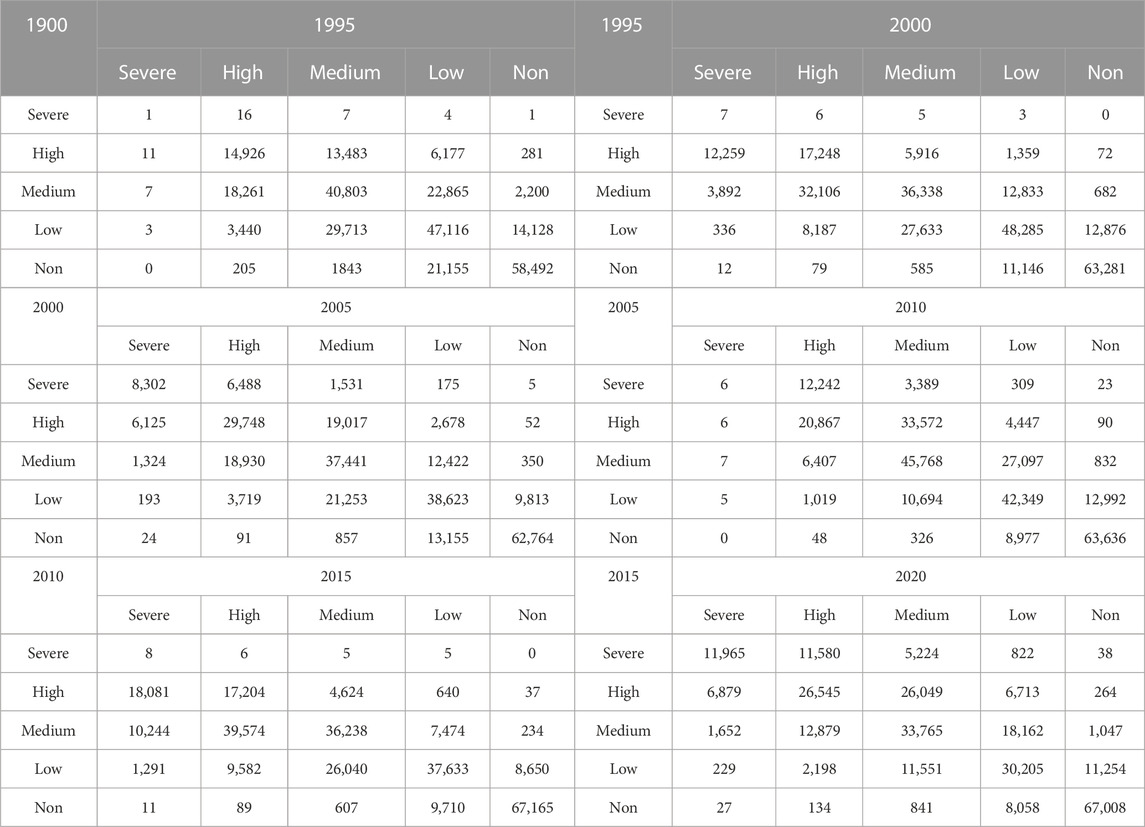
TABLE 4. The changing area of spatiotemporal pattern of desertification.
3 Discussions
3.1 Adaptability of the feature space model in Mongolian Plateau
The point-to-line Albedo-MSAVI feature space model constructed in this study has the highest accuracy in desertification information extraction of the Selenge River Basin, reaching 84.89%. However, there are some differences in the monitoring accuracy of this model in different degrees of desertification, with the highest accuracy (93.5%) for non-desertification and the worst accuracy (77%) for high desertification (Table 2). The Albedo-NDVI model had a high recognition accuracy for non-desertification areas, with an accuracy of 92%.It is easy to misclassify low and medium desertification areas as high or severe desertification areas (Figure 6). This is because the vegetation coverage of the Selenge River basin in Mongolia is dominated by forests, typical grasslands, and desert grasslands, whereas NDVI has a large expression error for low-density vegetation. Compared with NDVI, MSAVI can eliminate the impact of soil and more accurately reflect surface vegetation. Point-to-point Albedo-TGSI, TGSI-NDVI, and TGSI-MSAVI feature space models cannot effectively identify non-desertification areas, and the latter two feature space models significantly exaggerate the distribution of extremely severe desertification land (Figure 6). These research findings are consistent with the adaptability analysis results of various feature space model (Zeng et al., 2007; Wei et al., 2018; Guo et al., 2021; Wu et al., 2017). Meanwhile, according to the distribution patterns of different desertification indicators in 2D space, point-point, point-line, and vertical direction segmentation methods were chosen to construct desertification indices, which greatly improved the rationality of the feature space model and the accuracy of desertification extraction results.
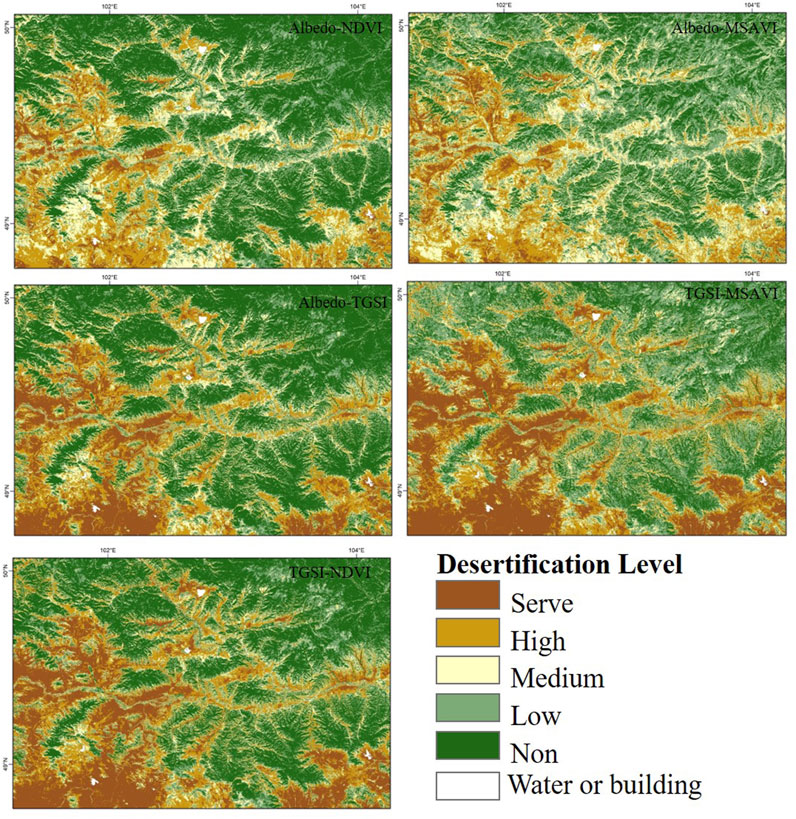
FIGURE 6. Inversion results of desertification in the Selenge River Basin with different characteristic space models.
Precise desertification information is crucial reference for formulating regional desertification control strategies. Using a couple of typical desertification indicators with clear biophysical significance to build a feature space model can effectively distinguish between different degrees of desertification land. The model indicators of this method are simple, feasible, easy to extract from desertification information with high accuracy (Ma et al., 2011; Wei et al., 2018; 2021). The Albedo-TGSI feature space model also has high adaptability in northwestern Mongolia with an accuracy of 89.95% (Wei et al., 2018), which is higher than the decision tree model proposed by Lamchin et al. (2016). Wei et al. (2021) completed the extraction of desertification information along the China-Mongolia railroad based on multi-source feature space model. Zhou et al. (2021) verified that the point-line Albedo-MSAVI has high adaptability in Inner Mongolia. The feature space model is now widely used for desertification information inversion in different regions of the Mongolian plateau and has proven to be highly adaptable. However, for different geographical environments, the selection of feature spatial indicators is decisive for the effect of desertification information extraction. In large-scale desertification inversion, it is necessary to comprehensively consider the characteristics of the various geographical units and select the appropriate feature space to construct indicators for different regions, respectively.
3.2 Analysis of the driving forces of the dynamic desertification pattern in the selenge river basin
Desertification has been widespread in the Selenge River Basin for the past 30 years, with the total area of desertification accounting for 72%–74% of the total land area, and is generally on a deteriorating trend. The severe desertification is mainly located in TOV province and Ulaanbaatar in the middle-lower reaches of the basin, and is expanding significantly. The main reason is the increasing high population density in Ulaanbaatar, the capital of Mongolia. Non-desertification regions are mainly distributed in the upper and lower reaches of the Selenge River Basin, where the vegetation cover is predominantly forest with a stable ecosystem. Desertification showed a clear recovery trend in 2010, related to the decrease of livestock in the spring of 2010 caused by the severe “white plague”. 2015 is the start year of the UN 2030 Agenda for Sustainable Development Goals. Mongolia has also implemented a serials of policies combating desertification in order to achieve Land Degradation Neutrality. As a result, there is a recovering trend in general from 2015–2020.
The land cover of the Selenge River Basin is dominated by real steppe and desert steppe, which are ecologically fragile and highly susceptible to degradation due to climate change and human activities. As for climate change, temperature and precipitation are important drivers of the spatial distribution and evolutionary trends of desertification (Jiang et al., 2019; Hu et al., 2020; Wang et al., 2020; Liang et al., 2021). Most studies indicate that climate change is the dominant factor influencing the evolution of desertification in different regions of the Mongolian Plateau (Meng et al., 2021; Fan et al., 2020; Guo et al., 2021). Over the past 30 years, the temperature in the Selenge River basin has been slowly increasing, with large interannual fluctuations, as shown in Figure 7A. Rising temperatures may lead to land desertification and heat waves that inhibit the normal growth of vegetation (Hirschi et al., 2011; Hauser et al., 2016). Large fluctuations in temperature adversely affect the succession of vegetation, leading to decreases in vegetation cover and productivity. The increase in precipitation can improve soil moisture, which is conducive to vegetation growth and promotes desertified land recovery (Zhang et al., 2013; Pang et al., 2017). Precipitation in this region showed a growing trend, with abundant precipitation and river water sources. UAV photos taken during the 2019 field survey indicate fertile grassland, high surface vegetation biomass, and significant recovery of desertified land in the lower Selenge watershed (Figure 8).
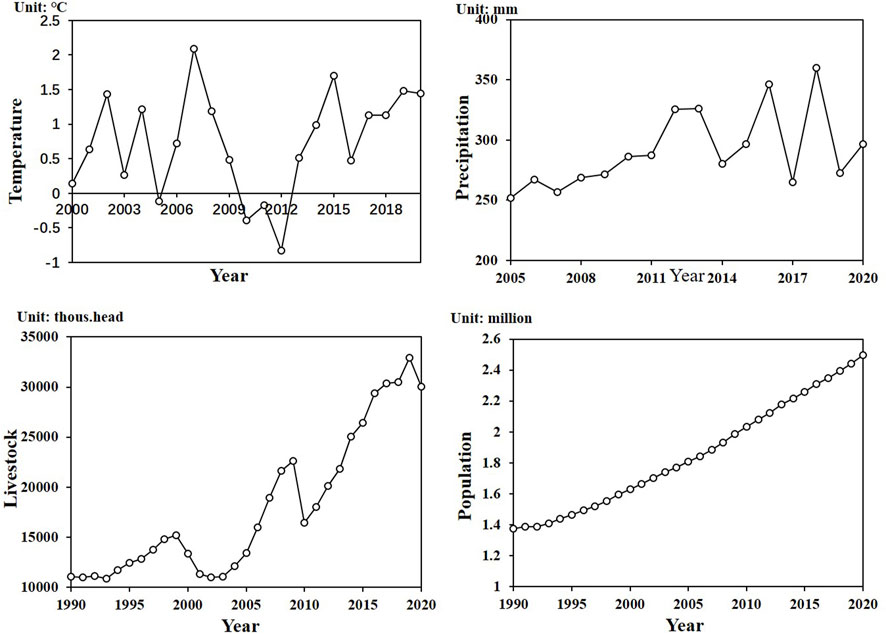
FIGURE 7. Inter annual variation of natural and social factors in the Selenge River basin, Mongolia.
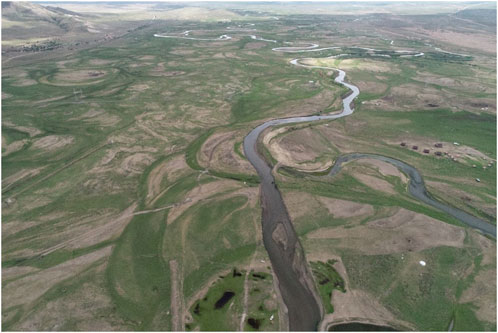
FIGURE 8. Photos of UAVs in Mongolia’s ancient Selenge River Basin (2019).
As for human activities, overloaded grazing and population migration have intensified the desertification of the Selenge River Basin in Mongolia. In the early 1990s, with the disintegration of the former Soviet Union, Mongolia’s socioeconomic system underwent tremendous changes. The promulgation of a series of laws and policies, such as the “national freedom” policy and land privatization, accelerated land change and transfer in Mongolia. The transformation and privatization of Mongolia’s market economy have brought about the disorder and the rapid expansion of animal husbandry (Buren, 2011; Wang et al., 2020). The livestock population in the Selenge River Basin of Mongolia is growing rapidly, from 11.09 million head in 1990 to 30.05 million head in 2020 (Figure 7C). Compared to the increase in the number of livestock, the change in the proportion of livestock structure has a greater impact on the degree of desertification. The proportion of large livestock, such as horses, cattle, and camels, has decreased, the proportion of small livestock, such as sheep and goats, has increased, and the number of goats on hand has surged, which is equivalent to the number of sheep. Grasslands eaten by goats and sheep take a long time to recover (Su, 2015; Liu et al., 2018). The increasing number of goats has making big challenge for the environmental carrying capacity for the local animal husbandry.
4 Conclusion
The Mongolian plateau has been facing the threat of desertification for a long time. Facing the requirements of precise desertification reversion, this study selected four typical desertification indicators, namely NDVI, MSAVI, TGSI, and Albedo, and constructed five feature space models in a point-to-point, point-to-line and vertical direction division to obtain the optimal characteristic space model for desertification monitoring in the Selenge River Basin, Mongolia. The spatial and temporal dynamic pattern of desertification distribution from 1990 to 2020 in the region and its main driving factors were further analyzed. The main conclusions are as follows: 1) Compared with the other four feature space models, the point-to-line Albedo-MSAVI feature space model has the highest recognition accuracy of 84.89% for desertification in the basin. 2) The desertification level of the Selenge River basin is mainly low and medium on the whole, the high desertification is mainly located in BULGAN and HOVSGOL provinces in the middle-upper reaches of the basin, and the severe desertification is mainly located in TOV province and Ulaanbaatar in the middle-lower reaches of the basin. 3) From 1990–2020, desertification degree in the Selenge River Basin has further deteriorated, and the area of high and serve desertified land has expanded significantly. Within the stage, 1990–2015 was a period of rapid increase in desertification. However, from 2015–2020, recovery takes the dominant position. The regions with high conversion frequency of desertification degree are mainly concentrated in the central and southeastern of the Selenge River Basin. The joint effects of large fluctuations in temperature, overgrazing and population migration aggravate the desertification degree in this region. The research results can provide the desertification retrieving method recommendation and land degradation nutrition measures decision support in the Selenge River Basin and the whole Mongolian Plateau. In the next step, the quantitative identification of driving forces of desertification will be done for enhancing the relationship study among desertification retrieving, and the climate change and human activities. (chasek et al., 2019; Collado et al., 2002; Eckert et al., 2015; Liu et al., 2007; Yan and Wu, 2013; Zongfan et al., 2022).
Data availability statement
The original contributions presented in the study are included in the article/supplementary material, further inquiries can be directed to the corresponding author.
Author contributions
SX: Data preparation, processing, analysis and writing-original articles. JW: supervision, review and refine articles. OA and TC: review and refine articles. All authors read and approved the final manuscript.
Funding
This research was supported by the National Nature Science Foundation of China (grant number 41971385 and 32161143025), Key Project of Innovation LREIS (grant numbers KPI006), and the Construction Project of the China Knowledge Center for Engineering Sciences and Technology (grant number CKCEST-2022-1-41).
Acknowledgments
We thank all the members of the field survey team of the Institute of Geographic Sciences and Natural Resources Research, Chinese Academy of Sciences, and the Mongolian National University for their support of the field work.
Conflict of interest
The authors declare that the research was conducted in the absence of any commercial or financial relationships that could be construed as a potential conflict of interest.
Publisher’s note
All claims expressed in this article are solely those of the authors and do not necessarily represent those of their affiliated organizations, or those of the publisher, the editors and the reviewers. Any product that may be evaluated in this article, or claim that may be made by its manufacturer, is not guaranteed or endorsed by the publisher.
References
Ajaj, Q. M., Pradhan, B., Noori, A. M., and Jebur, M. N. (2017). Spatial monitoring of desertification extent in western Iraq using landsat images and GIS. Land Degrad. Dev. 28, 2418–2431. doi:10.1002/ldr.2775
Buren, G. W. (2011). A study on desertification status, causes and prospect of grassland animal husbandry in Mongolia. Mongolia, China: Inner Mongolia University.
Chasek, P., Akhtar-Schuster, M., Orr, B. J., Luise, A., Rakoto Ratsimba, H., and Safriel, U. (2019). Land degradation neutrality: The science-policy interface from the UNCCD to national implementation. Environ. Sci. Policy 92, 182–190. doi:10.1016/j.envsci.2018.11.017
Collado, A. D., Chuvieco, E., and Camarasa, A. (2002). Satellite remote sensing analysis to monitor desertification processes in the crop-rangeland boundary of Argentina. J. Arid. Environ. 52, 121–133. doi:10.1016/s0140-1963(01)90980-2
Dawasuren, (2018). Research on 25 years' land development and agricultural development in Serenge Basin. Mongolia, China: Inner Mongolia Normal University.
Duan, H., Wang, T., Xue, X., and Yan, C. (2019). Dynamic monitoring of aeolian desertification based on multiple indicators in Horqin Sandy Land, China. Sci. Total Environ. 650, 2374–2388. doi:10.1016/j.scitotenv.2018.09.374
Eckert, S., Hüsler, F., Liniger, H., and Hodel, E. (2015). Trend analysis of MODIS NDVI time series for detecting land degradation and regeneration in Mongolia. J. Arid. Environ. 113, 16–28. doi:10.1016/j.jaridenv.2014.09.001
Gong, P., Wang, J., Yu, L., Zhao, Y., Zhao, Y., Liang, L., et al. (2013). Finer resolution observation and monitoring of global land cover: First mapping results with landsat TM and ETM+ data. Int. J. Remote Sens. 34, 2607–2654. doi:10.1080/01431161.2012.748992
Guo, B., Wei, C., Yu, Y., Liu, Y., Li, J., Meng, C., et al. (2022). The dominant influencing factors of desertification changes in the source region of Yellow River: Climate change or human activity? Sci. Total Environ. 813, 152512. doi:10.1016/j.scitotenv.2021.152512
Guo, X., Chen, R., Thomas, D. S. G., Li, Q., Xia, Z., and Pan, Z. (2021). Divergent processes and trends of desertification in Inner Mongolia and Mongolia. Land Degrad. Dev. 32, 3684–3697. doi:10.1002/ldr.3825
Hauser, M., Orth, R., and Seneviratne, S. I. (2016). Role of soil moisture versus recent climate change for the 2010 heat wave in Western Russia. Geophys. Res. Lett. 43, 2819–2826. doi:10.1002/2016GL068036
Han, Z., Wang, T., Yan, C., Liu, Y., Liu, L., Li, A., et al. (2010). Change trends for desertified lands in the Horqin Sandy Land at the beginning of the twenty-first century. Environ. Earth Sci. 59, 1749–1757. doi:10.1007/s12665-009-0157-7
Hirschi, M., Seneviratne, S. I., Alexandrov, V., Boberg, F., Boroneant, C., Christensen, O. B., et al. (2011). Observational evidence for soil-moisture impact on hot extremes in southeastern Europe. Nat. Geosci. 4, 17–21. doi:10.1038/ngeo1032
Jiang, L., Jiapaer, G., Bao, A., Kurban, A., Guo, H., Zheng, G., et al. (2019). Monitoring the long-term desertification process and assessing the relative roles of its drivers in Central Asia. Ecol. Indic. 104, 195–208. doi:10.1016/j.ecolind.2019.04.067
Lamchin, M., Lee, W. K., Jeon, S. W., Lee, J.-Y., Song, C., Piao, D., et al. (2017). Correlation between desertification and environmental variables using remote sensing techniques in hogno khaan, Mongolia. Sustainability 9, 581. doi:10.3390/su9040581
Li, X., Gong, P., Zhou, Y., Wang, J., Bai, Y., Chen, B., et al. (2020). Mapping global urban boundaries from the global artificial impervious area (GAIA) data. Environ. Res. Lett. 15, 094044. doi:10.1088/1748-9326/ab9be3
Li, X. R., Zhang, P., Su, Y. G., and Jia, R. L. (2012). Carbon fixation by biological soil crusts following revegetation of sand dunes in arid desert regions of China: A four-year field study. CATENA 97, 119–126. doi:10.1016/j.catena.2012.05.009
Li, Y., Sun, B., Gao, Z., Su, W., Wang, B., Yan, Z., et al. (2022). Extraction of rocky desertification information in karst area by using different multispectral sensor data and multiple endmember spectral mixture analysis method. Front. Environ. Sci. 10. Available at: https://www.frontiersin.org/articles/10.3389/fenvs.2022.996708 (Accessed December 16, 2022).
Liang, X., Li, P., Wang, J., Shun Chan, F. K., Togtokh, C., Ochir, A., et al. (2021). Research progress of desertification and its prevention in Mongolia. Sustainability 13, 6861. doi:10.3390/su13126861
Liu, A., Wang, C., Wang, J., and Shao, X. (2007). Method for remote sensing monitoring of desertification based on modis and noaa/avhrr data. Trans. Chin. Soc. Agric. Eng. 23 (10), 7.
Liu, Q., Liu, G., and Huang, C. (2018). Monitoring desertification processes in Mongolian Plateau using MODIS tasseled cap transformation and TGSI time series. J. Arid. Land 10, 12–26. doi:10.1007/s40333-017-0109-0
Ma, Z., Xie, Y., Jiao, J., li, L., and Wang, X. (2011). The construction and application of an aledo-NDVI based desertification monitoring model. Procedia Environ. Sci. 10, 2029–2035. doi:10.1016/j.proenv.2011.09.318
Michel, M. V., and Bernard, P. (1996). Designing optimal spectral indexes for remote sensing applications. J. Remote Sens. Environ. 34, 1254–1265. doi:10.1109/36.536541
Oh, K., Jeong, Y., Lee, D., Lee, W., and Choi, J. (2005). Determining development density using the urban carrying capacity assessment system. Landsc. Urban Plan. 73, 1–15. doi:10.1016/j.landurbplan.2004.06.002
Pang, G., Wang, X., and Yang, M. (2017). Using the NDVI to identify variations in, and responses of, vegetation to climate change on the Tibetan Plateau from 1982 to 2012. Quat. Int. 444, 87–96. doi:10.1016/j.quaint.2016.08.038
Pekel, J. F., Cottam, A., Gorelick, N., and Belward, A. S. (2016). High-resolution mapping of global surface water and its long-term changes. Nature 540, 418–422. doi:10.1038/nature20584
Qiu, L. (2008). Remote sensing analysis of Mu Us desert landscape. Xi'an, China: Xi'an University of Science and Technology.
Ren, Y., Li, Z., Li, J., Dashtseren, A., Li, Y., and Altanbagana, M. (2022). Comparative analysis of driving forces of land use/cover change in the upper, middle and lower reaches of the Selenga River Basin. Land Use Policy 117, 106118. doi:10.1016/j.landusepol.2022.106118
Su, R. S. G. (2015). Study on desertification status and countermeasures of sukhbato province, Mongolia. Inner Mongolia University.
Unccd (United Nations Convention To Combat Desertification), (1994). United nations convention to combat desertification in those countries experiencing serious drought and/or desertification particularly in africa: Text with annexes. Nairobi, Kenya: UNEP.
Van den Elsen, E., and Jetten, V. (2015). Combatting desertification using a multidisciplinary approach. CATENA 128, 211–213. doi:10.1016/j.catena.2014.10.001
Wang, J., Wei, H., Cheng, K., Ochir, A., Davaasuren, D., Li, P., et al. (2020b). Spatio-temporal pattern of land degradation from 1990 to 2015 in Mongolia. Environ. Dev. 34, 100497. doi:10.1016/j.envdev.2020.100497
Wei, H., Wang, J., Cheng, K., Li, G., Ochir, A., Davaasuren, D., et al. (2018). Desertification information extraction based on feature space combinations on the Mongolian plateau. Remote Sens. 10, 1614. doi:10.3390/rs10101614
Wei, H., Wang, J., and Han, B. (2020). Desertification information extraction along the China–Mongolia railway supported by multisource feature space and geographical zoning modeling. IEEE J. Sel. Top. Appl. Earth Observations Remote Sens. 13, 392–402. doi:10.1109/JSTARS.2019.2962830
Wei, W. E. I., Xiao, Y. U., Meng-zhen, Z., Juan, Z., Tao, Y., and Chun-fang, L. I. U. (2021). Dynamics of desertification in the lower reaches of shiyang River Basin, northwest China during 1995-2018. Chin. J. Appl. Ecol. 32, 2098–2106. doi:10.13287/j.1001-9332.202106.012
Wu, Q., Lane, C. R., Li, X., Zhao, K., Zhou, Y., Clinton, N., et al. (2019). Integrating LiDAR data and multi-temporal aerial imagery to map wetland inundation dynamics using Google Earth Engine. Remote Sens. Environ. 228, 1–13. doi:10.1016/j.rse.2019.04.015
Yan, F., and Wu, B. (2013). Desertification progress in mu us sandy land over the past 40 years. Arid. Land Geogr. 36 (06), 987–996. doi:10.1016/j.geosus.2022.06.001
Yue, Y., Geng, L., and Li, M. (2023). The impact of climate change on aeolian desertification: A case of the agro-pastoral ecotone in northern China. Sci. Total Environ. 859, 160126. doi:10.1016/j.scitotenv.2022.160126
Zeng, Y. N., Xiang, N. P., Feng, Z. D., and Hu, H. (2006). Albedo-NDVI space and remote sensing synthesis index models for desertification monitoring. J. Sci. Geogr. Sin. 26, 75–81. doi:10.3969/j.issn.1000-0690.2006.01.013
Zhang, B., Cao, J., Bai, Y., Zhou, X., Ning, Z., Yang, S., et al. (2013). Effects of rainfall amount and frequency on vegetation growth in a Tibetan alpine meadow. Clim. Change 118, 197–212. doi:10.1007/s10584-012-0622-2
Zhang, X., Liu, L., Chen, X., Gao, Y., Xie, S., and Mi, J. (2021). GLC_FCS30: Global land-cover product with fine classification system at 30m using time-series landsat imagery. Earth Syst. Sci. Data 13, 2753–2776. doi:10.5194/essd-13-2753-2021
Zhou, P. (2019). Remote sensing monitoring of desertification in naiman banner based on albedo-MSAVI feature space. Sci. Technol. Innovation 32, 78–81.
Zongfan, B., Ling, H., Xuhai, J., Ming, L., Liangzhi, L., Huiqun, L., et al. (2022). Spatiotemporal evolution of desertification based on integrated remote sensing indices in Duolun County, Inner Mongolia. Ecol. Inf. 70, 101750. doi:10.1016/j.ecoinf.2022.101750
Keywords: desertification, land degradation, feature space model, Selenge River Basin, Mongolia plateau
Citation: Xu S, Wang J, Altansukh O and Chuluun T (2023) Spatial-temporal pattern of desertification in the Selenge River Basin of Mongolia from 1990 to 2020. Front. Environ. Sci. 11:1125583. doi: 10.3389/fenvs.2023.1125583
Received: 16 December 2022; Accepted: 27 February 2023;
Published: 14 March 2023.
Edited by:
Heping Liu, Washington State University, United StatesReviewed by:
Lu Wen, Inner Mongolia University, ChinaHeqiang Du, Northwest Institute of Eco-Environment and Resources (CAS), China
Copyright © 2023 Xu, Wang, Altansukh and Chuluun. This is an open-access article distributed under the terms of the Creative Commons Attribution License (CC BY). The use, distribution or reproduction in other forums is permitted, provided the original author(s) and the copyright owner(s) are credited and that the original publication in this journal is cited, in accordance with accepted academic practice. No use, distribution or reproduction is permitted which does not comply with these terms.
*Correspondence: Juanle Wang, d2FuZ2psQGlnc25yci5hYy5jbg==