 Quentin Lambert
 Armin Bischoff
 Morgane Enea1,3
- 1Aix Marseille Université, Université d’Avignon, IRD, CNRS, Institut Méditerranéen de Biodiversité et d’Ecologie marine et continentale (IMBE), Campus Etoile, Marseille, France
- 2Université d'Avignon, Aix Marseille Université, IRD, CNRS, Institut Méditerranéen de Biodiversité et d'Ecologie marine et continentale (IMBE), IUT Avignon Avignon, France
- 3Université de Sherbrooke, Département de biologie, Centre d’étude de la Forêt, Sherbrooke, QC, Canada
European semi-natural grasslands are particularly species-rich and provide many ecosystem services but depend on extensive land management. Today, these ecosystems are highly threatened by land abandonment, land use intensification and habitat destruction. The increasing construction of solar parks may contribute to habitat destruction but also provide an opportunity to restore or even create semi-natural grasslands. We studied ten solar parks along a climate gradient in Southern France to evaluate the establishment of semi-natural grasslands managed by grazing. We compared plots outside and under solar panels in terms of plant community composition, soil biodiversity and soil functioning to test whether solar panels hamper this establishment. The different microclimate under solar panels strongly affected the plant species composition and reduced the abundance of soil mesofauna and biomass of fungi and gram-negative bacteria. Outside panels, the vegetation was shaped by a climatic gradient, in particular by variations in temperature and precipitation whereas under panels variations were smaller indicating a homogenizing effect of panels on plant community composition. We found more trophic interactions between panels compared to outside and under panels suggesting a protection effect of panels between rows on the soil food web. However, plots under panels showed the lowest number of interactions demonstrating that the strong shading had a negative effect on the plant-soil food web. Solar panels therefore reduce the plant and soil biodiversity of semi-natural grasslands and disrupt ecosystem functions. In order to improve the ecological integration of solar parks, it is thus necessary to mitigate negative effects of solar panels on biodiversity or to increase the space between panels.
1 Introduction
Semi-natural grasslands represent 5% of the European and 20% of the French territory (U.E—SOeS, Corine Land Cover 2006). They are among the habitats of the highest species richness for many taxa at community scale (Wilson et al., 2012; Habel et al., 2013) and provide many ecosystem services such as pollination, carbon sequestration, soil conservation and livestock feeding (Bengtsson et al., 2019). The high species richness of herbaceous plants plays a key role in the functioning of this ecosystem and drives its biodiversity by providing resources and ecological niches resulting in a high complexity of interaction networks (Habel et al., 2013; Bengtsson et al., 2019). Semi-natural grasslands are one of the most threatened habitats in Europe (Gang et al., 2014). Land-use intensification (overgrazing, cropland), as well as construction activities (urban sprawl, industrial facilities) or, in contrast, land abandonment resulting in shrub encroachment, have led to a dramatic loss of European semi-natural grasslands. The rapid development of renewable energy in Europe such as solar park construction may further increase the pressure on semi-natural grasslands. Van de Ven et al. (2021) estimated that 3% of open habitats such as grasslands need to be transformed to solar parks in order to reach the European Union objectives for solar energy production. However, there may also be a chance for promoting semi-natural grasslands if solar parks are constructed in degraded habitats such as monospecific forests, quarries, arable land or wasteland providing an opportunity to benefit biodiversity and ecosystem functioning of new semi-natural grasslands (Hernandez et al., 2019; Lambert et al., 2022).
Semi-natural grassland biodiversity and functioning are driven by climate, soil and land use (Zarzycki and Bedla, 2017; Basile-Doelsch et al., 2020; Boonman et al., 2021). Climatic and abiotic soil conditions are also important drivers of biotic soil functioning and plant-soil interactions (Craine et al., 2012). Plant diversity affects decomposer organisms by resource diversification (beetles, mites, springtails, microorganisms) (Zak et al., 2003; Isbell et al., 2017). Steinauer et al. (2015) showed that higher plant diversity is closely related to higher microbial activity and biomass. The plant functional diversity also drives the diversity of the mesofauna decomposers (Moradi et al., 2017). These decomposers contribute to the structure of grassland plant communities by feeding on roots and translocating nutrients (Whiles and Charlton, 2006). Moreover, the mesofauna decomposer abundance directly affects mesofauna predators (such as mites, diplurans). Soil mesofauna such as plants and microorganisms are also influenced by climate (Barnett and Facey, 2016). The high floristic and faunistic biodiversity of semi-natural grasslands depends on extensive grazing or mowing avoiding shrub encroachment and a succession towards woody plant communities (Pulungan et al., 2019). The abandonment of such management leads to a strong decrease of plant diversity and related soil functions (Malcolm et al., 2006).
The construction of solar parks and subsequent use for electricity production changes environmental conditions (Hernandez et al., 2014). Clearing and vegetation management by grazing hampers shrub encroachment resulting in a dominance of herbaceous plant species (Armstrong et al., 2016). The construction of solar parks further leads to a degradation in the soil physico-chemical quality involving a reduction of aggregate stability and a compaction of the topsoil layer (Lambert et al., 2021). Choi et al. (2020) showed that total carbon and nitrogen content were two times lower in soils of solar parks than in arid grasslands. Solar panels also change microclimate resulting in a reduction of light, soil temperature and moisture (Uldrijan et al., 2021; Lambert et al., 2022; Moscatelli et al., 2022). Plant biomass and diversity were lower under solar panels while mortality and chlorophyll content were higher (Uldrijan et al., 2021; Lambert et al., 2022; Moscatelli et al., 2022). The lack of light under solar panels favors shade-tolerant species (Lambert et al., 2022) resulting in semi-natural vegetation types that can be found close to forests or in pasture woodlands. Whereas solar radiation is always reduced under solar panels, temperature and soil moisture may also be higher, for example, during the night (temperature) or after drought periods (soil moisture) thus buffering extreme values (Lambert et al., 2021). This buffering effect on microclimate may change the relationship between vegetation and regional climate.
The lower nutrient content in solar parks and the changes in microclimate under panels also change soil microbial biomass and enzyme activities involved in N and C cycling (Lambert et al., 2021; Moscatelli et al., 2022). The effect of solar panels on vegetation and soil microorganisms leads to a reduction in soil CO2 emission (Lambert et al., 2021) affecting biomass production (Armstrong et al., 2016). However, a better understanding of the decomposer food web and its interactions with plants is needed to evaluate consequences of solar park construction and solar panels on ecological functioning of semi-natural grasslands such as carbon cycling and sequestration.
In order to evaluate limits and chances of solar park construction and exploitation for the establishment of semi-natural grasslands, we compared plots outside and under solar panels in terms of plant community composition, soil organisms and soil functioning along a climate gradient. We expected that 1) the plant community composition outside solar panels is driven by climate and that the climate effect on plant communities is smaller under panels, 2) solar panels strongly affect plant communities and soil parameters. We finally hypothesized that 3) the changes in plant and soil communities disintegrate the soil food web network.
2 Materials and methods
2.1 Study sites and sampling design
This study was set up in ten solar parks (SPs) located in Southern France along the Rhône valley (Figure 1). The SPs are distributed along a climate gradient from the Mediterranean Sea in the south to inland sites in the north and east (Table 1). Distance to the sea was between 37 and 192 km, and sites differed in major climate characteristics from Mediterranean in the south to sub-Mediterranean at highest distances from the coastline (Table 1). Continentality increased to the north, mean annual temperature ranged from 11.8°C to 14.9°C and annual precipitation from 710 mm to 903 mm. Other environmental factors such as soil and technical characteristics are similar between SPs. The size of the SPs ranged from 1 to 7 ha, equipped with solar panel either fixed on the ground or trackers. Ground-fixed panels had a height of 1 m at the southern edge and of 2.5 m at the northern edge (inclination towards south) whereas the incliniation of tracker panels changed according to the sun position. The SP were built on former wasteland, crop land or semi-natural land (Table 1). The solar panels were aligned to form rows with a gap of 2.5 m between rows. All solar parks were managed by extensive sheep grazing. Parks were additionally mown when grazing was not intensive enough or irregular.
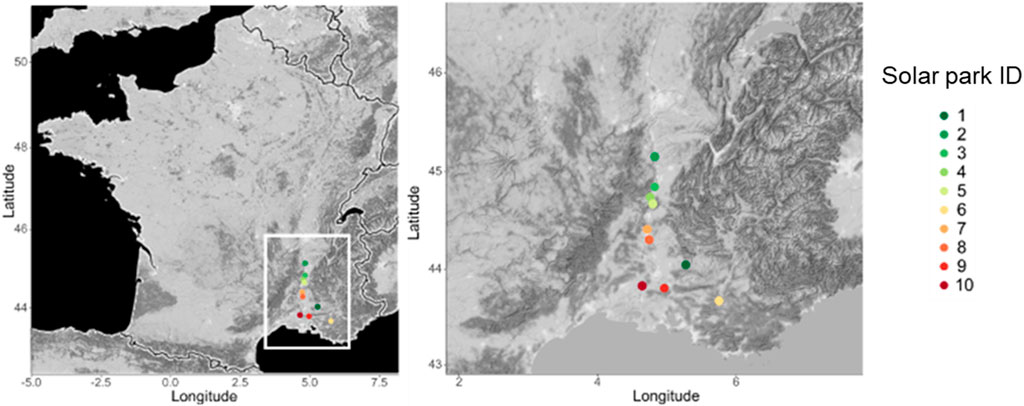
FIGURE 1. Geographical position of solar parks. Colors of SP position represent a mean annual temperature gradient.
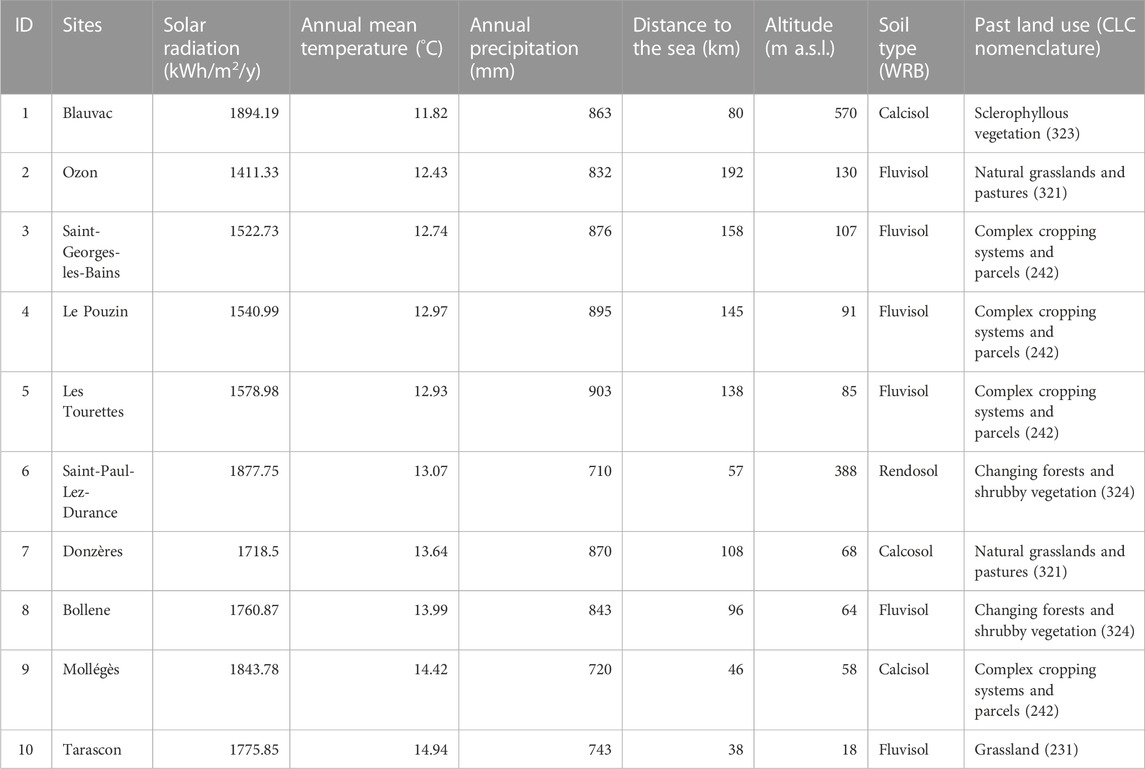
TABLE 1. Environmental characteristics of solar parks.
Within each SP, five blocks of at least 50 m distance were set up in spring 2021. In each block (Supplementary Appendix S1), three plots of 4 m2 were delimited for the following treatments: outside solar panels (outside), between two rows of solar panels (between) and under solar panels (under) (N = 10 solar parks X 5 blocks X 3 treatments = 150).
2.2 Vegetation monitoring
The effect of solar panels on plant community composition and vegetation cover (vertical projection of above-ground plant organs) of all vascular plant species was evaluated in each plot in late spring. To evaluate the effects of solar panels on physiological performance of the vegetation, a chlorophyll index was measured by Multiplex® 3 (FORCE-A, Orsay, France) with ten records of chlorphyll fluorescence within each plot. The Multiplex ResearchTM allows in situ, non-destructive and real-time measurements of chlorophyll content (Agati et al., 2011).
2.3 Soil sampling and physico-chemical properties
Soil was sampled in the same plots as the vegetation. In April 2021, three soil samples were randomly collected (10 cm depth) in each plot and mixed to one bulk sample. Bulk samples were sieved (mesh size: 2 mm) prior to analysis. An aliquot of samples was air-dried (1 week, 30 C) for physico-chemical analyses and another aliquot stored at 4°C for microbial analyses. Soil water content was determined after drying samples (24 h, 105°C). Total carbon (TC) and total nitrogen (TN) contents were measured by combustion in the CN FlashEA 1112 (ThermoFisher) (NF ISO 10694, NFISO 13878) elemental analyser.
2.4 Sampling and determination of springtails and mites
In April 2021, the soil mesofauna was sampled in stainless steel tubes (5.5 cm diameter, 6 cm depth) using two core samples per plot after vegetation removal. Mites and springtails were extracted during a period of 7 days at 25°C using the Berlese-Tullgren method (Bano and Roy, 2016) and then stored in 70% ethanol. Springtails and mites were counted under a stereomicroscope.
2.5 Microbial community composition and enzymatic activities
Phospholipid fatty acids (PLFA) are essential components of all living cells, but several PLFA are specific to bacterial and fungal biomass. PLFA were analyzed according to Buyer and Sasser (2012) and Aupic-Samain et al. (2021). After freeze-drying, 1 g of dry soil of each sample was extracted in 4 mL of Bligh–Dyer extractant containing 4 μL of 1,2-dinonadecanoyl-sn-glycero-3-phosphocholine (C19:0; Avanti® Polar lipids, Inc.). Lipids were separated using solid-phase extraction (SPE) on Phenomenex® (Strata SI-1 with 50 mg of silica, 55 μm, 70 Å). The resulting fatty acids methyl ester (FAME) were analysed by gas-chromatography/mass-spectrometry (GC-MS) on an Agilent 7890 system equipped with an MSD5977. A network mass detector, an ALS7693 automatic injector and an HP5-MS apolar column (30 m × 0.25 mm × 0.25 μm; JandW Agilent Technologies). Qualitative analysis of FAMEs resulted from retention time comparison of the FAME mixture (range between C4 to C24). We analyzed 85 specific biomarkers out of 98 identified PLFAs. Each biomarker was attributed to a specific taxon such as arbuscular mycorrhiza, other fungi, actinobacteria, gram-negative bacteria, gram-positive bacteria, in accordance with Frostegård et al. (1993). Bacterial biomass was calculated as the sum of actynobacteria, gram-negative and gram-positive bacteria biomass. Total microbial biomass was calculated as the sum of fungal and bacterial biomass. The details of the attribution of each peak to the taxa are presented in Supplementary Appendix S2.
The activity of luorescein diacetate hydrolase (FDAse) was measured according to Green et al. (2006) in order to determine the catabolic potential of microbial communities. FDAse is a complex of enzymes comprising phosphatase, cellulase, and lipase involved in the decomposition of cellulose and carbohydrates (Guénon et al., 2017).
2.6 In situ soil respiration
In May 2021, in situ soil CO2 effluxes (g.CO2.m-1.h-1) were recorded using a portable gas analyser (EGM-4, PP-system) after removal of aboveground vegetation. The soil CO2 effluxes represent the respiration of plant roots, soil organisms and chemical oxidation of C compounds. The device was connected to a closed soil respiration chamber (SRC-1, PP systems Massachusetts, United States). To prevent leakage of CO2 when placing the chamber on the soil, a PVC tube (10 cm × 11 cm) was buried 1 cm deep into the soil prior to measurements. In each plot, soil temperature was recorded in situ in a depth of 7 cm using the soil temperature probe (STP-1, PP-system) connected to the portable gas analyzer.
2.7 Statistical analyses
Climatic variables were extracted from WorldClim version 2.1 dataset using the period from 1970 to 2000 (Fick and Hijmans, 2017). The 19 climatic variables were extracted on a grid of 1 km2 and represented annual means of temperature and precipitation, seasonality, and extreme values resulting from MODIS images of the same period.
All data were analysed using R software (3.6.1, R core Team, 2020). Relationships between plant community composition, bioclimatic variables, plot position (under vs. outside panels) and one-way interaction of plot position and climatic variables were analysed using Redundancy analysis (RDA) in the R package “vegan” (Oksanen et al., 2007). Prior to RDA, multicollinearity of the 19 WorldClim explanatory variables and of their interactions with panel was tested by calculating the variance inflation factor (VIF) and using a cut value of 3. VIF retained four of them as non-collinear (Precipitation of Wettest Month, Annual Temperature Range, Mean Temperature of Wettest Quarter, Temperature Seasonality). A first RDA model tested the effect of panel and these four climatic variables on plant community composition including panel-climate interactions. Starting with an initial model of explanatory variables and interactions not showing collinearity, a backward selection procedure was applied using the “adespatial” package. Significance of explanatory variables was tested using PERMANOVA. Since most climatic variables showed significant interactions with plot position, separate RDA were additionally run for plots under and outside panels to explore the influence of climatic gradients.
To analyze the effect of solar panels on plant community characteristics, Shannon index, Simpson index and evenness were calculated. For each species, ecological indicator values were obtained using Julve (1998) adapted from Ellenberg et al. (1992). We separated species according to light indicator values in two groups: shade tolerant (1000–5,000 lux) and heliophilous species (>5,000 lux). We tested the habitat preference of each species in order to evaluate whether solar panels change grassland communities to shade-tolerant understory vegetation. The following response variables were tested: diversity indices, total vegetation cover, cover of shade-tolerant and heliophilous plants, chlorophyll index, mite and springtail abundance, biomass of microbes (AM fungi, Total Fungi, total Bacteria, Actynobacteria, Gram −, Gram +), FDase activity, soil respiration, soil temperature and moisture, total carbon and total nitrogen N. Linear mixed-effect models (LMMs) were calculated including position (under vs. between vs. outside panels) as fixed factor and SP as random factor. A Tukey post-hoc test was run to test for differences between the three positions when a significant effect of solar panel was detected. When necessary, data were transformed using the “bestNormalize” package (Peterson, 2021) to meet the assumptions of normality and homoscedasticity of variances.
To evaluate the influence of vegetation cover and main climatic variables on soil food web and soil CO2 effluxes (a key soil function), a path analysis was performed using R package “lavaan” (Rosseel, 2012). The analysis was run separately for measurements outside, between and under solar panels. Path analysis is a structural equation modelling (SEM) technique used to show causal relationships between several measured variables. To build a full model (Supplementary Appendix S3), we assumed a causal relationship between climatic variables (i.e., annual mean temperature and precipitation) and vegetation cover on total carbon and total nitrogen content, total bacterial and fungal biomass, abundance of springtails and mites, and soil respiration. The full models were simplified by progressively excluding insignificant variables until an appropriate minimum model was obtained. The fit of each model was evaluated by the significance of differences between the predicted and observed covariance matrices (χ2-squared tests, p > 0.05), by the mean square root error of the approximation index (RMSEA <0.1), by comparative fit index (CFI >0.90) and the Tucker–Lewis index (TLI >0.90) (Xia and Yang, 2019).
3 Results
3.1 Solar panel effects on plant community composition along a climatic gradient
Solar panels significantly affected plant community composition and the interactions of panels with annual temperature range (P:TAR) and temperature of the wettest month (P:TW) (Table 3; Figure 2A). Solar panels and interactions constrained the first axis of the RDA. The second RDA axis was constrained by temperature seasonality (TS) and precipitation of the wettest month (PW). Plant communities under solar panels showed less variation on the first RDA axis than those outside solar panels. Vegetation under solar panels was characterized by Anisantha sterilis and outside solar panels by Lotus dorycnium.
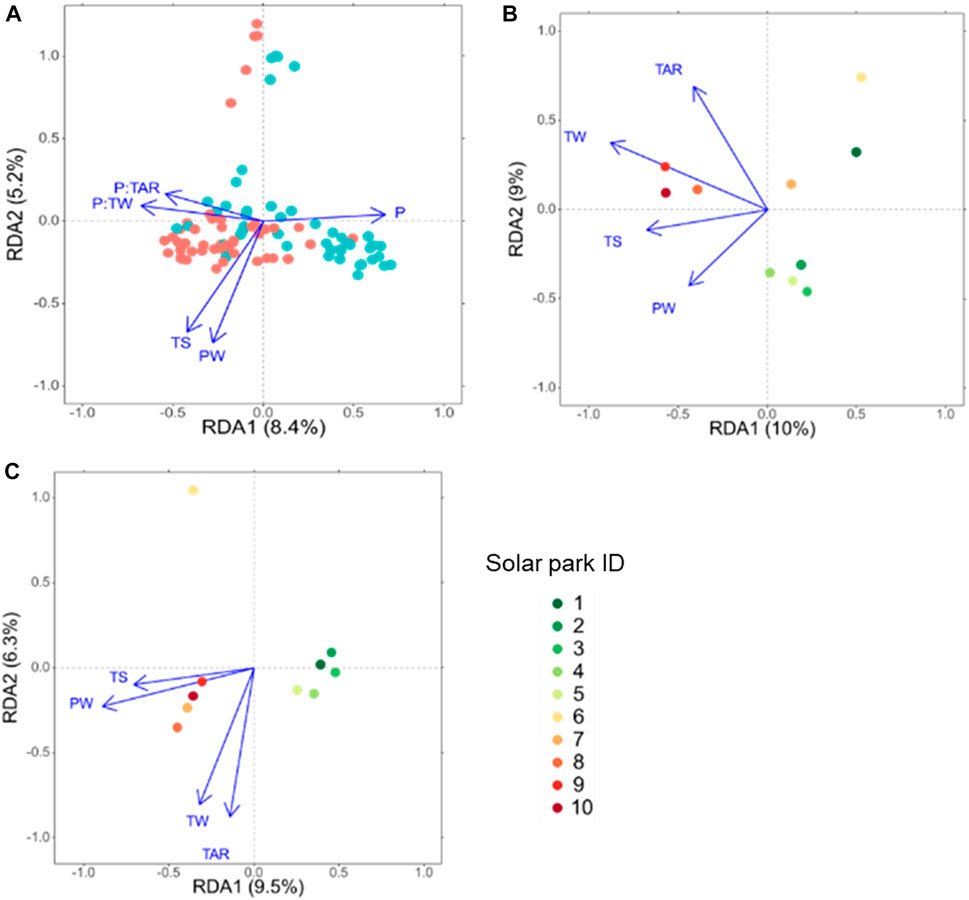
FIGURE 2. Redundancy analyses (RDA) of environmental variables on plant communities in solar parks including panel (P) effect (A) and separately outside (B) and under solar panels (C). Climate variables were precipitation of the wettest months (PW), temperature seasonality (TS) and the interaction of solar panels with annual temperature range (P:TAR) and temperature of the wettest quarter (P:TW). Red and blue points in panel A are plots under and outside solar panels, respectively. In figure B and C, colored points represent centroids of solar park vegetation.
Outside solar panels (Figure 2B), temperature of the warmest month (TW), temperature seasonality (TS) and precipitation of the wettest month constrained the first axis of the RDA, while annual temperature range (TAR) constrained the second one (Figure 2B). The solar parks 1 and 6 were negatively correlated to precipitation of the wettest month and temperature seasonality. And they were characterized by L. dorycnium. Solar parks 2 to 5 were positively correlated to PW and negatively to TAR. Solar parks 8 to 10 were positively correlated to TW and TS and were characterized by Cynodon dactylon and Bromus rubens.
Under solar panels, TS and PW constrained the first axis, while TAR and TW constrained the second axis (Figure 2C). Solar panels 1–5 characterized by A. sterilis, grouped together at low precipitation of the wettest month and low temperature seasonality. The solar parks 7 to 10 characterized by L. dorycnium also grouped together but at the left part of the biplot characterized by higher precipitation of the wettest month and higher temperature seasonality. The solar park 6 was apart from the others occurring in the upper part of the biplot that was related to lower temperatures of the warmest month and characterized by Erigeron sumatrensis/canadensis and Argyrolobium zanonii.
Plant communities of solar parks were dominated by ruderal and grassland species. Herbaceous species cover outside and under solar panels was 70 and 10 times higher, respectively, than forest type species cover (Table 2; Supplementary Appendix S5). Two non-native species (E. sumatrensis/canadensis, Senecio inaequidens) were recorded in 55 plots. Their cover represented on average 2% of total vegetation cover (Table 2; Supplementary Appendix S5).
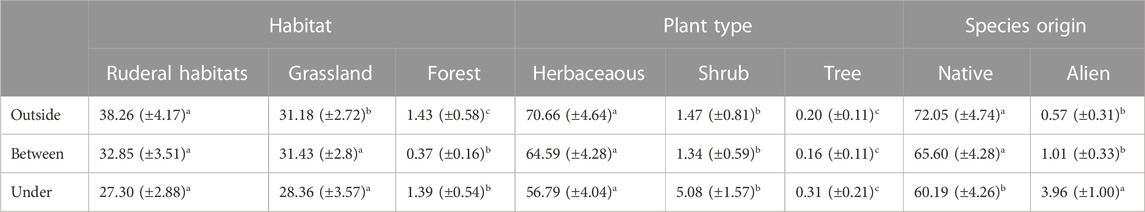
TABLE 2. Effect of solar panels on plant community characteristics such as habitat preference, plant type and species origin. Mean values with standard errors in parentheses. Different letters indicate significant differences between habitat, plant type and position outside, between and under panels.
The species richness (Figure 3A) and total vegetation cover (Figure 3B) were significantly lower under solar panels than outside panels (p < 0.05). The chlorophyll index (Figure 3C; Supplementary Appendix 6) increased under solar panels. The cover of shade-tolerant species (Figure 3D) was twice as high and the cover of heliophilous species (Figure 3E) 2.5 times lower (p < 0.001) under solar panels than outside. The cover of non-native species was four times higher (p < 0.001) under than outside and between solar panels (Figure 3F). Shannon index, Simpson index and evenness were significantly higher outside than under solar panels (Supplementary Appendix S6).
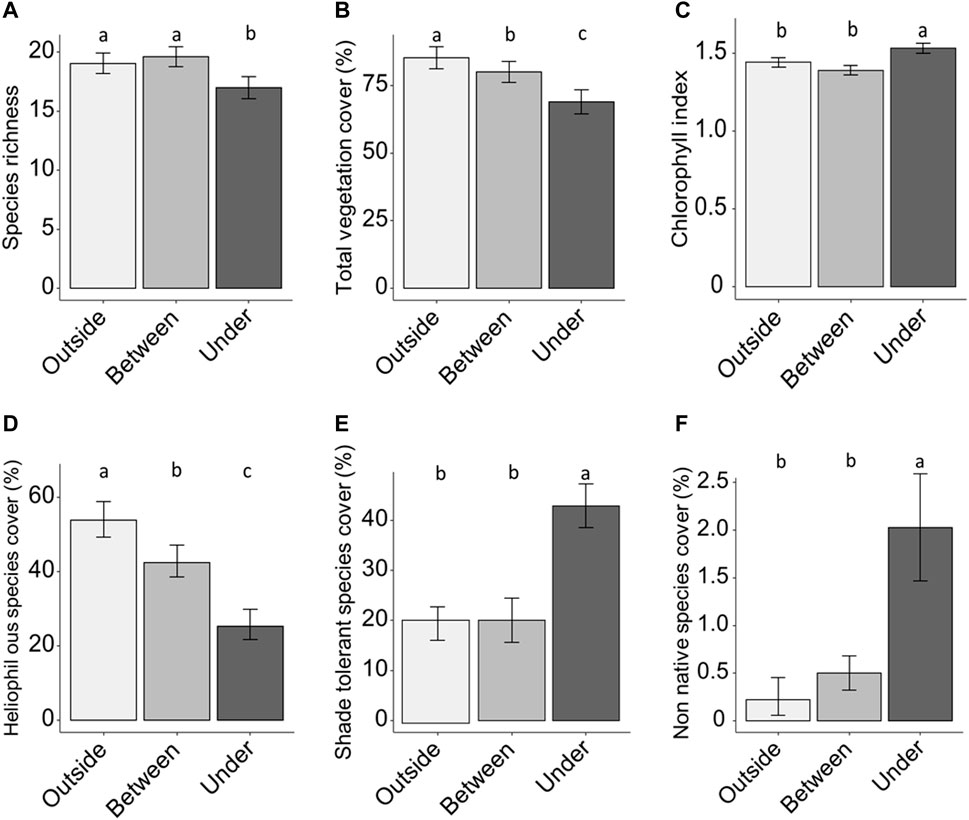
FIGURE 3. Species richness (A), total vegetation cover (B), chlorophyll index (C), total cover of shade-tolerant species (D), total cover of heliophilous species (E), total cover of non-native species (F) outside, between and under solar panels. Error bars are means ± SE; different lower-case letters indicate significant differences (p < 0,05).
3.2 Effects of solar panels on soil physico-chemical and biological properties
Total mite abundance was higher (p < 0.001) outside than under or between solar panels (0.5 and 1.5 times, respectively, Figure 4A; Supplementary Appendix S6). Springtails were 1.5 times more abundant (p < 0.001) outside than under solar panels (Figure 4B; Supplementary Appendix S6). Soil respiration was 5.5 times lower under than between and outside solar panels (Figure 4L, p < 0.001). Fungi and gram-negative bacteria biomass were significantly reduced by 25% under solar panels compared with outside (Figures 4C, G), Supplementary Appendix S6). Total biomass of microorganisms was 1.25 times higher outside than under solar panels (Supplementary Appendix S6; Figure 4J). FDAse activity was 20% lower under than between and outside solar panels (Supplementary Appendix S6; Figure 4K).
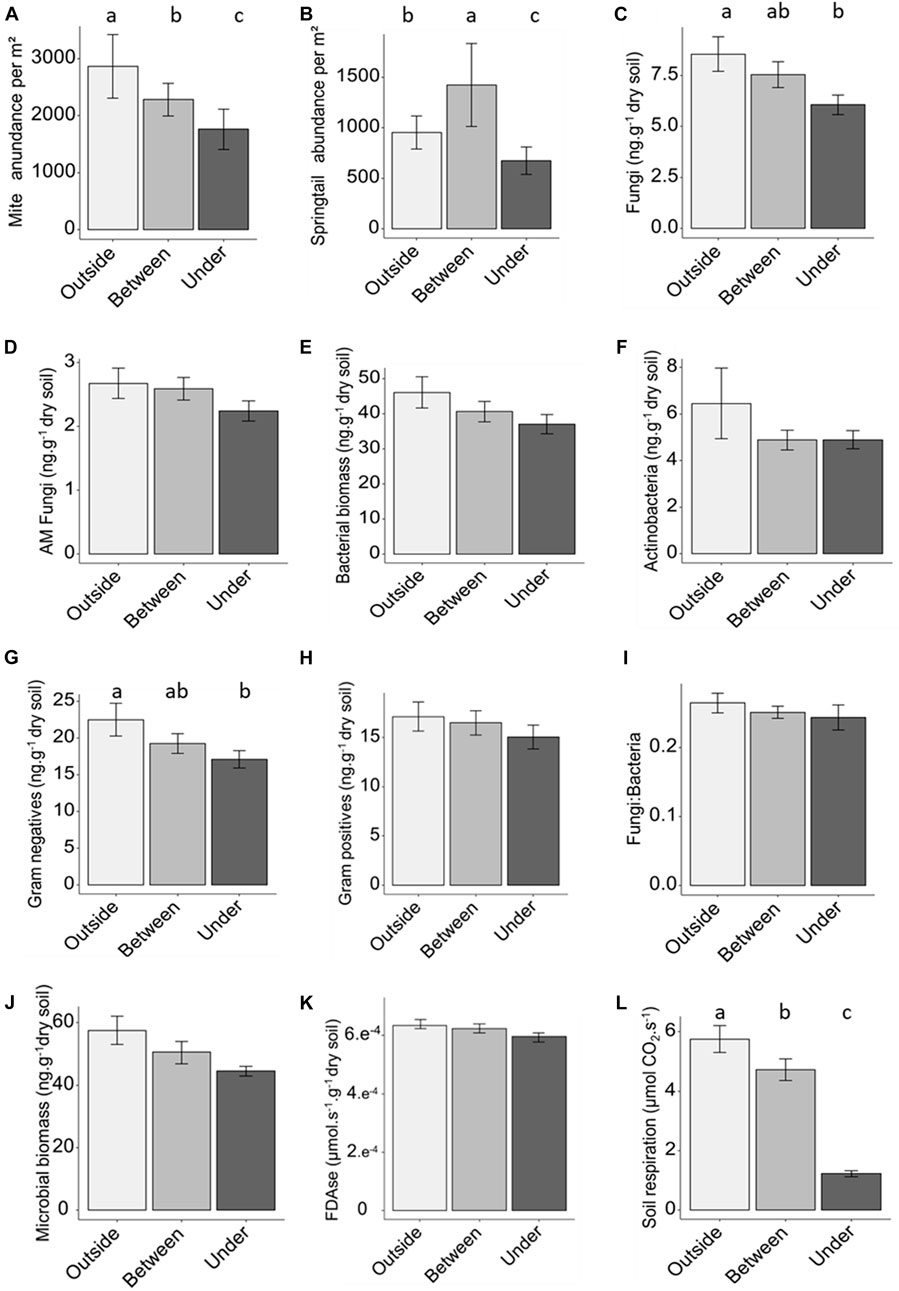
FIGURE 4. Mite abundance (A), springtail abundance (B), total fungi biomass (C), arbuscular mycorrhiza biomass (D) total bacteria biomass (E), actinobacteria biomass (F), gram-negative bacteria biomass (G), gram-positive bacteria biomass (H), fungi:bacteria ratio (I), total microbial biomass (J), fluorescein diacetate hydrolase activity (K), soil respiration (L) outside, between and under solar panels. Error bars are means ± SE; different lower-case letters indicate significant differences (p < 0.05).
Solar panels further decreased soil temperature, total carbon and total nitrogen contents but did not significantly change soil water content and C:N (ratio (Table 3; Supplementary Appendix S6). Between solar panels, the soil temperature was about 30% higher than under solar panels Table 4.
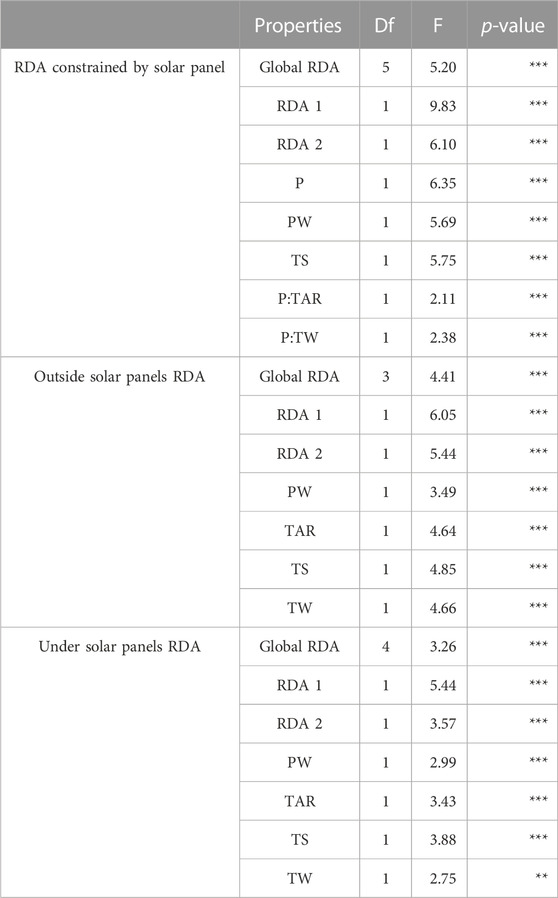
TABLE 3. PERMANOVA results (RDA) of panel and climate effects on plant communities of solar parks. Degree of freedom, ANOVA F values and significance: . p < 0.1, *p < 0.05, **p < 0.01, ***p < 0.001. P: solar panels, PW: precipitation of the wettest month, TAR: annual temperature range, TS: temperature seasonality, TW: temperature of the wettest quarter.
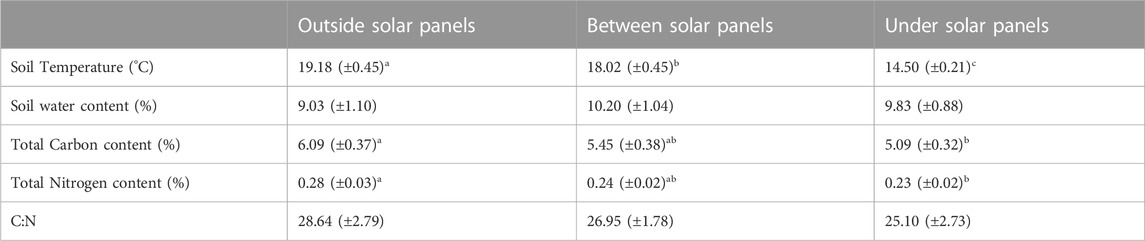
TABLE 4. Effect of solar panels on physico-chemical characteristics. Mean values with standard errors in parentheses. Different letters indicate significant differences (p < 0.05) between positions outside, between and under panels.
No significant differences were found between the different modalities for AM fungi, Bacterial biomass, Actinobacteria, Gram positives biomass, Fungi:Bacteria and Microbial biomass (respectively Figures 4D–F, H, I).
3.3 Effects of solar panels on interaction networks
Outside panels, the most parsimonious model for predicting soil bacterial biomass, springtail abundance and CO2 effluxes included precipitation, temperature, plant cover and total C contents as significant explanatory variables. The model was characterized by ten significant relationships. Plant cover, the abundance of soil organisms and CO2 effluxes were mainly controlled by mean annual temperature and precipitation. Annual precipitation had an indirect effect on CO2 effluxes via the influence on bacterial biomass (−), vegetation cover (+), and soil organic carbon concentrations (+) (Figure 5A). An increase in vegetation cover and then total C content led to an increase in springtail abundance.
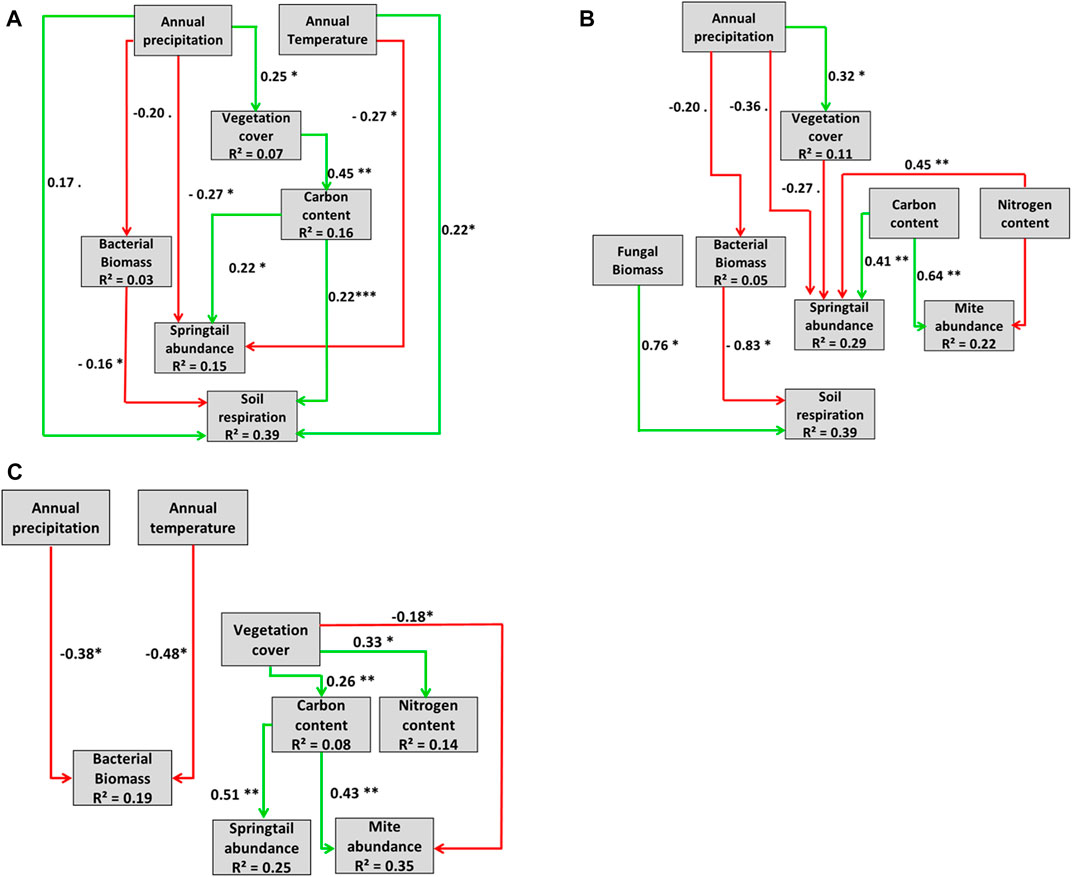
FIGURE 5. Path analysis models. Causal influence of mean annual precipitation (mm) and temperature (°C) on vegetation cover (%), total nitrogen content (N%), total carbon (C%), bacterial biomass, fungi biomass, springtails abundance, mites abundance and soil respiration (µmolCO2. s-1) (A) outside (d.f. = 9, χ2 = 3.26, p = 095, RMSEA = 0.00, CFI = 1.00, TLI = 1.42), (B) between solar panels (d.f. = 21, χ2 = 31.17, p = 0.07, RMSEA = 0.09, CFI = 0.94, TLI = 0.90), and (C) under solar panels (d.f. = 11, χ2 = 12.02, p = 0.36, RMSEA = 0.04, CFI = 0.99, TLI = 0.97). Green arrows represent positive, red arrows negative relationships. Significance levels are indicated as ***p < 0.001, **p < 0.01, p < 0.05, .p < 0.1). Non-significant paths (p > 0.1) were eliminated.
Between solar panels, the most parsimonious model for predicting soil bacterial biomass, abundance of mesofauna organisms and CO2 effluxes included precipitation, plant cover and C and N contents as significant explicative variables (Figure 5B). The model is characterized by ten significant relationships. Plant cover, abundance of soil organisms and CO2 effluxes were mainly controlled by mean annual precipitation. Collembola and mites were affected by organic carbon (+) and nitrogen content (−) and springtails additionally by vegetation cover (+). CO2 effluxes increased with fungi biomass increase and bacterial biomass decrease.
Under panels, the most parsimonious model for predicting soil bacterial biomass and abundance of mesofauna organisms included precipitation, temperature, plant cover and C and N contents as significant explicative variables (Figure 5C). The model is characterized by seven significant relations. Annual mean temperature and precipitation controlled microbial biomass (−) only. Vegetation cover directly controlled (−) mite abundance and indirectly (+) springtail abundance by an increase in organic carbon. Although bacterial biomass decreased with increasing precipitation, CO2 effluxes under panels were explained by climatic, chemical, and biological variables. Similarly to the SEM outside and between panel, no significant interaction between bacterial biomass and mesofauna abundance was detected.
4 Discussion
Plant community composition outside solar panels was driven by climatic variables and reflected the climate gradient. Vegetation under solar panels varied less between the solar parks than vegetation outside panels indicating a homogenizing effect of panels on plant community composition. Solar panels affected the soil mesofauna and two microbial groups (fungi and gram-negative bacteria), and reduced the effects of annual precipitation and temperature on soil CO2 effluxes.
4.1 Changes in plant community composition along a climatic gradient in solar parks
In the studied solar parks, plant communities outside panels were distributed along a climatic gradient. Through grading and clearing of vegetation, both soil quality and plant community composition change during the construction of solar park (Armstrong et al., 2016; Lambert et al., 2021). Plant establishment and spatial distribution of communities after a disturbance are driven by local climatic and soil physico-chemical parameters (Zarzycki and Bedla, 2017; Boonman et al., 2021). Chauvier et al. (2021) showed that artificial land cover (i.e., urban and agricultural area) clearly affects plant distribution along a climatic gradient in lower parts of the European Alps. Our results showed that climatic variables such as precipitation of the wettest month and temperature annual range still drive plant community composition of solar parks suggesting that solar parks do not totally disintegrate the relationship between climate and vegetation.
Outside the panels, vegetation was shaped by a climatic gradient, in particular by variations in temperature and precipitation. More precisely, we found that plant community composition was driven by the mean temperature of wettest quarter, temperature seasonality, annual temperature range and the precipitation of the wettest month. Our results suggest a progressive decrease in the sensitivity of plant species towards lower latitude to an increase in temperature variability and in the range of extreme temperature and precipitation conditions characteristic for the more continental climate of our inland sites (Maestre et al., 2009). The solar panels affected plant community composition and formed two distinct communities shaped by temperature. Under panels, mean temperature of the wettest month and annual temperature range had a smaller effect on plant communities than outside panels. Plant composition of grasslands is often driven by climate-related water availability (Cherwin and Knapp, 2012; Cleland et al., 2013). Armstrong et al. (2016) reported a buffer effect of panels on climatic variations leading to a reduction of ecological niche amplitude and a decrease in plant richness under a temperate-oceanic climate. We also observed a decrease in plant species richness under solar panels. In semi-natural dry grasslands, plants are often more affected by the lack of precipitation during the wettest months in autumn and winter (Dostalek and Frantik, 2011; Fischer et al., 2014). Rainfall during these periods is essential for seed germination and provides a soil water stock for the dry summer. Reduced rainfall under the panels may have limited plant establishment (Akinci, 2013; Lambert et al., 2022).
Contrary to Uldrijan et al. (2022) who showed that the cover of heliophilous plants was greater under the panels in the Czech Republic, we found that the light reduction under panels resulted in a shift from heliophilous to shade-tolerant plant species that are more competitive under such conditions (Chen et al., 2004). This reduction of light also resulted in an increase in chlorophyll content, confirming the results of Lambert et al. (2022) who found a higher chlorophyll content in leaves of Brachypodium retusum under panels. Solar panels change the metabolism of the plants that need to allocate more resources to the production of chlorophyll in order to maintain a sufficient photosynthetic activity under panels (Ma et al., 2010). This higher resource allocation in chlorophyll production may have resulted in a reduction of leave, root and flower biomass. Total vegetation cover and species richness were smaller under solar panels which may be a consequence such a reduction in plant performance. These changes in plant performance and plant community composition may affect ecological functioning. Uldrijan et al. (2022) showed that plant species under solar panels had fewer interactions with other taxa than species than outside panels. Such changes in the number of interactions may negatively affect ecosystem services provided by natural grasslands such as carbon sequestration (Uldrijan et al., 2022).
4.2 Effects of solar panels on soil physico-chemical and biological properties
During daytime, we measured a clear reduction of temperature by 4°C under solar panels confirming results of Moscatelli et al. (2022) and Lambert et al. (2021) under similar Mediterranean climate. However, continuous measurements showed a homogenizing effect of solar panels on temperature being lower during daytime but higher at night (Armstrong et al., 2016). Solar panels intercept rainfalls but reduce evapotranspiration (Lambert et al., 2021) resulting in non-significant panel effects on soil moisture. Accordingly, the area between panels (inter-rows) still affected by shading of panels but not protected from rainfall showed the highest soil moisture. Effects of panels on soil temperature and moisture may further depend on seasonal variations (Armstrong et al., 2016). Lower C and N contents were observed under panels resulting from a lower plant biomass production and subsequently a lower organic matter content.
We found that FDAse activity, soil respiration and microbial biomass were reduced under solar panels. Climate and organic matter content are the most important drivers of soil microbial biomass and activities (Craine et al., 2012). Fluctuations in climatic parameters such as warming or drought may have important consequences for microbial activities (Brinkman and Sombroek, 1996). Microbial biomass and activities are indicators of soil functioning because they are involved in the decomposition of soil organic matter and provisioning of nutrients controlling plant growth (Abrahão et al., 2022). The lower FDase activity may be related to the lower microbial biomass under panels, especially of gram-negative bacteria. Gram-negative bacteria are particularly sensitive to drought and lower temperatures. Bacteria interact with the soil mesofauna to recycle nutrients and sequester carbon (Basile-Doelsch et al., 2020), a key ecosystem service provided by semi-natural grasslands (Bengtsson et al., 2019). In our study, the lower abundance of mites and springtails under panels may be explained by the reduction of soil temperature but also by a lower plant biomass. Mesofaunal soil communities are particularly sensitive to temperature changes. Aupic-Samain et al. (2018, 2021) showed that abundance and diversity of the mesofauna organisms were lower in systems with lower temperatures. Moreover, the lower content in soil organic carbon under panels limits the growth of such microbial and mesofaunal decomposers.
4.3 Effects of solar panels on trophic interactions in the soil
Path analysis revealed either positive indirect (via organic carbon content) or negative direct effects of vegetation cover on soil mesofauna. An increase in plant cover increases the soil organic matter content, a food source for springtails that contribute to the microfragmentation of leaf litter (Berg and Laskowski, 2005). The negative direct effects of plant cover may be explained by a lower plant diversity in most productive plant communities. Zhang et al. (2022) reported in a metanalysis that soil fauna is most abundant and diverse in plant mixtures of high diversity through an increase in microhabitat complexity. Solar panels decreased plant diversity in our study and thus microhabitat diversity. In contrast, panels did not affect the positive indirect effect of vegetation cover on the abundance of mesofauna organisms. This result suggests that changes in microclimate under panels changed resource availability for such decomposers (Aupic-Samain et al., 2021).
In this study, we did not observe an effect of plant cover on microbial biomass and related interactions along the climatic along the climate gradient, neither outside nor under panels. However, plant litter is known to supply nutrients to soil microbes, and root exudates and rhizodeposition attract bacteria, fungi and nematodes (Chakraborty et al., 2012) suggesting that microbial communities are more sensitive to changes in climate than in plant cover. Changes in mean annual temperature and precipitation were the main drivers of bacterial biomass. Drenovsky et al. (2010) showed under a Mediterranean climate that land-use type and level of soil disturbance (i.e., tillage and irrigation regimes) are more important factors for the composition and biomass of the microbial community than vegetation.
We found more trophic interactions between panels compared to outside and under panels suggesting a protection effect of panels between rows on the soil food web. In the gap between panels, wind, albedo, soil temperature and solar radiation are generally lower than outside panels (Armstrong et al., 2014). Under panels, the effect of mean annual temperature and precipitation on trophic interactions diminished. The result may be explained by the homogenizing effect of panels on climate reducing maximum temperatures during daytime and summer and increasing minimum temperatures at night and during winter (Armstrong et al., 2016). Changes in precipitation and temperature are likely resulting in changes in the soil biodiversity and can alter soil biological processes and functions with potential consequences for ecosystem services (Pritchard, 2011; Nielsen and Ball, 2015). Soil CO2 emission is an indicator of soil organic matter decomposition which integrates several biotic and abiotic components. CO2 effluxes mainly depend on soil heterotrophic organisms (bacteria, fungi and fauna), plant roots (Bond-Lamberty et al., 2004; Moinet et al., 2019), soil temperature and moisture (Moinet et al., 2019). By changing plant communities, soil organisms and microclimate, the panels reduced direct and indirect effects of organisms in lower trophic levels, of mean annual temperature and of precipitation on CO2 effluxes. Solar panels may thus limit ecosystem services such as carbon sequestration and nutrient cycling.
5 Conclusion
In solar parks, grassland communities were shaped by climatic factors such as semi-natural grasslands but solar panels partially disintegrate the relationship between climate and plant species composition. Solar panels changed plant communities towards more shade-tolerant species, reduced plant diversity and vegetation cover, and affected plant performance. Thus, solar parks allow the establishment of semi-natural grassland communities but this establishment is limited under solar panels. Changes in soil microclimate and lower plant productivity under panels negatively affected the abundance and composition of soil organisms, trophic interactions, and CO2 effluxes. Ecosystem services provided by soil organisms such as carbon storage, nutrient regulation, and soil conservation, are thus hampered by solar panels. The ecological integration of solar parks to favour the establishment of semi-natural grasslands needs to limit the effect of panels on plant communities and soil quality, for example, by increasing inter-row space or panel height.
Data availability statement
The raw data supporting the conclusion of this article will be made available by the authors, without undue reservation.
Author contributions
QL, AB, and RG contributed to conception and design of the study. QL organized the database. QL, ME, AB, and RG contributed to fields sampling. QL, AB, and RG performed the statistical analysis. QL wrote the first draft of the manuscript. All authors contributed to manuscript revision, read, and approved the submitted version.
Funding
Funding was provided by the French Agency for Environmental Transition (ADEME) via a PhD grant to Quentin Lambert and the project PIESO (agreement N°1405C0035).
Acknowledgments
We thank Pierre Illac and Marine David (TotalEnergie renouvelables), Julie pastor (EDF renouvelables), Marion Henriet (Cap Vert Energie), Jerôme Wampack (Cap Vert Energie), Alexandre Cluchier (ECO-MED) and Camille Rolin (Compagnie Nationale du Rhône) for their logistic support. We further thank Morgane Enea, Amélie Augier, Cassandra Favale, Léo Rocher, Lisa Foli,, Caroline Lecareux for assistance in the lab and in the field. We are particularly grateful to Daniel Pavon for his precious help in plant identification.
Conflict of interest
The authors declare that the research was conducted in the absence of any commercial or financial relationships that could be construed as a potential conflict of interest.
Publisher’s note
All claims expressed in this article are solely those of the authors and do not necessarily represent those of their affiliated organizations, or those of the publisher, the editors and the reviewers. Any product that may be evaluated in this article, or claim that may be made by its manufacturer, is not guaranteed or endorsed by the publisher.
Supplementary material
The Supplementary Material for this article can be found online at: https://www.frontiersin.org/articles/10.3389/fenvs.2023.1137845/full#supplementary-material
References
Abrahão, A., Marhan, S., Boeddinghaus, R. S., Nawaz, A., Wubet, T., Hölzel, N., et al. (2022). Microbial drivers of plant richness and productivity in a grassland restoration experiment along a gradient of land-use intensity. New Phytol. 236, 1936–1950. doi:10.1111/nph.18503
Agati, G., Cerovic, Z. G., Pinelli, P., and Tattini, M. (2011). Light-induced accumulation of ortho-dihydroxylated flavonoids as non-destructively monitored by chlorophyll fluorescence excitation techniques. Environ. Exp. Bot. 73, 3–9. doi:10.1016/j.envexpbot.2010.10.002
Armstrong, A., Waldron, S., Whitaker, J., and Ostle, N. J. (2014). Wind farm and solar park effects on plant–soil carbon cycling: uncertain impacts of changes in ground-level microclimate. Glob. Change Biol. 20, 1699–1706. doi:10.1111/gcb.12437
Armstrong, A., Ostle, N. J., and Whitaker, J. (2016). Solar park microclimate and vegetation management effects on grassland carbon cycling. Environ. Res. Lett. 11, 074016. doi:10.1088/1748-9326/11/7/074016
Aupic-Samain, A., Santonja, M., Chomel, M., Pereira, S., Quer, E., Lecareux, C., et al. (2021). Soil biota response to experimental rainfall reduction depends on the dominant tree species in mature northern Mediterranean forests. Soil Biol. Biochem. 154, 108122. doi:10.1016/j.soilbio.2020.108122
Aupic-Samain, A., Santonja, M., Forey, E., and Chauvat, M. (2018). Increasing temperature and decreasing specific leaf area amplify centipede predation impact on Collembola. Eur. J. Soil Biol. 89, 9–13. doi:10.1016/j.ejsobi.2018.08.002
Barnett, K. L., and Facey, S. L. (2016). Grasslands, invertebrates, and precipitation: A review of the effects of climate change. Front. Plant Sci. 7, 1196. doi:10.3389/fpls.2016.01196
Basile-Doelsch, I., Balesdent, J., and Pellerin, S. (2020). Reviews and syntheses: The mechanisms underlying carbon storage in soil. Biogeosciences 17, 5223–5242. doi:10.5194/bg-17-5223-2020
Bengtsson, J., Bullock, J. M., Egoh, B., Everson, C., Everson, T., O’Connor, T., et al. (2019). Grasslands—More important for ecosystem services than you might think. Ecosphere 10, e02582. doi:10.1002/ecs2.2582
Berg, B., and Laskowski, R. (2005). “Changes in substrate composition and rate-regulating factors during decomposition,” in Advances in ecological research (Academic Press), 101–155. doi:10.1016/S0065-2504(05)38004-4
Bond-Lamberty, B., Wang, C., and Gower, S. T. (2004). A global relationship between the heterotrophic and autotrophic components of soil respiration? Glob. Change Biol. 10, 1756–1766. doi:10.1111/j.1365-2486.2004.00816.x
Boonman, C. C. F., Santini, L., Robroek, B. J. M., Hoeks, S., Kelderman, S., Dengler, J., et al. (2021). Plant functional and taxonomic diversity in European grasslands along climatic gradients. J. Veg. Sci. 32, e13027. doi:10.1111/jvs.13027
Brinkman, R., and Sombroek, W. G. (1996). “The effects of global change on soil conditions in relation to plant growth and food production,” in Global climate change and agricultural production, 49–63.
Buyer, J. S., and Sasser, M. (2012). High throughput phospholipid fatty acid analysis of soils. Appl. Soil Ecol. 61, 127–130. doi:10.1016/j.apsoil.2012.06.005
Chakraborty, S., Pangga, I. B., and Roper, M. M. (2012). Climate change and multitrophic interactions in soil: The primacy of plants and functional domains. Glob. Change Biol. 18, 2111–2125. doi:10.1111/j.1365-2486.2012.02667.x
Chauvier, Y., Thuiller, W., Brun, P., Lavergne, S., Descombes, P., Karger, D. N., et al. (2021). Influence of climate, soil, and land cover on plant species distribution in the European Alps. Ecol. Monogr. 91, e01433. doi:10.1002/ecm.1433
Chen, M., Chory, J., and Fankhauser, C. (2004). Light signal transduction in higher plants. Annu. Rev. Genet. 38, 87–117. doi:10.1146/annurev.genet.38.072902.092259
Cherwin, K., and Knapp, A. (2012). Unexpected patterns of sensitivity to drought in three semi-arid grasslands. Oecologia 169, 845–852. doi:10.1007/s00442-011-2235-2
Choi, C. S., Cagle, A. E., Macknick, J., Bloom, D. E., Caplan, J. S., and Ravi, S. (2020). Effects of revegetation on soil physical and chemical properties in solar photovoltaic infrastructure. Front. Environ. Sci. 8. doi:10.3389/fenvs.2020.00140
Cleland, E. E., Collins, S. L., Dickson, T. L., Farrer, E. C., Gross, K. L., Gherardi, L. A., et al. (2013). Sensitivity of grassland plant community composition to spatial vs. temporal variation in precipitation. Ecology 94, 1687–1696. doi:10.1890/12-1006.1
Craine, J. M., Nippert, J. B., Elmore, A. J., Skibbe, A. M., Hutchinson, S. L., and Brunsell, N. A. (2012). Timing of climate variability and grassland productivity. Proc. Natl. Acad. Sci. 109, 3401–3405. doi:10.1073/pnas.1118438109
Dostalek, J., and Frantik, T. (2011). Response of dry grassland vegetation to fluctuations in weather conditions: A 9-year case study in prague (Czech republic). Biologia 66, 837–847. doi:10.2478/s11756-011-0079-1
Drenovsky, R. E., Steenwerth, K. L., Jackson, L. E., and Scow, K. M. (2010). Land use and climatic factors structure regional patterns in soil microbial communities. Glob. Ecol. Biogeogr. 19, 27–39. doi:10.1111/j.1466-8238.2009.00486.x
Ellenberg, H., Weber, H., Düll, R., Wirth, V., Erner, W., and Paulissen, D. (1992). Zeigwerte von Pflanzen in Mitteleuropa. Scripta Geobotaníka-Gottingen.
Fick, S. E., and Hijmans, R. J. (2017). WorldClim 2: New 1-km spatial resolution climate surfaces for global land areas. Int. J. Climatol. 37, 4302–4315. doi:10.1002/joc.5086
Fischer, C., Roscher, C., Jensen, B., Eisenhauer, N., Baade, J., Attinger, S., et al. (2014). How do earthworms, soil texture and plant composition affect infiltration along an experimental plant diversity gradient in grassland? PLOS ONE 9, e98987. doi:10.1371/journal.pone.0098987
Frostegård, Å., Tunlid, A., and Bååth, E. (1993). Phospholipid fatty acid composition, biomass, and activity of microbial communities from two soil types experimentally exposed to different heavy metals. Appl. Environ. Microbiol. 59, 3605–3617. doi:10.1128/aem.59.11.3605-3617.1993
Gang, C., Zhou, W., Chen, Y., Wang, Z., Sun, Z., Li, J., et al. (2014). Quantitative assessment of the contributions of climate change and human activities on global grassland degradation. Environ. Earth Sci. 72, 4273–4282. doi:10.1007/s12665-014-3322-6
Green, V. S., Stott, D. E., and Diack, M. (2006). Assay for fluorescein diacetate hydrolytic activity: Optimization for soil samples. Soil Biol. Biochem. 38, 693–701. doi:10.1016/j.soilbio.2005.06.020
Guénon, R., Day, T. A., Velazco-Ayuso, S., and Gros, R. (2017). Mixing of Aleppo pine and Holm oak litter increases biochemical diversity and alleviates N limitations of microbial activity. Soil Bio. Biochemi. 105, 216–226. doi:10.1016/j.soilbio.2016.11.023
Habel, J. C., Dengler, J., Janišová, M., Török, P., Wellstein, C., and Wiezik, M. (2013). European grassland ecosystems: Threatened hotspots of biodiversity. Biodivers. Conservation 22, 2131–2138. doi:10.1007/s10531-013-0537-x
Hernandez, R. R., Armstrong, A., Burney, J., Ryan, G., Moore-O’Leary, K., Diédhiou, I., et al. (2019). Techno–ecological synergies of solar energy for global sustainability. Nat. Sustain. 2, 560–568. doi:10.1038/s41893-019-0309-z
Hernandez, R. R., Easter, S. B., Murphy-Mariscal, M. L., Maestre, F. T., Tavassoli, M., Allen, E. B., et al. (2014). Environmental impacts of utility-scale solar energy. Renew. Sustain. Energy Rev. 29, 766–779. doi:10.1016/j.rser.2013.08.041
Isbell, F., Adler, P. R., Eisenhauer, N., Fornara, D., Kimmel, K., Kremen, C., et al. (2017). Benefits of increasing plant diversity in sustainable agroecosystems. J. Ecol. 105, 871–879. doi:10.1111/1365-2745.12789
Julve, P. (1998). Baseflor. Index botanique, écologique et chorologique de la flore de France. Version: Oct 4th 2022.
Lambert, Q., Bischoff, A., Cueff, S., Cluchier, A., and Gros, R. (2021). Effects of solar park construction and solar panels on soil quality, microclimate, CO2 effluxes, and vegetation under a Mediterranean climate. Land Degrad. Dev. 32, 5190–5202. doi:10.1002/ldr.4101
Lambert, Q., Gros, R., and Bischoff, A. (2022). Ecological restoration of solar park plant communities and the effect of solar panels. Ecol. Eng. 182, 106722. doi:10.1016/j.ecoleng.2022.106722
Ma, Z., Li, S., Zhang, M., Jiang, S., and Xiao, Y. (2010). Light intensity affects growth, photosynthetic capability, and total flavonoid accumulation of anoectochilus plants. HortScience 45, 863–867. doi:10.21273/HORTSCI.45.6.863
Maestre, F. T., Callaway, R. M., Valladares, F., and Lortie, C. J. (2009). Refining the stress-gradient hypothesis for competition and facilitation in plant communities. J. Ecol. 97, 199–205. doi:10.1111/j.1365-2745.2008.01476.x
Malcolm, J. R., Liu, C., Neilson, R. P., Hansen, L., and Hannah, L. (2006). Global warming and extinctions of endemic species from biodiversity hotspots. Conserv. Biol. 20, 538–548. doi:10.1111/j.1523-1739.2006.00364.x
Moinet, G. Y. K., Midwood, A. J., Hunt, J. E., Rumpel, C., Millard, P., and Chabbi, A. (2019). Grassland management influences the response of soil respiration to drought. Agron. Basel 9, 124. doi:10.3390/agronomy9030124
Moradi, J., Mudrák, O., Kukla, J., Vicentini, F., Šimáčková, H., and Frouz, J. (2017). Variations in soil chemical properties, microbial biomass, and faunal populations as related to plant functional traits, patch types, and successional stages at Sokolov post-mining site - a case study. Eur. J. Soil Biol. 83, 58–64. doi:10.1016/j.ejsobi.2017.10.001
Moscatelli, M. C., Marabottini, R., Massaccesi, L., and Marinari, S. (2022). Soil properties changes after seven years of ground mounted photovoltaic panels in Central Italy coastal area. Geoderma Reg. 29, e00500. doi:10.1016/j.geodrs.2022.e00500
Nielsen, U. N., and Ball, B. A. (2015). Impacts of altered precipitation regimes on soil communities and biogeochemistry in arid and semi-arid ecosystems. Glob. Change Biol. 21, 1407–1421. doi:10.1111/gcb.12789
Peterson, R. A. (2021). Finding optimal normalizing transformations via bestNormalize. R J. 13, 310. doi:10.32614/rj-2021-041
Pritchard, S. G. (2011). Soil organisms and global climate change. Plant Pathol. 60, 82–99. doi:10.1111/j.1365-3059.2010.02405.x
Pulungan, M. A., Suzuki, S., Gavina, M. K. A., Tubay, J. M., Ito, H., Nii, M., et al. (2019). Grazing enhances species diversity in grassland communities. Sci. Rep. 9, 11201. doi:10.1038/s41598-019-47635-1
Rosseel, Y. (2012). lavaan: An R package for structural equation modeling. J. stati. software 48, 1–36.
Steinauer, K., Tilman, D., Wragg, P. D., Cesarz, S., Cowles, J. M., Pritsch, K., et al. (2015). Plant diversity effects on soil microbial functions and enzymes are stronger than warming in a grassland experiment. Ecology 96, 99–112. doi:10.1890/14-0088.1
Uldrijan, D., Černý, M., and Winkler, J. (2022). Solar park – opportunity or threat for vegetation and ecosystem. J. Ecol. Eng. 23, 1–10. doi:10.12911/22998993/153456
Uldrijan, D., Kováčiková, M., Jakimiuk, A., Vaverková, M. D., and Winkler, J. (2021). Ecological effects of preferential vegetation composition developed on sites with photovoltaic power plants. Ecol. Eng. 168, 106274. doi:10.1016/j.ecoleng.2021.106274
van de Ven, D-J., Capellan-Peréz, I., Arto, I., Cazcarro, I., de Castro, C., Patel, P., et al. (2021). The potential land requirements and related land use change emissions of solar energy. Sci. Rep. 11, 2907. doi:10.1038/s41598-021-82042-5
Whiles, M. R., and Charlton, R. E. (2006). The ecological significance of tallgrass prairie arthropods. Annu. Rev. Entomol. 51, 387–412. doi:10.1146/annurev.ento.51.110104.151136
Wilson, J. B., Peet, R. K., Dengler, J., and Pärtel, M. (2012). Plant species richness: The world records. J. Veg. Sci. 23, 796–802. doi:10.1111/j.1654-1103.2012.01400.x
Xia, Y., and Yang, Y. (2019). RMSEA, CFI, and TLI in structural equation modeling with ordered categorical data: The story they tell depends on the estimation methods Behav. Res. Methods 51, 409–428. doi:10.3758/s13428-018-1055-2
Zak, D. R., Holmes, W. E., White, D. C., Peacock, A. D., and Tilman, D. (2003). Plant diversity, soil microbial communities, and ecosystem function: Are there any links? Ecology 84, 2042–2050. doi:10.1890/02-0433
Zarzycki, J., and Bedla, D. (2017). The influence of past land-use and environmental factors on grassland species diversity. Appl. Ecol. Environ. Res. 15, 267–278. doi:10.15666/aeer/1504_267278
Keywords: solar parks, biodiversity, plant, soil, trophic interactions, mesofauna
Citation: Lambert Q, Bischoff A, Enea M and Gros R (2023) Photovoltaic power stations: an opportunity to promote European semi-natural grasslands?. Front. Environ. Sci. 11:1137845. doi: 10.3389/fenvs.2023.1137845
Received: 27 January 2023; Accepted: 31 May 2023;
Published: 22 June 2023.
Edited by:
Arnaldo Marín, University of Murcia, SpainReviewed by:
A. M. Keith, UK Centre for Ecology and Hydrology (UKCEH), United KingdomJana Müllerová, Jan Evangelista Purkyně University in Ústí nad Labem, Czechia
Copyright © 2023 Lambert, Bischoff, Enea and Gros. This is an open-access article distributed under the terms of the Creative Commons Attribution License (CC BY). The use, distribution or reproduction in other forums is permitted, provided the original author(s) and the copyright owner(s) are credited and that the original publication in this journal is cited, in accordance with accepted academic practice. No use, distribution or reproduction is permitted which does not comply with these terms.
*Correspondence: Quentin Lambert, cW50bmxtYnJ0QGdtYWlsLmNvbQ==