 Ying Cong
 Yanxu Wang
- School of Investment and Construction Management, Dongbei University of Finance and Economics, Dalian, China
Carbon emissions generated by household activities are an important factor in climate change; reducing household carbon emissions (HCEs) will be an essential part of future energy conservation and sustainability initiatives. Housing prices have a crucial impact on residents’ consumption, and the increase of consumption level is the main reason for the rise of household carbon emissions. Therefore, studying the impact of housing prices on HCEs not only provides guidance on expanding domestic demand and increasing consumption from the perspective of housing prices but also provides construction advice on curbing global warming and is more conducive to the development of building sustainable consumption. Taking household consumption as a starting point, this study investigates the impact of house prices on HCE in China based on the 2018 Chinese Household Tracking Survey (CFPS) and the China Energy Statistics Yearbook, using the carbon emission factor method to measure carbon emissions. It was found that increased house prices had a significant positive effect on HCEs. There is a clear wealth effect of rising house prices among homeowners, while the substitution effect also increases consumption among non-homeowners (by reducing attempts to save). Furthermore, rising house prices have a varied effect on different types of HCEs. The impact on emissions from everyday necessities such as clothing and housing is greater, and the impact on entertainment-related carbon emissions is small. In addition, rising house prices had the strongest effect on HCEs in central China. Homeowners in the east responded more to increased house prices than in the west, while the inverse effect was observed among non-homeowners. Urban homeowners and rural non-homeowners were also more sensitive to rising house prices. Policy recommendations are made based on the findings.
1 Introduction
The death rate from heat stroke reached a new a record high in 2022, and global warming is becoming increasingly severe (Global Burden of Disease Collaborative Network and Global Burden of Disease Study, 2019). There is global consensus that global warming needs to be slowed through energy saving and emission reduction. Carbon dioxide is the greenhouse gas with the greatest impact on the climate; according to the World Meteorological Organization’s Greenhouse Gas Bulletin, by 2020, carbon dioxide concentrations had reached 149% of preindustrial levels, and the warming effect on the climate had increased by 47% over the previous 30 years, with carbon dioxide contributing up to 80% of this warming effect. Research on carbon emissions has long focused on carbon emissions at the production level and neglected the consumption level. With rapid economic development, individuals’ income and consumption have increased dramatically; some studies have shown a strong correlation between carbon emissions and public consumption levels. The United Nations Environment Programme’s 2020 Emissions Gap Report states that household consumption currently accounts for approximately two-thirds of total greenhouse gas emissions (United Nations Environment Programme, 2020). The Chinese Academy of Sciences has also reported that 53% of total carbon emissions are generated by household consumption; they claimed that accelerating the transformation of lifestyles among the general public has become an essential part of mitigating climate change.
Against the background of urbanization and rapid economic development, house prices in China have continued to rise. For homeowners, the appreciation of housing assets, which typically account for a large share of their total assets, changes the scale of household consumption. For non-homeowners, rising house prices cause an increase in rent expenditure, which also affects the scale of household consumption. This raises the question of whether rising house prices have affected household carbon emissions (HCEs). Do rising house prices have a wealth effect on homeowners’ HCEs? Is there a substitution effect between non-homeowners’ consumption and savings that affects their HCEs? Currently, house prices remain persistently high while there is the expectation of a reduction in carbon emissions; accordingly, this paper conducts a study on the impact of house prices on HCEs. Carbon emission reduction faces difficulties such as fragmentation and accounting difficulties. Thus, exploring public participation in carbon emission reduction taking households as a unit can significantly inform the development of a sustainable future for everyone.
2 Literature review
2.1 Rising house prices and consumption
Urbanization brings economic growth and raises the price of real estate. Wang et al. (He and Shaojun, 2017) argued that while the urban agglomeration effect promotes economic growth, it also has a negative impact, causing a mismatch between land and housing supply and population movements toward economically developed cities. Accordingly, housing demand increases, pushing up house prices. Weizeng et al. (Weizeng and Siqi, 2016) argued that increased urbanization drives house price expectations and ultimately causes house prices to rise. It has been suggested that urbanization will continue to be the main factor driving housing demand in the future (Kesha, 2017). Thus, both supply- and demand-oriented market forces have consistently increased house prices, widening the housing wealth gap and forming a wealthy class whose wealth is based on housing, which is replacing traditional determinants of social class such as income, education, and occupation (Hang et al. (Bin and Lei, 2016); Min (Xueqin, 2011)).
Furthermore, house prices affect household consumption. However, scholars both in China and internationally have failed to establish a unified view on their relationship. Existing views can be divided into the following three categories: first, house prices and household consumption are positively correlated; that is, rising house prices boost household consumption. For homeowners, the rise in house prices increases housing wealth and thus increases consumption. Using survey data from the United Kingdom, Campbell and Cocco (Campbell and Cocco, 2007) empirically verified that house price increases have a wealth effect; house prices are positively related to consumption. Rising house prices may also boost consumption among non-homeowners through a substitution effect. Li et al. (Li et al., 2013) studied the relationship between rising house prices and residents’ propensity to consume in China and showed that rising house prices caused non-homeowners to abandon the purchase of housing and expand their consumption instead, increasing their average propensity to consume.
The second view is that house prices are negatively related to household consumption; that is, rising house prices inhibit household consumption. Sheiner (Sheiner, 1995) showed that any increase in the consumption of homeowners due to rising house prices may be offset by the increased savings of potential home-buying households, reducing current consumption. Shaobo et al. (2016) also argued that rising house prices make homeownership more expensive for non-homeowners, requiring residents to save more and consume less. Zhang et al. (Yalin et al., 2019) argue that rising house prices lead to new home buyers facing large housing debt, and a study by Yalin Zhang et al. shows that housing debt can crowd out development and enjoyment-oriented consumption, creating disincentives to consumption.
The third line of literature suggests that the effect of house prices on household consumption is not significant. That is, the wealth effect may be cancelled out by negative impacts of rising house prices on consumption. Phang (2004) showed that the increase in house prices in Singapore did not have a significant impact on total consumption. Furthermore, Poterba (2000) and Li and Chen (Tao and Binkai, 2014) argued that housing assets have the attributes of consumer goods, and an increase in house prices thus leads to an increase in household wealth. At the same time, the cost of housing as a consumer good has also increased, so the impact of house price increases on consumption is not significant. In addition, Fisher et al. (Fisher and Montalto, 2010) argued that the wealth effect of housing may lag, and consumption is not affected in the short run.
2.2 Household carbon emissions
It is widely believed that carbon emissions are concentrated in industry. Accordingly, China’s energy consumption policies mainly target industrial production; this approach runs the risk of underestimating the impact of carbon emissions from everyday consumption. Schipper et al. (1989) found that 45%–55% of total energy consumption was influenced by household consumer activity. Bin et al. (Bin and Dowlatabadi, 2005) analyzed the daily consumption of a sample of U.S. residents and found that more than 80% of total energy consumption originated from residents’ daily consumption; direct consumption by residents accounted for 41% of the total. Huang (Huang and Keshen, 2013) and Zhu (Zhiming et al., 2013) argued that the influence of household consumption on urban and rural carbon emissions is prominent, with HCEs being the source of all and the vast majority of carbon emissions for urban and rural residents, respectively. Feng et al. (Ling et al., 2011) examined the carbon emissions of urban residents’ living in China from 1999 to 2007 and concluded that due to the different proportion of each consumer product in household consumption, carbon emission coefficients and carbon emission levels varied across different households.
Household consumption is an important driver of energy consumption and CO2 emissions (Sanquist et al., 2012). In China and internationally, scholars have conducted in-depth studies on carbon emissions caused by household consumption, mainly using the investment-output model and carbon emission coefficient method for measurement. The former is mostly used to measure from a macro perspective, while the latter is mainly used for micro-level analysis. Kim (2002) studied the impact of changes in consumption patterns on carbon emissions in Korea from 1985 to 1995 and concluded that direct energy consumption and demand for high-emission consumer goods were the main factors affecting carbon emissions. Zhen (2011) constructed an input-output model to measure carbon emissions from household consumption, and the results showed that household consumption has a pulling effect on carbon emissions. As for the carbon emission coefficient, this represents the amount of carbon emissions produced per unit of energy consumed during the use of an energy source. According to the IPCC, the carbon emission coefficient of an energy source is generally assumed to be constant when using the carbon emission coefficient method. Yang et al. (2016) used this method to classify household consumption into residential building carbon emissions and transportation carbon emissions. Wang (Qinchi, 2015) measured carbon emission coefficients to obtain direct and indirect HCEs for eight major consumption categories (based on an IPCC categorization). As this method is capable of calculating micro-level HCEs, this study uses it to measure direct and indirect carbon emission coefficients and then measures carbon emissions according to each type of consumption.
In summary, the existing literature shows that urbanization-related rising house prices increase total household wealth and thus impact consumption, but whether the impact is positive or negative has yet to be conclusively established. The current research on the impact of domestic consumption on HCEs mainly focuses on examining the influencing factors behind this impact; it is believed that household characteristics, individual factors, and level of economic development have an impact. Overall, it is assumed that there is a certain statistical relationship between rising house prices and HCEs.
Accordingly, this paper contributes findings by building a theoretical bridge between house prices and HCEs, including identification of the transmission channels and mechanisms by which they are related.
3 Proposed mechanism and research hypotheses
Rising house prices affect the value of housing as an asset as well as the cost of housing as expenditure, both of which affect household consumption. Furthermore, household consumption is highly correlated with HCEs, so rising house prices are likely to impact HCEs. Household consumption is gradually becoming an important driver of energy consumption and HCEs (Zhu (Qin et al., 2012); Peng (Xizhe and Qin, 2010); Zhou et al. (Li and Xingjian, 2020)). For both urban and rural households, household consumption is the source of all or the vast majority of HCEs; HCEs are positively correlated with different household consumption levels (Weber and Matthews, 2008); Wier & Lenzen (Wier et al., 2001); Shang et al. (Mei et al., 2021)).
There are various mechanisms by which house price increases act on consumption, and this is also true for the mechanisms that act on HCEs. Among homeowners, this mechanism is centered on a wealth effect from rising house prices, which can cause an increase in the wealth level of homeowners and thus increase consumption. The former refers to homeowners selling or refinancing their household assets; this increases their actual wealth and boosts consumption (Song (Bo, 2007); Huang and Tu (Jing and Meizeng, 2009)). The unrealized wealth effect occurs when homeowners’ homes are a necessity that cannot be liquidated; an increase in house prices may nonetheless cause an increase in perceived wealth and boost consumption (Yongru, 2008; Huang and Keshen, 2013). The housing “wealth effect” is widespread in China, with home ownership, number of homes, and housing value all contributing to household consumption (Wang Yiqiu et al. (Yiqiu and Ningning, 2019)). Based on the above analysis, the following hypothesis is proposed.
H1:. For homeowners, the wealth effect of rising house prices promotes their consumption-related HCEs.Among renter households, rising house prices may have positive or negative impacts on consumption and HCEs. First, rising house prices make it more difficult for people who are planning to buy a house to afford a purchase; as long as house price rises make this difficult rather than impossible, consumption will be cut as prospective homeowners increase savings, negatively impacting consumption (Yoshikawa (Yoshikawa, 1989); Hang and Yu (Bin and Feng, 2018)). Furthermore, rising house prices will increase rent; if renters’ total income remains unchanged, then consumption may be negatively affected (Zheng (Xiwen, 2018)). However, consumption may be positively affected if potential homebuyers who are facing tighter budget constraints abandon their plans to purchase a home, showing a substitution effect whereby savings are substituted for consumption. Positive or negative changes in household consumption will have a corresponding impact on HCEs. In fact, the excessively rapid rise in house prices in China has led to an increasing house price-to-income ratio, exacerbating consumer behavior of waiting for changes in the real estate market and shifting to other consumption. Based on the above analysis, the following hypothesis is proposed.
H2:. For non-homeowners, an increase in house prices decreases savings and promotes consumption-related HCEs.In summary, this paper analyzes the impact of rising house prices on HCEs from the perspective of home ownership, investigating two separate transmission paths for homeowners and non-homeowners.As shown in Figure 1, this study analyzes the impact of a rise in housing prices on the carbon emission of household consumption from the perspective of housing property rights, which is specifically divided into two transmission paths: families with houses and families without houses.
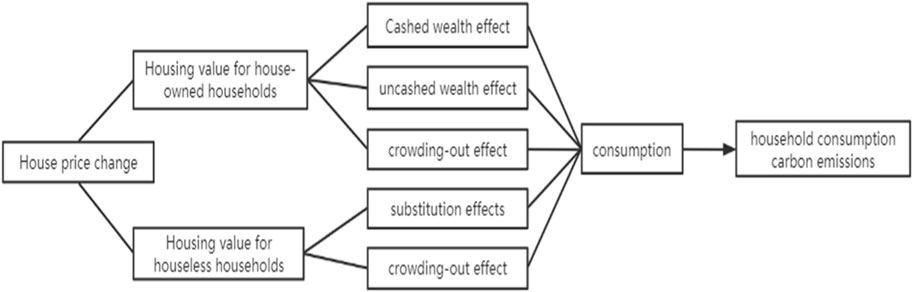
FIGURE 1. Mechanism of action analysis diagram.
4 Measuring carbon emissions from household consumption
4.1 Data sources
The research data in this paper were obtained from the 2018 China Household Tracking Survey (CFPS), the Chinese Statistical Yearbook, and the Chinese Energy Statistical Yearbook. The China Household Tracking Survey (CFPS) is a survey conducted by the Social Science Survey Center of Peking University to reflect the social, economic, and demographic aspects of China by tracking and collecting data at the individual, household, and community levels to provide a database for academic research. The CFPS completed interviews with approximately 15,000 households, with samples distributed in more than 900 districts and counties and more than 3,000 villages. The CFPS2018 questionnaire includes five databases, household member questionnaire, household economic questionnaire, individual self-response questionnaire, individual proxy questionnaire, and teenage parent proxy questionnaire, which were combined for each household using the household financier as the household representative. The data are published for a sample of households in eight consumption categories—food, clothing, household goods and services, healthcare, transportation and communication, other goods and services, and housing—with household consumption derived from calculating different payment types. Different industries consume different energy, and their energy consumption coefficients and calorific values vary, while consumption originates from different production fronts. The data for the energy balance sheets needed to measure carbon emissions from household consumption were obtained from the China Statistical Yearbook and the China Energy Statistical Yearbook for the corresponding years. Housing values as well as housing rent, household income, household characteristics variables, and demographic characteristics variables were obtained from the 2018 China Household Tracking Survey.
4.2 Measurement methods
Household energy consumption includes direct and indirect consumption; thus, carbon emissions from household consumption can also be direct and indirect. Direct carbon emissions are generated by the energy consumed by household members in their daily lives, such as the use of various appliances or other equipment for lighting, heating, cooking, etc., that consume energy sources such as coal, liquefied petroleum gas, and natural gas. Indirect carbon emissions are generated by households’ consumption of various goods and services; they indirectly consume the energy used in the process of producing those goods and services (Ling et al., 2011). In this study, we choose carbon dioxide to measure the carbon emission coefficient (Jingyi, 2021). The industrial data used in our measurement of carbon emission coefficients for direct and indirect energy consumption are obtained from the China Statistical Yearbook and the China Energy Statistical Yearbook.
The calculation of the direct carbon emission coefficient is as follows:
where Ed is direct carbon emissions from household consumption (kg), di is the heat generated from the ith direct energy source consumed by the household (kJ), and αi is the carbon emission coefficient (kg/kJ). Direct carbon emissions are part of HCEs; the formula for calculating the direct household carbon emission coefficient can be expressed as follows:
where ωd is the direct carbon emission coefficient of household consumption (kg/yuan), and I is household housing expenditure (¥).
We calculate the indirect carbon emission coefficient based on the energy balance sheet and each energy emission coefficient. According to the National Bureau of Statistics Classification of Consumer Expenditure, consumer expenditure items are divided into eight categories: clothing; housing; food; household goods and services; transportation and communication; education, culture, and entertainment; healthcare; and other goods and services. Details are shown in Table 1.
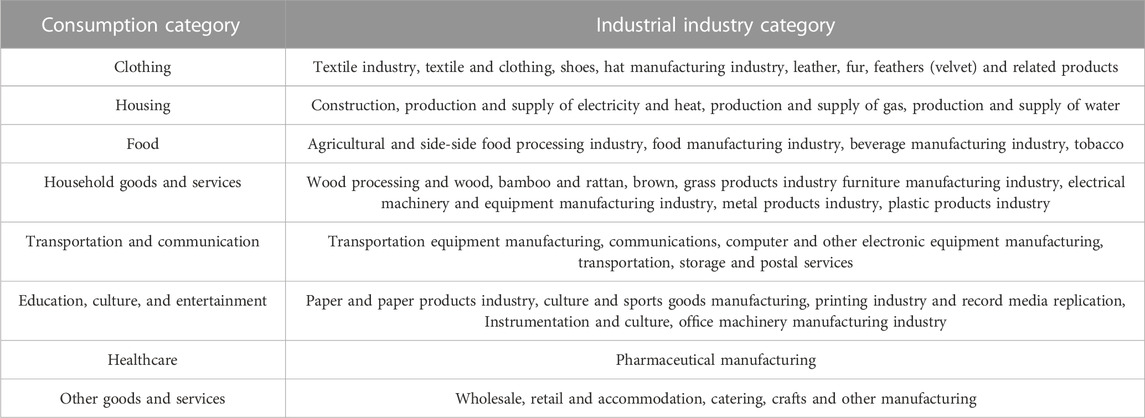
TABLE 1. Industries corresponding to the eight major consumption categories.
Drawing on existing literature, the consumption items are recategorized to obtain the indirect carbon emission coefficient formula:
where βm is the indirect carbon emission coefficient of the mth consumption of the household (kg/yuan), am is the cumulative value added of the industry in the mth consumption (¥), an is the value added of the nth industry in the mth consumption (¥), and fni is the heat generated by the jth energy consumed per unit of value added of the industry n (kJ/yuan).
To generate household consumption carbon emission coefficients, direct and indirect carbon emission coefficients need to be calculated separately and summed. The carbon emission coefficients for different energy sources are shown in Table 2, and the data are obtained from IPCC. The measurement of carbon emission coefficients for the eight categories of household consumption is calculated according to Eq 2, 3, and the results are shown in Table 3.
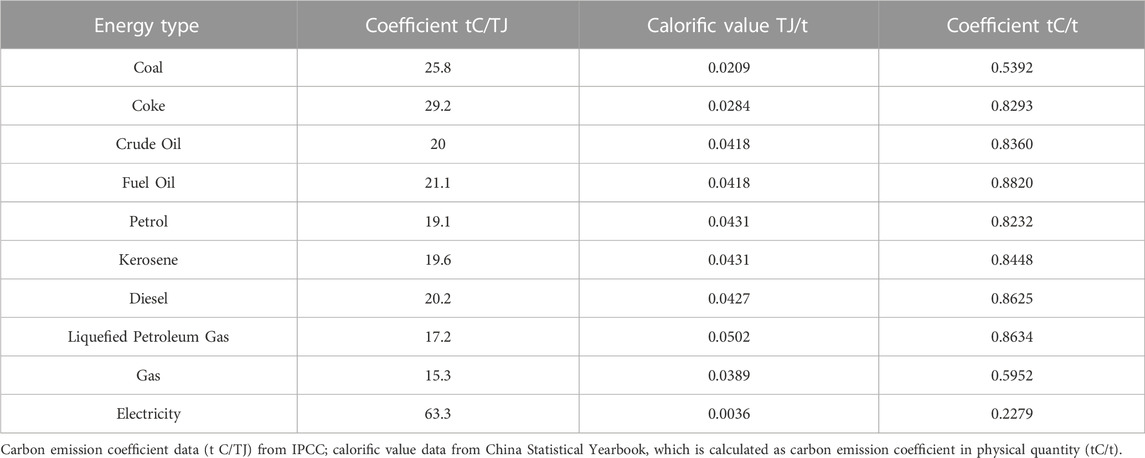
TABLE 2. CO2 emission coefficients for household consumption.
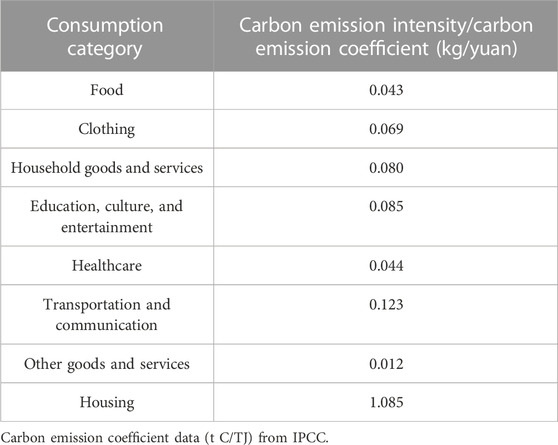
TABLE 3. CO2 emission coefficients by consumption category.
5 Model setting
5.1 Model setting
To study the impact of house price increases on HCEs by home ownership, we establish the following model based on traditional consumption theory to study the effect of house price increases on homeowners’ HCEs using housing value as the explanatory variable:
In examining the impact of rising house prices on non-homeowners’ HCEs, rent was chosen as the explanatory variable, and the model was established as follows:
where
5.2 Variable description
5.2.1 Explained variable
The explained variable is consumption-related HCEs (Household), which is the sum of consumption carbon emissions of food (food); clothing (dress); transportation and communication (trco); healthcare (med); housing (house); household goods and services (daily); education, culture, and entertainment (ecc); and other goods and services (other). Consumption-related HCEs are calculated using the carbon emission factors for each type of consumption and the related carbon emission coefficients.
When studying the effect of house prices on homeowners’ HCEs, the value of the home owned by the household (Housevalue) is used as the explanatory variable; when studying non-homeowners, the logarithmically processed housing rent (Houserent) is chosen as the explanatory variable.
5.2.2 Control variables
A series of variables that have been shown to affect HCEs are used as control variables. The control variables are divided into three categories. First, as an economic variable, we choose household income (Income), which affects consumption and thus HCEs. Second, regarding household characteristics, we include household size (familysize), car ownership (car), the importance the household attaches to education expressed by the number of books in the household collection (fs8), and urban-rural classification (urban18). The third category of variables relates to the household head, including their education (edu), marital status (marriage), gender (gender), and party membership (party). As the concept of household head is not included in the CFPS database, the main financiers in the survey are taken as household heads. In addition, dummy variables for the province in which the household is located were included to control for regional and cultural differences.
After data processing (e.g., merging, shrinking, and removing singular values) and removing invalid samples for the CPFS database, descriptive statistics were produced from the data, and the results are shown in Table 4.
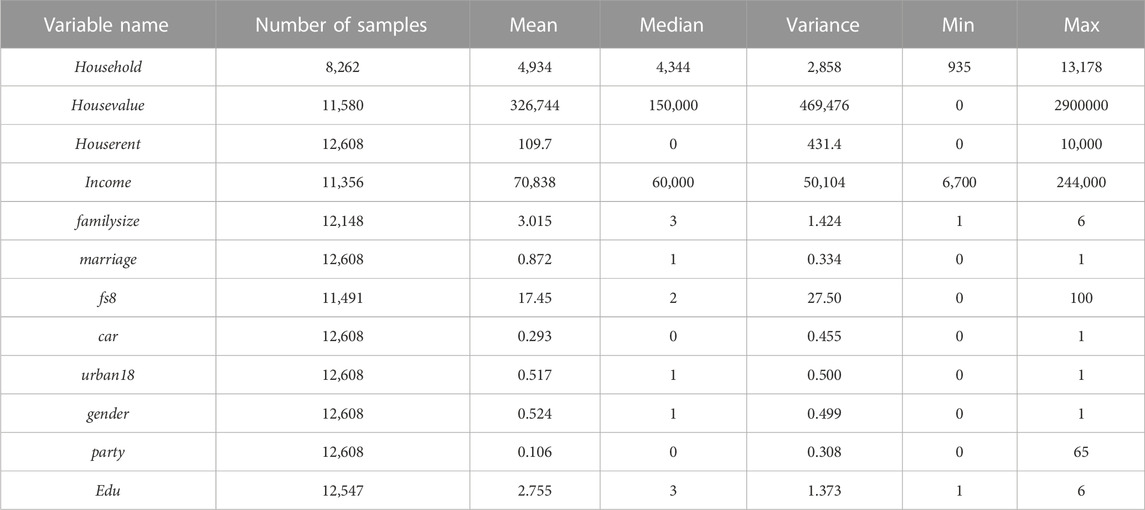
TABLE 4. Descriptive statistics of the main variables.
6 Empirical analysis
6.1 Baseline regression results for homeowners
The results in column (1) of Table 5 show that an increase in the value of housing significantly contributes to homeowners’ HCEs; thus, the increase in house prices has a wealth effect. The coefficient of housing value is 0.21, which means that when the value of housing increases by 1%, HCEs increase by 0.21%. Columns (2), (3), and (4) indicate the gradual addition of economic, household characteristics, and household head control variables to the separate regressions; the housing value coefficient decreases from 0.21 to 0.07. That is, a 1% increase in house prices increases HCEs by 0.07%; thus, increased house prices still have a wealth effect on HCEs. From column (2) (economic variables), a 1% increase in household income is associated with a 0.28% increase in HCEs. Thus, an increase in household income raises the level of household consumption and has a greater impact on HCEs than the other control variable categories. Column (3) expresses the household characteristics variables, all of which are shown to contribute to HCEs. In our model, household size contributes significantly to HCEs: when household size expands by 1%, HCEs expand by 0.11%; thus, there is no evidence of household economies of scale. Households with cars have significantly increased HCEs, with a coefficient of 0.13. Additionally, the higher the importance household attach to education, the more they focus on spiritual pursuits, and the more importance they place on consumption quality and consumption upgrading. As for residential area, urban households have higher HCEs than those in rural areas, particularly in the categories of clothing, food, and transportation and communication. This may be due to the poor infrastructure in rural areas, which leads to consumers in rural areas having less luxury and recreational spending. Column (4) shows that education contributes slightly to HCEs; the effect is not strong, probably because education level is not a major factor in determining household economic power. Overall, housing value increases have a significant wealth effect, which promotes HCEs; household economic characteristics are the most significant force promoting HCEs, while household head characteristic variables have the smallest effect. Thus, regardless of whether the wealth effect is realized or unrealized, it increases perceived total household assets among homeowners, positively impacting household consumption and HCEs.
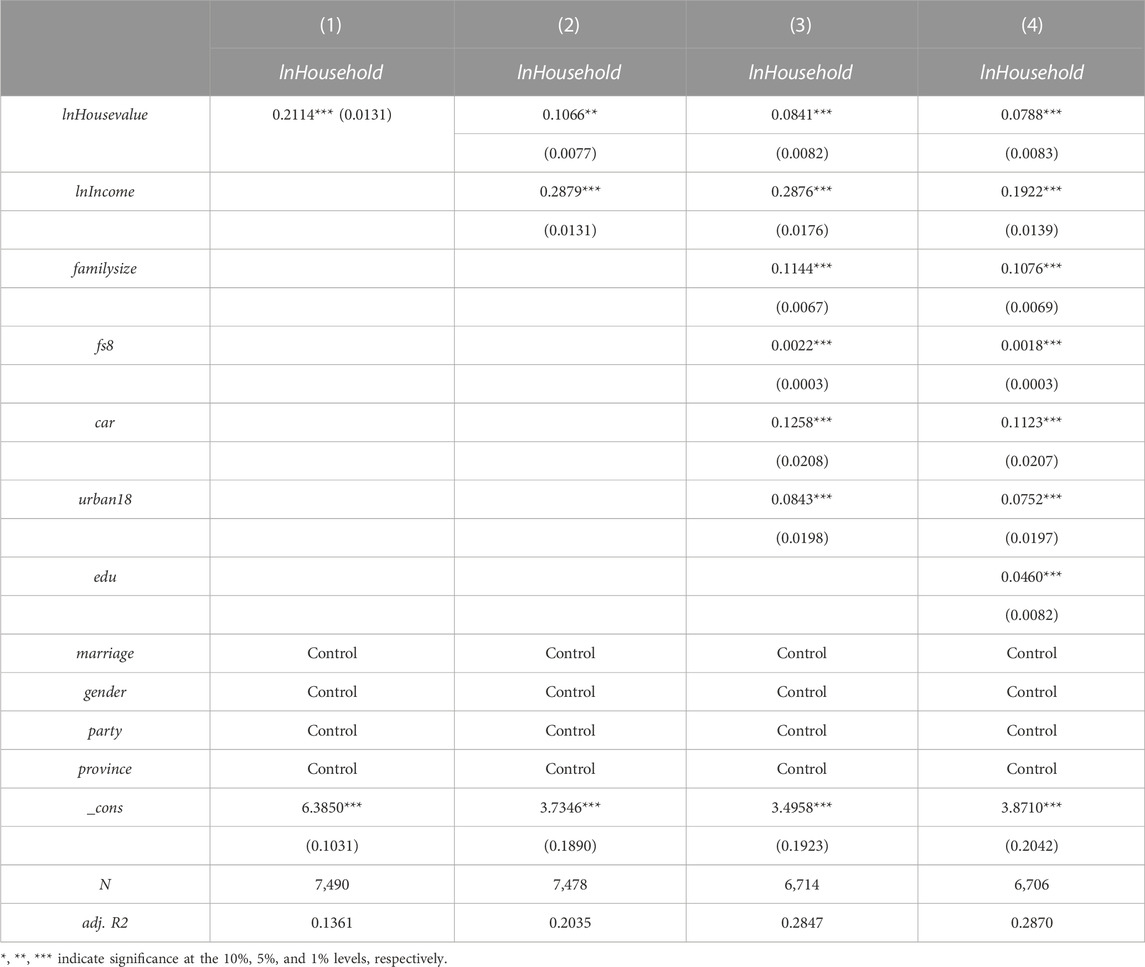
TABLE 5. Baseline regression of the model for homeowners.
Importantly, homeowners are not a homogenous group. Yu (Yu and Lee, 2017) argued that the number of houses owned affects the relationship between house prices and consumption. Similarly, Chen Keyao (Keyao, 2019) showed that the effect of higher housing values on the consumption of households with one house is relatively limited; the wealth effect is greater among homeowners with multiple houses. We tested this, and the results are shown in Table 6. As shown in column (1), households with one house are more affected by the wealth effect of housing uncashed; rising house prices increase the total assets of the household, creating a “monetary illusion” whereby the household may perceive that they have become wealthier. As shown in column (2), for households with multiple properties, property has a stronger wealth effect with stronger investment goods attributes and stronger “monetary illusions.” For households with multiple properties, the possible reasons for rising housing value showing a higher realized wealth effect on HCEs are as follows: first, the sample size is small, and the findings lack some explanatory power; second, for households with high assets, household consumption has reached saturation, and the promotion effect of rising house prices is weaker relative to homeowners with one house; third, HCEs vary according to consumption type—increased consumption among households with high housing assets may relate to consumption types with lower carbon emission intensity, thus contributing little to HCEs.
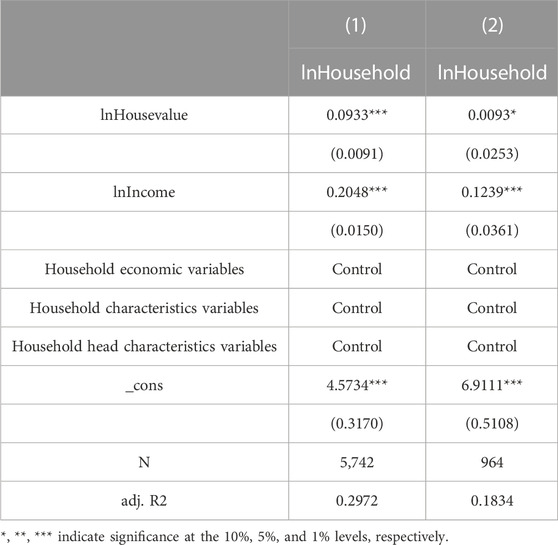
TABLE 6. Regression results according to number of houses owned.
Next, the paper conducts an empirical analysis of the impact of housing value increase on HCEs according to consumption type; the results are shown in Table 7.
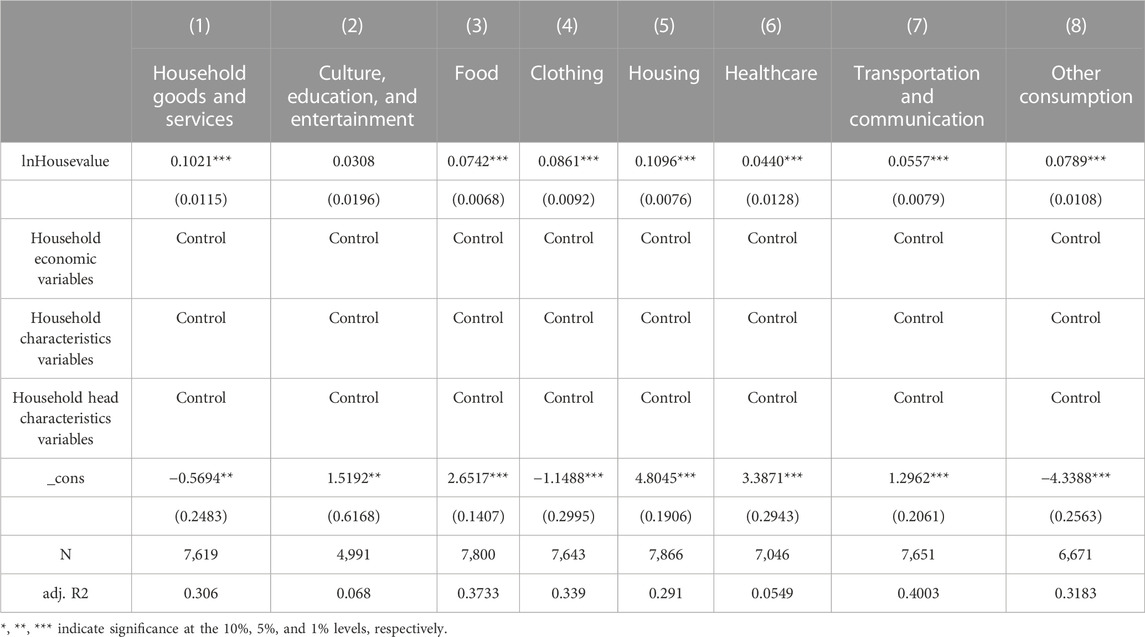
TABLE 7. Regression results: Carbon emissions for each consumption type among homeowners.
The empirical results show that house price increases have a clear wealth effect, contributing to all types of HCEs. The wealth effect is strongest on housing HCEs and weakest on healthcare HCEs. This is probably due to the fact that the healthcare carbon emission coefficient is relatively small; Chinese households have relatively little demand for healthcare at present; thus, the growth of house prices has little impact on this type of consumption. Furthermore, the consumption of health care-related items is not strongly linked to overall consumption level; healthy households may have almost no medical consumption expenditure. In summary, the rise in house prices has a wealth effect on almost all forms of consumption among homeowners.
6.2 Analysis of baseline regression results for non-homeowners
To investigate the extent to which non-homeowners’ HCEs are affected by rising house prices, this study uses housing rent as the explanatory variable. The results are presented in Table 8.
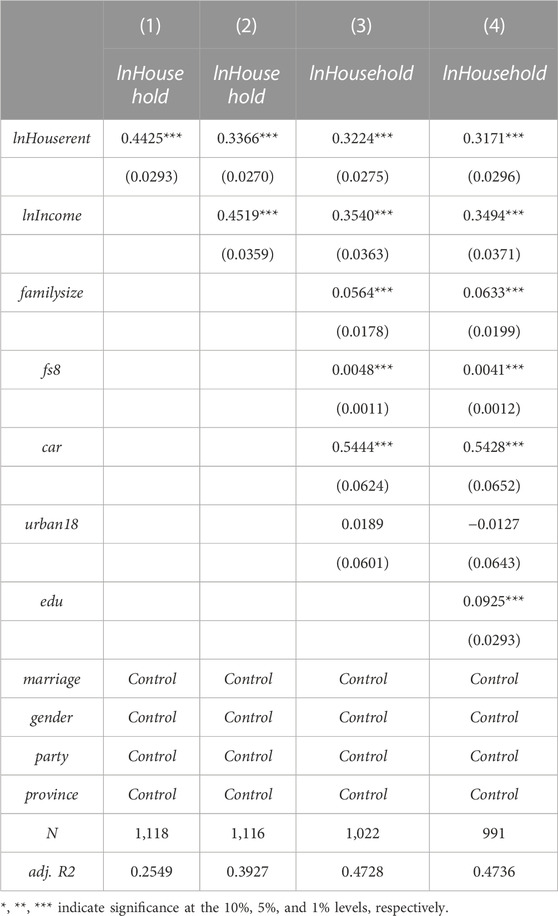
TABLE 8. Baseline regressions for non-homeowners.
Table 8 shows the impact of rising house prices on non-homeowners’ HCEs. Column (1) shows that rising rent significantly contribute to HCEs; thus, rising house prices have a substitution effect whereby savings are substituted for consumption. The coefficient of housing rent is 0.44, which means that a 1% increase in housing rent increases HCEs by 0.44%. This result may be explained by the following factors: first, our sample of non-homeowners is small and unrepresentative; second, consumption includes housing expenditure, and renters thus have higher housing consumption than homeowners, which, in turn, has a greater impact on HCEs; third, if house price increases exceed the expectations of people planning to buy a home, such households lose their ability to purchase housing and will use their original savings for consumption; and fourth, among non-homeowners, some young people want to pursue a high quality of life and will not reduce their quality of life by saving with the intention of buying a home. Columns (2), (3), and (4) denote the gradual addition of economic, household characteristics, and household head control variables to the separate regressions; house price increases still have a substitution effect on HCEs through rent.
To further analyze the impact of rising house prices on HCEs, they are further divided into eight consumption carbon emission types and empirically analyzed. The results are presented in Table 9.
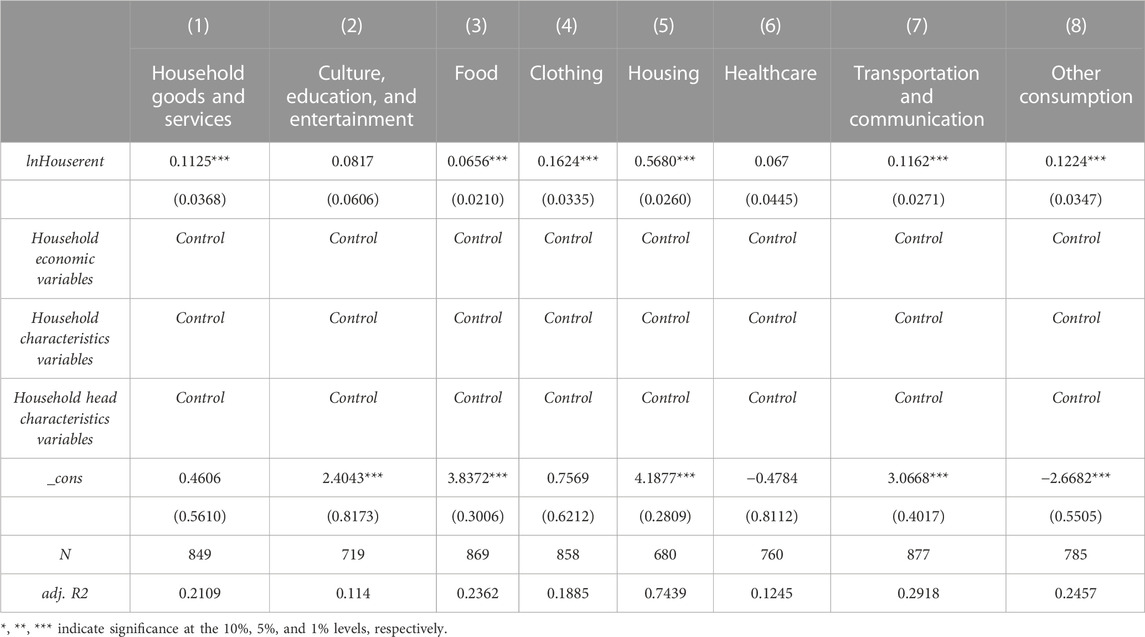
TABLE 9. Regression results: Carbon emissions for each consumption type among non-homeowners.
Table 9 shows that rising house prices increase HCEs for most consumption categories among non-homeowners, except for cultural, educational, and entertainment consumption and healthcare consumption. The coefficient of the effect of rising house prices (rent) on the carbon emissions of all other consumption types is significantly positive at the 1% level, proving that there is a substitution effect whereby savings are converted to consumption; in the face of rising house prices, renters will increase their housing expenditure and other forms of consumption. The impact of house price changes on different types of HCEs varies significantly. The impact is much higher on housing HCEs, which is important given that excessive housing leads to consumers not being able to afford to buy a house and using their savings for other consumption instead; rising house prices have a relatively weak substitution effect on food carbon emissions.
6.3 Analysis of the mechanism
Although the above empirical results demonstrate that rising house prices positively contribute to HCEs through both housing value and rent, it remains to be verified whether this effect is transmitted through consumption. In this paper, we use a mediating effect model to test the mechanism of action; the model is constructed as follows:
where Cont,r is the mediating variable, indicating household consumption expenditure, and the rest of the variables are consistent with Eqs. 4.4, 4.5, 4.6, 4.8 test whether the effects of housing value and housing rent on the mediating variable are significant. If the coefficients of
Rising house prices affect total household assets and housing costs, changing consumption expectations both economically and psychologically and thus affecting HCEs. The results from testing the mediating role of household consumption in the effect of housing value and rent on HCEs are presented in Table 10. Columns (1) and (3) show that increases in both housing value and housing rent increase household consumption after controlling for the household characteristics and household head variables and the provincial dummy variable, which is consistent with the findings obtained by (Huang, 2013). The results in columns (2) and (4) show that the household consumption variable is significant and the coefficients of the effects of housing value and housing rent are significantly reduced by its inclusion, indicating that it has a significant mediating effect in the link between rising house prices and HCEs.
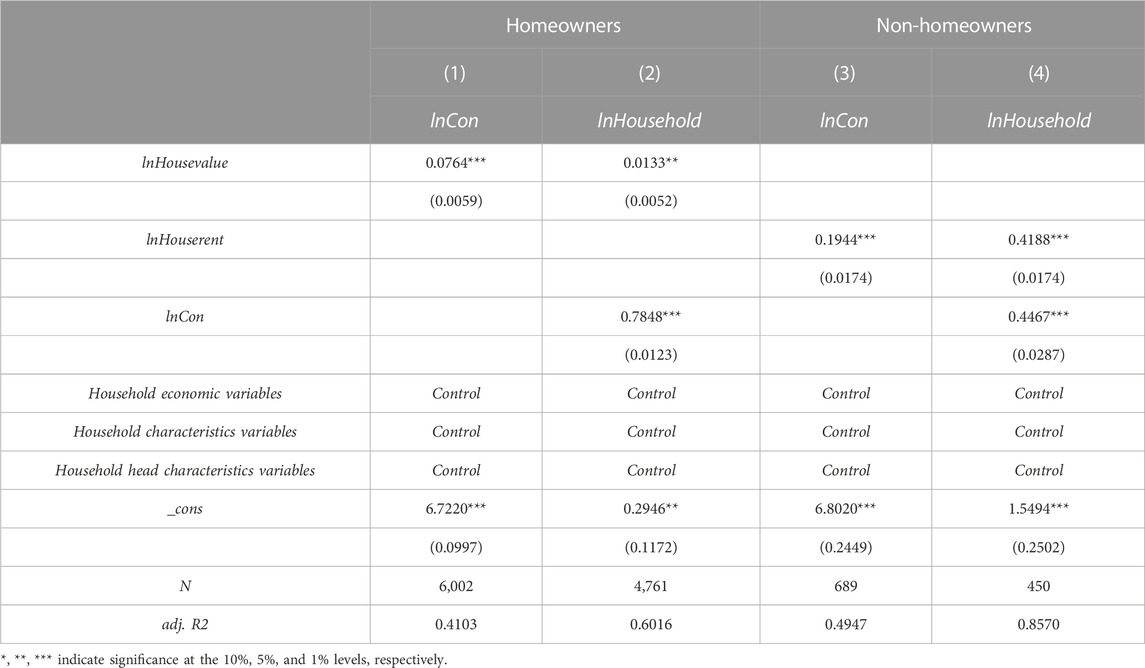
TABLE 10. Mediating effect of household consumption.
6.4 Robustness test
6.4.1 Substitution of explanatory variables
To ensure the robustness of the results, the explanatory variable used to examine homeowners is replaced with net home equity (equity), that is, the difference between the value of the house and the total mortgage; HCEs are regressed on net home equity, and the results are shown in column (1) of Table 11. The wealth effect of house prices is still significantly reflected in HCEs.
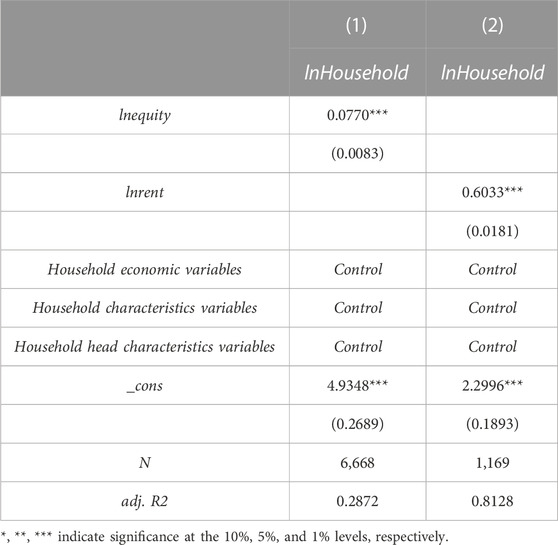
TABLE 11. Regression results with different explanatory variables.
The explanatory variable housing rent for non-homeowners is changed to housing expenditure minus water, electricity, fuel, property costs, and maintenance costs; this is adopted mainly because of the relatively small sample size of non-homeowners. There is not sufficient direct rent data to conduct the study; however, there is sufficient data on housing expenditure such that we are able to decompose housing expenditure to obtain indirect rent data. The regression results are consistent with the previous results, namely, that the increase in house prices has a substitution effect on consumption and increases HCEs.
6.4.2 Instrumental variables method
Theoretically, an increase or decrease in other forms of consumption may have an effect on real estate consumption and thus on house prices (Hu (Die, 2010)); that is, there may be a two-way causal relationship between HCEs and housing values and rent. In this study, the instrumental variables approach is used to address this endogeneity issue. Drawing on the methods of Pan and Liu (Min and Zhiqi, 2018) and Wan et al. (Haiyuan et al., 2019), the average house price in each province (Houseprice) is used as an instrumental variable for housing value, and the house price (Rent) of the same community is selected as the instrumental variable for housing rent, which is the housing value divided by the housing area in the same community.
In terms of correlation and exogeneity, changes in average provincial house prices affect housing values, and the impact of rising house prices on consumption operates mainly through the wealth effect and the phenomenon of housing slaves who compress their spending to pay their mortgage (Yan and Zhu, 2013). In general, there is two-way causality between housing rent and housing values; higher rent constrains household budgets, which, in turn, affects consumption. The instrumental variables affect the value of housing assets as well as rent but do not have a direct effect on HCEs, consistent with the relevant requirements of instrumental variables. According to the weak instrumental variables test, the Wald-F values for homeowners and non-homeowners are 1,091.928 and 39.179, respectively, which are greater than all threshold values, rejecting the weak instrumental variables hypothesis. The p-value is 0.0000 (under the threshold of 0.05); thus, the unidentifiable hypothesis is also rejected. Columns (1) and (2) in Table 12 indicate the regression results for the second stage of the instrumental variables for homeowners and non-homeowners, respectively. With the use of instrumental variables, the positive effect of house price increases on HCEs is significant at the 1% level; the result is similar to the previous findings, indicating the robustness of our results. However, the coefficient of housing rent is 1.11, which differs significantly from the OLS results, probably due to the missing values in the instrumental variable.
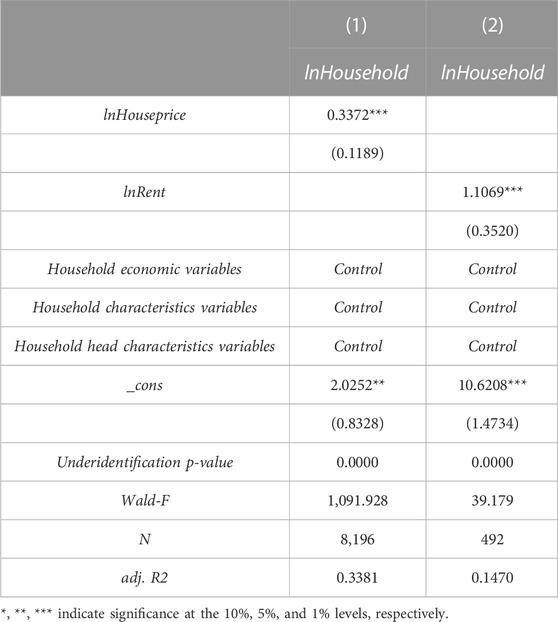
TABLE 12. Regression results: Instrumental variables.
6.5 Heterogeneity analysis
The previous analysis of the empirical results shows that there is a boosting effect of rising house prices on HCEs. However, due to the differences in various household characteristics, the impact of housing prices on HCEs varies across households. Specifically, regional differences in economic development levels lead to differences in housing prices and their growth rates, which have different effects on consumption and on HCEs; urban-rural differences are reflected in various aspects such as income disparity, type of residence, and consumption structure. The increase in housing prices is ultimately reflected in HCEs due to urban-rural differences, and owner-occupied housing HCEs are less than those of households who rent or lease housing; the higher the housing price is, the higher the income, and the better the social welfare is, the higher the HCEs. In this study, based on scholars’ analysis of housing prices and consumption, we further investigate the heterogeneity analysis of housing prices and HCEs.
6.5.1 Regional distribution differences
China is an economy with uneven regional economic development, and there are differences in HCEs from rising house prices on household consumption in different regions due to differences in geographic location, house price levels, economic levels, and housing demand. This study utilizes data from 31 provinces, municipalities, and autonomous regions in China as the sample and conducts a comparative study on the east and west regions, among which the sample of the eastern region includes 11 provinces, municipalities, and autonomous regions in Beijing, Tianjin, Hebei, Liaoning, Shanghai, Jiangsu, Zhejiang, Fujian, Shandong, Guangdong, and Hainan. The sample of the central region includes eight provinces, municipalities, and autonomous regions in Shanxi, Jilin, Heilongjiang, Anhui, Jiangxi, Henan, Hubei, and Hunan. The sample in the western region includes 12 provinces, cities, and autonomous regions, including Sichuan, Chongqing, Guizhou, Yunnan, Tibet, Shaanxi, Gansu, Qinghai, Ningxia, Xinjiang, Guangxi, and Inner Mongolia. The empirical results in Tables 13 show that the increase in house prices significantly affects HCEs regardless of the region, but the values of elasticity coefficients differ for households with and without housing. The regions, sorted by the elasticity coefficient values of housing value for households with housing assets from largest to smallest, are the central, the eastern, and then the western, indicating that the central region has the largest impact of house prices on HCEs, while the western region shows a weaker wealth effect. While there has been an overall downward trend of consumption growth in the past few years, there is a regional structural change in consumption, with the central region experiencing a significant increase in house prices and a rise in the national share of consumption The central region has seen a significant increase in house prices and a rise in the national share of consumption, which has realized a more significant contribution to HCEs, while the western region has seen slow growth in house prices due to economic development constraints and has not yet achieved a structural upgrade in consumption in the region, so it has the least contribution to household consumption carbon emissions. From the perspective of homeless households, the central region again shows the largest positive promoting effect, while the eastern region shows the smallest substitution effect, indicating that the saving behavior in the eastern region is higher than that in the western region, which may be due to the higher level of economic development and more population inflow in the east, where the demand drives the house price increase and the housing consumption of renting households increases while cutting other consumption expenditures for home purchase. In contrast, the western region’s house prices rise at a slower pace, and households do not need to sacrifice other consumption for the expectation of home purchase. This may be related to the consumption habits in the eastern region.
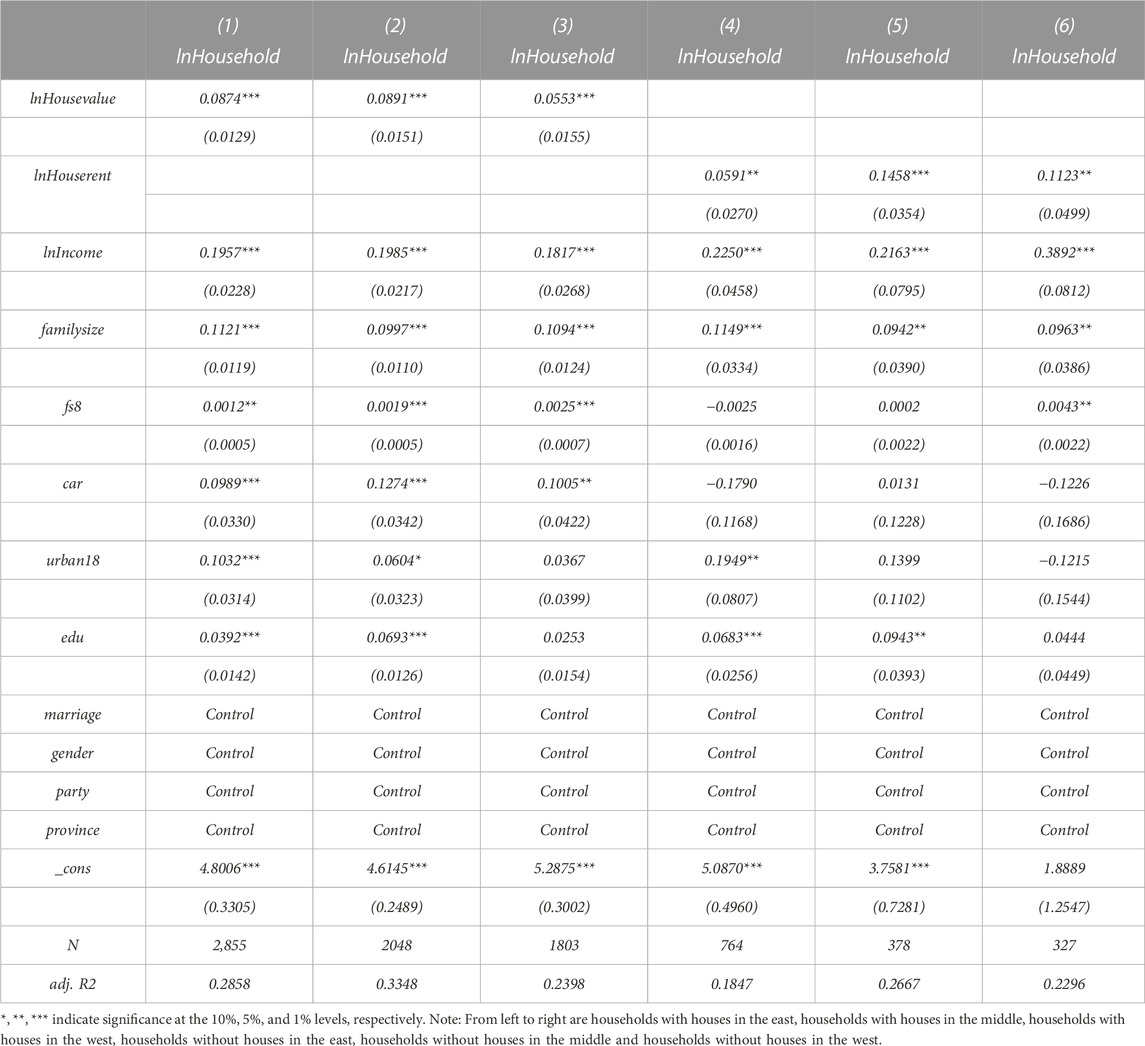
TABLE 13. Regression results under regional distribution differences.
6.5.2 Urban-rural differences
The income level of residents is the main influencing factor of household consumption carbon emission. With the economic prosperity of China, the disposable income of urban and rural residents has increased, the income structure situation in China is constantly changing, widening the gap between the rich and the poor in urban and rural areas, and the income growth rate of low- and middle-income individuals continues to decline compared to that of high-income individuals. In addition, the unsound social security system in rural areas makes it impossible to pay the high medical expenses; thus, there are differences between urban and rural residents’ consumption decisions in relation to rising house prices. As shown in Table 14, rising house prices have a significant impact on HCEs for both urban and rural households, but the strength of the impact differs. In general, urban and rural households with and without housing have opposite effects; specifically, for households with home ownership, the increase in house prices will have a wealth effect on HCEs. However, urban households are more sensitive to housing price, likely because the household housing assets increase the “wealthiness” of residents, and residents will improve their consumption structure and increase their consumption expenditures such as entertainment, which will increase HCEs. Rural residents’ income gradually increases, and they invest more in real estate, thus increasing their consumption of housing as well as their development and enjoyment expenditures such as transportation and communication, which affect household consumption carbon emissions.
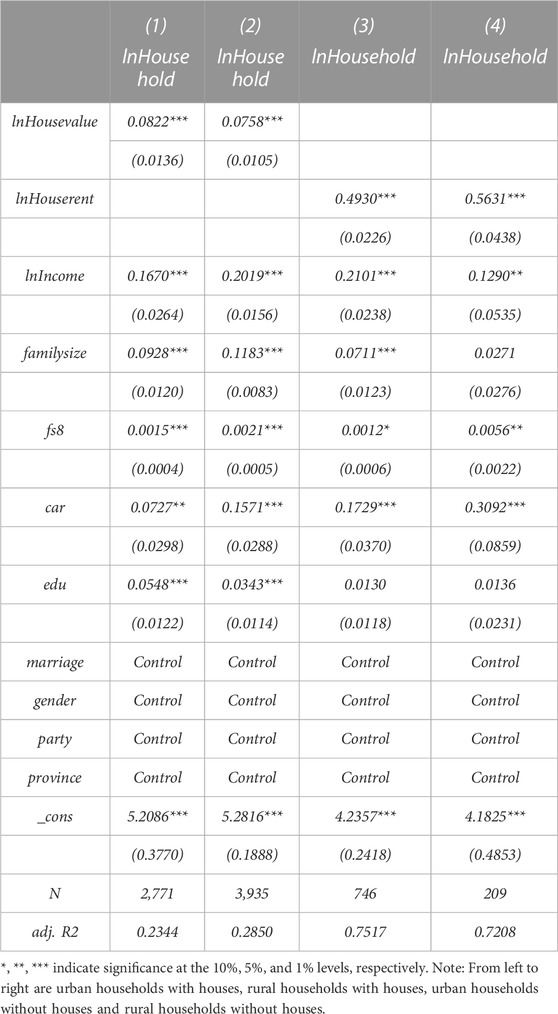
TABLE 14. Regression results under urban-rural differences.
7 Conclusion and policy recommendations
7.1 Main conclusion
Based on a micro (household) perspective, this paper examined the impact of rising house prices on the HCEs of different households, with a view to understanding the varied impacts of rising house prices on consumption. The main findings are outlined below.
First, rising house prices contribute significantly to HCEs. When the value of their home equity rises, homeowners’ household consumption increases, driving the growth of carbon emissions; similarly, rising rents contribute to HCEs. Second, regardless of home ownership status, housing-related HCEs increase with rising house prices. For homeowners, the greatest impact of rising house prices relates to housing expenditure; there is also a large impact on HCEs relating to clothing, food, and household goods and services. However, the impact on HCEs related to healthcare and culture, education, and entertainment is small or non-significant. For renters, rising house prices show a substitution effect, driving the increase of HCEs. Although the increase of rental expenses will only directly affect emissions related to housing consumption, it also has a catalytic effect on most forms of consumption-related HCEs. As is the case among homeowners, the effect is smallest on cultural, educational, and entertainment consumption (probably due to a lower demand for hedonic consumption) and healthcare. Third, rising house prices have different degrees of impact on different types of households; the varied economic development and saving habits of different regions are, to some extent, expressed in consumption behavior. The wealth effect of rising house prices on HCEs is the largest for homeowners in central China and the smallest in western China; the substitution of savings for consumption is largest among renters in central China and smallest in eastern China. Among urban residents, the effect of rising house prices on HCEs is greater for homeowners, while the opposite is true among rural households: renters’ HCEs are more affected by rising prices.
7.2 Policy recommendations
Based on our findings, the following policy recommendations for energy saving and emission reduction are proposed, starting with the real estate sector.
7.2.1 Stabilize real estate prices
Policymakers should aim to classify and control the real estate market, ensuring its continuity and stability through regulation. Housing speculation should be limited, and the tax system related to real estate should be improved by, for example, levying property tax during the holding period and levying capital gains tax and inheritance tax on the exchange and transfer of houses. The government should speed up the construction of a housing system with multiple main bodies of supply, multi-channels to secure housing transactions, and a housing system that attaches as much importance to renting as to buying a house and strengthen urban planning so that all people have a home, thereby stabilizing housing prices in order to avoid the increase in carbon emissions due to the excessive rise in housing prices. The current economic situation has very serious issues, and stabilizing house prices is important for stabilizing growth, employment, and risk prevention. The interest rate of commercial personal housing loans for first-time buyers should be lowered for families looking to buy houses. This would require strengthened coordination between the Ministry of Housing and Construction, the People’s Bank, and other departments. This would support local communities and vigorously promote efforts to ensure the delivery of buildings, livelihoods, and stability.
7.2.2 Linking house prices to carbon prices
Carbon credits can be used as a policy tool to counteract housing speculation. The total amount of carbon emissions from the housing sector can be established from the perspective of household housing consumption demand and distributed equally to residents in each city, resulting in housing carbon emission allowances for each resident in a city. The system of housing carbon tickets would not only limit the carbon emissions of the housing sector but would also limit the total supply and demand of housing. This can play a linking role between the low carbon policy of carbon peaking and carbon neutrality and anti-housing speculation policy.
7.2.3 Guiding residents’ consumption behavior
The government should increase publicity around energy conservation and emission reduction, raise residents’ energy awareness, and educate them about the importance of low-carbon lifestyles and ways to reduce HCEs. The government should improve laws and regulations around energy conservation and emission reduction and promote the consumption of low-energy products through economic incentive mechanisms. In terms of consumption structure, we should develop emission reduction measures for different consumption categories, avoid extravagant consumption by families without reducing their quality of life, and advocate green and low-carbon consumption. This could be achieved by reducing carbon emissions from food consumption, advocating “clean your plate” campaign and reducing dining out, advocating green travel, and promoting public transportation. Accordingly, the government has already introduced policies to promote the development of new energy vehicles to reduce carbon emissions from transportation and communication; it has also aimed to reduce carbon emissions from housing by replacing gas with electricity.
7.2.4 Differentiate carbon emission policies according to local conditions
Considering regional differences in, for example, economic development and living habits, carbon emission assessment systems need to be established separately according to regional characteristics. This should involve developing personal carbon footprint accounting standards and providing a scientific basis for household carbon neutral actions based on HCE data. At the production level, enterprises should be encouraged to develop low-carbon products, implement a carbon labeling system, clarify the carbon emissions of commodities, and provide financial subsidies and tax benefits to enterprises that make clear efforts to respond to the policy. As for planning in rural areas, energy assistance should be extended, and the supply of electricity and gas as well as transportation infrastructure should be improved. In urban areas, the layout of supporting facilities in all areas of the city should be improved. And industrial areas should be moved out of the city. Furthermore, residential areas should be centralized, public service areas should be expanded, the construction of public facilities should be intensified, and urban greening projects should be implemented.
7.3 Limitations and directions for future research
In our study, due to the lack of specific and detailed data, the measurement of carbon emissions from household consumption only considers the total carbon emissions caused by consumption, and only micro data from 2018 are selected for analysis, with a short data selection span and without considering the impact of time-series changes. Although the existing results are not perfect, they still have some referential value. This paper can provide a basis for further and better research in the future and alert relevant professionals and policymakers to the transmission relationship between rising house prices and household consumption carbon emissions.
Data availability statement
The data analyzed in this study is subject to the following licenses/restrictions: http://www.isss.pku.edu.cn/cfps/sjzx/gksj/index.htm. Requests to access these datasets should be directed to Yanxu Wang, MTczMTc2MDU5N0BxcS5jb20=.
Author contributions
Conceptualization, YC and YXW; methodology, YC and YXW; software, YXW; validation, YC, YXW, and YLW; formal analysis, YXW and YLW; data curation, YXW and YLW; writing—original draft preparation, YXW; writing—review and editing, YC and YXW. All authors have read and agreed to the published version of the manuscript.
Funding
This research was funded by the Youth Project of the Humanities and Social Sciences Foundation of the Ministry of Education Study (16YJC790011), Research on Structural Disparity and Inequality of Housing Wealth in China: An Empirical Analysis based on Temporal and Spatial Dimensions.
Acknowledgments
The authors would like to thank the Youth Project of the Humanities and Social Sciences Foundation of the Ministry of Education Study (16YJC790011) for helpful discussions on topics related to this work.
Conflict of interest
The authors declare that the research was conducted in the absence of any commercial or financial relationships that could be construed as a potential conflict of interest.
Publisher’s note
All claims expressed in this article are solely those of the authors and do not necessarily represent those of their affiliated organizations, or those of the publisher, the editors and the reviewers. Any product that may be evaluated in this article, or claim that may be made by its manufacturer, is not guaranteed or endorsed by the publisher.
References
Bin, H., and Feng, Y. (2018). Latent liquidity constraints and urban household consumption. Stat. Res. 35 (7), 102–114. doi:10.19343/j.cnki.11-1302/c.2018.07.009
Bin, H., and Lei, X. (2016). Income inequality, credit constraints and household consumption. Stat. Res. 33, 73–79. doi:10.19343/j.cnki.11-1302/c.2016.08.009
Bin, S., and Dowlatabadi, H. (2005). Consumer lifestyle approach to US energy use and the related CO2 emissions. Energy Policy 33, 197–208. doi:10.1016/S0301-4215(03)00210-6
Bo, S. (2007). A theoretical analysis of the wealth effect in the real estate market and an empirical test of the Chinese experience: 1998–2006. Econ. Sci. 05, 41–53+4+10. doi:10.19523/j.jjkx.2007.05.004
Campbell, J. Y., and Cocco, J. F. (2007). How do house prices affect consumption? Evidence from micro data. J. Monet. Econ. 54, 591–621. doi:10.1016/j.jmoneco.2005.10.016
Die, H. (2010). Real estate market and the transmission of monetary policy. China Soft Sci. 11, 32–43. doi:10.3969/j.issn.1002-9753.2010.11.004
Fisher, P. J., and Montalto, C. P. (2010). Effect of saving motives and horizon on saving behaviors. J. Econ. Psychol. 31, 92–105. doi:10.1016/j.joep.2009.11.002
Global Burden of Disease Collaborative NetworkGlobal Burden of Disease Study (2019). (GBD 2019) life Tables, 1950–2019. Seattle: Institute for Health Metrics and Evaluation.
Haiyuan, W., Qinhai, L., and Rui, L. (2019). Consumer impact of falling house prices. Stud. Lab. Econ. 7, 31–52.
He, W., and Shaojun, Z. (2017). The analysis of the “direct effect” and “indirect effect” of urbanization affects on real estate prices: Based on the dynamic spatial Durbin model of prefecture-level cities. Nankai Econ. Stud. 02, 3–22. doi:10.14116/j.nkes.2017.02.001
Huang, F., and Keshen, J. (2013). Dynamic relationship between energy structure as well as industrial structure and carbon intensity in China: Empirical study on VAR model. J. Technol. Econ. 32, 100–104. doi:10.3969/j.issn.1002-980X.2013.03.017
Jing, H., and Meizeng, T. (2009). Real estate wealth and consumption: Evidence from household microsurvey data. Manag. World. 07, 35–45+12. doi:10.19744/j.cnki.11-1235/f.2009.07.005
Jingyi, W. (2021). A study on the impact of housing conditions on carbon emissions from household consumption – based on micro survey data of Chinese household. dissertation. Shaanxi, Xi’an, China: Xi'an University of Architecture and Technology.
Kesha, G. (2017). Demand and regulation mechanisms in China’s real estate market – an analytical framework for dealing with government-market relations. Manag. World. 02, 97–108. doi:10.19744/j.cnki.11-1235/f.2017.02.009
Keyao, C. (2019). Research on the effect of housing price fluctuation on Chinese urban Household’s consuming behavior—empirical. Analysis. dissertation. Chengdu, Sichuan, China: Southwestern University of Finance and Economics.
Kim, J. H. (2002). Changes in consumption patterns and environmental degradation in Korea. Struct. Change Econ. Dyn. 13, 1–48. doi:10.1016/S0954-349X(01)00030-3
Li, D., Jianguang, S., and Chunyang, P. (2013). The impact of rising house prices on urban residents’ average propensity to consume – an empirical study based on household survey data in Shanghai. J. Financ. Res. 03, 44–57.
Li, Z., and Xingjian, Y. (2020). Rising housing price, household debt and urban household consumption perspective from LTV. Chin. J. Manag. Sci. 28, 80–89. doi:10.16381/j.cnki.issn1003-207x.2018.1024
Ling, F., Tao, J., and Qianjun, Z. (2011). Analysis of the dynamic characteristics of energy consumption and carbon emissions of urban residents. China Popul. Resour. Environ. 21, 93–100. doi:10.3969/j.issn.1002-2104.2011.05.016
Mei, S., Fengbin, Z., and Zhen, H. (2021). Research on household carbon emissions of urban and rural residents from the perspective of family heterogeneity: Taking Shaanxi as an example. Ecol. Econ. 37, 13–21+34. doi:10.3969/j.issn.1002-2104.2011.05.016
Min, P., and Zhiqi, L. (2018). Does “adding leverage” stimulate household consumption? Evidence from Chinese household survey. J. Financ. Res. 04, 71–87.
Phang, S. Y. (2004). House prices and aggregate consumption: Do they move together? Evidence from Singapore. J. Hous. Econ. 13, 101–119. doi:10.1016/j.jhe.2004.04.003
Poterba, J. M. (2000). Stock market wealth and consumption. J. Econ. Perspect. 14, 99–118. doi:10.1257/jep.14.2.99
Qin, Z., Xizhe, P., and Kaiya, W. (2012). Calculation and analysis on indirect carbon emissions from residential consumption based on input-output model. J. Nat. Resour. 27, 2018–2029+6. doi:10.11849/zrzyxb.2012.12.003
Qinchi, W. (2015). Effects of household size on energy consumption and carbon emissions. Resour. Sci. 37, 299–307.
Sanquist, T. F., Orr, H., Shui, B., and Bittner, A. C. (2012). Lifestyle factors in U.S. residential electricity consumption. Energy Policy 42, 354–364. doi:10.1016/j.enpol.2011.11.092
Schipper, L., Bartlett, S., Hawk, D., and Vine, E. (1989). Linking lifestyles and energy use: A matter of time. J. Annu. Rev. Energy 14, 273–320. doi:10.1146/annurev.eg.14.110189.001421
Shaobo, L., Zhang, C., and Guoliang, H. (2016). Effects of monetary policy and house price fluctuations on residents’ consumption. J. Financ. Res. 06, 29–37.
Sheiner, L. (1995). Housing prices and the savings of renters. J. Urban Econ. 38, 94–125. doi:10.1006/juec.1995.1024
Tao, L., and Binkai, C. (2014). Household fixed assets, wealth effects, and residential consumption: Empirical evidence from Chinese urban households. Econ. Res. J. 49, 62–75.
Weber, C. L., and Matthews, H. S. L. (2008). Quantifying the global and distributional aspects of American household carbon footprint. Ecol. Econ. 66, 379–391. doi:10.1016/j.ecolecon.2007.09.021
Weizeng, S., and Siqi, Z. (2016). How does residents’ expectations prices affect house price change. Stat. Res. 05, 51–59. doi:10.19343/j.cnki.11-1302/c.2016.05.006
Wier, M., Lenzen, M., Munksgaard, J., and Smed, S. (2001). Effects of household consumption patterns on CO 2 requirements. Econ. Syst. Res. 13, 259–274. doi:10.1080/09537320120070149
Xiwen, Z. (2018). The impact of housing price fluctuations on urban residents’ consumption. dissertation. Changsha, Hunan, China: Hunan Normal University.
Xizhe, P., and Qin, Z. (2010). Impact of population dynamics and consumption pattern on carbon emissions. Popul. Res. 34, 48–58.
Xueqin, M. (2011). Spatial worship: The ritualistic tendency of urban youth housing consumption. China Youth Study 01, 36–41. doi:10.19633/j.cnki.11-2579/d.2011.01.009
Yalin, Z., Cong, S., and Lingzhen, Y. (2019). More debts, more consumption? The effects of housing debts and general debts on household consumption. J. Bus. Manag. J. 41, 40–56. doi:10.19616/j.cnki.bmj.2019.12.003
Yan, S., and Zhu, G. (2013). The “house slave effect” or the “wealth effect”? a theoretical analysis of the impact of rising house prices on national consumption. Manag. World. 03, 34–47+50+52. doi:10.19744/j.cnki.11-1235/f.2013.03.005
Yang, Z., Fan, Y., and Zheng, S. Q. (2016). Determinants of household carbon emissions: Pathway toward eco-community in Beijing. Habitat Int. 57, 175–186. doi:10.1016/j.habitatint.2016.07.010
Yiqiu, W., and Ningning, G. (2019). Dose the housing credit weaken the housing wealth effects? Retest of housing wealth effects based on CFPS data. J. J. Zhongnan Univ. Econ. 03, 94–104+159–160. doi:10.19639/j.cnki.issn1003-5230.2019.0040
Yongru, H. (2008). Financial behavior analysis of possessing wealth from real estates. China Open. J. 05, 36–38+2–4. doi:10.19625/j.cnki.cn44-1338/f.2008.05.009
Yoshikawa, O., and Ohtaka, F. (1989). An analysis of female labor supply, housing demand and the saving rate in Japan. Eur. Econ. Rev. 33, 997–1023. doi:10.1016/0014-2921(89)90010-x
Yu, H., and Lee, Y. s. (2017). Housing wealth effect of homeowners by income Classafter global financial crisis. The Korea Spat. Plan. Rev. 92, 3–20. doi:10.15793/kspr.2017.92.001
Zhen, Y. (2011). Analysis on the impact of China’s consumption on carbon dioxide emissions: Based on input-output model. Stat. Inf. 26, 39–43. doi:10.3969/j.issn.1007-3116.2011.11.007
Keywords: housing price, household consumption carbon emissions, wealth effect, crowding in effects, crowding out effect
Citation: Cong Y, Wang Y and Wu Y (2023) Impact of house prices on household carbon emissions. Front. Environ. Sci. 11:1149089. doi: 10.3389/fenvs.2023.1149089
Received: 27 January 2023; Accepted: 21 April 2023;
Published: 10 May 2023.
Edited by:
Sandhya Patidar, Heriot-Watt University, United KingdomReviewed by:
Tao Yu, Harbin Institute of Technology, ChinaChen Li, Shanghai University of Engineering Sciences, China
Sonia Kumari, Sukkur IBA University, Pakistan
Copyright © 2023 Cong, Wang and Wu. This is an open-access article distributed under the terms of the Creative Commons Attribution License (CC BY). The use, distribution or reproduction in other forums is permitted, provided the original author(s) and the copyright owner(s) are credited and that the original publication in this journal is cited, in accordance with accepted academic practice. No use, distribution or reproduction is permitted which does not comply with these terms.
*Correspondence: Ying Cong, Y29uZ3lAZHVmZS5lZHUuY24=