 Meilan Zhang1,2
 Zhemin Shen
- 1The State Key Laboratory of Pollution Control and Resource Reuse, School of Environmental Science and Engineering, Tongji University, Shanghai, China
- 2Shanghai Laogang Waste Disposal Co. Ltd., Shanghai, China
- 3School of Environmental Science and Engineering, Shanghai Jiao Tong University, Shanghai, China
Introduction: The inorganic coagulant AlCl3 is used in the traditional coagulation method for the decolorization of industrial dye wastewater. We studied its effectiveness in 41 kinds of dye with different structures, including azo, anthraquinone, arylmethane, and indigo dyes.
Discussion: The optimal conditions for the removal of dye in the AlCl3 coagulation system were alkaline > neutral > acidic conditions. Under alkaline conditions, the hydrolysis colloid of AlCl3 is positively charged and easily combined with negatively charged anionic dyes by electrostatic adsorption. Therefore, the relationships between the dye removal behavior and molecular parameters under alkaline conditions were analyzed.
Methods: Quantitative structure–activity relationship (QSAR) models were built for the color removal rates (Rexp) of 41 dyes and 46 molecular parameters computed by the density functional theory (DFT). Internal validation, external validation, statistical tests, Y-randomization, and applicability domain tests indicated that the optimal models are stable, accurate, reliable, and predictive.
Results: The optimal QSAR model showed that surface area (approx.) (SAA) and molecular weight (MW) are two key molecular parameters. Moreover, electrostatic forces and hydrogen bonding are the predominant adsorption forces in this coagulation process.
1 Introduction
Textile industries consume large quantities of water and discharge high amounts of wastewater during the process of printing and dyeing (Rajkumar and Kim, 2006; EI-Gohary and Tawfik, 2009). The effluent from textile industries is considered among the most difficult industrial wastewater because of its huge emissions, deep color, low biodegradability, a large change in water quality, and complex composition (Verma et al., 2012; Silva et al., 2016; Guo et al., 2021). Chemical coagulation–flocculation is a mature, stable, and widely practiced technology for the treatment of textile wastewater due to its many advantages, including large treatment capacity, high removal efficiency, simple operation, and low investment cost (Georgiou and Aivasidis, 2006; Verma et al., 2012; Dotto et al., 2018; Es-sahbany et al., 2021). At present, aluminum (Al) coagulants are the most widely used in industrial wastewater treatment in China. Inorganic AlCl3 coagulant has long been commonly used due to its low cost and the easy availability of raw materials (Bi et al., 2004; Shi et al., 2007). However, variations of dye structures lead to great differences in the coagulation effects of using AlCl3. Considering the wide variety, large quantity, and complex structure of dyes, it is impossible to perform experimental research on all dyes. Therefore, theoretical models must be introduced and developed into practical applications.
Quantitative structure–activity relationship research can be used to determine the correlation between molecular structure parameters on the microscale and material activity on the macroscale (Barua et al., 2012; da Cunha Xavier et al., 2021; Su et al., 2016). It can predict and evaluate the environmental behavior of existing and new pollutants, which can save time and cost. QSAR has been widely used in the field of environmental science. Michael Schindler established a QSAR prediction model for the rate constants of degradation of volatile organic compounds (VOCs) with nitrate radicals by using the partial least squares technique. The most important descriptors were the ionization potential and the energy of the highest occupied molecular orbital (HOMO) (Schindler, 2016). Lee and von Gunten (2012) developed 18 QSAR models based on 412 second-order rate constants (k) and substituent descriptor variables, such as the Hammett or Taft sigma constants of chlorine, chlorine dioxide, ferrate, and ozone with organics, which were used to predict the rate constants of new organic micropollutants. Xiao et al. (2015) established the optimal QSAR model for the degradation rate of 85 trace organic contaminants under the condition of sulfuric acid radical oxidation. They reported that two descriptors, the number ratio of oxygen atoms to carbon atoms (#O:C) and the energy gap of EHOMO-ELUMO (ELUMO-EHOMO), mechanistically and statistically affected second-order rate constants in the standardized QSAR model.
Many researchers have reported on the removal of single or several typical dyes by coagulation, as well as the examination and development of new coagulants (Shi et al., 2007; Imran et al., 2012; Fosso-Kankeu et al., 2017). However, few QSAR model reports are available on the removal of dyes with different structures using a traditional AlCl3 coagulation system. Therefore, it is imperative to build QSAR models and study the removal mechanism of dyes in this coagulation system.
This study analyzed the correlations between dye removal rates and molecular parameters. An optimal QSAR model was constructed to predict the feasibility of the removal of different dyes in the AlCl3 coagulation system. These optimal QSAR model parameters can explain the mechanism involved in this process, which provides deep insights into the coagulation treatment of dye wastewater.
2 Materials and methods
2.1 Experimental materials and methods
This study selected 41 dyes with different structures, including azo dyes (such as methyl red), anthraquinone dyes (such as carmine), arylmethane dyes (such as crystal violet), and indigo dyes (such as indigo) (Supplementary Table S1). Among them, Disperse Red 60, Vat Blue 4, and Vat Violet 1 were used to test the optimal QSAR model. The other 38 dyes were used to construct the training set for the QSAR model.
All concentrations (50 mg/L) of dye solutions were stirred and dissolved at 298 ± 1 K and initial pH values of 4.0 ± 0.1, 7.0 ± 0.1, and 10.0 ± 0.1. Then, 100 mg/L Al3+ solution was added to each reactor at a molar ratio of coagulant to tested dyes of 20:1. After stirring for 15 min and standing for 30 min, the supernatant was filtered through 0.45-μm microporous membrane and examined by UV spectrophotometry (UV-1600, Shanghai Mapada Instruments Co., Ltd.) at their maximum absorption wavelengths. All dyes and inorganic compounds were of analytical grade and purchased from Sinopharm Chemical Reagent Co., Ltd. or Aladdin Industrial Corporation.
2.2 Calculation of parameters
Four kinds of molecular parameters were selected for calculation: geometric and physicochemical, electrical, molecular frontier orbital energy, and other quantum chemical parameters. All dye structures were initially optimized using HyperChem Release 8.0 and then deep optimized by density functional theory (DFT) (B3LYP/6-311G (d, p) basis set) in Gaussian 09 software. A total of 38 molecular parameters (Supplementary Table S3) were calculated using HyperChem 8.0, Materials Studio 7.0, and Gaussian 09. The other eight combination descriptors (EGAP, EGAP2, ESUM, ESP0.25, ESP0.75, ∑q(O + N), ∑q(H)/NH, and ∑q(−)/NC) (Supplementary Table S1) were obtained by simple mathematical calculations.
Seven dye parameters were calculated in HyperChem 8.0. Three geometric parameters, surface area approximation (SAA), molecular volume (V), and molecular weight (MW), were basic geometric parameters that directly affect the structure and properties of substances. According to the calculated results, dyes with the largest SAA values, such as Acid Blue 93, Acid Green 1, Direct Red 28, Ponceau S, and Reactive Yellow 3, also had the largest MW values among all the dyes, indicating a significant positive correlation between SAA and MW (Supplementary Table S5; Figure 2C). In addition, four physicochemical parameters, hydration energy (HE), refractivity (R), polarizability (Po), and oil–water partition coefficient (Log P), were selected as the macro-descriptors of dyes.
Five descriptors describing the charge of a single atom on dye molecules, qH+, q(CH+)n, q(CH+)x, q(C−)n, and q(C−)x, and seven descriptors describing the charge of whole dye molecules, ∑q(O), ∑q(N), ∑q(O + N), ∑q(H), ∑q(H)/NH, ∑q (−), and ∑q(−)/NC, were electrical parameters and obtained using Gaussian 09 software. The electrical parameters also included the electrostatic potential of the molecular surface (ESPMAX, ESPMEAN, ESPMIN, ESP0.25, and ESP0.75), which were calculated using Materials Studio 7.0. The average ESPMAX value of all dyes was 82.9850 a.u. Acid Blue 93 had the largest ESPMAX value (209.1500 a.u), while Mordant Black 17 had the smallest ESPMAX value (30.6940 a.u), a nearly seven-fold difference (Supplementary Table S4-1). The electrostatic potential of the molecular surface (ESP), which is closely related to the electron density distribution, is an effective molecular descriptor to predict favorable sites of electrophilic and nucleophilic reactions or reveal preferred sites of electrostatically dominated non-covalent interactions (Tao et al., 2016; Scheiner, 2017). ESP can also reflect the attack sites of electrostatic adsorption (Tanzifi et al., 2020). Disperse Red 16 showed the largest q(C−)x (0.852 e) and the smallest q(C−)n (−0.692 e) (Supplementary Table S4-1).
The molecular frontier orbital energy parameters, including EHOMO, ELUMO, ESUM, EGAP, EGAP2, I, A, η, S, χ, CP, and ω, were calculated in Gaussian 09. The energy of the highest occupied molecular orbital (EHOMO) and energy of the lowest unoccupied molecular orbital (ELUMO) were closely related to the activity of the chemical reaction (Lamya et al., 2021; Amri et al., 2023; Bensalah et al., 2023; Lebkiri et al., 2023). The higher the EHOMO, the stronger the electron-donating capacity of the molecule and vice versa. ELUMO represents the electronic affinity, in which the smaller the value, the stronger the electron-accepting ability of the molecule (Fukui, 1982; Regti et al., 2016). The gap in ELUMO and EHOMO (EGAP) was used to describe the chemical and kinetic stability of the molecules. Molecules with a small EGAP were generally reactive, while molecules with a large EGAP were stable and unreactive (Zhang & Musgrave, 2007).
In this study, other quantum chemical parameters were selected for analysis using Gaussian 09 and Materials Studio 7.0, including the total energy of a molecule (EB3LYP), dipole moment (μ), bond order (BOn/BOx), and Fukui indices (f(+)n/f(+)x, f(−)n/f(−)x, and f(0)n/f(0)x). These quantum chemical parameters were important indicators of the physicochemical properties of organic matter. They are useful to reveal the degradation mechanism of organic matter in oxidation and coagulation processes (Jia et al., 2015; Su et al., 2016; Cheng et al., 2018b; Cheng et al., 2018c). The total energy (EB3LYP) directly reflects the degree of difficulty of the reactions between molecules. The average EB3LYP value of all dyes was −2679.8717 kcal/mol, while the highest and lowest values were observed for isatin (−513.19 kcal/mol) and bromocresol green (−11879.78 kcal/mol), respectively, a 23-fold difference, demonstrating the large structural diversity of the dyes selected in this study (Supplementary Table S4-1). The dipole moment (μ) was used to investigate intermolecular interactions. The greater the dipole moment, the stronger the interaction force between molecules (Johnson & Otero-de-la-Roza, 2012; Kumar et al., 2014). Bond order (BO) reflects the stability of a chemical bond. Usually, the BO is <4. The larger the BO, the more stable the molecule, and vice versa (Mayer, 1984; Su et al., 2016).
2.3 Construction method and validation of models
According to the previous research (Cheng et al., 2018b; Tan et al., 2021a; Tan et al., 2021b), the 38 dyes in modeling were divided into training and test sets in a ratio of approximately 4:1. First, IBM SPSS Statistics for Windows, version 25.0 was used to analyze the correlations between color removal rates (Rexp) and 46 parameters and identify the molecular parameters with the great correlations. Then, the stepwise linear regression (MLR) method was applied to develop the QSAR models with Rexp as the dependent variable and the molecular parameters as the independent variables. The squared regression coefficient (R2), standard deviation (SD), root mean square error value (RMSE), significance testing (P), Akaike information criterion (AIC), t-test, and Fisher’s tests were used to evaluate the quality and performance of the constructed models (Ma et al., 2010; Tropsha, 2010). The variation inflation factor (VIF) test was applied to check for multicollinearity among the selected descriptors for each model (Gupta & Basant, 2016). When the values of leave-one-out internal validation (Q2INT) and external validation (Q2EXT) using MATLAB were both >0.5, the developed model indicated robust and predictive (Gramatica, 2007). Finally, Y-randomization and applicability domain tests were performed for the optimal model to verify its stability and credibility (Melagraki & Afantitis, 2014; Gupta & Basant, 2017; Ortiz et al., 2017).
3 Results and discussion
3.1 Experimental results
Figure 1 shows the color removal rates (Rexp) of 38 dyes by the AlCl3 coagulant at pH values of 4, 7, and 10. The average Rexp values were 0.1756 ± 0.0165, 0.2403 ± 0.0218, and 0.4311 ± 0.0230, respectively. Overall, the Rexp values under alkaline conditions were higher than those under neutral and acidic conditions. A pH = 4, Eriochrome Black T (EBT), Direct Red 28 (DR28), and Disperse Red 16 (DR16) had Rexp values of almost 100%, while most of the other dyes had Rexp values <30%. The results under neutral conditions were nearly the same. Only the Rexp value of Acid Orange 7 (AO7) exceeded 90%. At pH = 10, the Rexp values of most dyes are high overall. Therefore, AlCl3 coagulation is suitable for the removal of dyes under alkaline conditions.

FIGURE 1. Rexp of 38 dyes by AlCl3 under different pH conditions.
AlCl3 generally hydrolyzes to form an aluminum hydroxide colloid in an aqueous solution. However, under acidic conditions, many H+ easily react with this colloid, destabilizing the colloid and weakening dye coagulation and adsorption, leading to low color removal rates. The zeta potential of the AlCl3 in Table 1 shows that the zeta potential is the largest under alkaline conditions. Therefore, the colloid stability is highest under alkaline conditions. In acidic conditions, the zeta potential of AlCl3 is close to zero, indicating that the colloid is unstable and the coagulation effect is poor.

TABLE 1. Comparison of Rexp of 38 dyes by AlCl3 and the zeta potentials of AlCl3 at different pH values.
3.2 Correlation analysis
Under acidic conditions, only the oil–water partition coefficient (Log P) was significantly correlated with Rexp (Figure 2A). The experimental results of Rexp values of dye by AlCl3 showed that the removal effect of AlCl3 was unsatisfactory and some dyes were not removed at all. This led to a weak regularity of correlation analysis under acidic conditions.
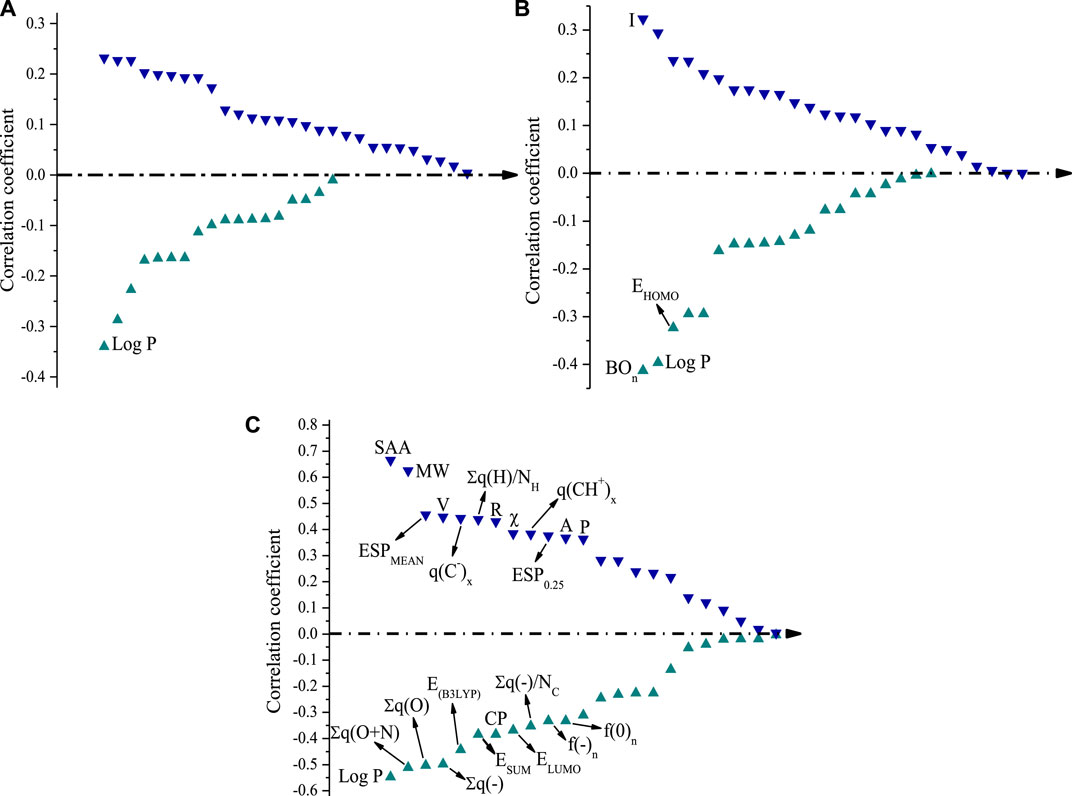
FIGURE 2. Correlation coefficient between Rexp by AlCl3 and the molecular parameters of the dyes. (A) pH = 4, (B) pH = 7, and (C) pH = 10.
Under neutral conditions, no strong correlation between AlCl3 and molecular parameters was found due to its low removal effects on most kinds of dye. Only the parameters BOn, Log P, and EHOMO showed significant negative correlations with Rexp (p < 0.01). Additionally, the correlation coefficient was −0.413, indicating that it has a great effect on the Rexp of dye (Figure 2B). Moreover, parameter I was significantly positively correlated with Rexp; because I = -EHOMO, it showed the opposite correlation to EHOMO.
However, more molecular parameters were significantly correlated with Rexp under alkaline conditions than under acidic and neutral conditions. The parameters with significant negative correlations were Log P, ∑q(O + N), ∑q(O), ∑q(−), EB3LYP, CP, ESUM, ELUMO, ∑q(−)/NC, f(0)n, and f(−)n. The parameters with significant positive correlations were SAA, MW, ESPMEAN, V, q(C−)x, ∑q(H)/NH, R, χ, q(CH+)x, ESP0.25, A, and P. Surface area (approx.) (SAA) and molecular weight (MW) showed the largest correlation coefficients (0.665 and 0.625, respectively) and had the greatest impact on the removal effect of dyes by AlCl3 at pH = 10 (Figure 2C).
Generally speaking, the larger the MW, the larger the molecular surface area and the easier it is for the molecule to be removed by coagulant through electrostatic adsorption or catching–sweeping in an aqueous solution. The absolute values of the significant correlation parameters were ordered as follows: SAA > MW > Log P > ∑q(O + N) > ∑q(O)> ∑q(−) > V > q(C-)x = EB3LYP > ∑q(H)/NH > R > χ = ESUM = CP > q(CH+)x > ESP0.25 > A = ELUMO > Po > ∑q(−)/NC > f(0)n > f(−)n. The geometric and physicochemical parameters SAA and MW mainly affected Rexp under alkaline conditions, followed by the electrical parameters.
3.3 Model analysis
QSAR models are constructed by using multiple linear regression (MLR). All models must satisfy the conditions of R2 > 0.6, Q2INT >0.5, Q2EXT >0.5, and p < 0.01 (Cheng et al., 2018a; Cheng et al., 2018b; Liu et al., 2020). No QSAR models meeting all validation were constructed under acidic or neutral conditions in this study. These findings are consistent with the experimental results that the positively charged colloid generated by AlCl3 is easily destabilized under acidic and neutral conditions, resulting in low adsorption capacity and poor removal effect. In alkaline conditions, the positively charged colloids generated by AlCl3 are relatively stable and can easily combine with the negatively charged anionic dyes in the solution through electrostatic forces. Four QSAR models at pH = 10 are shown in Table 2. In general, QSAR models with high R2 and Q2INT met the other validation conditions and were selected as the optimal model (Dearden et al., 2009).
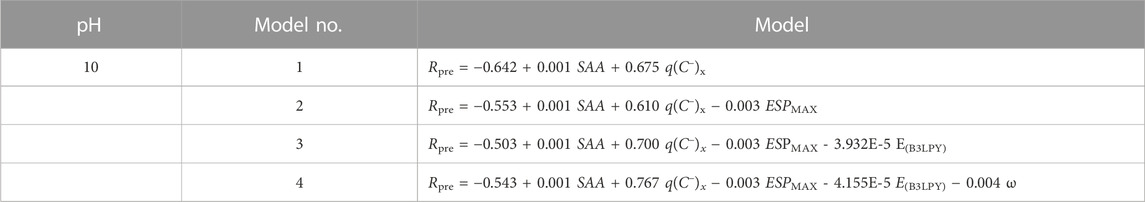
TABLE 2. QSAR models.
Model 1 has two positive variables (SAA and q(C−)x) and one constant, while model 2 has two positive variables (SAA and q(C−)x), one negative variable (ESPMAX), and one constant. For models 1 and 2, the internal validation (Q2INT) values are only 0.5162 and 0.5754, which meet the criterion. Model 3 is the optimal one model, with Rpre = −0.503 + 0.001 SAA + 0.700 q(C−)x - 0.003 ESPMAX - 3.932E - 5 EB3LYP. Although the R2 of model 4 is 0.8128, higher than that of model 3 (0.7962), its external validation (Q2EXT) is 0.2864 (<0.5), indicating that it is not an acceptable model.
As shown in Table 4, the independent variable ω in model 4 does not meet the t-test and significance test. The statistical indexes, internal/external validation, and statistical tests of the optimal model are shown in Tables 3, 4. The R2, Q2INT, and Q2EXT of the optimal model are 0.7962, 0.6664, and 0.7230, respectively, which were far greater than the criteria of the acceptable models. This model also has larger F and small SD and RMSE values, indicating that model 3 is reliable, predictive, and acceptable.
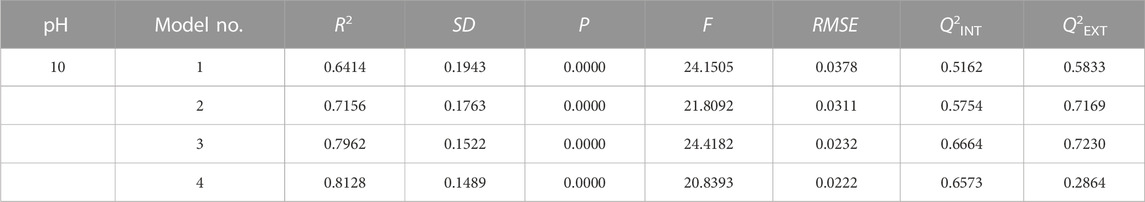
TABLE 3. Statistical indexes of the QSAR models.
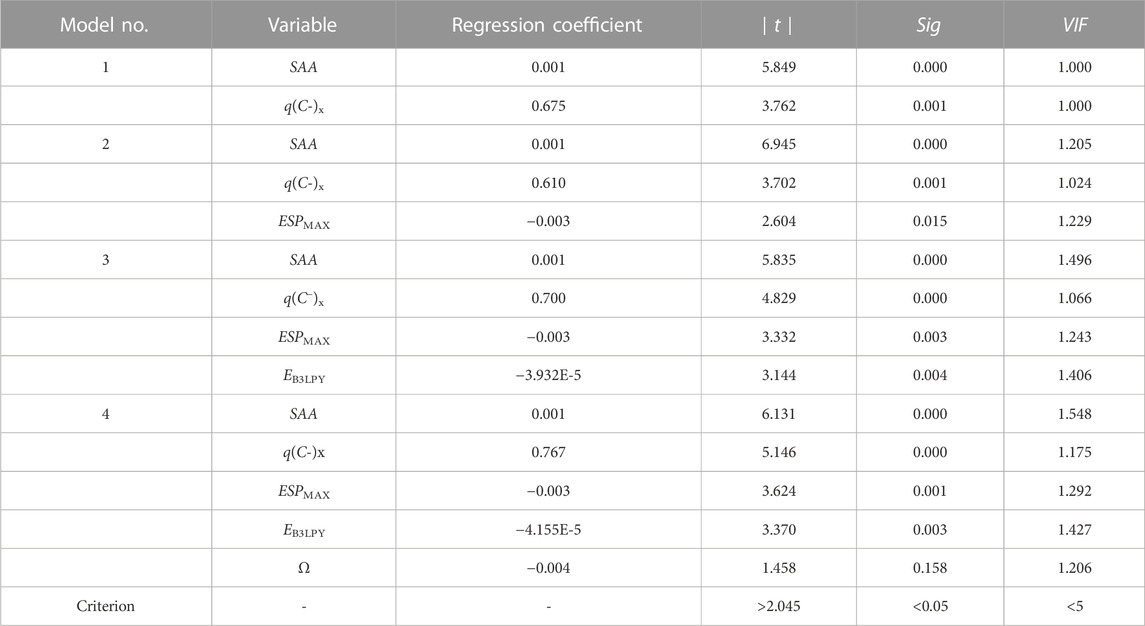
TABLE 4. Statistical data of the QSAR models at pH = 10.
According to the aforementioned models, four groups of Rpre values are predicted, as shown in Figure 3. The green and red triangles represent the training and test sets, respectively. The blue solid line represents the 1:1 regression line. The closer the data samples are to the regression line, the more accurate the predicted Rpre of the model. The blue dotted line represents an error range of ±0.2 to the predicted value. The scattered points in model 1 were slightly scattered, with three points far from the regression line (Figure 3). The scatter-point distributions in models 2 and 4 are close to the regression line; while the scatter degree decreases, two points are still far from the regression line. In model 3, the scattered-point distribution is concentrated along the regression line except for indigo in the test set, indicating that its prediction ability is relatively accurate.
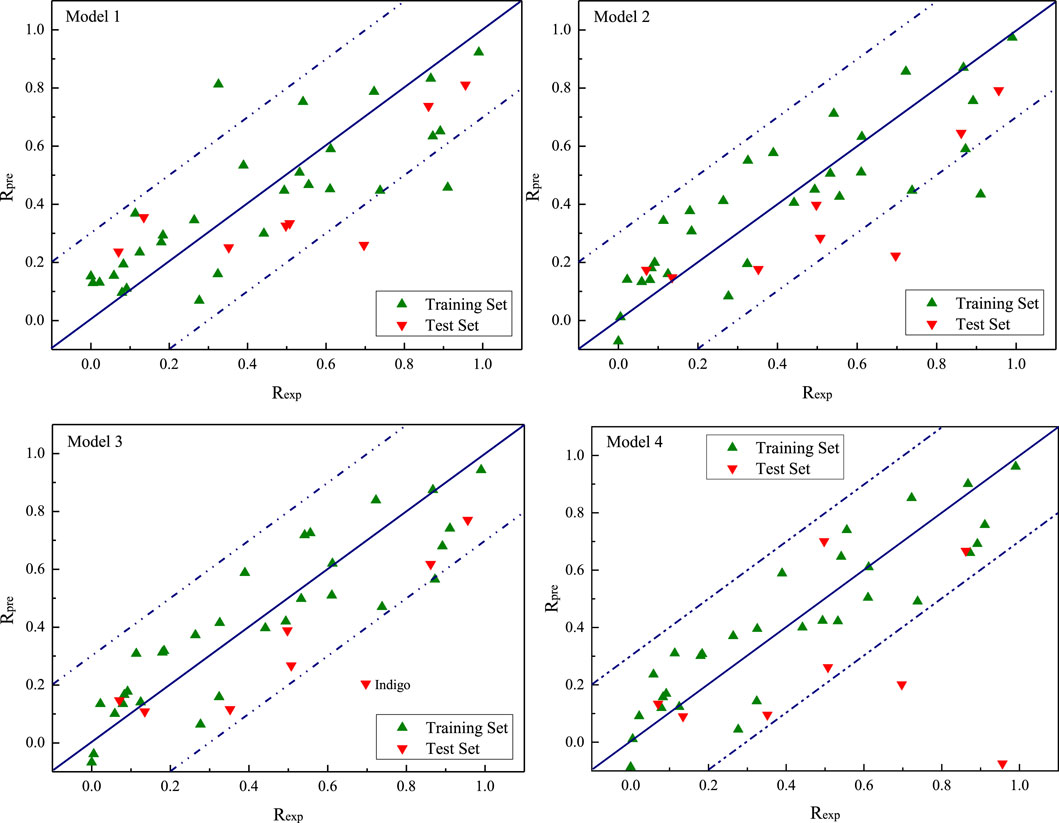
FIGURE 3. Experimental Rexp versus predicted Rpre derived from the QSAR model for AlCl3 under alkaline conditions.
Table 5 shows that 31 dyes had absolute values of Diff. that are <0.2 in model 3, compared to 28, 30, and 29 dyes, respectively, in models 1, 2, and 4. Meanwhile, 16 absolute values of Diff. are <0.1 in model 3, compared to 12, 13, and 15 in models 1, 2, and 4, respectively (Table 5). Therefore, model 3 should be the most satisfactory and acceptable QSAR model of dye removal by coagulation of aluminum chloride under alkaline conditions.
TABLE 5. Experimental and predicted values of the removal rates at pH = 10.
3.4 Y-randomization test and applicability domain
The Y-randomization and applicability domain tests were performed for the optimal QSAR model under pH = 10. First, the Rexp values were randomly rearranged, while the 46 molecular parameters are kept in the same order to obtain a new matrix. Then, a new QSAR was established. According to the test criteria, the R2 and Q2INT of the new model were smaller than those of the original model. In this study, the aforementioned steps were repeated 20 times to obtain the R2 and Q2INT values of the new models. The Y-randomization test results are shown in Figure 4A. The R2 and Q2INT values of the 20 new models were far lower than those of the original model. Therefore, the stability of the original model was not due to a chance correlation or structural dependency of the training set.
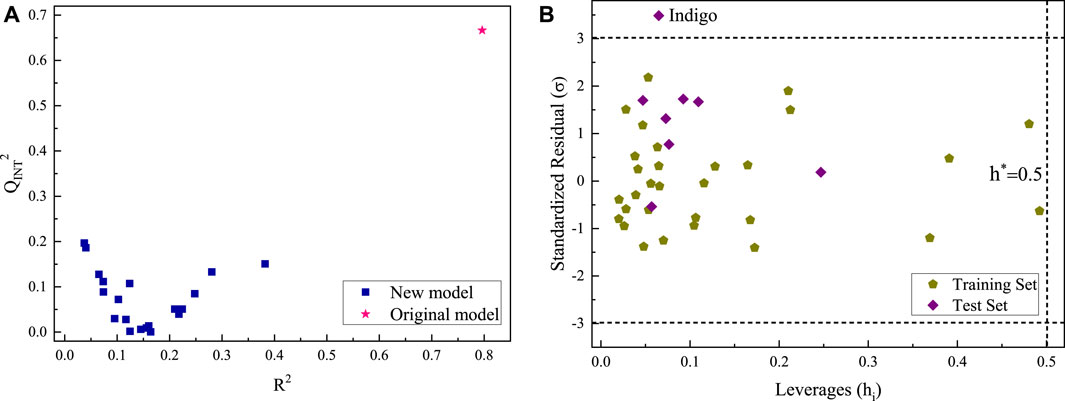
FIGURE 4. Y-randomization (A) and APD test (B) of the optimal QSAR model for Rpre by AlCl3 under alkaline conditions.
Except for indigo, the sample data of all dyes fall within the applicability domain (Figure 4B). This is due to the large differentials between its predicted Rpre and experimental Rexp, but the standardized residual (σ) is 3.5, not exceeding the critical value by too much (Figure 4B). Therefore, when the optimal model is used to predict the Rpre of AlCl3 coagulant for other organic dyes under alkaline conditions, the four parameters of the dye molecule, SAA, q(C−)x, ESPMAX, and EB3LYP, should be calculated before determining the leverage value and standardized residual of the dyes. If they fall within the applicability domain of Figure 4B, the predicted Rpre of dye is accurate. Otherwise, the predicted Rpre is uncertain.
3.5 Model prediction
To further verify the predictive ability of the optimal QSAR model, Disperse Red 60, Vat Blue 4, and Vat Violet 1 were selected for coagulation experiments on dye color removal by AlCl3 under the same experimental conditions. The experimental data (Rexp) were compared with the predicted value (Rpre) of the optimal QSAR model, which are listed in Table 6. As shown in Table 6, except for the absolute value of the Diff. of Disperse Red 60, which is slightly more than 0.2, the Rexp and the Rpre of the other two vat dyes show a good fit. In general, the optimal QSAR model of dye color removal rate by AlCl3 coagulant under alkaline conditions has good predictive ability.
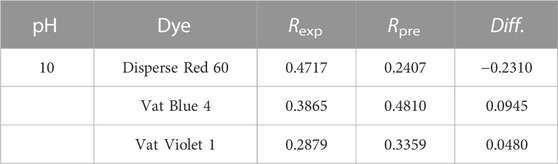
TABLE 6. Comparisons of experimental data and the predicted values of the optimal QSAR model.
3.6 Mechanism interpretation
In this study, the optimal model equation was as follows: Rpre = −0.503 + 0.001 SAA + 0.700 q(C−)x - 0.003 ESPMAX - 3.932E - 5 EB3LYP. It contains four variables, among which the coefficients of SAA and q(C−)x are positive and those of ESPMAX and EB3LYP are negative. Thus, the larger the SAA and q(C−)x or the smaller the ESPMAX and EB3LYP, the higher the Rpre. SAA is the parameter with the greatest effects. The larger the SAA of the molecule, the larger its contact surface area in an aqueous solution and the greater the chance of contact with the aluminum hydroxide colloid. This increases the possibility of hydrogen-bonding adsorption between the adsorption site of dyes and the surface of the coagulant. In addition to hydrogen-bonding interactions, adsorption bridging between dyes and colloids also plays a role in dye removal. The larger the SAA of dye molecules, the more apparent the adsorption bridging effect. Similarly, dyes with the largest Rexp under alkaline conditions have higher SAA values compared to other dyes. For example, the SAA values of Acid Green 1, Direct Red 28, Ponceau S, Reactive Yellow 3, and Disperse Red 16 were 1324.87, 1248.24, 1210.02, 1108.74, and 1105.93, respectively. The Rexp values of isatin, methylene blue trihydrate, and azure B were low for their small SAA values (Supplementary Table S4-4).
The q(C−)x values are the maximum of the negative partial charge of carbon atoms of dye molecules. These may be the active sites of electrostatic adsorption with the coagulant. Compared with the dipole moment (μ), which reflects the overall polarity of the molecule, the electrostatic potential can better reflect the partial polarity of the dye molecule. ESPMAX represents the maximum electrostatic potential of the molecular surface. The larger the ESPMAX, the weaker the hydrophobicity and the stronger the ability of banding water. This weakens the ability to combine with the aluminum hydroxide colloid and reduces the color removal effect. The coefficient between Rexp values and EB3LYP is negative and weakly significant, which has only mathematical fitting significance but no physical significance in the model. In summary, the internal factors affecting the color removal of dyes by AlCl3 coagulant under alkaline conditions include molecular size (SAA and EB3LYP) and charge distribution (q(C−)x and ESPMAX). Therefore, the coagulation mechanism of AlCl3 under alkaline conditions is through electrostatic and hydrogen-bonding forces.
The removal mechanism of DR16 is shown in Figure 5, as an example. In the ESP distribution map, the positions of the C=O, N=O, and N=N double bonds are blue. The negative charge near them makes it easy to generate electrostatic adsorption with the colloid produced after the hydrolysis of AlCl3 under alkaline conditions. The position of q(C−)x also proves this finding. In addition, N=N, N=O, and C=O double bonds are also potential active sites for hydrogen-bonding adsorption.
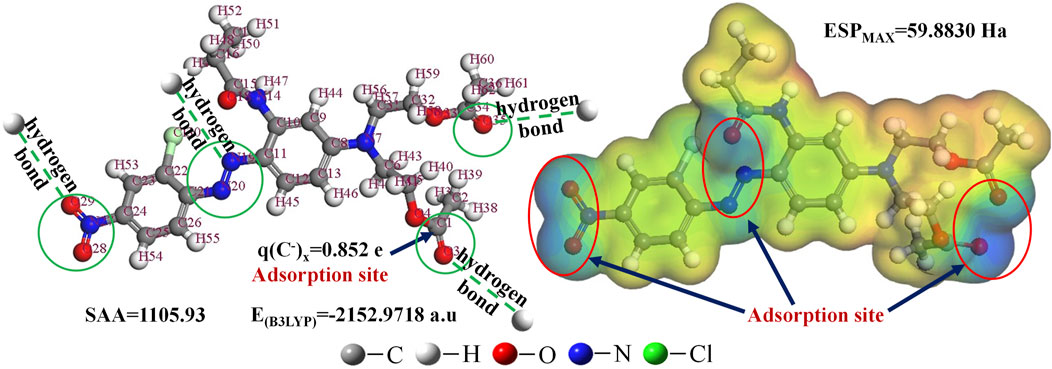
FIGURE 5. Removal mechanism of DR16 by AlCl3 under alkaline conditions.
4 Conclusion
This study evaluated the removal effects of 41 kinds of dye with various structures by the AlCl3 coagulation method. The optimal color removal rate of dye by AlCl3 coagulant was observed for the following order: alkaline conditions > neutral conditions > acidic conditions. Under alkaline conditions, the colloid formed by the hydrolysis of AlCl3 is positively charged and easily combined with negatively charged anionic dye through electrostatic adsorption. Under acidic situations, the colloid is easily destabilized, resulting in weak adsorption. Then, we constructed a QSAR model with 46 molecular parameters, including geometric and physicochemical, electrical, molecular frontier orbital energy, and other quantum chemical parameters. The established QSAR models were examined by statistical tests, internal and external validation, Y-randomization test, and applicability domain test. The optimal QSAR model under alkaline conditions showed Rpre = −0.503 + 0.001 SAA + 0.700 q(C−) - 0.003 ESPMAX - 3.932E - 5 EB3LYP. The molecular parameters contained in the model revealed the mechanism of dye removal by AlCl3 coagulant through electrostatic and hydrogen-bonding forces.
Data availability statement
The original contributions presented in the study are included in the article/Supplementary Material. Further inquiries can be directed to the corresponding author.
Author contributions
MZ designed the research, performed the calculations and analysis, and drafted the manuscript. SQ and YT provided comments and revisions. ZS performed the main revisions of the content and figures.
Funding
The present work was supported by the Joint Funds of the National Natural Science Foundation of China (No. U21A20320) and the Shanghai Chengtou Group Corporation Science and Technology Innovation Program Project (CTKY-ZDXM-2021-016).
Conflict of interest
MZ and SQ were employed by Shanghai Laogang Waste Disposal Co. Ltd.
The remaining authors declare that the research was conducted in the absence of any commercial or financial relationships that could be construed as a potential conflict of interest.
Publisher’s note
All claims expressed in this article are solely those of the authors and do not necessarily represent those of their affiliated organizations, or those of the publisher, the editors, and the reviewers. Any product that may be evaluated in this article, or claim that may be made by its manufacturer, is not guaranteed or endorsed by the publisher.
Supplementary material
The Supplementary Material for this article can be found online at: https://www.frontiersin.org/articles/10.3389/fenvs.2023.1156150/full#supplementary-material
References
Amri, A., Kadiri, L., Hsissou, R., Lebkiri, A., Wardighi, Z., Rifi, E., et al. (2023). Investigation of Typha Latifolia (TL) as potential biosorbent for removal of the methyl orange anionic dye in the aqueous solution. Kinetic and DFT approaches. J. Mol. Struct. 1272, 134098. doi:10.1016/j.molstruc.2022.134098
Barua, N., Sarmah, P., Hussain, I., Deka, R. C., and Buragohain, A. K. (2012). DFT-based QSAR models to predict the antimycobacterial activity of chalcones. Chem. Biol. Drug Des. 79, 553–559. doi:10.1111/j.1747-0285.2011.01289.x
Bensalah, J., Idrissi, A., Faydy, M., Doumane, G., Staoui, A., Hsissou, R., et al. (2023). Investigation of the cationic resin as a potential adsorbent to remove MR and CV dyes: Kinetic, equilibrium isotherms studies and DFT calculations. J. Mol. Struct. J. Mol. Struct. 1278, 134849–134858. doi:10.1016/j.molstruc.2022.134849
Bi, S., Wang, C., Cao, Q., and Zhang, C. (2004). Studies on the mechanism of hydrolysis and polymerization of aluminum salts in aqueous solution: Correlations between the “core-links” model and “cage-like” keggin-Al13 model. Chem. Rev. 248, 441–455. doi:10.1016/j.ccr.2003.11.001
Cheng, Z., Yang, B., Chen, Q., Gao, X., Tan, Y., Ma, Y., et al. (2018a). A Quantitative-Structure-Activity-Relationship (QSAR) model for the reaction rate constants of organic compounds during the ozonation process at different temperatures. Chem. Eng. J. 353, 288–296. doi:10.1016/j.cej.2018.07.122
Cheng, Z., Yang, B., Chen, Q., Gao, X., Tan, Y., Yuan, T., et al. (2018b). Quantitative-structure-activity-relationship (QSAR) models for the reaction rate and temperature of nitrogenous organic compounds in supercritical water oxidation (SCWO). Chem. Eng. J. 354, 12–20. doi:10.1016/j.cej.2018.07.167
Cheng, Z., Yang, B., Chen, Q., Ji, W., and Shen, Z. (2018c). Characteristics and difference of oxidation and coagulation mechanisms for the removal of organic compounds by quantum parameter analysis. Chem. Eng. J. 332, 351–360. doi:10.1016/j.cej.2017.09.065
da Cunha Xavier, J., Almeida-Neto, F. WdQ., da Silva, P. T., de Sousa, A. P., Marinho, E. S., Marinho, M. M., et al. (2021). Structural characterization, DFT calculations, ADMET studies, antibiotic potentiating activity, evaluation of efflux pump inhibition and molecular docking of chalcone (E)-1-(2-hydroxy-3,4,6-trimethoxyphenyl)-3-(4-methoxyphenyl)prop-2-en-1-one. J. Mol. Struct. 1227, 129692. doi:10.1016/j.molstruc.2020.129692
Dearden, J. C., Cronin, M. T. D., and Kaiser, K. L. E. (2009). How not to develop a quantitative structure-activity or structure-property relationship (QSAR/QSPR). SAR QSAR Environ. Res. 20, 241–266. doi:10.1080/10629360902949567
Dotto, J., Fagundes-Klen, M. R., Veit, M. T., Palácio, S. M., and Bergamasco, R. (2018). Performance of different coagulants in the coagulation/flocculation process of textile wastewater. J. Clean. Prod. 208, 656–665. doi:10.1016/j.jclepro.2018.10.112
EI-Gohary, F., and Tawfik, A. (2009). Decolorization and COD reduction of disperse and reactive dyes wastewater using chemical-coagulation followed by sequential batch reactor (SBR) process. Desalination 249, 1159–1164. doi:10.1016/j.desal.2009.05.010
Es-sahbany, H., Hsissou, R., El Hachimi, M. L., Allaoui, M., Nkhili, S., and Elyoubi, M. S. (2021). Investigation of the adsorption of heavy metals (Cu, Co, Ni and Pb) in treatment synthetic wastewater using natural clay as a potential adsorbent (Sale-Morocco). Mater. Today Proc. 45, 7290–7298. doi:10.1016/j.matpr.2020.12.1100
Fosso-Kankeu, E., Webster, A., Ntwampe, I. O., and Waanders, F. B. (2017). Coagulation/flocculation potential of polyaluminium chloride and bentonite clay tested in the removal of methyl red and crystal violet. Arabian J. Sci. Eng. 42, 1389–1397. doi:10.1007/s13369-016-2244-x
Fukui, K. (1982). The role of frontier orbitals in chemical reactions (nobel lecture). Angewandte Chemie Int. Ed. Engl. 21, 801–809. doi:10.1002/anie.198208013
Georgiou, D., and Aivasidis, A. (2006). Decoloration of textile wastewater by means of a fluidized-bed loop reactor and immobilized anaerobic bacteria. J. Hazard. Mater. 135, 372–377. doi:10.1016/j.jhazmat.2005.11.081
Gramatica, P. (2007). Principles of QSAR models validation: Internal and external. QSAR Comb. Sci. 26, 694–701. doi:10.1002/qsar.200610151
Guo, K., Gao, B., Wang, J., Pan, J., Yue, Q., and Xu, X. (2021). Flocculation behaviors of a novel papermaking sludge-based flocculant in practical printing and dyeing wastewater treatment. Front. Environ. Sci. Eng. 15, 103. doi:10.1007/s11783-021-1390-x
Gupta, S., and Basant, N. (2017). Modeling the pH and temperature dependence of aqueousphase hydroxyl radical reaction rate constants of organic micropollutants using QSPR approach. Environ. Sci. Pollut. Res. Int. 24, 24936–24946. doi:10.1007/s11356-017-0161-5
Gupta, S., and Basant, N. (2016). Modeling the reactivity of ozone and sulphate radicals towards organic chemicals in water using machine learning approaches. RSC Adv. 6, 108448–108457. doi:10.1039/c6ra22865h
Imran, Q., Hanif, M., Riaz, M., Noureen, S., Ansari, T., and Bhatti, H. (2012). Coagulation/flocculation of tannery wastewater using immobilized chemical coagulants. J. Appl. Res. Technol. 10, 79–86. doi:10.22201/icat.16656423.2012.10.2.392
Jia, L., Shen, Z., Guo, W., Zhang, Y., Zhu, H., Ji, W., et al. (2015). QSAR models for oxidative degradation of organic pollutants in the Fenton process. J. Taiwan Inst. Chem. Eng. 46, 140–147. doi:10.1016/j.jtice.2014.09.014
Johnson, E. R., and Otero-de-la-Roza, A. (2012). Adsorption of organic molecules on kaolinite from the exchange-hole dipole moment dispersion model. J. Chem. Theory Comput. 8, 5124–5131. doi:10.1021/ct3006375
Kumar, P., Narasimhan, B., Ramasamy, K., Mani, V., Mishra, R. K., and Majeed, A. B. A. (2014). Synthesis, antimicrobial, anticancer evaluation and QSAR studies of 2/3-bromo-N′-(substituted benzylidene/3-phenylallylidene)benzohydrazides. Arabian J. Chem. 10, S3740–S3748. doi:10.1016/j.arabjc.2014.05.010
Lamya, K., Ouass, A., Hsissou, R., Safi, Z., Wazzan, N., Essaadaoui, Y., et al. (2021). Adsorption properties of coriander seeds: Spectroscopic kinetic thermodynamic and computational approaches. J. Mol. Liq. 343, 116971. doi:10.1016/j.molliq.2021.116971
Lebkiri, I., Abbou, B., Hsissou, R., Safi, Z., Sadiku, M., Berisha, A., et al. (2023). Investigation of the anionic polyacrylamide as a potential adsorbent of crystal violet dye from aqueous solution: Equilibrium, kinetic, thermodynamic, DFT, MC and MD approaches. J. Mol. Liq. 372, 121220–121232. doi:10.1016/j.molliq.2023.121220
Lee, Y., and von Gunten, U. (2012). Quantitative structure–activity relationships (QSARs) for the transformation of organic micropollutants during oxidative water treatment. Water Res. 46, 6177–6195. doi:10.1016/j.watres.2012.06.006
Liu, Y., Cheng, Z., Liu, S., Tan, Y., Yuan, T., Yu, X., et al. (2020). Quantitative structure activity relationship (QSAR) modelling of the degradability rate constant of volatile organic compounds (VOCs) by OH radicals in atmosphere. Sci. Total Environ. 729, 138871. doi:10.1016/j.scitotenv.2020.138871
Ma, B., Chen, H., Xu, M., Hayat, T., He, Y., and Xu, J. (2010). Quantitative structure–activity relationship (QSAR) models for polycyclic aromatic hydrocarbons (PAHs) dissipation in rhizosphere based on molecular structure and effect size. Environ. Pollut. 158, 2773–2777. doi:10.1016/j.envpol.2010.04.011
Mayer, I. (1984). Bond order and valence: Relations to Mulliken's population analysis. Int. J. Quantum Chem. 26, 151–154. doi:10.1002/qua.560260111
Melagraki, G., and Afantitis, A. (2014). Enalos InSilicoNano platform: An online decision support tool for the design and virtual screening of nanoparticles. RSC Adv. 4, 50713–50725. doi:10.1039/c4ra07756c
Ortiz, E. V., Bennardi, D. O., Bacelo, D. E., Fioressi, S. E., and Duchowicz, P. R. (2017). The conformation-independent QSPR approach for predicting the oxidation rate constant of water micropollutants. Environ. Sci. Pollut. Res. Int. 24, 27366–27375. doi:10.1007/s11356-017-0315-5
Rajkumar, D., and Kim, J. G. (2006). Oxidation of various reactive dyes with in situ electro-generated active chlorine for textile dyeing industry wastewater treatment. J. Hazard. Mater. 136, 203–212. doi:10.1016/j.jhazmat.2005.11.096
Regti, A., Ayouchia, H. B. E., Laamari, M. R., Stiriba, S. E., Anane, H., and Haddad, M. E. (2016). Experimental and theoretical study using DFT method for the competitive adsorption of two cationic dyes from wastewaters. Appl. Surf. Sci. 390, 311–319. doi:10.1016/j.apsusc.2016.08.059
Scheiner, S. (2017). Comparison of various means of evaluating molecular electrostatic potentials for noncovalent interactions. J. Comput. Chem. 39, 500–510. doi:10.1002/jcc.25085
Schindler, M. (2016). A QSAR for the prediction of rate constants for the reaction of VOCs with nitrate radicals. Chemosphere 154, 23–33. doi:10.1016/j.chemosphere.2016.03.096
Shi, B., Li, G., Wang, D., Feng, C., and Tang, H. (2007). Removal of direct dyes by coagulation: The performance of preformed polymeric aluminum species. J. Hazard. Mater. 143, 567–574. doi:10.1016/j.jhazmat.2006.09.076
Silva, C. E. D. F., Gonçalves, A. H. D. S., and Abud, A. K. D. S. (2016). Treatment of textile industry effluents using orange waste: A proposal to reduce color and chemical oxygen demand. Water Sci. Technol. 74, 994–1004. doi:10.2166/wst.2016.298
Su, P., Zhu, H., and Shen, Z. (2016). QSAR models for removal rates of organic pollutants adsorbed by in situ formed manganese dioxide under acid condition. Environ. Sci. Pollut. Res. Int. 23, 3609–3620. doi:10.1007/s11356-015-5569-1
Tan, Y., Cheng, Z., Liu, Y., Gao, X., Liu, S., Ren, Y., et al. (2021a). A comparative study on the removal of dyes from wastewater by nascent-state manganese dioxide and ferric hydroxide under acidic conditions. Environ. Sci. Water Res. Technol. 7, 1600–1610. doi:10.1039/d1ew00281c
Tan, Y., Cheng, Z., Liu, Y., Gao, X., Liu, S., and Shen, Z. (2021b). Quantum parameter analysis of the adsorption mechanism by freshly formed ferric hydroxide for synthetic dye and antibiotic wastewaters. Chemosphere 280, 130577. doi:10.1016/j.chemosphere.2021.130577
Tanzifi, M., Yaraki, M. T., Beiramzadeh, Z., Saremi, L. H., Najafifard, M., Moradi, H., et al. (2020). Carboxymethyl cellulose improved adsorption capacity of polypyrrole/CMC composite nanoparticles for removal of reactive dyes: Experimental optimization and DFT calculation. Chemosphere 255, 127052. doi:10.1016/j.chemosphere.2020.127052
Tao, Y., Han, L., Li, X., Han, Y., and Liu, Z. (2016). Molecular structure, spectroscopy (FT-IR, FT-Raman), thermodynamic parameters, molecular electrostatic potential and HOMO-LUMO analysis of 2, 6-dichlorobenzamide. J. Mol. Struct. 1108, 307–314. doi:10.1016/j.molstruc.2015.12.031
Tropsha, A. (2010). Best practices for QSAR model development, validation, and exploitation. Mol. Inf. 29, 476–488. doi:10.1002/minf.201000061
Verma, A. K., Dash, R. R., and Bhunia, P. (2012). A review on chemical coagulation/flocculation technologies for removal of colour from textile wastewaters. J. Environ. Manag. 93, 154–168. doi:10.1016/j.jenvman.2011.09.012
Xiao, R., Ye, T., Wei, Z., Luo, S., Yang, Z., and Spinney, R. (2015). Quantitative structure-activity relationship (QSAR) for the oxidation of trace organic contaminants by sulfate radical. Environ. Sci. Technol. 49, 13394–13402. doi:10.1021/acs.est.5b03078
Keywords: QSAR, dyes, coagulation, molecular parameters, electrostatic adsorption, hydrogen-bonding adsorption
Citation: Zhang M, Qin S, Tan Y and Shen Z (2023) QSAR model and microscopic mechanism analysis of dye removal by coagulation of aluminum chloride under alkaline conditions. Front. Environ. Sci. 11:1156150. doi: 10.3389/fenvs.2023.1156150
Received: 02 February 2023; Accepted: 08 March 2023;
Published: 24 March 2023.
Edited by:
Huiyu Dong, Research Center for Eco-environmental Sciences (CAS), ChinaReviewed by:
Rachid Hsissou, Chouaïb Doukkali University, MoroccoGiovanni Cagnetta, Tsinghua University, China
Copyright © 2023 Zhang, Qin, Tan and Shen. This is an open-access article distributed under the terms of the Creative Commons Attribution License (CC BY). The use, distribution or reproduction in other forums is permitted, provided the original author(s) and the copyright owner(s) are credited and that the original publication in this journal is cited, in accordance with accepted academic practice. No use, distribution or reproduction is permitted which does not comply with these terms.
*Correspondence: Zhemin Shen, em1zaGVuQHNqdHUuZWR1LmNu