 Swagata Payra1
 Manoj Kumar Mishra
 Sunita Verma
- 1Department of Remote Sensing, Birla Institute of Technology Mesra, Ranchi, Jharkhand, India
- 2Institute of Environment and Sustainable Development, Banaras Hindu University, Varanasi, Uttar Pradesh, India
- 3Department of Civil Engineering, Indian Institute of Technology, Bombay, India
- 4Space Application Centre, Indian Satellite Research Organisation (ISRO), Ahmedabad, India
- 5DST-Mahamana Centre of Excellence in Climatology, Banaras Hindu University, Varanasi, Uttar Pradesh, India
In the present study, the first systematic performance evaluation of aerosol optical depth (AOD) products retrieved using two satellite sensors i.e., Visible Infrared Imaging Radiometer Suite (VIIRS) and Aqua-Moderate-Resolution Imaging Spectroradiometer (MODIS) is carried out over India. We have used ground-based AOD from AERONET at 550 nm wavelength for inter-comparison with MODIS Aqua version C6.1 (C061) Deep Blue (DB) aerosol product and VIIRS/SNPP collection version 1.1 (V1.1) DB aerosol product over the time span of 7-year (2014–2020) observation periods. For validation, the average value of satellite pixels falling within the box of 50 Km x 50 Km keeping the AERONET station at the center is retrieved. The average daily data from the AERONET sun photometer (2014–2019) were obtained within ±15 min of satellite overpass time. Statistical parameters like correlation coefficient (R), RMSE, MAE, and RMB were calculated. The uncertainty of satellite AOD is evaluated using an envelope of Expected Error (EE = ±0.05 + 0.15 AOD for land). Statistical analysis shows that the MODIS AOD product outperforms VIIRS-retrieved AOD. The AOD retrieved from both sensors yields a high correlation (0.86—Jaipur, 0.79—Kanpur, 0.84—Gandhi College, and 0.74—Pune for MODIS and 0.75—Jaipur, 0.77—Kanpur, 0.49—Gandhi College, and 0.86—Pune for VIIRS) and low MAE (0.12—Jaipur, 0.20—Kanpur, 0.15—Gandhi College, and 0.09—Pune for MODIS and 0.13—Jaipur, 0.13—Kanpur, 0.26—Gandhi College, and 0.10—Pune for VIIRS). Other statistical measures such as RMSE, RMB, and P also suggest similar performance. More than 66% of the total data fall within the range of EE for both the satellite products at each station. Spatial comparison exhibits the same AOD pattern seasonally as well as annually having a minimum bias from −0.3 to +0.3 between MODIS and VIIRS. Slight underestimation and overestimation are observed in all the stations by MODIS, whereas VIIRS continuously underestimates AOD with increase in optical depth, suggesting improvements in the aerosol model and surface reflection in retrieval. Overall, the comparison of ground AERONET AOD reveals better accuracy of MODIS AOD with that of VIIRS satellite datasets over India.
1 Introduction
Aerosols are solid or liquid particles such as smoke, particulate matter, volcanic dust, and liquid droplets that are suspended in air having a diameter of up to several micrometers (Choi et al., 2019). These particles are emitted from natural and anthropogenic sources (Wang et al., 2017a). Aerosol particles scatter and absorb sunlight and the light scattering from the Earth surface affecting atmospheric radiation balance (Lang-Yona et al., 2010). These particles can survive in the atmosphere from days to weeks and can travel from one region to another (Winker et al., 2013). Multispectral aerosol optical properties are provided by ground measurement instruments (sun photometers) such as AErosol RObotic NETwork (AERONET) (Holben et al., 1998). Though having high temporal resolution and accuracy, these instruments are limited to a particular location. To overcome this problem, various satellites were launched for measurement of aerosol optical depth (AOD) at high to low spatial and temporal resolution. AOD is a measure of light extinction caused by aerosols with the atmospheric column from sensors to the Earth’s surface (Van Donkelaar et al., 2010). Assessment of aerosol column loading in the atmospheric column is extensively examined by AOD (Filonchyk et al., 2019). Aerosol retrieval algorithms have been developed for universal distribution of AOD using various satellite sensors, like the Moderate-Resolution Imaging Spectroradiometer (MODIS) (Levy et al., 2010), Multi-angle Imaging SpectroRadiometer (MISR) (Kahn et al., 2009), Ozone-Monitoring Instrument (OMI) (Torres et al., 2007), INSAT 3D (Mishra, 2018), Advanced Very-High-Resolution Radiometer (AVHRR) (Gao et al., 2016), and Visible Infrared Imaging Radiometer Suite (VIIRS, Sayer et al., 2013).
Recently, various studies were carried out over India using satellite remote sensing and ground-observed aerosol data. Satellite instruments like MODIS and VIIRS are extensively used for monitoring AOD at both global and regional scales (Yao et al., 2018; Sawyer et al., 2020; Su et al., 2022). These satellites provide continuous and long-term datasets for the study. MODIS is one of the most widely used satellite sensors for measuring the properties of atmospheric aerosols, containing 36 spectral bands retrieving information at various wavelengths ranging from 0.41 to 15 µm (Xiao et al., 2016). VIIRS is a new-generation satellite sensor on board Suomi National Polar-orbiting Partnership (SNPP) platform providing aerosol properties at a wavelength of 0.55 µm (Mann et al., 2016). VIIRS was developed with similar specifications as MODIS, having similar resolution (spatial and temporal), spectral channel (VIS/NIR/IR), orbit (polar orbit), and algorithm (Dark Target-DT and Deep Blue-DB) for AOD retrieval (Levy et al., 2015). Therefore, MODIS and VIIRS are considered significant aerosol detection tools for monitoring the global distribution of aerosols with high spatial and temporal resolution.
As for India, uncontrolled vehicular emission, coal burning, biomass burning, industrial emissions, road dust, and dust emission from construction are the primary causes of air pollution. The rampant increase in urbanization, transportation, and industrial activities has reduced the air quality to a critical level (Wang et al., 2017a). Therefore, spatial and temporal studies of air pollution are of utmost importance to enhance the awareness of exposure duration and potential increased risk. MODIS and VIIRS are considered powerful tools for monitoring aerosol at a large scale with high spatial resolution (10 km and 6 km, respectively) (Zhang et al., 2016; Wei et al., 2020). Aerosol products from both satellite sensors are validated with ground-observed AOD is archived from four different AERONET stations over India. Furthermore, MODIS Collection 6.1 (C061) AOD deep blue product and VIIRS version 1.1 (V1.1) deep blue AOD product are compared. Although VIIRS-acquired aerosol products are widely validated throughout the globe such as China (He et al., 2021), Vietnam (Tran et al., 2018), eastern parts of Asia (Choi et al., 2019), and Southeast Asia (Nguyen et al., 2019), over both land and ocean (Huang et al., 2016), further validation of VIIRS products over India is required to check the validity of retrieved aerosol properties and implementation in future air pollution studies. Although the VIIRS AOD retrieval algorithm is based on the MODIS algorithm, the accuracy and stability of the aerosol products derived by VIIRS is reported to be lower than that of MODIS (Liu et al., 2014; Wei et al., 2018; Su et al., 2021). Thus, further study is needed to check the performance of aerosol products of both the satellites MODIS and VIIRS.
The objective of this study is to evaluate the performance of aerosol products of both satellite sensors [Aqua-MODIS AOD (C061) and VIIRS AOD (V1.1)] and investigate their spatial distribution annually as well as seasonally over India. The entire study has been carried out over the time period of 7 years (2014–2020). The AOD product of both the satellites is compared with ground-observed AOD data from four different stations, namely, Jaipur, Kanpur, Gandhi College, and Pune AERONET.
The work thus intercompare and validate VIIRS and MODIS AOD over a region of India known for its complex aerosol properties and high air pollution levels, making it a region of notable environmental concern. This is the first study to determine how VIIRS AOD performs across India. This is particularly important because AOD measurements play a key role in observing and understanding air quality and climate change. Detailed description about datasets is discussed in Section 3. The study area is explained in Section 2. Methodology is described in Section 4. Validation of both the sensors is described in Section 5. Further statistical analyses have been performed, which are shown in Section 5.1. Spatial distribution and intercomparison between both satellites are explained in Section 5.2. Finally, conclusion drawn from the study is summarized in Section 6.
2 Study areas
The entire study focuses on validation and intercomparison of AOD products obtained from two satellites, namely, MODIS and VIIRS, over India using AERONET sites, namely, Jaipur, Kanpur, Gandhi College (Bihar), and Pune, as shown in Figure 1. India extends from 8° 4′ N latitude to 37° 6′ N covering Kanyakumari to Kashmir, and from 68° 7′ N to 97° 25′E covering the Rann of Kutch of Gujrat to Arunachal Pradesh (Yadava et al., 2020). Geographically, India covers 2.4% of the total landmass of the Earth, providing habitat to 16.7% of the total population of the world (Nautiyal et al., 2015). The total area of India is approximately 3.28 million km2. Indian stands at the 7th position in terms of geographical extent and 2nd in terms of population in the world. The southern part of India is a peninsula, as it is bounded by the Indian Ocean on the south, the Arabian Sea on the west, and the Bay of Bengal on the east. The northern frontier of India is surrounded by Himalayan mountains. The great Thar Desert is located at the western part of India (Rajasthan), whereas the eastern part shares the border with China, Bangladesh, and Myanmar. India experiences diverse climatic conditions, varying from arid desert region at the west, tundra and glacier in the north, and tropical humid regions at the south. According to the Indian Meteorological Department (IMD), seasons in India are prominently divided as follows. January and February (JF) are marked as winter months; March, April, and May (MAM) are classified as the pre-monsoon season; June, July, August, and September (JJAS) form the monsoon season; and October, November, and December (OND) are termed as the post monsoon season. Four different AERONET sites (Jaipur, Kanpur, Gandhi College (Bihar), and Pune) are considered for the ground observation datasets. Jaipur (26.91 °N; 75.78 °E) is the capital city of Rajasthan located at the western part of India and the eastern boundary of the Thar Desert (Verma et al., 2013; Payra et al., 2015). Jaipur is a semi-arid zone having a tropical climate, with maximum average temperature 45 °C during summer and 15 °C during winter (Soni et al., 2018). Kanpur (26.45° N, 80.33° E) is the most populated industrial area situated in Uttar Pradesh, India (Gupta, 2008). Kanpur falls within the IGP region of India having subtropical climate. Gandhi University (25.87°N; 84.13°E) is located in the Ballia district of Uttar Pradesh. It is a rural site in the IGP region of India, rich in fertile alluvial soils, and the area often remains flooded by the Ganga and Ghaghara rivers (Choudhry et al., 2012). Pune (18.54°N; 73.80°E) is located in the leeward side of the Western Ghats (Sahyadri Range) in Maharashtra. The city is at a distance of 100 km from the Arabian Sea and has a cool, dry tropical climate.
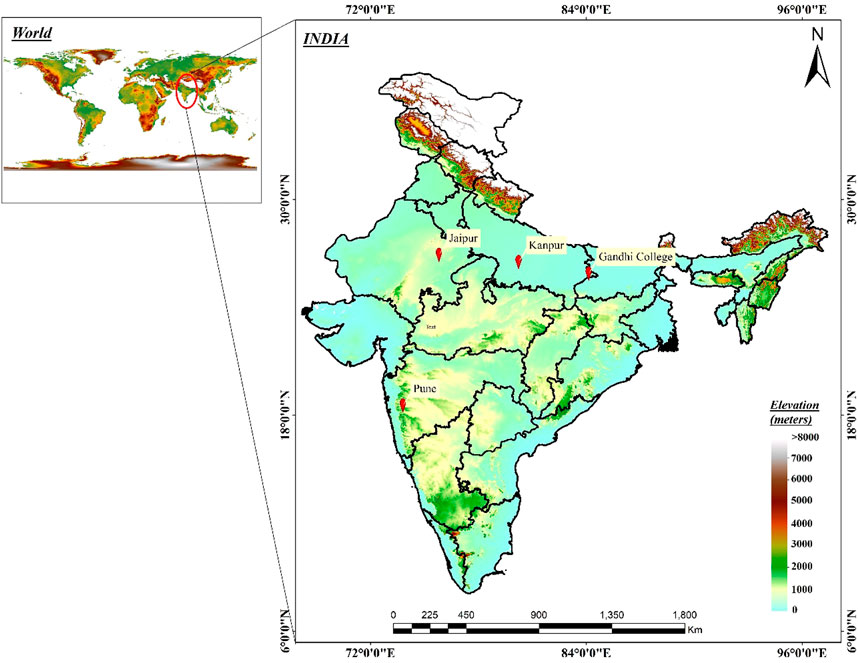
FIGURE 1. Study area.
3 Datasets
3.1 Aqua-MODIS collection 6.1 (C061)
MODIS was launched by NASA (National Aeronautics and Space Administration) on 18 December 1999 and on 4 May 2002 on boarded on Earth Observing System (EOS) satellites, namely, Terra and Aqua (Barnes et al., 2003). MODIS consists of 36 spectral bands with the spatial resolution ranging from 250 m to 1 kilometer with a revisiting period of 1–2 days. Both Terra and Aqua are polar orbital satellites passing over the equator at the same local time of 10:30 am moving from north to south (descending) and 01:30 pm moving from south to north (ascending), respectively (Sandu et al., 2010). The newly launched MODIS collection 6.1 (C061) aerosol product contains three different aerosol inversion algorithms such as the Dark Target (DT) algorithm for land and ocean (Filonchyk & Hurynovich, 2020), the Deep Blue (DB) algorithm for land (Remer et al., 2005; Sayer et al., 2019), and the combined DT and DB (DTB) (Wei et al., 2019a; Wei et al., 2019b) for AOD retrieval. MODIS collection 6.1 (C061) is the updated level 1B radiometer, and all aerosol algorithm calibrated products include the top of atmospheric radiance correction by NASA’s MCST (MODIS Characterization Support Team) (Wei et al., 2019a). Satellite-based aerosol algorithms involve several processes 1) selection of pixels, 2) cloud masking, 3) conversion to surface reflectance, and 4) AOD estimation (radiative transfer models); complete details of the AOD retrieval process of MODIS is explained in Remer et al. (2006). DT algorithms of MODIS retrieve AOD over dark targets, at 10 km spatial resolution using TOA (Top of Atmosphere) reflectance at 0.47, 067, and 2.11 μm channels (Levy et al., 2013). Approximately, 400 pixels undergo the process of masking associated with ice/snow, clouds, or any other brighter pixels as the DT algorithm is not capable of retrieving AOD over brighter surface. An Expected Error (EE) of ± (0.05 + 0.15AOD) over land and ± (0.03 + 0.5AOD) over ocean is estimated (Remer et al., 2005). The expected error can be defined as an envelope of standard deviation around the retrieved AOD. Similarly, the DB algorithm of MODIS retrieves AOD over the dark surface as well as bright surface (desert, Urban) (Bilal et al., 2017). The Deep Blue aerosol product is used in the study. MODIS/Aqua DB aerosol 5 min level 2 swath 10 km, collection 6.1(C061) (MYD04_L2) at a wavelength of 550 nm, is obtained from the Earth Data active archive center (Level-1 and Atmosphere Archive & Distribution System (LAADS) Distributed Active Archive Center (DAAC)) (https://ladsweb.modaps.eosdis.nasa.gov/search/).
3.2 VIIRS version 1.1 (V1.1)
VIIRS is an instrument onboard under the joint mission of NASA and NOAA Soumi NPP (Zhou et al., 2016). It was launched into space on 28 October 2011 to revolve around the Earth in a sun synchronous, polar orbit (Xiong et al., 2013). A total of 22 spectral channels were used by the VIIRS sensor ranging from 0.412 µm to 12 µm (Moyer et al., 2018). Spatial resolution of VIIRS varies from 375 m to 750 m and covers the entire Earth twice a day (Oudrari et al., 2014). Soumi NPP crosses the equator at 1:30 am (nighttime overpass) and 1:30 pm (daytime overpass) at the same local time (Miller et al., 2012).
Like MODIS, VIIRS also works on DT and DB algorithms for AOD retrieval, and both the algorithms (DT & DB) are explained briefly in Section 3.1. In the present study, VIIRS/SNPP Deep Blue (DB) aerosol product collection version 1.1 (V1.1) (“Aerosol_Optical_Thickness_550_Land_Best_Estimate”) L2 6-Min Swath 6 km at 550 nm wavelength is used for validation and intercomparison with MODIS AOD products. The VIIRS_SNPP aerosol 6-Minute level 2 Swath 6 km product is obtained from the Level-1 and Atmosphere Archive & Distribution System (LAADS) Distributed Active Archive Center (DAAC) (https://ladsweb.modaps.eosdis.nasa.gov/search/). A detailed explanation of VIIRS AOD retrieval is illustrated in Wang et al., 2017.
3.3 Ground observation (AERONET)
AERONET (AErosol RObotic NETwork) is a network of ground-based solar and sky radiometer (sun photometer) remote sensing aerosol monitoring instruments developed by international federations NASA and PHOTONS (PHOtométrie pour le Traitement Opérationnel de Normalisation Satellitaire) (Che et al., 2009). It measures aerosol properties at a point location at every 15 min using the CIMEL Electronique 318A sun photometer and provides AOD values at eight different wavelengths ranging from 380 nm to 1,020 nm (Holben et al., 1998; Wang et al., 2017). The estimated uncertainty in AERONET AOD is 0.01–0.02 (Eck et al., 1999; He et al., 2018). The AOD retrieval algorithm is explained in Smirnov et al., 2000. AOD level 2 at 500 nm along with 440–870 angstrom is acquired from AERONET (https://aeronet.gsfc.nasa.gov/cgi-bin/data_display_aod_v3) over all four different active locations, namely, Jaipur (26.906 N; 75.806 E), Kanpur (26.513 N; 80.232 E), Gandhi College (25.871 N; 84.128 E) and Pune (18.537 N; 73.805 E) (Choudhry et al., 2012; Payra et al., 2015; Singh et al., 2017; Mangla et al., 2020).
4 Materials and methods
Validation of satellite AOD is first performed (Ichoku et al., 2002; Liu et al., 2014; Ogunjobi & Awoleye, 2019) using several steps for data collocation and correlation estimation. Satellite-retrieved AOD data, considering each tile of each day falling within the boundary of the study area, are used for processing. Preprocessing steps such as image correction using scale factor and removing null values were performed over satellite AOD as per requirement. Satellite-acquired AOD is extracted over four different spatial windows 20 Km x 20 Km, 50 Km x 50 Km, 80 Km x 80 Km, and 100 Km x 100 Km centered on the AERONET ground site. These satellite-acquired AODs are validated with the average AERONET sun photometer daily data (2014–2019) within the buffer time of different temporal windows in discrete combination of spatial windows of 20, 50, 80, and 100 Km with temporal windows of ±15, ±30, ±60, and ±120 min from the satellite overpass time. This experiment aimed to to find the balance spatiotemporal size of windows to have good correlation and number of match-up points. Statistical analysis is made to find the best performing temporal and spatial windows for validation of satellite AOD. As AERONET does not provide AOD at 550 nm, therefore, we have converted AERONET AOD at 500 nm–550 nm using a quadratic fit on a log–log interpolation. It was found that the Angstrom exponent varies with wavelength because of deviations that occur due to power law size distribution of aerosols (Kaufman, 1993; Sorek-Hamer et al., 2020). These deviations often instigate in
where
Here,
5 Results & discussion
5.1 Correlation plot
Retrieved satellite AOD is compared with ground-based AOD observation over all four prominent AERONET stations (Jaipur, Kanpur, Gandhi College, and Pune) at all four spatiotemporal windows, as shown in Figure 2. Figure 2 demonstrates correlations at all four different discrete combinations of spatial and temporal window (A) 20 Km ± 15 min, (B) 50 Km ± 30 min, (C) 80 Km ± 60 min, and (D) 100 Km ± 120 min. Black dotted lines within the plot represent EE (±0.05 + 0.15 AOD), and red lines denote the best fit of the given datasets. Analysis of all discrete spatiotemporal windows is validated statistically to find the best window size having the maximum number of matchup points along with high correlation. The size of spatial and temporal windows to be used depends on the homogeneity scale of the AOD field and the spatial resolution of the AOD product. From the calculated statistics, it was analyzed that the most suitable spatiotemporal window is 50 Km ± 30 min showing high correlation and least error among all. Statistical values calculated are shown in Table 1.
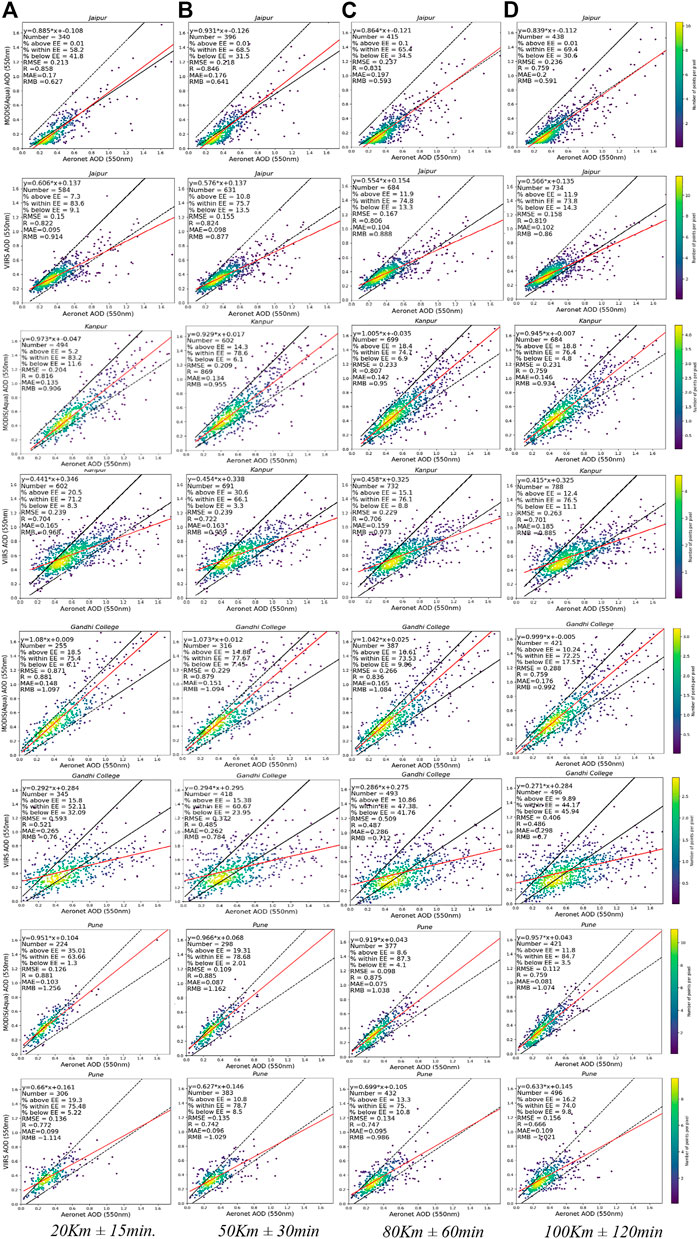
FIGURE 2. Correlation between satellite AOD (550 nm) (MODIS and VIIRS) with AERONET (550 nm) at all four spatiotemporal window (A) 20 km ± 15 min (B) 50 Km ± 30 min (C) 80 Km ± 60 min (D) 100 Km ± 120 min.
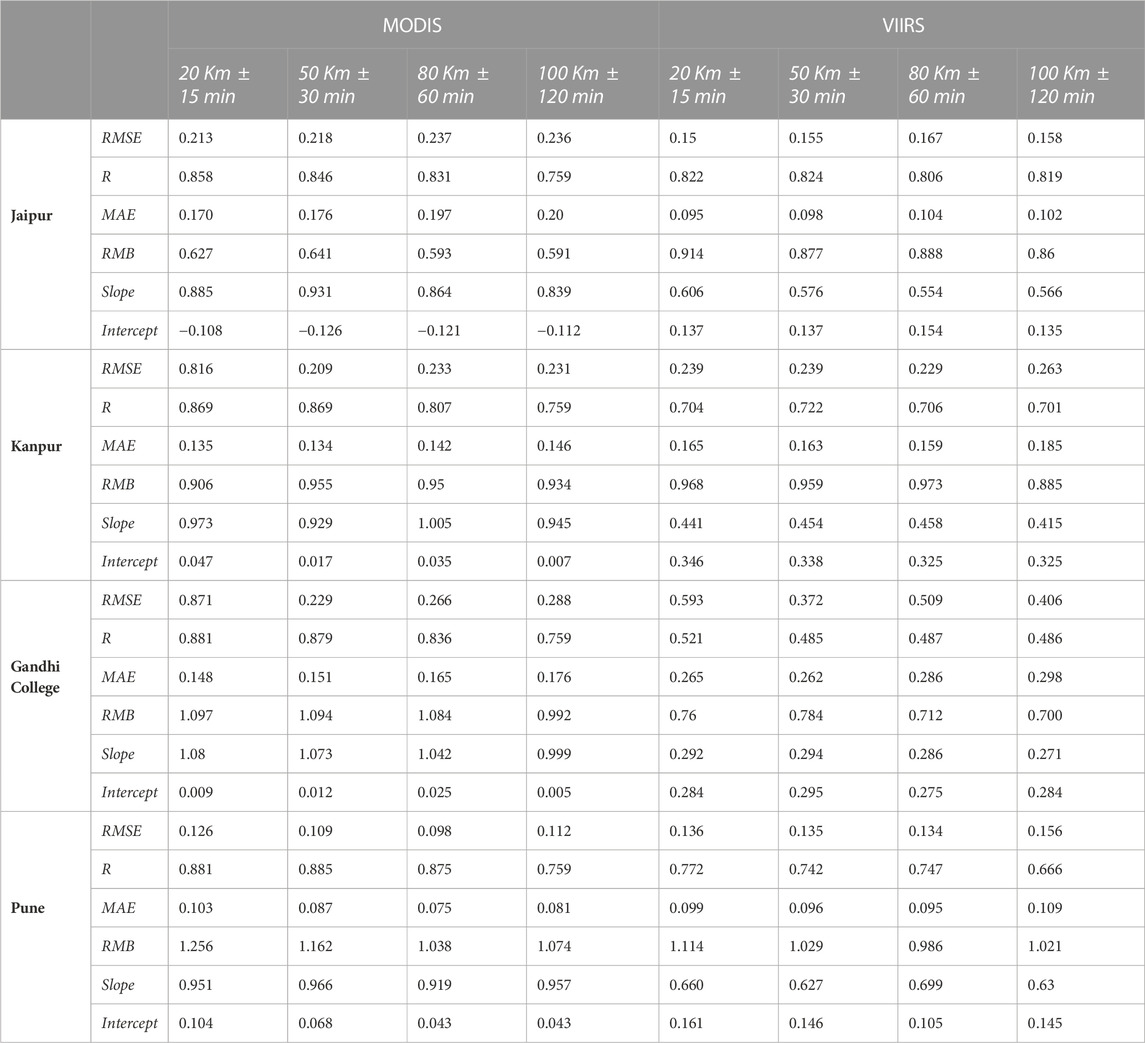
TABLE 1. Statistical chart for different spatiotemporal windows.
All the pixel values within the area of 50 km centered on the AERONET site and ±30 min for satellite overpass time is considered for correlation. More than 1,000 points were collected upon which total valid matchup points with ground observations were 396, 602, 316, and 298 over Jaipur, Kanpur, Gandhi College, and Pune for MODIS, respectively, and 631, 691, 418, and 383 over Jaipur, Kanpur, Gandhi College, and Pune for VIIRS, respectively, considering the best quality flag data from both the satellites. Statistical analysis has been performed on matchup datasets over each station. Figure 2 represents the comparison between MODIS- and VIIRS-retrieved AOD and AERONET AOD over all four AERONET sites. MODIS-acquired AOD shows correlation coefficients (R) 0.846 and 0.869 over Jaipur and Kanpur, respectively, with 68.5% (Jaipur) and 78.6% (Kanpur) of total sample points falling within the expected error (EE). This indicates that the MODIS Aqua 10 Km level 2 product is having good correlation with ground-observed AERONET AOD and meets the minimum criteria of the percentage [66%, (Levy et al., 2010)] of data falling within the EE. RMSE values 0.218 at Jaipur and 0.209 at Kanpur are calculated, which explain the distance of the residuals from the regression line. Therefore, lower RMSE shows better results. RMB 0.641 and 0.955 over Jaipur and Kanpur, respectively, indicated the significant overestimation or underestimation. Other statistical parameters like MAE (0.176—Jaipur and 0.134—Kanpur) are calculated, where MAE represents errors between satellite AOD and ground-observed AOD. Hence, higher the precision value, lower the precision will be (Li et al., 2019). Similar statistics were carried out for the comparison between VIIRS-retrieved AOD with AERONET AOD. Good correlation can be observed with the R values 0.824 and 0.706, with 75.5% and 76.1% of total sample points falling within the EE for Jaipur and Kanpur, respectively. Remaining statistical matrices (RMSE = 0.155, MAE = 0.098, and RMB = 0.877 over Jaipur and RMSE = 0.229, MAE = 0.159, and RMB = 0.973 over Kanpur) also suggest that VIIRS is highly accurate and precise with the ground observation with low RMSE, MAE, and RMB. Very bad slopes for linear regression can be observed for VIIRS (0.576 for Jaipur and 0.454 for Kanpur) as compared to MODIS (0.931 for Jaipur and 0.929 for Kanpur). This indicated an underestimation by VIIRS against AERONET, suggesting requirement for refining the aerosol model. Overall results exhibit that both the satellite-retrieved AOD products are strongly correlating with ground-measured AOD, mentioning the fact the MODIS 10 Km L2 product is showing better results than that of VIIRS. Statistical analysis has been performed over Gandhi College and Pune for both the satellites. MODIS-acquired AOD shows a correlation coefficient (R) of 0.879 and 0.885 over Gandhi College and Pune, respectively, with 77.67% and 78.68% of total sample points satisfying the criteria of EE. RMSE and RMB were calculated to be 0.229 and 1.094 at Gandhi College and 0.109 and 1.162 at Pune, respectively. RMSE explains the distance of the residuals from the regression line. Therefore, lower RMSE shows better results. On the other hand, RMB values indicate the significant overestimation or underestimation by the model. Other statistical parameters like MAE (0.151—Gandhi College and 0.087—Pune) were calculated to estimate the error between satellite AOD and ground-observed AOD. The higher the precision value, the lower the precision will be (Li et al., 2019).
Similar statistical analysis was carried out for comparison between VIIRS-retrieved AOD with AERONET AOD. A positive correlation with the R value of 0.485 along with and other statistical parameters (RMSE = 0.591, MAE = 0.262, and RMB = 0.784 over Gandhi College) were calculated for comparing VIIRS observations with the ground observations of AOD. For VIIRS, only 60.67% of the total sample points fall within the expected error (EE), which fails to meet the minimum criteria of 66% of data falling within the EE (Levy et al., 2010). Furthermore, a lower slope value for linear regression was obtained for VIIRS (0.294) than for MODIS (1.073). Both the sites (Kanpur and Gandhi College) located at the IGP region show less correlation and high error. Significant factors are the presence of a variety of aerosol types, including fine and coarse aerosols, and their mixing (Kumar et., 2017). These aerosols have different optical properties, and their mixing can lead to errors in AOD estimation as the satellite retrieval algorithms may not accurately account for the mixing of different aerosol types. This indicates an underestimation by VIIRS against AERONET, suggesting requirement for refining aerosol models. Pune shows good correlation, with the R value of 0.7441, satisfying the EE criteria, and other statistical parameters (RMSE = 0.135, MAE = 0.096, and RMB = 1.029). Overall results indicate that both the satellite-retrieved AOD products strongly correlate with ground-measured AOD, mentioning the fact that the MODIS 10 km L2 product shows better results than that of VIIRS.
Similarly, the seasonal correlation obtained to study the size distribution of aerosols (i.e., fine, mixed, and coarse-mode dominance) may vary with different seasons; thus, seasonal validation statistics of MODIS and VIIRS AOD is acquired on the basis of size dominance. Figure 3 shows seasonal validation of MODIS and VIIRS with AERONET AOD at 550 nm on the spatiotemporal window of 50 Km ± 30 min over all four sites. Black lines denote the Expected Error (EE) envelope where the trend line is shown in red within the figure. In all seasons, both the satellites show good correlation with AERONET by low errors. Very few matching points were found for both the satellites during monsoon (JJAS) due to heavy cloud cover in this season. Both the satellites show good correlation with ground-observed AOD in all seasons. It can be seen that MODIS is overestimated over Jaipur in winter (JF) and pre-monsoon (MAM) as most of the values are above the trend line because in winter and pre-monsoon, dust storms are more frequent because of reduction in transparency by the Thar Desert, that results in lower reflectance (Payra et al., 2015). Similarly, it is slightly underestimated (OND) over post monsoon, showing more values below the trend line. Similar trends can be seen over Gandhi College in all the seasons. It was noted that VIIRS shows poor slopes as compared to MODIS over both Gandhi College and Kanpur (IGP), that suggests the requirement for refining aerosol models used in DB retrievals as satellites (VIIRS) underestimate areas having high aerosol loading. Very slight underestimation is observed over Pune in all the seasons by both the satellites, which may be due to the dominance of anthropogenic fine-mode aerosol particles (Gawhane et al., 2019). To check the size dominance of AOD, a seasonal distribution of AE has been studied, as shown in Figure 4. The box and whisker plot represent seasonal variation of AE. Green dots within the plot (Figure 4) indicate the mean value of the sample space, and the black horizontal lines represent the median of the distribution. An angstrom is a quantitative indicator having a higher value for fine-mode dominated aerosols and a lower value for coarse-mode dominated particles (Deep et al., 2021). It is found that pre-monsoon (MAM) and monsoon (JJAS) are showing low AE (AE < 1), indicating the presence of coarser mode of aerosols over all the sites, except over Gandhi College for both the satellites. Gandhi College is showing fine-mode aerosol types throughout the year. This is most likely, due to open burning of crops (wheat) in the pre-monsoon season, as agriculture is the major activity in this region. This produces very fine aerosol biomass in the region (Sharma et al., 2010; Srivastava et al., 2011). During the months of winter (JF) and post monsoon (OND), the AE value remains more than 1, showing the presence of fine-mode particles.
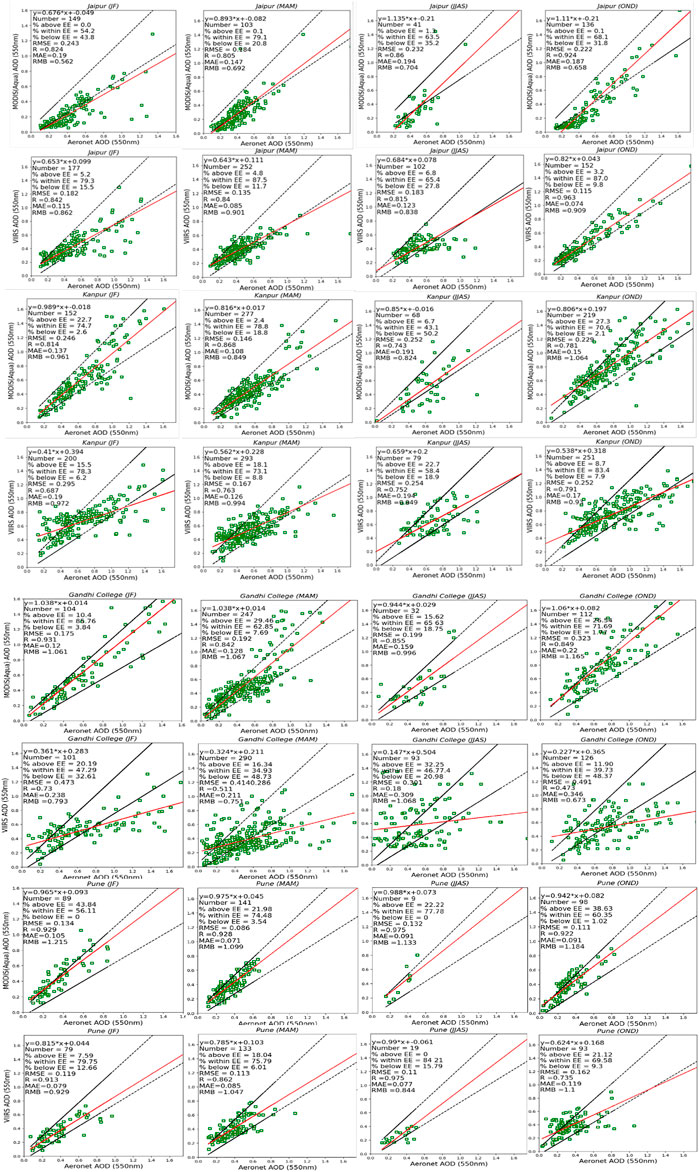
FIGURE 3. Seasonal variation of AOD (550 nm) against AERONET AOD (550 nm).
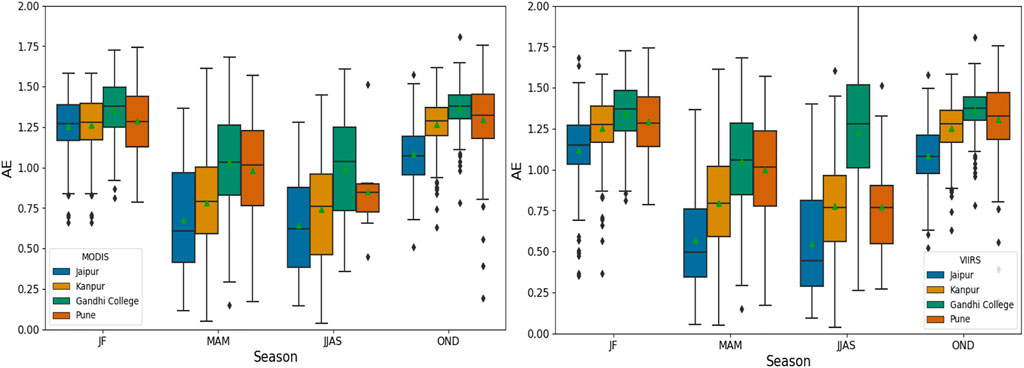
FIGURE 4. Box and whisker plot representing the seasonal variation of AERONET AE.
5.2 Spatial distribution
For a period of 7 years (2014–2020), the spatial distribution of both satellites (MODIS and VIIRS) has been studied both seasonally as well as annually. According to the Indian Meteorological Department (IMD), seasons over India are classified into winter season JF (January–February), pre-monsoon MAM (March–May), southwest monsoon season JJAS (June–September), and post monsoon season OND (October–December) (Singh et al., 2021).
Figures 5–8 display the spatial heterogeneity in AOD retrieved from Aqua-MODIS for all four different seasons (JF, MAM, JJAS, and OND) from 2014 to 2020. Similarly, Figures 9–12 represent VIIRS-derived AOD for the respective season at the same given period of time. Both satellites depict almost similar spatial distribution patterns in almost all the seasons. Concentration of AOD in winter (JF, Figures 5, 9) and post monsoon (OND, Figures 8, 12) seasons in both the satellites is high over India, especially over the Indo–Gangetic Plain (IGP). This is due to interference of planetary boundary layer (PBL) fluctuation that stays low during the winter and post monsoon season forming inversion layers, which limit the vertical mixing of columnar aerosol and avoid dispersion (Ramachandran et al., 2012; Murari et al., 2015). The reverse phenomenon is observed in pre-monsoon season (MAM), where the PBL moves up due to high insulation, providing a favorable condition for vertical mixing and dispersion, resulting in lower concentration of AOD loading (Figures 6, 10). India experiences most of the rainfall in months of JJAS when the southwest monsoon strikes the Indian landmass. It is expected that precipitation during these months results in reduction of the mass concentration of AOD, resulting in lower AOD loading in JJAS (Prasad et al., 2004), though both the satellites were found to be overestimating the AOD concentration during these months (Figures 7, 11). Figure 3 justifies that JJAS coarse-mode particles are dominant over fine mode (AE >1). In these months, the atmosphere is less transparent due to the presence of huge amount of water vapor and relative humidity that decrease the surface reflectance, resulting in overestimation of AOD. It should be emphasized that overestimation is most probably due to hindrance in AOD retrieval because of cloud cover (Ramachandran & Cherian, 2008). The other possible reason of detecting high AOD concentration in the presence of high amount of water vapor or relative humidity during these seasons leads to condensation of water vapor on the aerosol particle surface, which affects the aerosol optical properties by changing the effective refractive index and size of particles. This increase in the extinction coefficient (scattering and absorption) results in large optical depth.
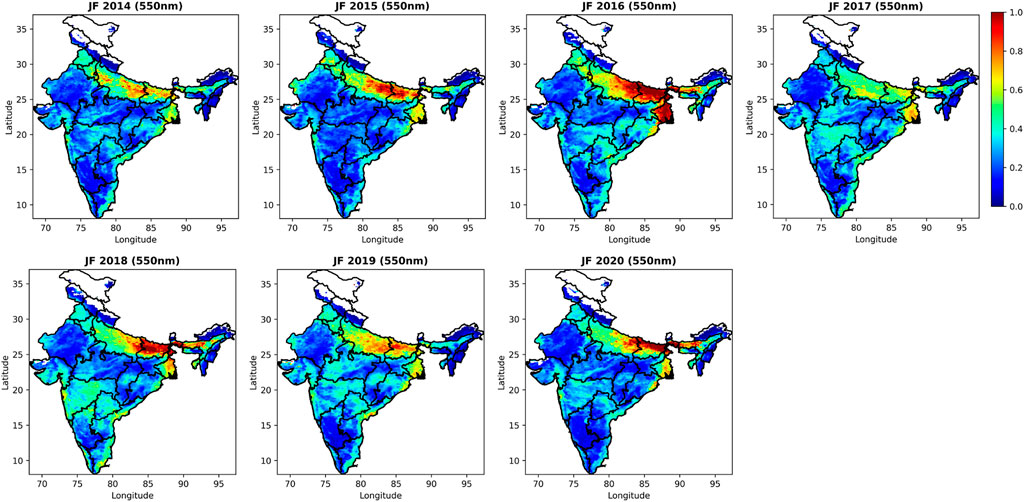
FIGURE 5. MODIS spatial distribution for winter season (JF, 2014–2020).
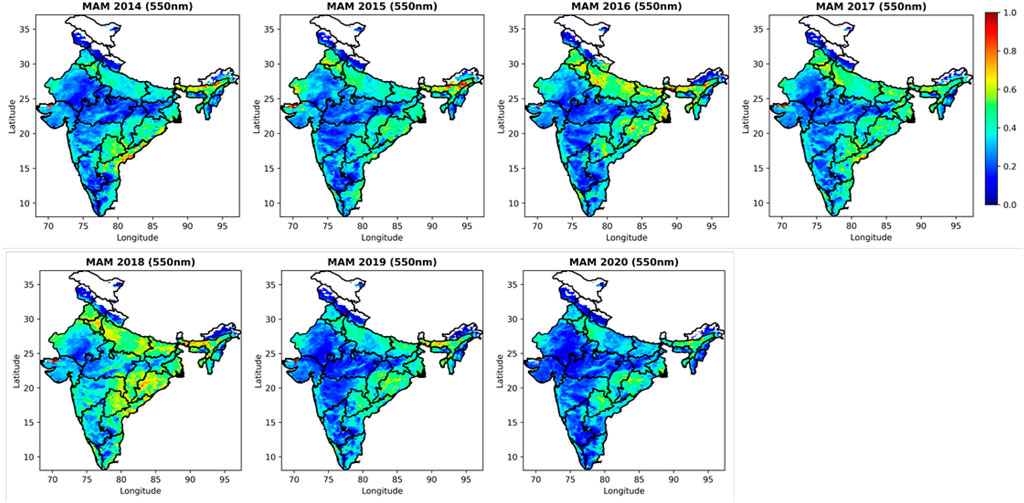
FIGURE 6. MODIS spatial distribution for pre-monsoon season (MAM, 2014–2020).
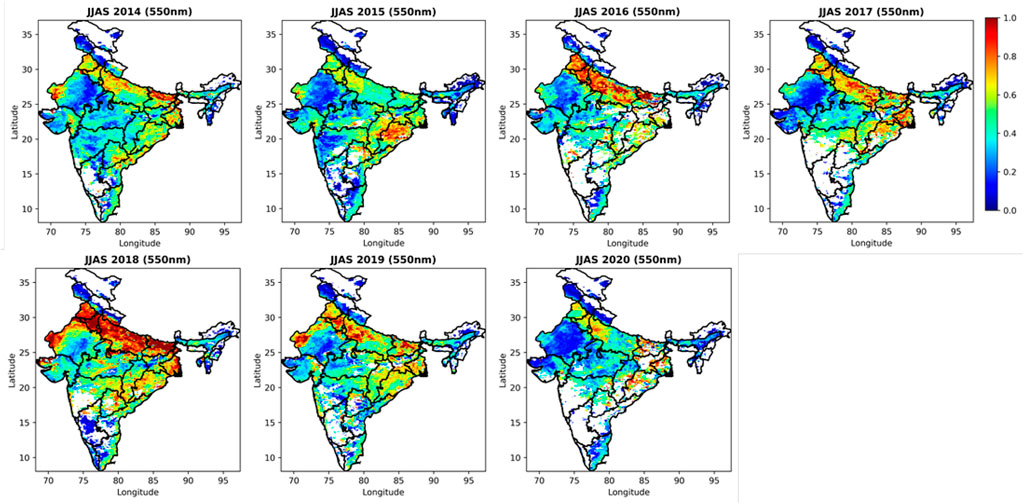
FIGURE 7. MODIS spatial distribution for southwest monsoon season (JJAS, 2014–2020).
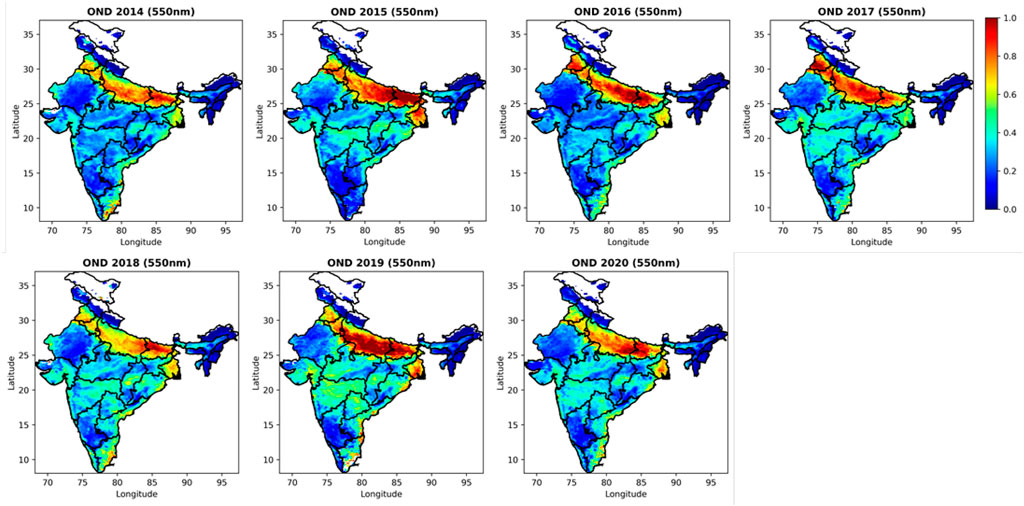
FIGURE 8. MODIS spatial distribution for post monsoon season (OND, 2014–2020).
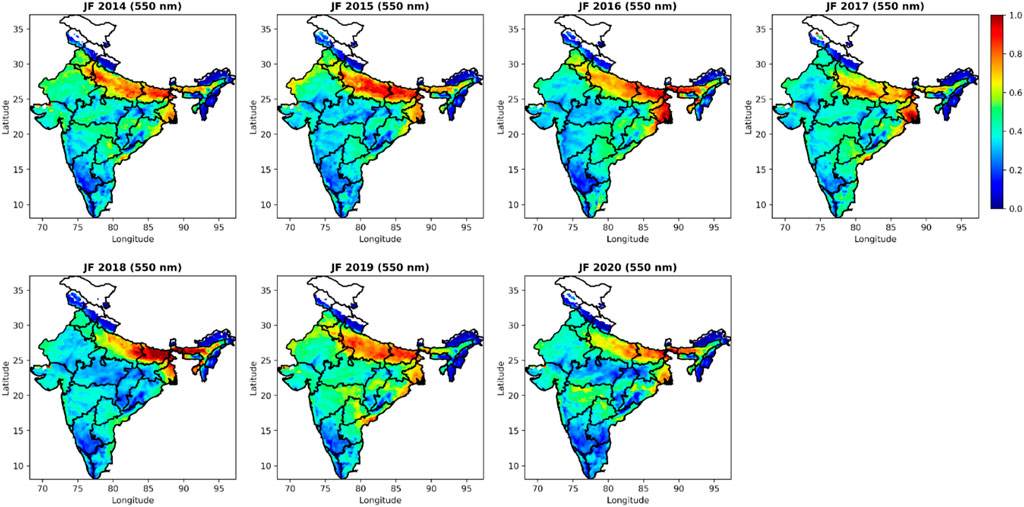
FIGURE 9. VIIRS spatial distribution for winter season (JF, 2014–2020).

FIGURE 10. VIIRS spatial distribution for pre-monsoon season (MAM, 2014–2020).
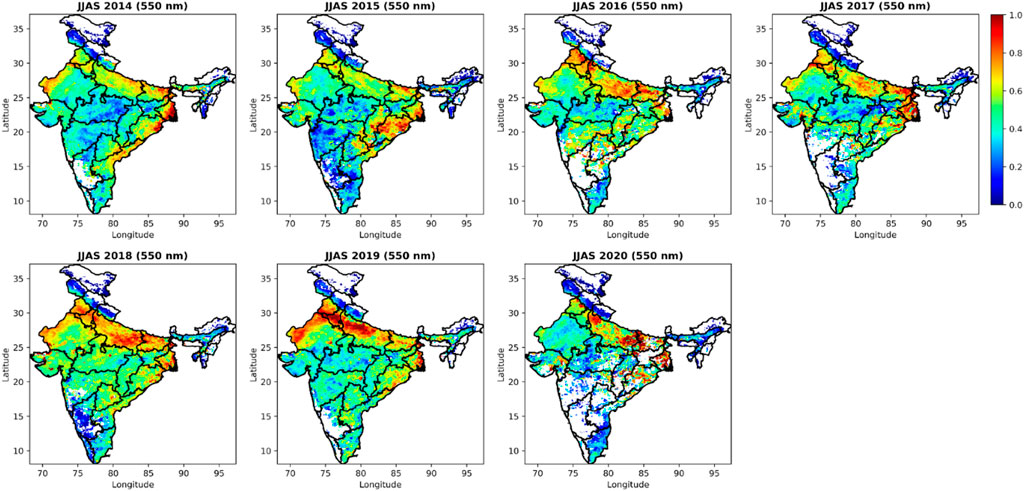
FIGURE 11. VIIRS spatial distribution for southwest monsoon season (JJAS, 2014–2020).
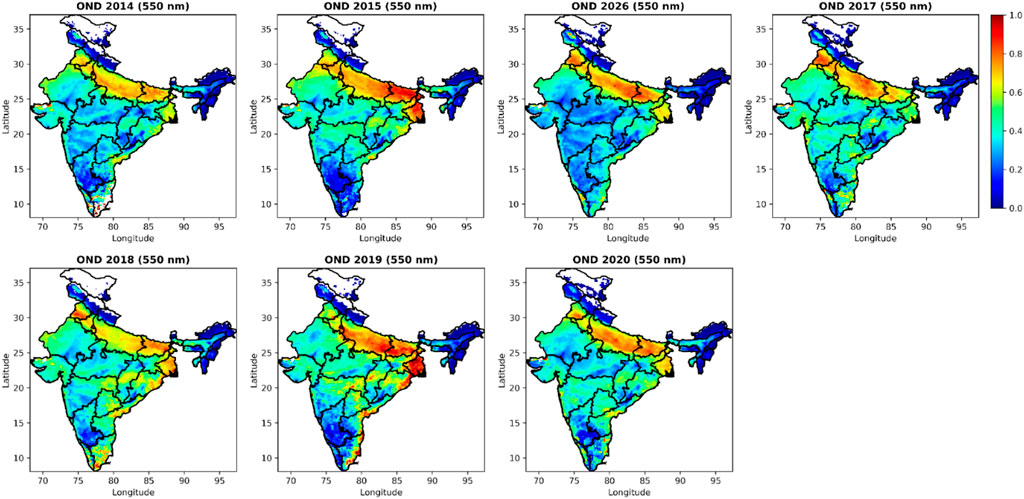
FIGURE 12. VIIRS spatial distribution for post monsoon season (OND, 2014–2020).
Overall comparison of annual mean of AOD for MODIS (Figure 13) and VIIRS (Figure 14) has been performed to check the spatial heterogeneity from years 2014–2020. Both the satellites exhibit almost similar spatial variability ranging from 0 to 1. Aerosol loading over the IGP is high in all the years from both satellite products. The IGP region consists of several states, like Punjab, Haryana, Uttarakhand, Uttar Pradesh, Bihar, and West Bengal (Saud et al., 2012), which are the major sources of anthrophonic air pollution such as transportation, construction activities, household pollutants, and biomass burning, as these states are highly industrialized and densely populated (Kedia et al., 2014). Another reason is that the IGP is highly influenced under the desert dust coming from the western part of India (Thar Desert, Rajasthan) due to advection from the arid to semi-arid zone during spring and summer (Eck et al., 2012). Figure 15 shows the bias between VIIRS and MODIS (VIIRS–MODIS). A systematic bias has been observed among all the years between VIIRS and MODIS ranging from minimum −0.3 to maximum 0.3 (30% approximately). VIIRS is found to be overestimating in the western part of India covering states like Rajasthan and Gujrat. This overestimation is due to higher albedo over the desert part of India. Similar patterns can be observed over parts of the Southern Peninsula in India. On an average, the bias between VIIRS and MODIS ranges between −0.15 and 0.15.

FIGURE 13. Annual spatial variability of MODIS (2014–2020).
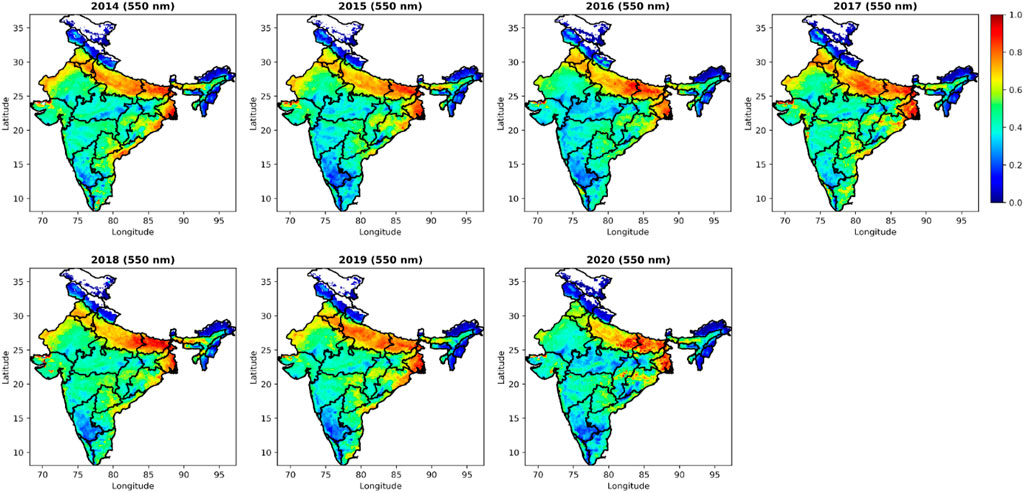
FIGURE 14. Annual spatial variability of VIIRS (2014–2020).

FIGURE 15. Bias map showing differences between VIIRS AOD and MODIS AOD (VIIRS—MODIS).
Different aerosol types are known to significantly affect the accuracy of satellite-derived AOD products. Furthermore, to investigate the effects of different aerosol types, satellite-derived AODs have been documented. AE derived from AERONET is used to investigate the size and aerosol types, as shown in Figure 16 for both the satellites MODIS (A-D) and VIIRS (E-H) over all the four stations. AE < 0.6 is classified as the Coarse mode, 0.6< AE<1.2 is considered as mixed-mode aerosol, and AE > 1.2 is classified as the fine mode (Logothetis et al., 2020; Ali et al., 2020). All the stations, except Jaipur, in both the satellites are found to be dominated by fine- and mixed-mode aerosol particles. Fine-mode aerosols, which are typically smaller in size and more abundant in urban and industrial areas, tend to scatter and absorb light more efficiently at shorter wavelengths in the visible spectrum (Yang et al., 2009). Mixed-mode aerosols are those that have both fine- and coarse-mode particles in their size distribution. These aerosols can have a significant impact on satellite-derived AOD estimates due to their complex optical properties and size distribution (Levy et al., 2007). As a result, the presence of fine- and mixed-mode aerosols can cause satellite-retrieved AOD values in the visible spectrum to be underestimated. This underestimation is more prominent in VIIRS as compared to MODIS for the entire IGP region, as shown in Figures 15—bias between VIIRS and MODIS). However, VIIRS overestimates AOD for Jaipur, which is dominated by coarse-mode particles, likely due to dust from the Thar Desert. Coarse-mode aerosols, which are typically larger in size and more abundant in desert regions, tend to scatter and absorb light more efficiently at longer wavelengths in the near-infrared spectrum (Ma et al., 2019). This can lead to satellite-retrieved AOD values in the near-infrared spectrum to be overestimated in the presence of coarse-mode aerosols. Overall, MODIS performed better than VIIRS, indicating that VIIRS AOD retrieval is significantly affected by aerosol type. This suggests the need for proper incorporation of aerosol type information into the retrieval algorithm by refining aerosol models. By taking into account the effects of different aerosol types, we can better understand the sources and impacts of aerosols on the atmosphere and improve the accuracy of satellite-retrieved AOD estimates.
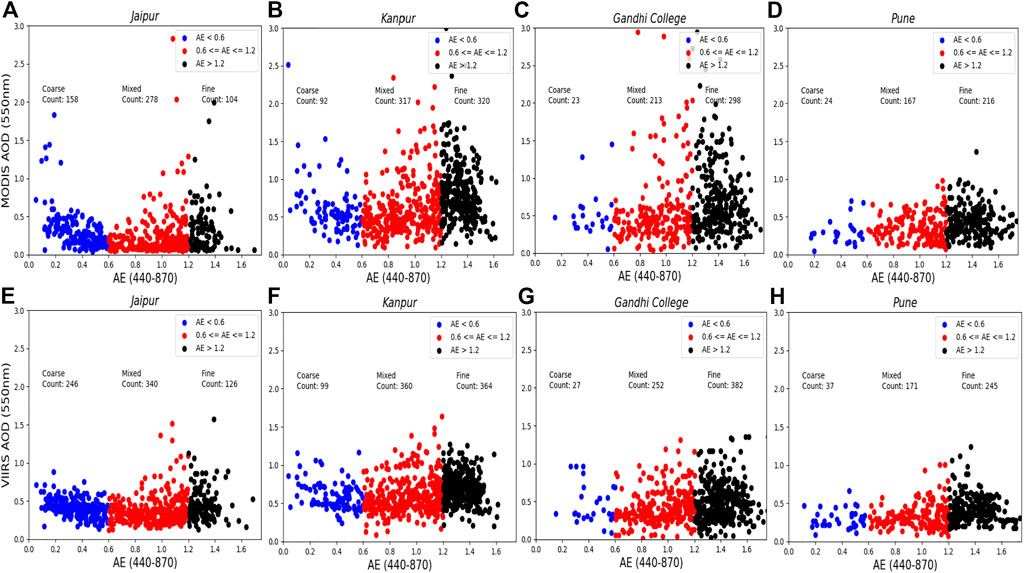
FIGURE 16. Scatter plot of AE (440–870 nm) against satellite AOD at 550 nm for both the satellite MODIS (A–D) and VIIRS (E–H).
Figure 17 represents the box plot between satellite-derived AOD biases (AODSatellite–AODAERONET) with respect to ground-observed AOD. The presented data in Figure 17A through 17D depict MODIS observations over Jaipur, Kanpur, Gandhi College, and Pune, respectively, whereas data in Figure 17E to 17H illustrate VIIRS observations over the same locations. EE is shown in the black dotted line, whereas the red line within the box is the median. The box plot represents the 2nd and 3rd quartile, and whiskers are the minimum and maximum (1st and 4th quartile) AOD errors. Numbers above each box represent the total sample point falling within the range of the respective box. Total collected sample points were taken from 2014 to 2020 of both the satellites against AERONET AOD. Graphs suggest that most of the satellite-derived AOD fall within the range of 0–1. Figure 17A shows that MODIS overestimates AOD over Jaipur, while VIIRS underestimates AOD >0.2. (Figure 17E). However, an opposite trend is observed over Kanpur (Figures 17B, F), where MODIS is overestimating at AOD <0.6, and VIIRS is overestimating at AOD<0.4. For Gandhi College, MODIS (Figure 17C) overestimates AOD (except for AOD = 0.6–0.8), while VIIRS (Figure 17G) underestimates AOD >0.4. An opposite trend is observed over Pune (Figures 17D, H), where MODIS underestimates AOD and VIIRS overestimates AOD <1.6. A common trend is emphasized that both the satellites underestimate AOD >1 on both the stations. Numbers above each box represent that the total sample point falls within the range of ground-observed AOD. Most of the points fall within the range of 0.2–0.8 and were within the EE. The results indicate that MODIS is showing better accuracy than that of VIIRS over Jaipur, Kanpur, and Gandhi College, while VIIRS performs better over Pune. Graphs also depicted that the data over Pune have low and systematic bias compared to those over Gandhi College. MODIS indicates very slight fluctuation from the observation of positive and negative bias at all stations (Figure 17A–D) with very low overestimation and underestimation. On the other hand, VIIRS is consistently moving toward the negative bias with increasing optical depth. VIIRS has been found to significantly underestimate high aerosol loadings in all the stations (Figures 17E, F), indicating that the aerosol model used may not be appropriate and that there could be errors in the estimated surface reflectance. The underestimation of aerosol loadings by satellites can be attributed to errors in the retrieval of aerosol optical depth (AOD), which can be influenced by uncertainties in the estimation of surface reflectance. Overestimation of surface reflectance can lead to underestimation of AOD, introducing biases in the retrieval of aerosol loadings and contributing to uncertainty in the estimates (Ali et al., 2020; Bilal et al., 2018). The findings suggest that there is a need for improvements in the VIIRS algorithm to enhance the accuracy of aerosol loading estimates. This could include refinement of the aerosol models used in the algorithm, as well as improvements in the calibration and validation procedures to reduce uncertainties and biases due to surface reflectance in the retrievals.
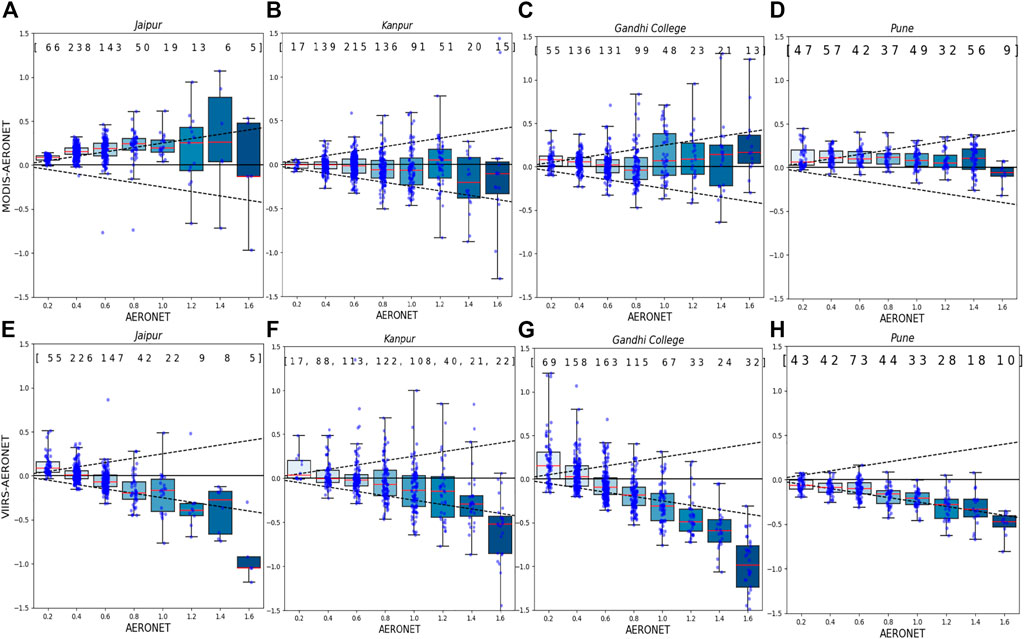
FIGURE 17. Box plot of AOD bias (satellite AOD–AERONET AOD) against AERONET at 550 nm for Modis (A–D) and for VIIRS (E–H) over Jaipur, Kanpur, Gandhi College, and Pune.
Figure 18 represents the pair plot, also known as a scatter plot matrix, which is a graphical representation that displays the relationships and distributions between MODIS, VIIRS, and AERONET AOD for all the stations. The diagonal subplot contains the baseline AOD kernel density estimate, while the scatterplots provide insight into the relationship between AOD values of all three instruments. The results show that the correlation between all three instruments in Jaipur is almost the same, ranging from 0.82 to 0.84. However, at Kanpur, Gandhi College, and Pune, MODIS AOD was observed to be well-correlated with AERONET AOD, with correlation coefficients of 0.82, 0.88, and 0.85, respectively. These results indicate that MODIS has better agreement with AERONET AOD compared to VIIRS at these stations.
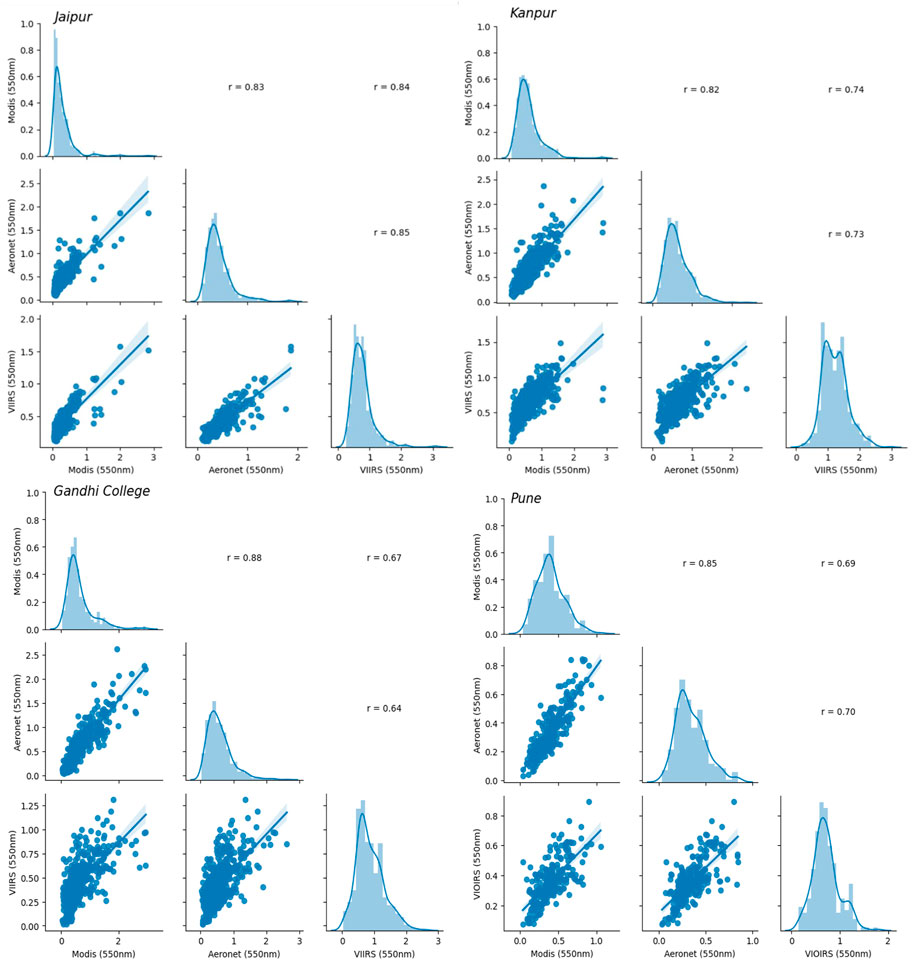
FIGURE 18. Pair plot correlation coefficient for MODIS, VIIRS, and AERONET.
6 Conclusion
This work involved validating the VIIRS AOD (550 nm) DB product and Aqua-MODIS AOD DB product with ground-observed AOD over India. To examine the performance of both satellite AOD products, the study was conducted for a period of 7 years (2014–2020). VIIRS is a new-generation polar orbital satellite developed on the MODIS and AVHRR heritage. Both the satellites use the similar AOD retrieval algorithm.
The study suggests that both the satellites provide good AOD products with a higher correlation range of 0.75–0.85 with ground observation over India. The evaluation and statistical comparison between satellite-retrieved AOD and ground-measured AOD exhibit that MODIS provides better AOD products with high correlation (0.86—Jaipur, 0.79—Kanpur, 0.84—Gandhi College, and 0.74—Pune) along with low RMSE (0.16—Jaipur, 0.31—Kanpur, 0.23—Gandhi College, and 0.11—Pune), MAE (0.12—Jaipur, 0.20—Kanpur, 0.15—Gandhi College, and 0.09—Pune), and RMB (0.83—Jaipur, 1.01—Kanpur, 1.09—Gandhi College, and 1.16—Pune). Slightly low correlation is evaluated for VIIRS (0.75—Jaipur, 0.77—Kanpur, 0.49—Gandhi College, and 0.86—Pune), having RMSE (0.22—Jaipur, 0.28—Kanpur, 0.37—Gandhi College, and 0.14—Pune), MAE (0.13—Jaipur, 0.13—Kanpur, 0.26—Gandhi College, and 0.10—Pune), and RMB (0.97—Jaipur, 0.91—Kanpur, 0.78—Gandhi College, and 1.03—Pune) with respect to MODIS over Jaipur, whereas the opposite trend is observed over Kanpur. The expected error envelope (±0.05 + 0.15 AOD) is used over both the satellite products where more than 66% of total sample points fall within the EE over both the AERONET sites.
Approximately equal spatial homogeneities have been observed between the two satellites, indicating high AOD values in winter and post monsoon, with low AOD reported in summer. Fine-mode particles are more common during the months of October, November, December, January, and February, than coarse-mode particles, which dominate during the months of March to September. This is due to the change in optical properties of aerosol due to dust storms (MAM) and high-water vapor content (JJAS). There is a systematic bias that has been reported with a range of −0.3 to 0.3 where the AOD value is ranging from 0.2 to 0.8. Furthermore, different aerosol-type studies explain that VIIRS needs refinement aerosol models, which underestimate fine-mode and overestimate coarse-mode aerosols. MODIS displays a decent underestimation and overestimation, whereas VIIRS underestimates high aerosol loading. Overall, the study concludes that both satellites offer high-quality AOD products, while MODIS shows slightly better performance than that of VIIRS over India. Both high-resolution satellites play an important role in monitoring and evaluating accurate and precise air quality information.
Data availability statement
The original contributions presented in the study are included in the article/Supplementary Material; further inquiries can be directed to the corresponding author.
Author contributions
SP: conceptualization, supervision, interpretation, and reviewing; AS: data curation, visualization, and interpretation; MM: visualization, reviewing, and editing; SV: writing—original draft preparation, supervision, interpretation, and reviewing. All authors listed have made a substantial, direct, and intellectual contribution to the work and approved it for publication.
Funding
This work was supported by the Indian Space Research Organization under the Respond program, Government of India (ISRO/RES/3/806/19-20).
Acknowledgments
The authors wish to express sincere thanks to NASA and acknowledge MODIS and VIIRS mission. Authors also acknowledge NASA Goddard Space Flight Center in Greenbelt, Maryland, for AERONET data along the PI of respective sites. The authors gratefully acknowledge the MODIS mission group for producing reliable datasets used in this research effort. The authors also wish to express sincere thanks for the financial support from the Indian Space Research Organization under the Respond program, Government of India (ISRO/RES/3/806/19-20).
Conflict of interest
The authors declare that the research was conducted in the absence of any commercial or financial relationships that could be construed as a potential conflict of interest.
Publisher’s note
All claims expressed in this article are solely those of the authors and do not necessarily represent those of their affiliated organizations, or those of the publisher, the editors, and the reviewers. Any product that may be evaluated in this article, or claim that may be made by its manufacturer, is not guaranteed or endorsed by the publisher.
References
Ali, M. A., Nichol, J. E., Bilal, M., Qiu, Z., Mazhar, U., Wahiduzzaman, M., et al. (2020). Classification of aerosols over Saudi Arabia from 2004–2016. Atmos. Environ. 241, 117785. doi:10.1016/j.atmosenv.2020.117785
Barnes, W. L., Xiong, X., and Salomonson, V. V. (2003). Status of terra MODIS and aqua MODIS. Adv. Space Res. 32 (11), 2099–2106. doi:10.1016/S0273-1177(03)90529-1
Bilal, M., Nichol, J. E., and Wang, L. (2017). New customized methods for improvement of the MODIS C6 Dark Target and Deep Blue merged aerosol product. Remote Sens. Environ. 197, 115–124. doi:10.1016/j.rse.2017.05.028
Bilal, M., Qiu, Z., Campbell, J. R., Spak, S. N., Shen, X., and Nazeer, M. (2018). A new MODIS C6 Dark Target and Deep Blue merged aerosol product on a 3 km spatial grid. Remote Sens. 10 (3), 463. doi:10.3390/rs10030463
Che, H., Zhang, X., Chen, H., Damiri, B., Goloub, P., Li, Z., et al. (2009). Instrument calibration and aerosol optical depth validation of the China Aerosol Remote Sensing Network. J. Geophys. Res. Atmos. 114 (D3), D03206. doi:10.1029/2008JD011030
Choi, M., Lim, H., Kim, J., Lee, S., Eck, T. F., Holben, B. N., et al. (2019). Validation, comparison, and integration of GOCI, AHI, MODIS, MISR, and VIIRS aerosol optical depth over East Asia during the 2016 KORUS-AQ campaign. Atmos. Meas. Tech. 12 (8), 4619–4641. doi:10.5194/amt-12-4619-2019
Choudhry, P., Misra, A., and Tripathi, S. N. (2012). “Study of MODIS derived AOD at three different locations in the Indo gangetic plain: Kanpur, Gandhi college and nainital,” in Annales geophysicae (Göttingen, Germany: Copernicus Publications), 30, 1479–1493. doi:10.5194/angeo-30-1479-2012
Deep, A., Pandey, C. P., Nandan, H., Singh, N., Yadav, G., Joshi, P. C., et al. (2021). Aerosols optical depth and Ångström exponent over different regions in Garhwal Himalaya, India. Environ. Monit. Assess. 193 (6), 324. doi:10.1007/s10661-021-09048-4
Eck, T. F., Holben, B. N., Reid, J. S., Dubovik, O., Smirnov, A., O'neill, N. T., et al. (1999). Wavelength dependence of the optical depth of biomass burning, urban, and desert dust aerosols. J. Geophys. Res. Atmos. 104 (D24), 31333–31349. doi:10.1029/1999JD900923
Eck, T. F., Holben, B. N., Reid, J. S., Giles, D. M., Rivas, M. A., Singh, R. P., et al. (2012). Fog-and cloud-induced aerosol modification observed by the Aerosol Robotic Network (AERONET). J. Geophys. Res. Atmos. 117 (D7). doi:10.1029/2011JD016839
Filonchyk, M., and Hurynovich, V. (2020). Validation of MODIS aerosol products with AERONET measurements of different land cover types in areas over Eastern Europe and China. J. Geovisualization Spatial Analysis 4, 10–11. doi:10.1007/s41651-020-00052-9
Filonchyk, M., Yan, H., Zhang, Z., Yang, S., Li, W., and Li, Y. (2019). Combined use of satellite and surface observations to study aerosol optical depth in different regions of China. Sci. Rep. 9 (1), 617. doi:10.1038/s41598-019-42466-6
Gao, L., Li, J., Chen, L., Zhang, L., and Heidinger, A. K. (2016). Retrieval and validation of atmospheric aerosol optical depth from AVHRR over China. IEEE Trans. Geoscience Remote Sens. 54 (11), 6280–6291. doi:10.1109/tgrs.2016.2574756
Gawhane, R. D., Rao, P. S. P., Budhavant, K., Meshram, D. C., and Safai, P. D. (2019). Anthropogenic fine aerosols dominate over the Pune region, Southwest India. Meteorology Atmos. Phys. 131, 1497–1508. doi:10.1007/s00703-018-0653-y
Gupta, U. (2008). Valuation of urban air pollution: A case study of Kanpur city in India. Environ. Resour. Econ. 41 (3), 315–326. doi:10.1007/s10640-008-9193-0
He, L., Wang, L., Lin, A., Zhang, M., Bilal, M., and Wei, J. (2018). Performance of the NPP-VIIRS and aqua-MODIS aerosol optical depth products over the yangtze river basin. Remote Sens. 10 (1), 117. doi:10.3390/rs10010117
He, L., Wang, L., Li, Z., Jiang, D., Sun, L., Liu, D., et al. (2021). VIIRS environmental data record and deep blue aerosol products: Validation, comparison, and spatiotemporal variations from 2013 to 2018 in China. Atmos. Environ. 250, 118265. doi:10.1016/j.atmosenv.2021.118265
Holben, B. N., Eck, T. F., Slutsker, I. A., Tanre, D., Buis, J. P., Setzer, A., et al. (1998). AERONET—a federated instrument network and data archive for aerosol characterization. Remote Sens. Environ. 66 (1), 1–16. doi:10.1016/S0034-4257(98)00031-5
Huang, J., Kondragunta, S., Laszlo, I., Liu, H., Remer, L. A., Zhang, H., et al. (2016). Validation and expected error estimation of Suomi-NPP VIIRS aerosol optical thickness and Ångström exponent with AERONET. J. Geophys. Res. Atmos. 121 (12), 7139–7160. doi:10.1002/2016JD024834
Ichoku, C., Chu, D. A., Mattoo, S., Kaufman, Y. J., Remer, L. A., Tanré, D., et al. (2002). A spatio-temporal approach for global validation and analysis of MODIS aerosol products. Geophys. Res. Lett. 29 (12), MOD1–1. doi:10.1029/2001GL013206
Kahn, R. A., Nelson, D. L., Garay, M. J., Levy, R. C., Bull, M. A., Diner, D. J., et al. (2009). MISR aerosol product attributes and statistical comparisons with MODIS. IEEE Trans. Geoscience Remote Sens. 47 (12), 4095–4114. doi:10.1109/TGRS.2009.2023115
Kaufman, Y. J. (1993). Aerosol optical thickness and atmospheric path radiance. J. Geophys. Res. Atmos. 98 (D2), 2677–2692. doi:10.1029/92JD02427
Kedia, S., Ramachandran, S., Holben, B. N., and Tripathi, S. N. (2014). Quantification of aerosol type, and sources of aerosols over the Indo-Gangetic Plain. Atmos. Environ. 98, 607–619. doi:10.1016/j.atmosenv.2014.09.022
King, M. D., and Byrne, D. M. (1976). A method for inferring total ozone content from the spectral variation of total optical depth obtained with a solar radiometer. J. Atmos. Sci. 33 (11), 2242–2251. doi:10.1175/1520-0469(1976)033<2242:AMFITO>2.0.CO;2
Kumar, M., Raju, M. P., Singh, R. K., Singh, A. K., Singh, R. S., and Banerjee, T. (2017). Wintertime characteristics of aerosols over middle Indo-Gangetic Plain: Vertical profile, transport and radiative forcing. Atmos. Res. 183, 268–282. doi:10.1016/j.atmosres.2016.09.012
Lang-Yona, N., Abo-Riziq, A., Erlick, C., Segre, E., Trainic, M., and Rudich, Y. (2010). Interaction of internally mixed aerosols with light. Phys. Chem. Chem. Phys. 12 (1), 21–31. doi:10.1039/B913176K
Levy, R. C., Remer, L. A., and Dubovik, O. (2007). Global aerosol optical properties and application to Moderate Resolution Imaging Spectroradiometer aerosol retrieval over land. J. Geophys. Res. Atmos. 112 (D13). doi:10.1029/2006JD007815
Levy, R. C., Remer, L. A., Kleidman, R. G., Mattoo, S., Ichoku, C., Kahn, R., et al. (2010). Global evaluation of the Collection 5 MODIS dark-target aerosol products over land. Atmos. Chem. Phys. 10 (21), 10399–10420. doi:10.5194/acp-10-10399-2010
Levy, R. C., Mattoo, S., Munchak, L. A., Remer, L. A., Sayer, A. M., Patadia, F., et al. (2013). The Collection 6 MODIS aerosol products over land and ocean. Atmos. Meas. Tech. 6 (11), 2989–3034. doi:10.5194/amt-6-2989-2013
Levy, R. C., Munchak, L. A., Mattoo, S., Patadia, F., Remer, L. A., and Holz, R. E. (2015). Towards a long-term global aerosol optical depth record: Applying a consistent aerosol retrieval algorithm to MODIS and VIIRS-observed reflectance. Atmos. Meas. Tech. 8 (10), 4083–4110. doi:10.5194/amt-8-4083-2015
Li, C., Li, J., Xu, H., Li, Z., Xia, X., and Che, H. (2019). Evaluating VIIRS EPS aerosol optical depth in China: An intercomparison against ground-based measurements and MODIS. J. Quantitative Spectrosc. Radiat. Transf. 224, 368–377. doi:10.1016/j.jqsrt.2018.12.002
Liu, H., Remer, L. A., Huang, J., Huang, H. C., Kondragunta, S., Laszlo, I., et al. (2014). Preliminary evaluation of S-NPP VIIRS aerosol optical thickness. J. Geophys. Res. Atmos. 119 (7), 3942–3962. doi:10.1002/2013JD020360
Logothetis, S. A., Salamalikis, V., and Kazantzidis, A. (2020). Aerosol classification in europe, Middle East, north africa and arabian peninsula based on AERONET version 3. Atmos. Res. 239, 104893. doi:10.1016/j.atmosres.2020.104893
Ma, Y., Zhang, M., Jin, S., Gong, W., Chen, N., Chen, Z., et al. (2019). Long-term investigation of aerosol optical and radiative characteristics in a typical megacity of Central China during winter haze periods. J. Geophys. Res. Atmos. 124 (22), 12093–12106. doi:10.1029/2019JD030840
Mangla, R., Indu, J., and Chakra, S. S. (2020). Inter-comparison of multi-satellites and Aeronet AOD over Indian region. Atmos. Res. 240, 104950. doi:10.1016/j.atmosres.2020.104950
Mann, M. L., Melaas, E. K., and Malik, A. (2016). Using VIIRS day/night band to measure electricity supply reliability: Preliminary results from Maharashtra, India. Remote Sens. 8 (9), 711. doi:10.3390/rs8090711
Miller, S. D., Mills, S. P., Elvidge, C. D., Lindsey, D. T., Lee, T. F., and Hawkins, J. D. (2012). Suomi satellite brings to light a unique frontier of nighttime environmental sensing capabilities. Proc. Natl. Acad. Sci. 109 (39), 15706–15711. doi:10.1073/pnas.1207034109
Mishra, M. K. (2018). Retrieval of aerosol optical depth from INSAT-3D imager over asian landmass and adjoining ocean: Retrieval uncertainty and validation. J. Geophys. Res. Atmos. 123 (10), 5484–5508. doi:10.1029/2017JD028116
Moyer, D., Moeller, C., and De Luccia, F. (2018). “NOAA-20 VIIRS thermal emissive band calibration error comparison with heritage VIIRS sensors,” in Sensors, systems, and next-generation satellites XXII (International Society for Optics and Photonics), 10785, 107851U. doi:10.1117/12.2325814
Murari, V., Kumar, M., Barman, S. C., and Banerjee, T. (2015). Temporal variability of MODIS aerosol optical depth and chemical characterization of airborne particulates in Varanasi, India. Environ. Sci. Pollut. Res. 22 (2), 1329–1343. doi:10.1007/s11356-014-3418-2
Nautiyal, S., Bhaskar, K., and Imran Khan, Y. D. (2015). “Conclusion and recommendations,” in Biodiversity of semiarid landscape (Cham: Springer), 391–396. doi:10.1007/978-3-319-15464-0_7
Nguyen, T. T., Pham, H. V., Lasko, K., Bui, M. T., Laffly, D., Jourdan, A., et al. (2019). Spatiotemporal analysis of ground and satellite-based aerosol for air quality assessment in the Southeast Asia region. Environ. Pollut. 255, 113106. doi:10.1016/j.envpol.2019.113106
Ogunjobi, K. O., and Awoleye, P. O. (2019). Intercomparison and validation of satellite and ground-based aerosol optical depth (AOD) retrievals over six AERONET sites in West Africa. Aerosol Sci. Eng. 3 (1), 32–47. doi:10.1007/s41810-019-00040-7
Oudrari, H., McIntire, J., Xiong, X., Butler, J., Lee, S., Lei, N., et al. (2014). Prelaunch radiometric characterization and calibration of the S-NPP VIIRS sensor. IEEE Trans. Geoscience Remote Sens. 53 (4), 2195–2210. doi:10.1109/TGRS.2014.2357678
Payra, S., Soni, M., Kumar, A., Prakash, D., and Verma, S. (2015). Intercomparison of aerosol optical thickness derived from MODIS and in situ ground datasets over Jaipur, a semi-arid zone in India. Environ. Sci. Technol. 49 (15), 9237–9246. doi:10.1021/acs.est.5b02225
Prasad, A. K., Singh, R. P., and Singh, A. (2004). Variability of aerosol optical depth over Indian subcontinent using MODIS data. J. Indian Soc. Remote Sens. 32 (4), 313–316. doi:10.1007/BF03030855
Ramachandran, S., and Cherian, R. (2008). Regional and seasonal variations in aerosol optical characteristics and their frequency distributions over India during 2001–2005. J. Geophys. Res. Atmos. 113 (D8), D08207. doi:10.1029/2007JD008560
Ramachandran, S., Kedia, S., and Srivastava, R. (2012). Aerosol optical depth trends over different regions of India. Atmos. Environ. 49, 338–347. doi:10.1016/j.atmosenv.2011.11.017
Remer, L. A., Kaufman, Y. J., Tanré, D., Mattoo, S., Chu, D. A., Martins, J. V., et al. (2005). The MODIS aerosol algorithm, products, and validation. J. Atmos. Sci. 62 (4), 947–973. doi:10.1175/JAS3385.1
Remer, L. A., Tanré, D., Kaufman, Y. J., Levy, R., and Mattoo, S. (2006). “Algorithm for remote sensing of tropospheric aerosol from MODIS: Collection 005,” in Algorithm theoretical basis document (National Aeronautics and Space Administration), 1490.
Sandu, I., Stevens, B., and Pincus, R. (2010). On the transitions in marine boundary layer cloudiness. Atmos. Chem. Phys. 10 (5), 2377–2391. doi:10.5194/acp-10-2377-2010
Saud, T., Gautam, R., Mandal, T. K., Gadi, R., Singh, D. P., Sharma, S. K., et al. (2012). Emission estimates of organic and elemental carbon from household biomass fuel used over the Indo-Gangetic Plain (IGP), India. Atmos. Environ. 61, 212–220. doi:10.1016/j.atmosenv.2012.07.030
Sawyer, V., Levy, R. C., Mattoo, S., Cureton, G., Shi, Y., and Remer, L. A. (2020). Continuing the MODIS dark target aerosol time series with VIIRS. Remote Sens. 12 (2), 308. doi:10.3390/rs12020308
Sayer, A. M., Hsu, N. C., Bettenhausen, C., and Jeong, M.-J. (2013). Validation and uncertainty estimates for MODIS collection 6 “Deep Blue” aerosol data. J. Geophys. Res. Atmos. 118, 7864–7872. doi:10.1002/jgrd.50600
Sayer, A. M., Hsu, N. C., Lee, J., Kim, W. V., and Dutcher, S. T. (2019). Validation, stability, and consistency of MODIS Collection 6.1 and VIIRS Version 1 Deep Blue aerosol data over land. J. Geophys. Res. Atmos. 124 (8), 4658–4688. doi:10.1029/2018JD029598
Sharma, A. R., Kharol, S. K., Badarinath, K. V. S., and Singh, D. (2010). “Impact of agriculture crop residue burning on atmospheric aerosol loading–a study over Punjab State, India,” in Annales geophysicae (Copernicus GmbH), 28, 367–379. doi:10.5194/angeo-28-367-20102
Singh, M. K., Gautam, R., and Venkatachalam, P. (2017). Bayesian merging of MISR and MODIS aerosol optical depth products using error distributions from AERONET. IEEE J. Sel. Top. Appl. Earth Observations Remote Sens. 10 (12), 5186–5200. doi:10.1109/JSTARS.2017.2734331
Singh, R. N., Sah, S., Das, B., Potekar, S., Chaudhary, A., and Pathak, H. (2021). Innovative trend analysis of spatio-temporal variations of rainfall in India during 1901–2019. Theor. Appl. Climatol. 145 (1), 821–838. doi:10.1007/s00704-021-03657-2
Smirnov, A., Holben, B. N., Eck, T. F., Dubovik, O., and Slutsker, I. (2000). Cloud-screening and quality control algorithms for the AERONET database. Remote Sens. Environ. 73 (3), 337–349. doi:10.1016/S0034-4257(00)00109-7
Soni, M., Payra, S., and Verma, S. (2018). Particulate matter estimation over a semi arid region Jaipur, India using satellite AOD and meteorological parameters. Atmos. Pollut. Res. 9 (5), 949–958. doi:10.1016/j.apr.2018.03.001
Sorek-Hamer, M., Franklin, M., Chau, K., Garay, M., and Kalashnikova, O. (2020). Spatiotemporal characteristics of the association between AOD and PM over the California central valley. Remote Sens. 12 (4), 685. doi:10.3390/rs12040685
Srivastava, A. K., Tiwari, S., Devara, P. C. S., Bisht, D. S., Srivastava, M. K., Tripathi, S. N., et al. (2011). “Pre-monsoon aerosol characteristics over the indo-gangetic basin: Implications to climatic impact,” in Annales geophysicae (Göttingen, Germany: Copernicus Publications), 29, 789–804. doi:10.5194/angeo-29-789-2011
Su, Y., Xie, Y., Tao, Z., Hu, Q., Yu, T., and Gu, X. (2021). Validation and inter-comparison of MODIS and VIIRS aerosol optical depth products against data from multiple observation networks over East China. Atmos. Environ. 247, 118205. doi:10.1016/j.atmosenv.2021.118205
Su, X., Wei, Y., Wang, L., Zhang, M., Jiang, D., and Feng, L. (2022). Accuracy, stability, and continuity of AVHRR, SeaWiFS, MODIS, and VIIRS deep blue long-term land aerosol retrieval in Asia. Sci. Total Environ. 832, 155048. doi:10.1016/j.scitotenv.2022.155048
Torres, O., Tanskanen, A., Veihelmann, B., Ahn, C., Braak, R., Bhartia, P. K., et al. (2007). Aerosols and surface UV products from Ozone Monitoring Instrument observations: An overview. J. Geophys. Res. Atmos. 112 (D24), D24S47. doi:10.1029/2007JD008809
Tran, V. T., Pham, H. V., Nguyen, T. T., Pham, T. X., Bui, Q. H., Nguyen, A. X., et al. (2018). “Satellite aerosol optical depth over Vietnam-An analysis from VIIRS and CALIOP aerosol products,” in Land-atmospheric research applications in south and Southeast Asia (Cham: Springer), 499–522. doi:10.1007/978-3-319-67474-2_23
Van Donkelaar, A., Martin, R. V., Brauer, M., Kahn, R., Levy, R., Verduzco, C., et al. (2010). Global estimates of ambient fine particulate matter concentrations from satellite-based aerosol optical depth: Development and application. Environ. health Perspect. 118 (6), 847–855. doi:10.1289/ehp.0901623
Verma, S., Payra, S., Gautam, R., Prakash, D., Soni, M., Holben, B., et al. (2013). Dust events and their influence on aerosol optical properties over Jaipur in Northwestern India. Environ. Monit. Assess. 185 (9), 7327–7342. doi:10.1007/s10661-013-3103-9
Wang, W., Mao, F., Pan, Z., Du, L., and Gong, W. (2017a). Validation of VIIRS AOD through a comparison with a sun photometer and MODIS AODs over wuhan. Remote Sens. 9 (5), 403. doi:10.3390/rs9050403
Wang, Y., Chen, L., Li, S., Wang, X., Yu, C., Si, Y., et al. (2017b). Interference of heavy aerosol loading on the VIIRS aerosol optical depth (AOD) retrieval algorithm. Remote Sens. 9 (4), 397. doi:10.3390/rs9040397
Wei, J., Sun, L., Huang, B., Bilal, M., Zhang, Z., and Wang, L. (2018). Verification, improvement and application of aerosol optical depths in China Part 1: Inter-comparison of NPP-VIIRS and Aqua-MODIS. Atmos. Environ. 175, 221–233. doi:10.1016/j.atmosenv.2017.11.048
Wei, J., Li, Z., Peng, Y., and Sun, L. (2019a). MODIS collection 6.1 aerosol optical depth products over land and ocean: Validation and comparison. Atmos. Environ. 201, 428–440. doi:10.1016/j.atmosenv.2018.12.004
Wei, J., Peng, Y., Guo, J., and Sun, L. (2019b). Performance of MODIS Collection 6.1 Level 3 aerosol products in spatial-temporal variations over land. Atmos. Environ. 206, 30–44. doi:10.1016/j.atmosenv.2019.03.001
Wei, J., Li, Z., Sun, L., Peng, Y., Liu, L., He, L., et al. (2020). MODIS Collection 6.1 3 km resolution aerosol optical depth product: Global evaluation and uncertainty analysis. Atmos. Environ. 240, 117768. doi:10.1016/j.atmosenv.2020.117768
Winker, D. M., Tackett, J. L., Getzewich, B. J., Liu, Z., Vaughan, M. A., and Rogers, R. R. (2013). The global 3-D distribution of tropospheric aerosols as characterized by CALIOP. Atmos. Chem. Phys. 13, 3345–3361. doi:10.5194/acp-13-3345-2013
Xiao, Q., Zhang, H., Choi, M., Li, S., Kondragunta, S., Kim, J., et al. (2016). Evaluation of VIIRS, GOCI, and MODIS Collection 6 AOD retrievals against ground sunphotometer observations over East Asia. Atmos. Chem. Phys. 16 (3), 1255–1269. doi:10.5194/acp-16-1255-2016
Xiong, X., Oudrari, H., Chiang, K., McIntire, J., Fulbright, J., Lei, N., et al. (2013). “VIIRS on-orbit calibration activities and performance,” in Proceeding of the 2013 IEEE International Geoscience and Remote Sensing Symposium-IGARSS, July 2013 (IEEE), 520–523. doi:10.1109/IGARSS.2013.6721207
Yadava, P. K., Soni, M., Verma, S., Kumar, H., Sharma, A., and Payra, S. (2020). The major lightning regions and associated casualties over India. Nat. Hazards 101 (1), 217–229. doi:10.1007/s11069-020-03870-8
Yang, M., Howell, S. G., Zhuang, J., and Huebert, B. J. (2009). Attribution of aerosol light absorption to black carbon, Brown carbon, and dust in China–interpretations of atmospheric measurements during EAST-AIRE. Atmos. Chem. Phys. 9 (6), 2035–2050. doi:10.5194/acp-9-2035-2009
Yao, F., Si, M., Li, W., and Wu, J. (2018). A multidimensional comparison between MODIS and VIIRS AOD in estimating ground-level PM2. 5 concentrations over a heavily polluted region in China. Sci. Total Environ. 618, 819–828. doi:10.1016/j.scitotenv.2017.08.209
Zhang, H., Kondragunta, S., Laszlo, I., Liu, H., Remer, L. A., Huang, J., et al. (2016). An enhanced VIIRS aerosol optical thickness (AOT) retrieval algorithm over land using a global surface reflectance ratio database. J. Geophys. Res. Atmos. 121 (18), 10–717. doi:10.1002/2016JD024859
Keywords: MODIS, VIIRS, AOD, expected error envelope, satellite
Citation: Payra S, Sharma A, Mishra MK and Verma S (2023) Performance evaluation of MODIS and VIIRS satellite AOD products over the Indian subcontinent. Front. Environ. Sci. 11:1158641. doi: 10.3389/fenvs.2023.1158641
Received: 04 February 2023; Accepted: 02 May 2023;
Published: 06 June 2023.
Edited by:
Ravi Yadav, Indian Institute of Tropical Meteorology (IITM), IndiaReviewed by:
Anikender Kumar, India Meteorological Department, IndiaRamaKrishna Karumuri, King Abdullah University of Science and Technology, Saudi Arabia
Copyright © 2023 Payra, Sharma, Mishra and Verma. This is an open-access article distributed under the terms of the Creative Commons Attribution License (CC BY). The use, distribution or reproduction in other forums is permitted, provided the original author(s) and the copyright owner(s) are credited and that the original publication in this journal is cited, in accordance with accepted academic practice. No use, distribution or reproduction is permitted which does not comply with these terms.
*Correspondence: Sunita Verma, dmVybWEuc3VuaXRhQGdtYWlsLmNvbQ==