 Xiaohong Dang
 Xu Chi1
 Zhongju Meng
- 1College of Desert Control Science and Engineering, Inner Mongolia Agricultural University, Hohhot, Inner Mongolia, China
- 2Inner Mongolia Hangjin Desert Ecosystem Positioning Research Station, Ordos, Inner Mongolia, China
- 3Desert Ecosystem Conservation and Restoration Innovation Team, Hohhot, Inner Mongolia, China
- 4Institute of Water Resources for Pastoral Area, Hohhot, Inner Mongolia, China
- 5Inner Mongolia Academy of Forestry Sciences, Hohhot, China
To explore how to lay the same specifications to maximize the protection benefits of mechanical sand barriers is an essential issue in the actual production process. We used the Reynolds-Averaged Navier-Stokes (RANS) method and the shear stress transport (SST) K-ε turbulence model to study the windbreak efficiency of sand barriers with different structures. Among them, the structure of the sand barriers includes rhombus 60° (cTnI = 60°, R60°), rhombus 90° (cTnI = 90°, R90°), rhombus 120° (cTnI = 120°, R120°) and parallel straight line (belt). The sand barrier was set to a porous jump model, where the surface permeability a was 2.6 × 10⁸, and the inertial resistance coefficient c2 was 9,400. The wind velocity field results showed that the sand barrier’s blocking effect on wind velocity decreases with the increase in height. The leading edge of the 120° obstacle has the strongest weakening effect on the inlet wind speed. The minimum wind speed (0.97 m/s to 1.41 m/s) occurs near the sand barrier, and the vortex appears on both sides of the node, and the wind speed increases. The order of the blocking effect of different angles on airflow is as follows: 120° > 90°> brand >60°. Under R120° conditions, the wind speed is reduced by more than 60% at 0.05 m and 0.1 m height behind the barrier compared to the initial wind speed. This will be conducive to the design and control engineering planning of the laying angle of the gauze sand barrier in the main wind direction.
1 Introduction
The sand barrier is one of the essential engineering measures in arid and semi-arid areas (Li et al., 2020a; Li et al., 2022). In the early stage of desertification control, laying mechanical sand barriers can effectively increase the surface roughness, reduce the near-surface wind speed, and weaken the wind erosion on the surface to achieve the purpose of windbreak and sand fixation (Li et al., 2009; Zhang et al., 2015). At the same time, sand barriers guarantee later vegetation restoration and soil seed bank formation (Tang and Liu, 2012; Li et al., 2014). The materials commonly used in traditional engineering are firewood, crop straw, clay, and gravel (Krishnappan and Burrell, 2012; Liang et al., 2021) After processing, the sand barrier was laid on the surface of the flowing sand, which plays a significant role in the fixation of the flowing sand (Mengmeng Wang et al., 2021) The straw checkerboard sand barrier was most widely used in practical production because of its common materials, easy to lay, and lower price advantage (Taniguchi et al., 2021). Moreover, previous studies on straw sand barriers have been carried out in many aspects, such as theoretical analysis, numerical simulation, experiment, and observation (Sun et al., 2021; Wang et al., 2021). Due to the remarkable effect of sand prevention after the layout of sand barriers, it has been increasingly accepted by the masses in the sand areas. It has achieved remarkable results in the prevention and control of sand hazards in many areas with severe wind and sand hazards and on traffic roads, such as Taklimakan Desert Highway, Gurbantunggut Desert Oilfield Highway, and Golmud-Korla Railway (Shengyu and Jiaqiang, 2003; Li et al., 2020a; Niu et al., 2020).
The shortage of materials, short service life, easy damage, and low mechanization of traditional straw sand barriers hinder its large-scale application. In addition, agricultural mechanization has made traditional crop straw materials unable to meet the size and supply requirements, which has accelerated the contradiction between the supply and demand of traditional sand barrier materials. With the deepening of research on desert control, degradable environmental materials have attracted more and more attention in the field of desert control. Polylactic Acid Fibre (PLA) is a new kind of biodegradable green polymer material produced from wheat, corn, sweet potato, potato, and sugar beet by fermentation. It is decomposed into CO2 and H2O through external conditions and microbial action, which will not cause secondary pollution to the environment (Kricheldorf, 2001; Ismail et al., 2017). The PLA has been widely used in China as the primary material for weaving sand barriers fixed to the sand surface by pillars. Previous studies have detailed studies on wind protection efficiency (Gao Li et al., 2022), ecological benefits, setting methods (Baoying et al., 2017) and degradation aging properties of PLA sand barriers. It is found that the wind protection efficiency of PLA sand barriers is equivalent to that of straw sand barriers, which promotes ecological restoration.
In order to reduce the research cost, CFD (computational fluid dynamics) numerical simulation method was a widely used study, and the control equations were the continuity equation, momentum equation, and k-ε turbulence equation. Wenhua et al. (2022) used ICEM CFD software to establish a simplified two-dimensional model. This model analyzed the movement law of wind-blown sand flow under different sand barrier heights and sand barrier numbers to determine the influence of sand barrier height and number on the wind-blown sand fixation effect of the high vertical sand barrier; Cheng (2012) used CFD software, the mesh type Tetra/Mixed, the boundary layer Robust (octree), and a total number of elements of more than 15 million. The research shows that the wind speed profile between the wind wall and the upward line increases and decreases with height. The central line of the upward line first increases and then decreases and then increases. However, the variation amplitude of the downward line is significantly greater than that of the upward line. Zhang et al. (2016) used CFD numerical simulation program to simulate and analyze the flow field characteristics and pressure changes of sand blocking and sand fixation network and vertical windbreak fence based on a three-dimensional simulation of porous media conditions. The simulation results show that the porous media method can better reflect the flow field changes of such sand barriers by reasonably controlling parameters.
However, whether the traditional or new material checkerboard sand barrier is laid in the field construction process in the right angle direction. Previous studies focused on the influence of the size of the checkerboard sand barrier on the protective effect, and the difference between the windproof and sand-fixing efficiency of the checkerboard sand barrier at different angles is unclear. How to lay sand barriers of the same specification to maximize the protective benefit of sand barriers is an important problem that needs to be discussed further in the actual production process. In this study, CFD numerical simulation method was used to compare the wind speed flow field and wind prevention benefit of sand barrier at 60°, 90°, 120°, and belt. We reveal the effect of sand barriers laid at different angles on the wind speed flow field, aiming further to improve the wind protection efficiency of the sand barriers and provide theoretical support for production practice.
2 Material and methods
In this paper, the computational fluid dynamics software ANSYS Fluent 15.0 is used to simulate the wind speed flow field around the sand barrier (Figure 1), and the flow field is incompressible. The basic equations and algorithms of fluid mechanics are used in the calculation models. For an incompressible fluid, the mass and momentum conservation equations are obeyed.
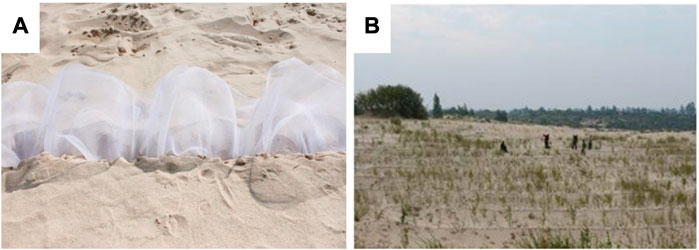
FIGURE 1. Gauze sand barrier (A) and recovery effect after laying (B).
2.1 Governing equation
The standard model is used for numerical simulation. The model does not require high grid accuracy, and local grid encryption can achieve the calculation accuracy. The calculation convergence rate is faster than other methods and is suitable for the flow field environment with curved streamlines. Using this method to simulate the flow field, the accuracy can meet the calculation of wind speed characteristics of the near-surface flow field.
The standard k-ε model is a typical two-equation model, which establishes a transport equation of turbulent kinetic energy k and an equation of turbulent kinetic energy dissipation rate ε. This model is currently the most widely used turbulence model. In the model, turbulent kinetic energy dissipation rate e is expressed as:
Dynamic viscosity µ is a function of k and ε:
In the standard k-ε model, the transport equations for k and e are:
Where Gk is the generating term of turbulent kinetic energy k caused by the average velocity gradient, calculated by the following formula:
Gb is the production term of the turbulent kinetic energy k caused by buoyancy, for incompressible fluid, Gb = 0; for compressible fluid, there are:
In the above equation, prt is the turbulent Prandtl number, which is taken as prt = 0.85 in this model, and gi is the component of gravity acceleration in the i direction; β is the coefficient of thermal expansion derived from the equation of state of compressible fluid.
YM representing the contribution of pulsating expansion in compressible fluids, for incompressible fluids, YM = 0; For compressible fluids, there is:
Mt is turbulent Mach number,
After experimental verification, the constant value in the standard k-ε model is:
For the coefficients C3ε in the calculation of compressible fluid, when the mainstream direction is parallel to the gravity direction, there are C3ε = 1; When the direct current direction is perpendicular to the gravity, there is C3ε = 0.
When the fluid is incompressible, the standard k-ε model is simplified to:
2.2 Upright reticulation barriers model details
The sand barrier is set to the porous jump model. The surface permeability and the inertial resistance coefficient of the porous jump model are 2.6 × 10⁸ and 9,400, respectively. Its coordinate origin is located at the midpoint of the beginning of the calculation area, and the positive direction of the X-axis is the direction of incoming flow wind speed. Studies have shown that a 1 m × 1 m checkerboard barrier is an effective measure of desert control, 0.1–0.2 m checkerboard barrier can effectively reduce wind speed (Dong et al., 2004). Therefore, the first yarn net distance from the beginning of the region L = 2 m, yarn net length × height × thickness = 16 m × 0.1 m × 0.001 m. In this paper, the effects of belt gauze and checkerboard gauze barriers on near-surface airflow field are simulated, respectively, and the spacing D of gauze barriers is 1 m. In order to ensure the full development of the flow field in the region, the geometric size of the calculation region along the airflow direction is taken as 3–5 times the yarn spacing. In order to ensure the full development of the wind speed profile along the vertical direction, the vertical height is taken as 2 m. Therefore, the calculation domain is cuboid, length × width × height = 30 m × 30 m × 2 m, which can ensure that the boundary on both sides of the region is not affected by the sand barrier (Figure 2).

FIGURE 2. Model diagram of square sand barrier and its calculation area.
Several scholars studied the characteristics of wind-sand flow structures under 30°, 60°, and 90° sand barrier laying modes. The results showed that the angle between the sand barrier and wind direction was positively correlated with the average wind reduction effect. However, the characteristics of wind speed and flow field of the sand barrier under blunt angle laying are rarely reported. Therefore, in this study, the rhombus 60° (∠A = 60°, R60°), rhombus 90° (∠B = 90°, R90°), rhombus 120° (∠C = 120°, R120°), parallel linear (belt) gauze sand barrier are simulated. The schematic diagram of four kinds of gauze sand barrier laying is shown in Figure 3.
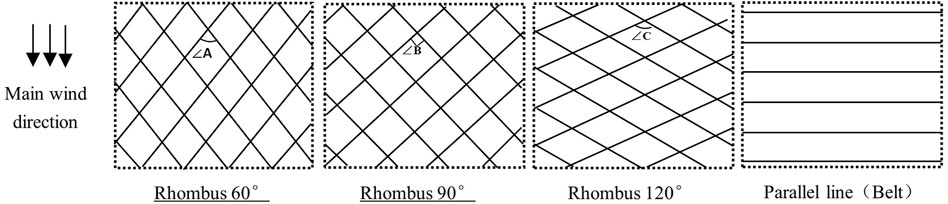
FIGURE 3. 60°, 90°, 120°, and belt sand barriers layout. Note: (A–C) represent 60°, 90°, and 120° respectively.
2.3 Computational grid
The tetrahedral mesh is used, and the sand barrier area and the computational domain share nodes. The mesh is automatically encrypted around the sand barrier. The bottom layer is set up with an expansion layer (5 layers and the growth rate is set to 1.1). The mesh number of the belt gauze mesh model is 5–8 million (Figure 4), and the mesh number of the checkerboard gauze mesh model is 9–13 million (Figure 5).

FIGURE 4. The grid division diagram of sand barrier model for ribbon gauze.
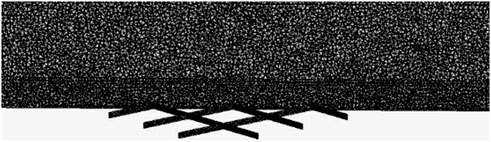
FIGURE 5. The grid division diagram of sand barrier model for checkerboard gauze.
2.4 Boundary condition
(1) Bottom surface is set to no-slip wall, the ground roughness index reference ‘building structure load specification’ (GB50009-2001), the roughness level of the desert area for class A, ground roughness exponent σA = 0.12.
(2) The entrance boundary is set to INFLOW, the exit boundary is set to OUTFLOW, and the other surface boundaries are set to SYMMETRY. At x = 0, there is u = v = w = 0, symmetric boundary conditions at the top and both sides of the region; At z = 0, there is u = v = w = 0, entrance is velocity entry boundary; At y = 0, there is u = u0, v = w = 0, u0is the flow velocity, the exit is free exit, without setting any parameters.
(3) The initial conditions of the given speed at the entrance of the region are calculated. The initial wind speed is realized by UDF programming and Fluent interface. The wind speed profile at the entrance is defined as the speed function.
In this study, the wind speed at the height of 2 m is set to 8 m/s, the fluid density is taken as the air density ρa = 1.225 kg/m3, and P0 is taken as a standard atmospheric pressure.
(4) The pressure solver sets the steady-state flow with low-speed incompressible flow, and the calculation model adopts the K-epsilon standard turbulence equation. The thickness of the sand barrier model in this paper is only 0.001 m, and the viscous force of the airflow is negligible. Only the pressure difference between the windward and leeward walls of the sand barrier is considered.
2.5 Wind profiles
The von Karman-Prandtl equation represents the logarithmic wind profiles at the three observation sites. The shear velocity (u*) and roughness length (z0) can be calculated based on the logarithmic wind profile, which was fitted using the least-squares curve fitting method.
where
3 Results
3.1 Wind speed variation at a height
It can be seen from Figure 6 that the gauze sand barrier can effectively reduce the wind speed in the height range of 0–0.60 m near the ground, and the effective protection height is increased compared with the belt sand barrier. The wind speeds at 0.6 m points of 60° sand barrier A, B, C, and D were 6.81 m/s, 6.92 m/s, 6.99 m/s, and 6.92 m/s, respectively. The wind speeds at 90° sand barriers were 6.76 m/s, 7.05 m/s, 7.06 m/s, and 6.89 m/s, respectively. The wind speeds at 120° sand barriers were 6.75 m/s, 7.14 m/s, 7.21 m/s, and 7.05 m/s, respectively. The wind speeds at belt sand barriers were 7.35 m/s and 7.33 m/s. The order of weakening degree of A point wind speed is R120° > R90° > R60°> belt. Compared with the belt sand barrier, the R120°, R90°, and R60° sand barrier can effectively reduce the near-surface wind speed, and the R120° has the best effect.
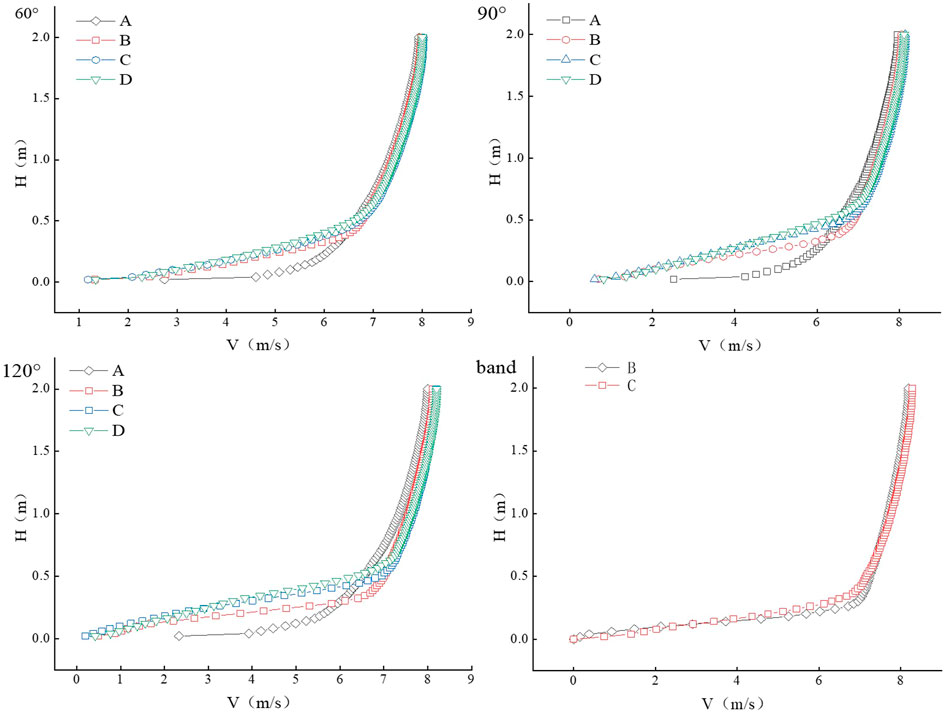
FIGURE 6. Wind velocity profile of near-surface airflow field of gauze barrier at different angles.
3.2 Horizontal wind speed profile
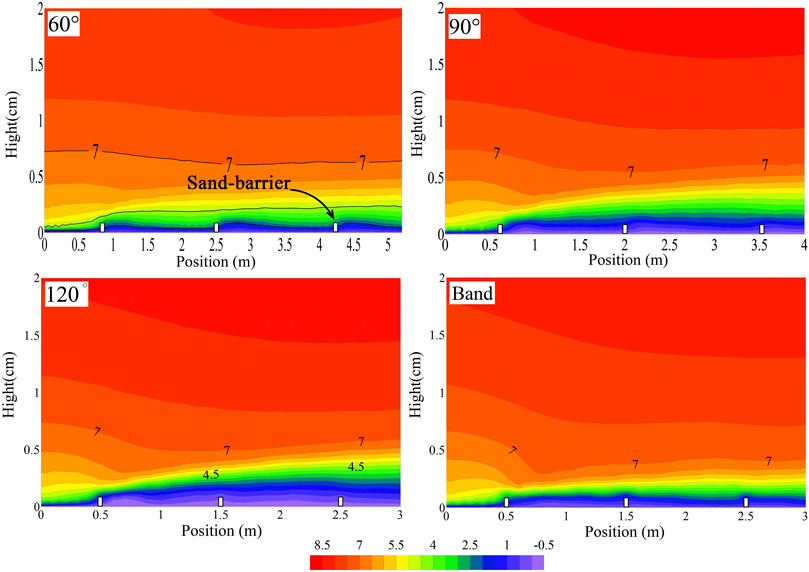
The spatial distribution of the wind speed flow field at different vertical heights is shown in Figure 7. The sand barrier has a decreasing effect on wind speed over a height range of 20 cm from the ground, while the wind velocity flow field varies in the same way over a height range of 10 cm from the ground. The wind speed field at the front of the sand barrier is 6.02 m/s, 2.07 m/s, 1.18 m/s, 0.67 m/s, and 0.3 m/s lower than the wind speed field at the inlet at a height of 1 cm, 5 cm, 10 cm, and 15 cm above ground level, respectively. The wind velocity field at the front end of the sand barrier is not significantly affected by the position of the sand barrier. The maximum wind speeds within the sand barrier were 0.9 m/s, 2.8 m/s, 3.4 m/s, and 4.2 m/s at 1cm, 3cm, 5cm, and 10 cm from the ground, respectively. With the increase in height, the wind-proof effect of the sand barrier gradually decreases.
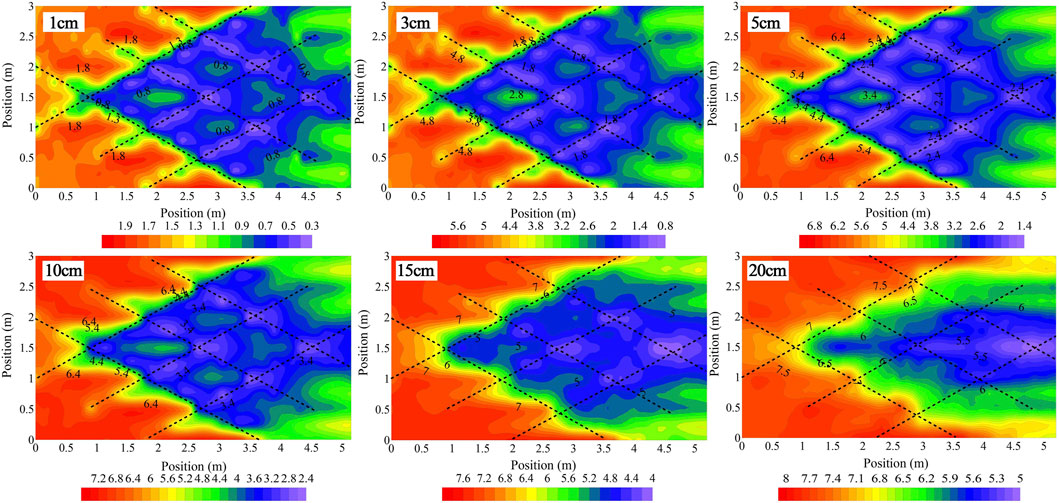
FIGURE 7. Horizontal wind velocity profile around 60° sand barrier.
The spatial distribution of the wind velocity field at different vertical heights of the 90° sand barrier is shown in Figure 8. The sand barrier reduces the wind speed in the height range of 20 cm above the ground, and the wind speed field changes in the same pattern in the height range of 10 cm above the ground, indicating that the wind speed decreases at the edge of the sand barrier and increases in the middle of the sand barrier. Within 20 cm height from low to high (i.e., 1 cm, 3 cm, 5 cm, 10 cm, 15 cm, and 20 cm), the wind speed flow field at the front of the sand barrier is 6.41 m/s, 3.40 m/s, 2.65 m/s, 2.17 m/s, 1.70 m/s, and 1.48 m/s lower than that at the inlet. The blocking effect of the sand barrier on the wind speed gradually decreases with the increase in height. In the height range of 20 cm above the ground, the lowest wind speeds in the sand barrier from low to high are 0.03 m/s, 0.08 m/s, 0.31 m/s, 1.19 m/s, 2.32 m/s, 3.09 m/s, respectively. They are all located at the sand barrier position or node.
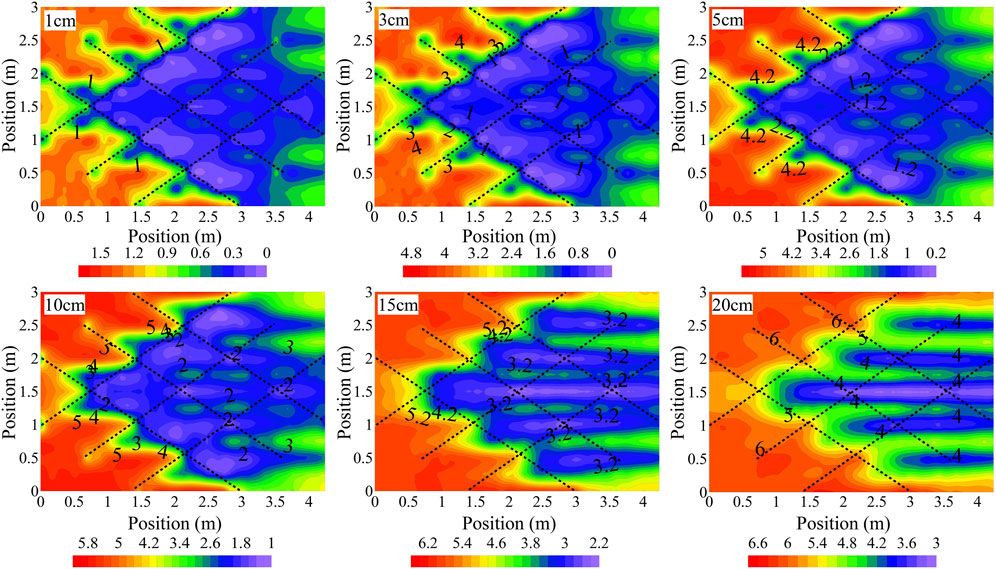
FIGURE 8. Horizontal wind velocity profile around 90° sand barrier.
The spatial distribution of the wind speed flow field at different vertical heights of the 120° sand barrier is shown in Figure 9. The sand barrier reduces the wind speed in the range of 20 cm in height. The wind speed flow field variation is the same in the height range of 20 cm above the ground. The minimum wind speed appears near the sand barrier, and the vortex occurs on both sides of the node, which increases the wind speed. The minimum wind speed in the height range of 10 cm above the ground from low to high (i.e., 1 cm, 3 cm, 5 cm, and 10 cm) sand barrier is 0.01 m/s, 0.05 m/s, 0.06 m/s, and 0.74 m/s, while the wind speed in the vortex is 0.35 m/s, 1.2 m/s, 1.6 m/s, and 2.6 m/s. In the height range of 20 cm above the ground from low to high (i.e., 1 cm, 3 cm, 5 cm, 10 cm, 15 cm, and 20 cm), the wind speed flow field in front of the sand barrier decreased by 6.56, 3.72, 2.93, 2.34, 1.87, and 1.42 m/s compared with the inlet wind speed. The blocking effect of the sand barrier on wind speed decreased with the increase in height.
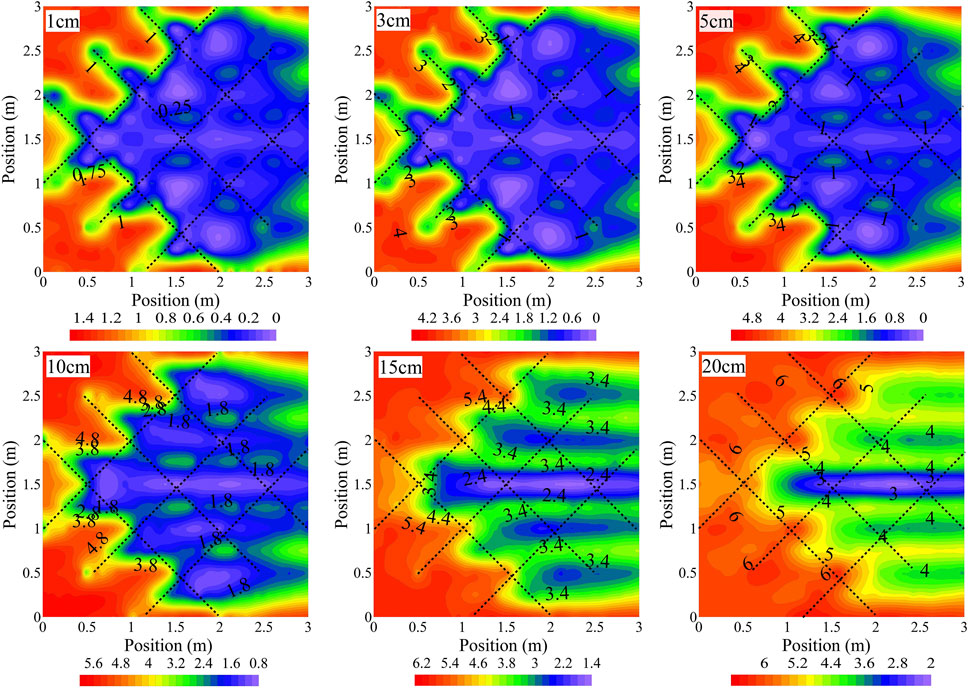
FIGURE 9. Horizontal wind velocity profile speed around 120° sand barrier.
The spatial distribution of the wind speed flow field at different vertical heights of the belt sand barrier is shown in Figure 10. The sand barrier has a decreasing effect on the wind speed in the range of 3 cm height. When the airflow runs to the windward side of the sand barrier, the airflow in 3 cm decreases sharply when the sand barrier is blocked. The wind speed of the wind speed flow field decreases when the sand barrier is blocked and increases behind the sand barrier. The wind speed decreases at 1H (H represents barrier height) before the next sand barrier and increases at 1H after the sand barrier. The wind speed from the windward side to the leeward side of the sand barrier decreases by 2.73 m/s. At the height of 3 cm, the flow field of wind speed increased at 1H before the first sand barrier and began to decrease at 1H after the sand barrier, showing a trend of first increasing and then decreasing. The wind speed flow field at different vertical heights of the parallel sand barrier shows apparent stratification. The wind speed flow field increases and then stabilizes for 0.5H–2H.
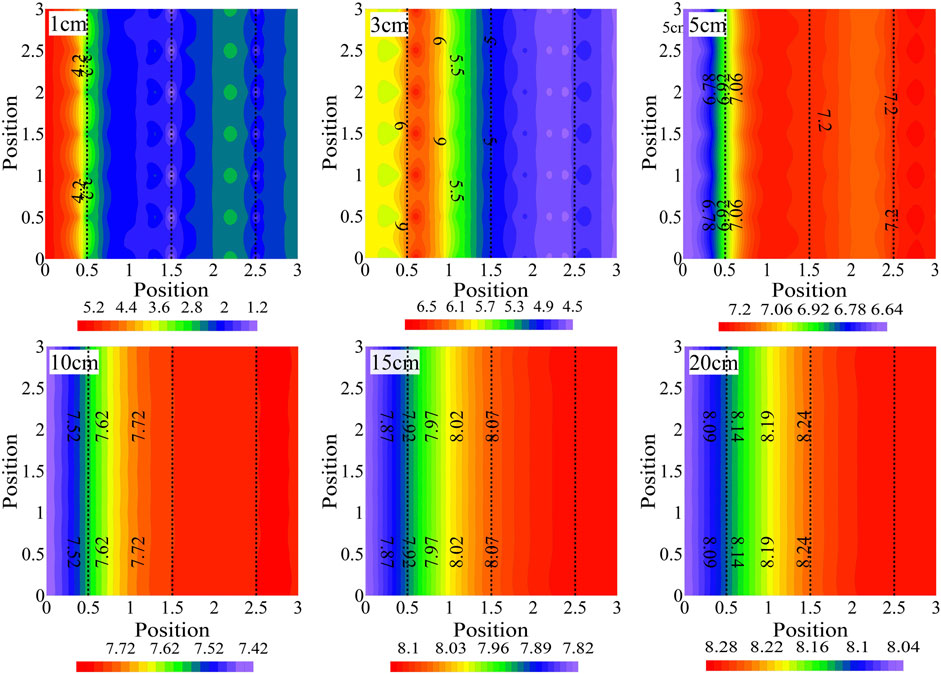
FIGURE 10. Horizontal wind velocity profile speed around parallel sand barrier.
3.3 Wind speed profile
The spatial distribution of the wind speed field at vertical height under different types of sand barriers is shown in Figure 11. The variation law of the wind speed flow field at the height of the sand barrier at different angles is consistent. At the vertical height of 1H of the wind speed flow field of the sand barrier, the wind speed decreases after the sand barrier is blocked, and the wind speed decreases sharply at the first 2H of the sand barrier node. The flow field situation presents multiple “V” types. At the vertical height of 2H, the wind velocity field showed a trend of sharp decline when the sand barrier node was blocked, followed by a slow decline. The flow field line in the vertical height of 5H increased slightly before the sand barrier and then decreased slowly. The wind speed of R60° barrier from low to high (i.e., 1H, 2H, 3H, 4H, and 5H)windward side to leeward side decreased by 2.34, 1.70, 1.03, 0.43, and 0.05 m/s, respectively. The wind speed of R90° barrier decreased by 3.17, 2.39, 1.68, 0.94, and 0.20 m/s, respectively. The wind speed of R120° barrier decreased by 3.38, 3.14, 2.45, 1.16, and 0.14 m/s, respectively. The wind speed of the band barrier decreased by 2.73 m/s (1H), 1.34 m/s (2H), and 0.18 m/s (3H), respectively.
EFIGURE 11. Wind profile around sand barrier at different angles.
3.4 Wind prevention benefit analysis
Table 1 shows the Gradient table of wind speed at 0.05 m height near the surface and windbreak efficiency. Differences in laying angles affect the variation in wind speed gradients and the efficiency of wind protection. The order of wind-proof efficiency of point A airflow is: 120° > 90° > 60°> belt. The order of wind-proof efficiency of airflow at points B, C, and D is as follows: 120° > 90°> belt >60°. The wind speed gradient and windbreak efficiency at the height of 0.1 m near the ground are consistent with those at 0.05 m (Table 2). The wind speeds at points A, B, C, and D at the heights of 60°, 90°, 120°, and belt, 0.1 m near the ground between bands are all less than 0.05 m, and the wind-proof efficiency is lower than 0.05 m.
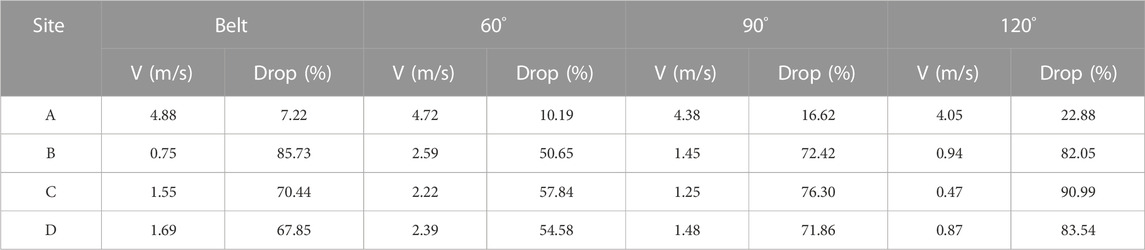
TABLE 1. Gradient table of wind speed at 0.05 m height near surface.

TABLE 2. Gradient table of wind speed at 0.1 m height near surface.
4 Discussion
The sand barrier is an auxiliary measure for biological sand fixation, which has leading and protective effects (Li et al., 2006; Wang and Wang, 2019; Zhao and Wang, 2019). The setting of the checkerboard sand barrier at the early stage of treatment can provide shelter for seedlings and seeds. The CFD numerical simulation method is used to compare the wind speed flow field and wind prevention benefit of grid sand barrier at 60°, 90°, 120°, and between belts. Revealing the influence of sand barrier laying at different angles on wind speed flow field is of great significance further to improve the wind prevention efficiency of grid sand barrier and provide theoretical support for production practice. Previous studies have shown that the laying mode and specifications of the checkerboard sand barrier affect the thickness of sand accumulation and sand blocking effect (Zhang et al., 2018; Liu and Bo, 2020). The decrease in wind speed before and after the barrier is the primary sand control mechanism of the checkerboard sand barrier. The growth area of wind speed in the middle of the barrier is the leading cause of no or less sand accumulation in the middle of the sand barrier. The experimental results show that the wind speed flow field forms a deceleration zone and a vortex zone in the barrier (Wang et al., 2020). From the windward side to the leeward side of the barrier, the spatial variation of wind speed can be divided into three stages: decline stage, stable stage, and recovery stage (Bo et al., 2015). There is a series of unevenly distributed wind-sand flow vortexes inside the checkerboard sand barrier, and its intensity gradually decreases from the windward side to the leeward side of the sand barrier (Huang et al., 2013). The vortex action of airflow inside the barrier may lead to the erosion of the original sand surface. The sand grains in the square barrier move to the front and side walls of the barrier, and the sand grains are redeposited to reach a stable concave equilibrium state (Qu et al., 2007). The erosion situation in the barrier is low in the middle and high around (Xu et al., 2018).
Sand invasion is a serious problem in arid areas. Square sand barriers are usually used as wind buffers to stabilize the soil at risk of desertification and improve soil nutrients. Therefore, the grid sand barrier is widely used in arid areas (Li et al., 2018). The combination of sand fence and straw checkerboard sand barrier can more effectively control the wind and sand flow into the oasis in the study of Minqin oasis desertification control measures (Krishnappan and Burrell, 2012). In this study, it was found that the wind speed flow field was stratified within the sand barrier 1H, which was consistent with the research results of Zhang et al. (2016), that the 0.2 m high barrier obtained by observing the wind speed flow field and sediment transport in dunes before and after the sand barrier was laid increased the aerodynamic roughness length to more than 0.02 m, which is two to three times higher than that of bare sandy. The sand barrier reduced the wind and sediment flow, and changed its vertical distribution. There are significant differences in sediment transport efficiency of sand barriers with different shapes, mainly due to their different inclination angles that change the direction of cross-border wind and sand flow (Bruno et al., 2018).
The results of this experiment show that checkerboard sand barriers can significantly reduce wind speed near the ground, and the greater the angle between the sand barriers, the stronger their wind protection benefit. Because the angle is sharp, the leading role is the dredging effect, and the airflow will move forward along the sand barrier affected by the sand barrier. When the angle increases, the blocking effect of the sand barrier on the airflow is obvious, and the airflow is forced to rise when it passes through the sand barrier. Therefore, the blocking effect of sand barriers on airflow increases with an increasing angle on the windward side of the sand barrier. The angle between the sand barrier and the wind direction is positively correlated with the average wind reduction effect (Xue et al., 2021). The results of Xu et al. (2018) and other studies show that under constant wind speed, when the angle between the main shaft of the lateral transport project of the feather sand-flushing bath and the wind speed is less than 30°, the formed flow field is the most suitable for the lateral transport of wind-sand flow. Compared with the checkerboard sand barrier, the sediment deposition distance of the triangular sand barrier increases by 25% (Sarafrazi and Reza Talaee, 2020). The research results of Zhang et al. (2018) on the characteristics of wind-blown sand flow under the different inclined angles of the sand barrier show that increasing the inclined angle of the sand barrier can enhance the blocking effect of the sand barrier on airflow. When the inclined angle of the sand barrier is 90°–135°, the sand control effect is the best (Dun et al., 2021). The study of Zhang et al. (2022) on windbreak and dust suppression networks shows that the checkerboard barrier with an angle of 50° near the ground has better wind and sand shielding effect than the checkerboard barrier with an angle of 30°.
5 Conclusion
The current study investigated the wind-blown sand-fixation efficiency and the wind flow fields around checkerboard sand barriers at different angles using computational fluid dynamics (CFD) simulations. The verification study on checkerboard sand barrier systems with different angles showed that the numerical modeling approach employed in this study, which is full-scale 3D Reynolds-Averaged Navier-Stokes (RANS) simulation with an unsteady solver and shear stress transport (SST) K-ε turbulence model, predicted the wind speed around the checkerboard sand barrier with different angles reasonably well. The limitations of this study are the lack of field tests. Based on the investigation carried out in this study on wind-blown sand-fixation efficiency, the following conclusions can be made.
(1) Vortex can be observed in wind velocity fields of grille barriers at different angles.
(2) Different angles of sand barrier can reduce the wind speed in 5H of vertical height wind velocity field.
(3) The wind speed flow field at different vertical heights of the belt sand barrier shows obvious stratification. The wind speed flow field in 0.5H–2H increases first and then tends to be stable.
(4) With the increase of the angle between the sand barriers, the windproof effect of the sand barrier is enhanced, and the 120° obstacle front edge has the strongest weakening effect on the inlet wind speed.
Data availability statement
The original contributions presented in the study are included in the article/supplementary material, further inquiries can be directed to the corresponding authors.
Author contributions
Writing—original draft XD; investigation XC and BZ; methodology, GT; formal analysis, HH; data curation, ZM and XD; writing—review and editing, ZM and LY; supervision, ZM. All authors have read and agreed to the published version of the manuscript.
Funding
This research was supported by the National Natural Science Foundation of China (41967009); The central government’s special fund program for guiding local scientific; and technological development project sand Inner Mongolia Autonomous Region Science and Technology Plan (2020GG0077), Desert Ecosystem Conservation and Restoration Innovation Team, and Improvement Innovation Team of Desertification Control (BR22-13-03), Inner Mongolia Autonomous Region Science and Technology Plan (2022YFHH0076).
Acknowledgments
We are grateful to the editor and reviewers for his ability to work on this manuscript during his busy schedule. The authors also thank Song Li for his help in the application of numerical simulation software, who is from Inner Mongolia University of Technology.
Conflict of interest
The authors declare that the research was conducted in the absence of any commercial or financial relationships that could be construed as a potential conflict of interest.
Publisher’s note
All claims expressed in this article are solely those of the authors and do not necessarily represent those of their affiliated organizations, or those of the publisher, the editors and the reviewers. Any product that may be evaluated in this article, or claim that may be made by its manufacturer, is not guaranteed or endorsed by the publisher.
References
Baoying, N., Jianxia, M., Zhide, J., Chun, C., Xinli, Z., and Jingliang, L. (2017). Evolution characteristics and development trends of sand barriers. J. Resour. Ecol. 8, 398–404. doi:10.5814/j.issn.1674-764x.2017.04.012
Bo, T.-L., Ma, P., and Zheng, X.-J. (2015). Numerical study on the effect of semi-buried straw checkerboard sand barriers belt on the wind speed. Aeolian Res. 16, 101–107. doi:10.1016/j.aeolia.2014.10.002
Bruno, L., Fransos, D., and Lo Giudice, A. (2018). Solid barriers for windblown sand mitigation: Aerodynamic behavior and conceptual design guidelines. J. Wind Eng. Industrial Aerodynamics 173, 79–90. doi:10.1016/j.jweia.2017.12.005
Cheng, J. J. (2012). Study on the wind-sand flow movement characteristics and the shielding effect of the wind-break wall along the railway in gobi area. Appl. Mech. Mater. 178-181, 1653–1657. doi:10.4028/www.scientific.net/amm.178-181.1653
Dong, Z., Chen, G., He, X., Han, Z., and Wang, X. (2004). Controlling blown sand along the highway crossing the Taklimakan Desert. J. Arid Environ. 57, 329–344. doi:10.1016/j.jaridenv.2002.02.001
Dun, H., Huang, N., and Zhang, J. (2021). Optimization designs of artificial facilities in deserts based on computational simulation. J. Arid Land 13, 290–302. doi:10.1007/s40333-021-0059-4
Gao Li, J.-C., Ding, B., Jia, L., Yuan-feng, A., and Ben-ten, M. (2022). Mobile sand barriers for windblown sand mitigation: Effects of plane layout and included angle. Wind Struct. 34, 275–290. doi:10.12989/was.2022.34.3.275
Huang, N., Xia, X., and Tong, D. (2013). Numerical simulation of wind sand movement in straw checkerboard barriers. Eur. Phys. J. E Soft Matter 36, 99. doi:10.1140/epje/i2013-13099-6
Ismail, M. N., Rafidi, N., Awale, R. J., and Ali, F. (2017). Preparation and characterization of polylactic acid based polyurethane for environmental friendly packaging materials. J. Adv. Res. Fluid Mech. Therm. Sci. 38, 16–21.
Kricheldorf, H. R. (2001). Syntheses and application of polylactides. Chemosphere 43, 49–54. doi:10.1016/s0045-6535(00)00323-4
Krishnappan, B. G., and Burrell, B. C. (2012). Using MOSAND to mitigate the desertification of Minqin oasis, gansu province, China. Can. J. Civ. Eng. 39, 72–80. doi:10.1139/l11-110
Li, C., Wang, Y., Lei, J., Xu, X., Wang, S., Fan, J., et al. (2020a). Damage by wind-blown sand and its control measures along the Taklimakan Desert Highway in China. J. Arid Land 13, 98–106. doi:10.1007/s40333-020-0071-0
Li, H., Meng, Z., Dang, X., and Yang, P. (2022). Checkerboard barriers attenuate soil particle loss and promote nutrient contents of soil. Sustainability 14, 10492. doi:10.3390/su141710492
Li, S., Li, C., Yao, D., and Wang, S. (2020b). Feasibility of microbially induced carbonate precipitation and straw checkerboard barriers on desertification control and ecological restoration. Ecol. Eng. 152, 105883. doi:10.1016/j.ecoleng.2020.105883
Li, X. R., Xiao, H. L., He, M. Z., and Zhang, J. G. (2006). Sand barriers of straw checkerboards for habitat restoration in extremely arid desert regions. Ecol. Eng. 28, 149–157. doi:10.1016/j.ecoleng.2006.05.020
Li, X., Zhang, Z., Tan, H., Gao, Y., Liu, L., and Wang, X. (2014). Ecological restoration and recovery in the wind-blown sand hazard areas of northern China: Relationship between soil water and carrying capacity for vegetation in the tengger desert. Sci. China Life Sci. 57, 539–548. doi:10.1007/s11427-014-4633-2
Li, X., Zhou, R., Jiang, H., Zhou, D., Zhang, X., Xie, Y., et al. (2018). Quantitative analysis of how different checkerboard sand barrier materials influence soil properties: A study from the eastern edge of the tengger desert, China. Environ. Earth Sci. 77, 481–515. doi:10.1007/s12665-018-7653-6
Li, Y., Cui, J., Zhang, T., Okuro, T., and Drake, S. (2009). Effectiveness of sand-fixing measures on desert land restoration in Kerqin Sandy Land, northern China. Ecol. Eng. 35, 118–127. doi:10.1016/j.ecoleng.2008.09.013
Liang, X., Li, P., Wang, J., Shun Chan, F. K., Togtokh, C., Ochir, A., et al. (2021). Research progress of desertification and its prevention in Mongolia. Sustainability 13, 6861. doi:10.3390/su13126861
Liu, L., and Bo, T. (2020). Effects of checkerboard sand barrier belt on sand transport and dune advance. Aeolian Res. 42, 100546. doi:10.1016/j.aeolia.2019.100546
Mengmeng Wang, J. L., Wang, D., Wu, J., and Wu, J. (2021). Research on factors affecting cutting resistance of cutting blade based on sand trough test. Integr. Ferroelectr. 221, 20–32. doi:10.1080/10584587.2020.1728818
Niu, B., Tan, L., Zhang, X. J., Qu, J., An, Z., Wang, J., et al. (2020). Targeted control of sand hazards for a railway in extremely arid regions using fingerprinting approaches. Geomorphology 361, 107189. doi:10.1016/j.geomorph.2020.107189
Qu, J., Zu, R., Zhang, K., and Fang, H. (2007). Field observations on the protective effect of semi-buried checkerboard sand barriers. Geomorphology 88, 193–200. doi:10.1016/j.geomorph.2006.11.006
Sarafrazi, V., and Reza Talaee, M. (2020). Comparing performances of a triangular embankment and a rigid wall-type barrier in sandstorms using simulation and a wind tunnel test. Eur. Phys. J. E 43, 74–15. doi:10.1140/epje/i2020-11996-1
Shengyu, L., and Jiaqiang, L. (2003). The ecological restoration functions of the straw-checker sand-barriers-a case study along the desert highways in the gurbantonggut desert. Arid Zone Res. 20, 7–10.
Sun, X., Miao, L., Wang, H., Wu, L., and Zhang, J. (2021). Enzymatic calcification to solidify desert sands for sandstorm control. Clim. Risk Manag. 33, 100323. doi:10.1016/j.crm.2021.100323
Tang, Y., and Liu, Z.-M. (2012). Advances, trends and challenges in seed bank research for sand dune ecosystems. Chin. J. Plant Ecol. 36, 891–898. doi:10.3724/sp.j.1258.2012.00891
Taniguchi, T., Yuzawa, T., HuiPing, M., Yamamoto, F., and Yamanaka, N. (2021). Plantation soil inoculation combined with straw checkerboard barriers enhances ectomycorrhizal colonization and subsequent growth of nursery grown Pinus tabulaeformis seedlings in a dryland. Ecol. Eng. 163, 106191. doi:10.1016/j.ecoleng.2021.106191
Wang, C., Hill, R. L., Bu, C., Li, B., Yuan, F., Yang, Y., et al. (2021). Evaluation of wind erosion control practices at a photovoltaic power station within a sandy area of northwest, China. Land Degrad. Dev. 32, 1854–1872. doi:10.1002/ldr.3839
Wang, J., and Wang, R. (2019). The physical and chemical properties of soil crust in straw checkerboards with different ages in the mu us sandland, northern China. Sustainability 11, 4755. doi:10.3390/su11174755
Wang, T., Qu, J., and Niu, Q. (2020). Comparative study of the shelter efficacy of straw checkerboard barriers and rocky checkerboard barriers in a wind tunnel. Aeolian Res. 43, 100575. doi:10.1016/j.aeolia.2020.100575
Wenhua, Y., Wang, X., Wu, Y., and Wang, F. (2022). Research on sand resistance performance of comprehensive protection facilities for desert hinterland highways under strong wind environment. Archives Civ. Eng. 68, 683–698.
Xu, B., Zhang, J., Huang, N., Gong, K., and Liu, Y. (2018). Characteristics of turbulent aeolian sand movement over straw checkerboard barriers and formation mechanisms of their internal erosion form. J. Geophys. Res. Atmos. 123, 6907–6919. doi:10.1029/2017jd027786
Xue, C., Li, K., and Kong, L. (2021). Review of research on wind-sand hazards in China railway. Archit. Eng. Sci. 2021. doi:10.32629/aes.v2i2.368
Zhang, C., Li, Q., Zhou, N., Zhang, J., Kang, L., Shen, Y., et al. (2016). Field observations of wind profiles and sand fluxes above the windward slope of a sand dune before and after the establishment of semi-buried straw checkerboard barriers. Aeolian Res. 20, 59–70. doi:10.1016/j.aeolia.2015.11.003
Zhang, K., Tian, J., Qu, J., Zhao, L., and Li, S. (2022). Sheltering effect of punched steel plate sand fences for controlling blown sand hazards along the Golmud-Korla Railway: Field observation and numerical simulation studies. J. Arid Land 14, 604–619. doi:10.1007/s40333-022-0019-7
Zhang, K., Zhang, W., Tan, L., An, Z., and Zhang, H. (2015). Effects of gravel mulch on aeolian transport: A field wind tunnel simulation. J. Arid Land 7, 296–303. doi:10.1007/s40333-015-0121-1
Zhang, S., Ding, G. d., Yu, M. h., Gao, G. l., Zhao, Y. y., Wu, G. h., et al. (2018). Effect of straw checkerboards on wind proofing, sand fixation, and ecological restoration in shifting sandy land. Int. J. Environ. Res. Public Health 15, 2184. doi:10.3390/ijerph15102184
Keywords: sand barrier laying method, windbreak efficiency, wind speed flow field, numerical simulation, sand barriers
Citation: Dang X, Chi X, Tang G, Meng Z, Huang H, Zhai B and Yuan L (2023) Numerical study on wind profiles change trend of upright reticulation barriers under different configuration models. Front. Environ. Sci. 11:1159977. doi: 10.3389/fenvs.2023.1159977
Received: 06 February 2023; Accepted: 07 April 2023;
Published: 20 April 2023.
Edited by:
Heping Liu, Washington State University, United StatesCopyright © 2023 Dang, Chi, Tang, Meng, Huang, Zhai and Yuan. This is an open-access article distributed under the terms of the Creative Commons Attribution License (CC BY). The use, distribution or reproduction in other forums is permitted, provided the original author(s) and the copyright owner(s) are credited and that the original publication in this journal is cited, in accordance with accepted academic practice. No use, distribution or reproduction is permitted which does not comply with these terms.
*Correspondence: Zhongju Meng, TWVuZ3pob25nanVAMTI2LmNvbQ==; Limin Yuan, eXVhbl9saW1pbkAxNjMuY29t