 Jing Huang
 Ziheng Shangguan
 Tiantian Gui1,2
- 1School of Business, Hubei University, Wuhan, China
- 2Research Center of Open Economy, Hubei University, Wuhan, China
Introduction: In order to change the long-term economic development model which is at the expense of the environment, China proposed a series of new energy development and environmental intervention policies. However, there is no evidence to support the impact of urban development on the green development efficiency (GDE) under China’s macroeconomic policies at present. In order to answer this research question and help the government to improve the GDE, this study takes the Yangtze River Economic Belt (YREB) city cluster (41 cities) in China as an example to conduct an empirical study.
Methods: We first measure the GDE of these cities by Slack Based Model (SBM). Then, the Tobit model is used to measure the impact of urban development elements, namely population urbanization, land urbanization, and urban industrial development, on GDE.
Results and Discussion: The analysis of the data leads to the following conclusions and suggestions: 1) The GDE of the city cluster in the YREB has generally been improved driven by policies. But compared to policy interventions, the level of science, technology and management are the primary drivers of long-term improvement in GDE. 2) In order to avoid the economic development and environmental capacity failure to afford the increase in energy consumption and pollution discharge caused by population urbanization and land urbanization, local governments need to promote energy transformation, increase environmental protection efforts and attract top-tier talent. 3) The improvement of GDE by industrial upgrading is a dynamic and slow process, and blindly pushing industrial restructuring will lead to a decline in GDE. Therefore, the Chinese government needs to provide an ecologically suitable environment for local industrial development, which needs to avoid “pulling out the seedlings” and “one-size-fits-all” approach.
1 Introduction
Many urban cities all around the world have seen rapid industrialization and quick economic growth in recent decades. However, urban development has resulted in a number of environmental and ecological issues, including water pollution, global warming, and the destruction of ecological systems (Sassen, 2010; Liu D et al., 2022; Hao, F. et al., 2020). If the environmental and ecological issues are not effectively alleviated and improved, they will, in turn, inhibit urban development (Brown, 2012). What is more, it may also contribute to a number of ancillary catastrophes, including food production decline, land pollution, and sea level rise (Vignola and Oosterveer, 2022; Jácome Polit D et al., 2022; Karimian Shamsabadi M et al., 2022). Therefore, researchers and urban governments around the world have to think more about how to alter the urban development model which is at the price of ecology and the environment to a more environment-friendly and sustainable way.
Urban economies are heavily reliant on fossil fuels like coal, oil, and natural gas. The use of these energy sources will unavoidably harm the environment and the ecosystem. Therefore, energy transition, namely, the replacement of traditional fossil fuels with green and clean energy, has been widely promoted by the United Nations Environment Programme (UNEP) (Neira, 2020). These green and clean energy sources include wind, hydro, solar, bioenergy, and geothermal energy. In this background, the concept of green development was introduced, which is a sustainable development approach that prioritizes social fairness, a low-carbon economy, and efficient energy utilization (Barbier, 2011). As early as the 1970s, some developed countries began to promote the green development of urban cities through laws and acts (Du Pisani, 2006). For instance, the Clean Air Act (1956) of the United Kingdom promoted energy transition in the traditional industry; the Basic Law for Public Health Measures (1967) of Japan clearly stipulated the basic responsibility of the state to protect national health and maintain the quality of the living environment; the Federal Pollution Control Act (1974) of German mainly set emission standards for large industrial enterprises; the National Environmental Policy Act (1969) of America proposed to maximize the benefits of using environmental resources while minimizing environmental degradation, health crisis, and safety risks. Subsequently, more and more countries have also started to make green development transformation. In January 2021, the Global Climate Summit 2021 (AS 2021) re-emphasizes the urgency of the energy transition and reduction of greenhouse gas emissions, which makes green development a global goal for contemporary urban development.
China first proposed “green development” to deal with the challenges of sustainable development in China’s Sustainable Development Strategy Report (2010). Then, in the next year, the goals of green development for cities were stated in the 12th Five-Year Plan for National Economic and Social Development (2011–2015). In addition to promoting clean energy conversion and efficient energy use, China’s green development emphasized more on economic growth as well as improving the environment and ecology (Hong et al., 2018; Lei, W et al., 2022). To achieve these goals, important laws, such as the Environmental Protection Law (2015), the Water Pollution Prevention and Control Law (2017), the Energy Conservation Law (2018), and the Circular Economy Promotion Law (2018), have been issued. At the same time, China has also put forward supporting policies such as the Industrial Green Development Plan (2016–2020), Green Manufacturing Project Implementation Guide (2016–2020), Guidance on Accelerating the Establishment of a Sound Green Low-Carbon Circular Development Economic System (2021). Currently, green development has become a crucial urban development strategy for China to ensure the coordinated development of the environment and economy (Zeng and Wu, 2020).
Initially, energy transition and pollution reduction were emphasized in the process of urban green development (Carlo Carraro et al., 2012). Hence, scholars attempted to evaluate green development by constructing a comprehensive index system (Godlewska and Sidorczuk-Pietraszko, 2019; Xiao et al., 2022). The indicators in the system include carbon dioxide emission (Wang and He, 2022), sulfur dioxide emission (Wang F et al., 2019), nitrogen dioxide emission (Liu Y et al., 2022), the amount of industrial wastewater discharged (Zhao et al., 2021), industrial smoke discharge (Wang M et al., 2019), etc. With the emergence of the “New Urbanism”, the links between the economy, environment and society became the focus of urban green development (White and Ellis, 2007). As a result, measuring the urban green development purely from the perspective of pollutant emissions has been gradually abandoned, and scholars began to consider the coupling effect of economy, environment, and society. The common methods are data envelopment analysis (DEA) including super-efficient Slack Based Model (SBM) (Ding et al., 2022), the Energy Based Model (EBM) (Yang et al., 2022), stochastic Frontier analysis (SFA) (Shui et al., 2015), and stochastic non-parametric data envelopment analysis (StoNED) (Luo, 2022).
In recent years, elements such as human welfare, social welfare, equity, sharing, and integration have been incorporated into the research area of green development, which further expands the breadth and depth of green developmental research (UNEP, 2011). Based on the theory of “Ecology of Human Welfare,” Wells points out that the pursuit of short-term economic and other benefits comes at the expense of long-term environmental losses that may eventually overshadow those benefits. In other words, the pursuit of one type of welfare endangers another (Wells, 1993). Wang et al. (2022) studied the level of green development in Chinese industry from the perspective of environmental welfare efficiency (EWE). They found that Industrial Productivity Efficiency (IPE) is much higher than EWE and that the improvement of EWE will be the key to the green transformation of Chinese industry (Wang and Li, 2020). Huang L et al. (2021) explored the impact of the sharing economy on green development based on the evolutionary game. The results show that the resource-sharing development model was more likely to achieve the equilibrium of the environmental game between firms and consumers than the factor input development model (Huang L et al., 2021).
On the other hand, studies on urbanization and economic development are more well documented (Henderson, 2003; Bloom et al., 2008; Dutt and Jaime Ros, 2008) and research on the relationship between urbanization and green development provides theoretical and practical value for quality urban development. At the same time, the urbanization process is a systematic evolution and expansion process, a multidimensional concept that includes not only population urbanization, but also land urbanization and industrial urbanization. Existing studies have mainly explored the impact of a particular aspect of urbanization on GDE, for example, Zhu et al. (2019) studied the impact of industrial restructuring on GDE and concluded that both rationalization and advancement of industrial structure have a positive impact on GDE. Yanhua Guo et al. (2020) studied the impact of industrial agglomeration on green development and found a u-shaped relationship between industrial agglomeration and green development in Northeast China from 2003 to 2016. Some studies have also focused on the relationship between different elements and regional green development. Wang Z et al. (2022) analyzed the relationship between regional integration on urban green development efficiency (UGDE) in China, thus finding a spatial spillover effect of regional integration on UGDE. Zhang et al. (2018) found that technological innovation enhances UGDE and showed that there are regional and administrative level differences in UGDE. Feng and Chen, (2018) analyzed provincial GDE using a spatial Durbin model and found that different environmental regulations can have different effects on industrial GDE in China.
At present, China has proposed a series of new energy development and environmental intervention policies to promote urban green development. However, there is no evidence to support the impact of urban development on the GDE under China’s macroeconomic policies at present. In addition, the existing researches still have the following deficiencies: (1) There is no unified index system to measure the urban GDE. (2) Generally, only the impact of urban industrial development on GDE is considered, while that of population inflow and urban expansion is ignored. (3) Most empirical studies focus on green development at the provincial level, with little evaluation of green development at the municipal level. To fill the research gap, this paper takes 41 cities in China’s Yangtze River Economic Belt (YREB) city cluster as the research object. First of all, the index system of urban GDE is constructed based on the previous research. Second, SBM is used to obtain the urban GDE. Next, we use Tobit regression to examine the impact of three dimensions of urban development, namely, population urbanization, land urbanization, and urban industrial development, on GDE. In the end, the heterogeneity of GDE in different regions of YREB was analyzed. This study makes the following two contributions to the research related to urban green development. First, the measurement dimension of urban development was extended, which includes urbanization rate, urban built-up area rate, rationalization of industrial structure, and advancement of industrial structure. Second, we provide a comprehensive interpretation of the green development of the core cities in China’s YREB and propose strategies for future development.
This study is divided into three steps and the research framework is shown in Figure 1.
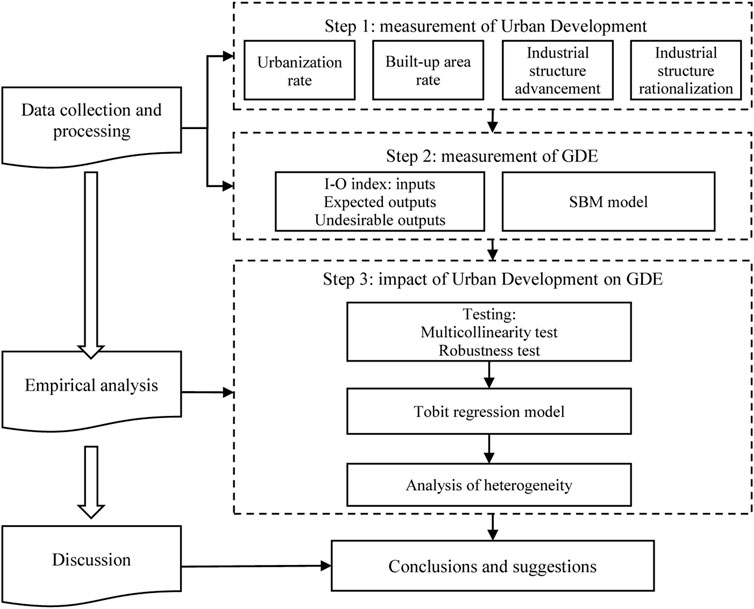
FIGURE 1. Research framework.
The rest of the research is organized as follows. The second part provides information on the GDE measurement technique, the urban development indicator system, an integrated approach to examining how urban development affects GDE, and data. The third part reports the results of the empirical analysis. The fourth part discusses the calculation results and puts forward some policy recommendations. The fifth part is the main conclusion of this paper.
2 Materials and methods
2.1 Index system
2.1.1 Indicators of urban development
Previous studies only consider the impact of urban industrial development on GDE (Guo et al., 2020), but ignore other elements of urban development. For instance, population urbanization and land urbanization also affect the GDE. Based on the comprehensive consideration of the impact of urban development on green development and the existing urban development evaluation (Li et al., 2020), in addition to urban industrial development, population urbanization and land urbanization are also selected to measure urban development in this paper.
2.1.1.1 Population Urbanization
Population urbanization is measured by urbanization rate (UR), which is the proportion of the urban resident population to the total resident population in a certain country or region. It reflects the process and degree of population concentration in the urban area. The calculation formula is as follows.
Where UP represents the urban resident population in a certain city, RP represents the rural resident population.
2.1.1.2 Land Urbanization
Land Urbanization is a process of land use transformation in the urban area. In this paper, the built-up area rate (BAR) is used to measure land urbanization, which is the proportion of built-up area in the urban area. It reflects the extent of urban expansion. It is expressed by the formula as follows.
Where, BA represents the built-up area in a certain city,
2.1.1.3 Urban industrial development
Inspired by previous studies (Kraftova et al., 2016; Yu, 2017), this paper introduces the rationalization of industrial structure (RIS) and advancement of industrial structure (AIS) to measure urban industrial development. RIS and AIS portray the adjustment of industrial structure from two dimensions. RIS refers to the aggregate quality of the organic connection between industries. On the one hand, it is a response to the degree of coordination on the scale of production between industries; on the other hand, it is also a reflection of the degree of rational utilization of production factors. Using the method proposed by Ivana et al. and Gan et al. to measure the RIS, its formula is as follows.
Where Y represents the output value, L represents the number of employees, and i represents industry i, which is divided into primary, secondary, and tertiary industries. It can be seen that the larger the RIS, the more reasonable the industrial structure.
AIS refers to the development of industrial structure from low level to high level, which is also a measure of industrial structure upgrading, specifically the development of tertiary industry (Han et al., 2017; Li et al., 2017). The ratio of tertiary sector GDP to secondary sector GDP is used to measure it, with the following formula.
Where,
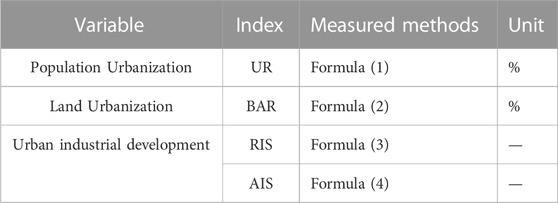
TABLE 1. Indicators of urban development.
2.1.2 Indicators of GDE
The measure of GDE usually adopts an input-output model, such as the DEA model and SBM model (Seiford and Zhu, 2002). However, there is no uniform standard for the selection of input and output variables. Generally, annual electricity consumption, annual electricity consumption, investment in fixed assets, capital stock, labor force, energy consumption and employment in the management of water conservancy and environment are used in input variables; industrial wastewater discharge, sulfur dioxide emissions, carbon dioxide emissions, GDP and total retail sales of consumer goods are used in output variables (Feng and Xu, 1999; Su et al, 2019; Zhang et al, 2021a; Zhang et al, 2021b). In this paper, six indicators with higher boundary contribution rates are selected to measure GDE among these indicators, as shown in Table 2. Descriptive statistics of these indicators are shown in Table A1.
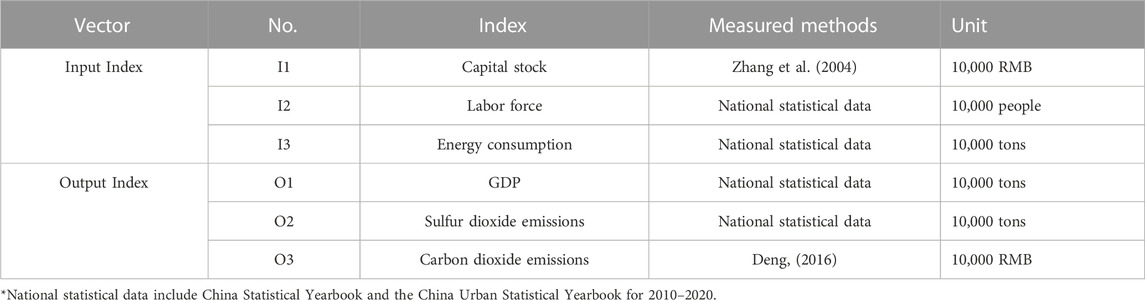
TABLE 2. Indicators of GDE.
2.2 Research method
2.2.1 SBM model
To overcome the defects of traditional models and more accurately measure the effectiveness of evaluation objects, Tone, (2001) proposed the non-radial and non-angle Slack Based Model (SBM). The results of efficiency measurement are not affected by the units used to measure input and output items. Input redundancy and output deficiency can be obtained under the premise of input minimization and output maximization at the same time. For production with m inputs and s outputs, we can obtain the possible set of production:
The SBM model is used to measure the efficiency of DMU (
Where
2.2.2 Tobit model
Our explained variable GDE is a truncated data, ranging between 0 and 1, and any value above 1 is assigned a value of 1. By common sense it should be normal data, but variables appear censored, all of which can be studied using the Tobit model (instead of the commonly used OLS linear regression).
The Tobit model was proposed by economist James Tobin in 1958, and it is a generalization of the Probit regression model. This model, also known as the restricted dependent variable model, is an econometric model proposed for explanatory variables for which the data are either discrete distributed or partially continuous. It solves the problem of linear regression with restricted dependent variables. The model is estimated using the great likelihood method, which can better avoid inconsistency and bias problems in the parameter estimation process. The specific model expressions are as follows.
Where,
In this study, UR, BAR, RIS and AIS are used as explanatory variables. The explained variable is GDE. Tobit regression is used to examine the impact of urban development on GDE. In order to exclude the influence of other factors, frequently used control variables are also selected in this paper. In this paper, we choose panel Tobit mixed regression model. The model is defined as shown below.
Where, i is city and t is year, Control is the control variable, α is the regional unobservable effect, and
2.3 Data
2.3.1 Research area
The paper takes the city cluster in YREB as the research object, and concentrates on 41 cities. These cities were chosen for the following reasons: firstly, they have complete statistics; secondly, their economies are relatively developed; thirdly, these cities are the main cities driving the economic development of the YREB. The upper reaches of the Yangtze River includes Chongqing, Luzhou, Panzhihua, Chengdu, Yibin, Guiyang, Zunyi, Anshun, Bijie; the middle reaches includes Huangshi, Ezhou, Wuhan, Jingzhou, Yichang, Xianning, Changsha, Yueyang, Yiyang, Nanchang, Jiujiang; the lower reaches includes Shanghai, Nanjing, Yangzhou, Zhenjiang, Suzhou, Wuxi, Changzhou City, Nantong, Taizhou, Hangzhou, Jiaxing, Huzhou, Ningbo, Shaoxing, Zhoushan, Hefei, Maanshan, Anqing, Tongling, Chizhou, Wuhu. These were chosen because they are the principal cities driving the urban YREB cluster’s economic growth. In Figure 2, their precise locations are depicted.
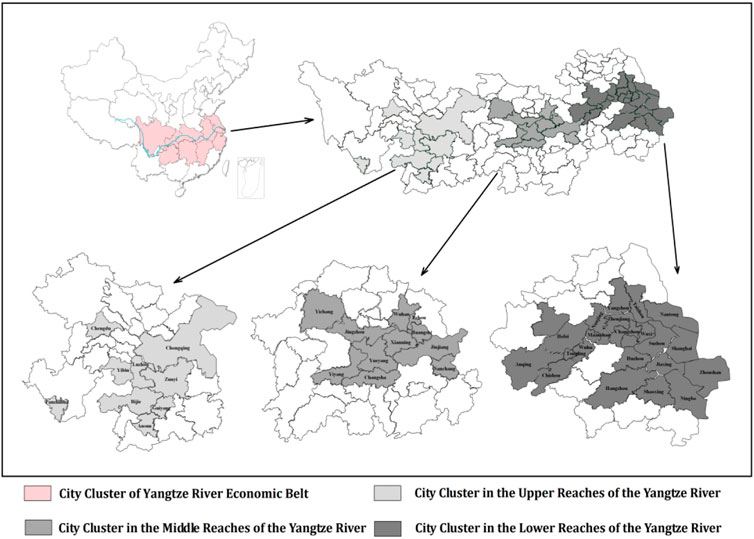
FIGURE 2. Research area.
The YREB is one of the giant river basin economic belts in China with a large population, a large industrial scale and a very complete urban system. It is a strategic location for green development spanning the eastern, central and western regions of China. The YREB is a strategic support site for China’s economic development and a major battleground for taking over the transfer of industries from coastal areas. The heavy industrial structure is characterized by a highly intensive layout of heavy chemical industries along the river, with the provinces and cities along the Yangtze River accounting for about 46% of the country’s chemical output. At present, YREB’s green development faces unprecedented problems such as industrial isomorphism, environmental pollution, low efficiency in using resources, unbalanced development, and inadequate development (Zhang et al., 2021a). On 14 November 2020, General Secretary Xi Jinping gave important instructions on the ecological and environmental protection of the YREB, to “promote the high-quality development of the YREB and write a new chapter of ecological priority and green development”. It is of great significance to promote the development of the YREB along the path of ecological priority and green development, and to build it into a green economic demonstration belt with significant national impact.
2.3.2 Data collection
The explanatory variables are UR, BAR, RIS and AIS. They are calculated by Formula 1, 2, 3, 4 respectively, and their calculation results are shown in Figures A1, A2, A3, A4. All parameters in the formula were derived from China Statistical Yearbook and the China Urban Statistical Yearbook. Among them, Y, Y1, Y2, and Y3 are converted to constant prices in 2010. The explained variable is GDE which is calculated by Formula 6. The sources of each parameter in the equation are shown in Table 2. Besides the explanatory and explanatory variables, this paper introduces control variables to capture their effects on GDE (Chen et al., 2017; Sun et al., 2018). The control variables include environmental protection, government influence, openness, innovation level, and Policy Influence. The measurement methods of these variables are shown in Table 3. Descriptive statistics of these variables are shown in Table A2.
TABLE 3. Variables and definitions.
3 Impact of urban development on the GDE
3.1 GDE of the city cluster in the YREB
The GDE obtained by SBM model is shown in Figure 3. In 2010, the GDE of the city cluster in the upper reaches of Yangtze River is low and wide-ranging, increasing from north to south, ranging from 20% to 100%; the GDE of the city cluster in the middle reaches of Yangtze River is generally high and balanced, running the gamut from 40% to 80%; and the GDE of the city cluster in the lower reaches of Yangtze River is the highest, varying from 40% to 100%. Between 2012 and 2018, the GDE of the city cluster in the upper, middle and lower reaches of Yangtze River had all been improved. Among them, the GDE of the city cluster in the upper and middle reaches of Yangtze River has greatly increased; whereas, the eastern coastline region of the city cluster in the lower reaches of Yangtze River has seen a general improvement in GDE, but little change in its western region. In 2020, the GDE of the city cluster in the upper, middle and lower reaches of Yangtze River all exhibited a decline.
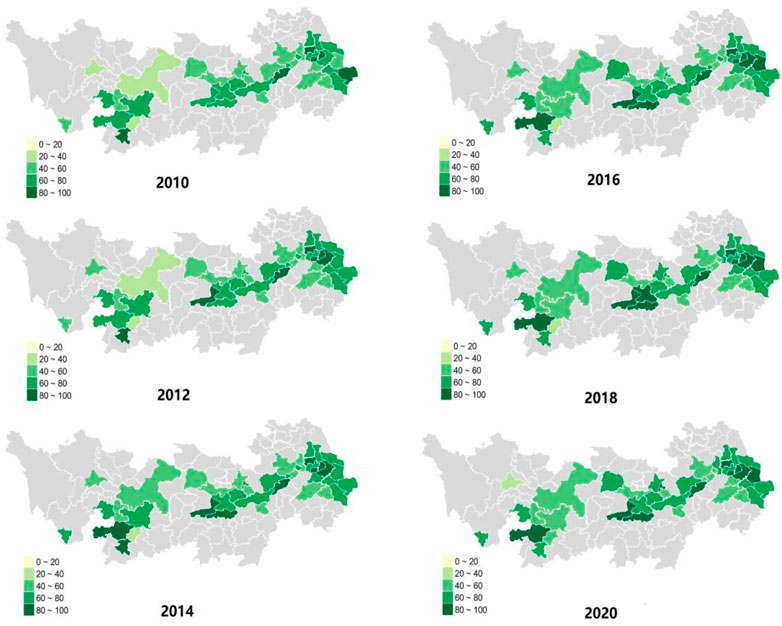
FIGURE 3. GDE from 2010 to 2020.
According to the calculation results of GDE, in 2010, the GDE of the city cluster in the upper reaches of Yangtze River is low and spans a wide range, while the city cluster in the middle reaches of Yangtze River overall had a slightly higher level and was more evenly distributed than the upper reaches. The city cluster in the lower reaches of Yangtze River had the highest level of GDE. This result is consistent with the findings of Zhu et al. (2019). In actuality, the economic development of each province in China’s YREB is extremely uneven, with a general pattern of downward trend from east to west. The provinces and municipality in the lower reaches of the Yangtze River, including Anhui Province, Zhejiang Province, Jiangsu Province and Shanghai municipality, account for about 20%–30% of the country’s total GDP between 2000 and 2010 (Wu, 2019; Zhang S. et al., 2019) and demonstrated a long period of high growth in the future (Zhang and Wu, 2006). In addition, the coastal provinces and municipalities in the lower reaches of the Yangtze River have attracted a large number of foreign capital and foreign enterprises (Fang G. et al., 2020). These capital and enterprises have improved the technological innovation and environmental protection standards in the area (Reddy et al., 2022). According to statistics, the innovation patents of Zhejiang province, Jiangsu province and Shanghai municipality alone accounted for more than 55% of the whole YREB in China in 2017, and this proportion was higher before 2017 (Hu S. et al., 2021). On the other hand, the fortune 500 companies here all require their Chinese suppliers to meet international environmental standards such as ISO 14000 including international environmental standards and corporate social responsibility standards (Lam, 2011). Economic development and the improvement of innovation capacity and management standards form a virtuous cycle, which promotes the GDE of the city cluster in the lower Yangtze River. On the contrary, the economic level of city cluster in the upper and middle reaches of Yangtze River were relatively backward coupled with more polluting enterprises, leading to a lower level of GDE.
Between 2012 and 2018, the GDE of the YREB city clusters all received a significant boost. Some studies suggest that this phenomenon is related to the macro policies of the Chinese government (Li G et al., 2021; Li J et al., 2021; Zhang et al., 2022). Our regression results also support the idea that PI is positively correlated with GDE. An interesting observation is that our results show a significant positive correlation between GDE and PI for the city cluster in the upper and middle reaches of Yangtze River, but not in the lower reaches. This means that the GDE of the city cluster in the upper and middle reaches of Yangtze River is more dependent on national policy regulation, while the lower reaches is more a result of the inherently high standards of technological innovation and environmental protection.
Our results further point to an overall downward trend in GDE for the YREB city clusters in 2020. The latest study considered the impact of the COVID-19 epidemic and rarely included data from 2020 in the analysis. In response to the findings obtained in this paper, we believe that a plausible explanation is that while both input variables and unexpected output declined during the epidemic, expected output (GDP) declined faster than they did (Dhar, 2020). As a result, the GDE of the YREB city clusters has declined.
3.2 Impact of urban development on the GDE
First, to test the multicollinearity of the data, the variance inflation factor (VIF) test was performed, as shown in Table A3. When VIF ≥10, it is generally accepted that there is a significant multicollinearity. It can be found that the VIF values of all variables in this paper are much less than 10, so there is no strong multicollinearity among the independent variables. The tests mentioned above lead to the conclusion that Eq. 8 is applicable to the analysis of the impact of urban development on the GDE. This paper employs clustering standard error regression, and the regression results are shown in Table 4. In order to verify the reliability of the results, this paper uses a robustness test for models 2 to 5 by changing the sample size, i.e., the data for 2010 and 2020 are removed. Table A4 presents the robustness test’s findings. The results of the test are consistent with those of the original model, demonstrating the robustness and dependability of the original model’s computed outputs.
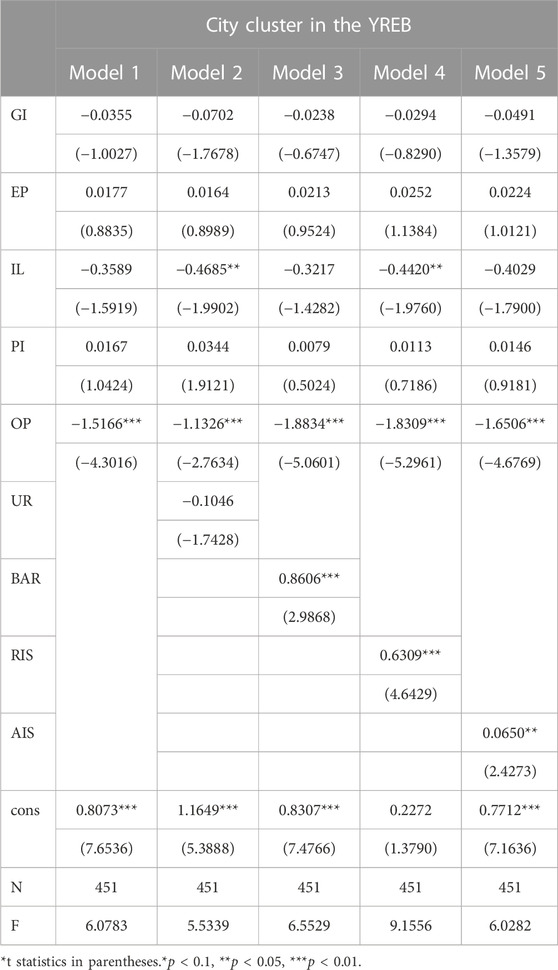
TABLE 4. Impacts of urban development on the GDE in the YREB.
Table 4 shows the impact of urban development on GDE in the YREB. Model 1 is the regression equation of control variables on the GDE. Models 2 to 5 display the regression results with various explanatory factors respectively. Among them, BAR (B = 0.8606, p < 0.01), RIS (B = 0.6309, p < 0.01) and AIS (B = 0.0650, p < 0.05) are significantly and positively correlated with GDE. It shows that the increase of urban land use as well as the optimization and upgrading of industrial structure will promote the efficiency of urban green development. On the other hand, UR (B = −0.1046, p < 0.01) is significantly and negatively correlated with GDE. It shows that the efficiency of urban green development will decline with the growth of urban population.
4 Heterogeneity test
Since there are some differences in the industrial structure, economic development level, scale of infrastructure construction and government management between the city cluster in the upper, middle and lower Yangtze River (Li-ming et al., 2022; Xie et al., 2022), heterogeneity analysis was conducted in this article. The regression results are presented in Tables 5, 6, 7, respectively.
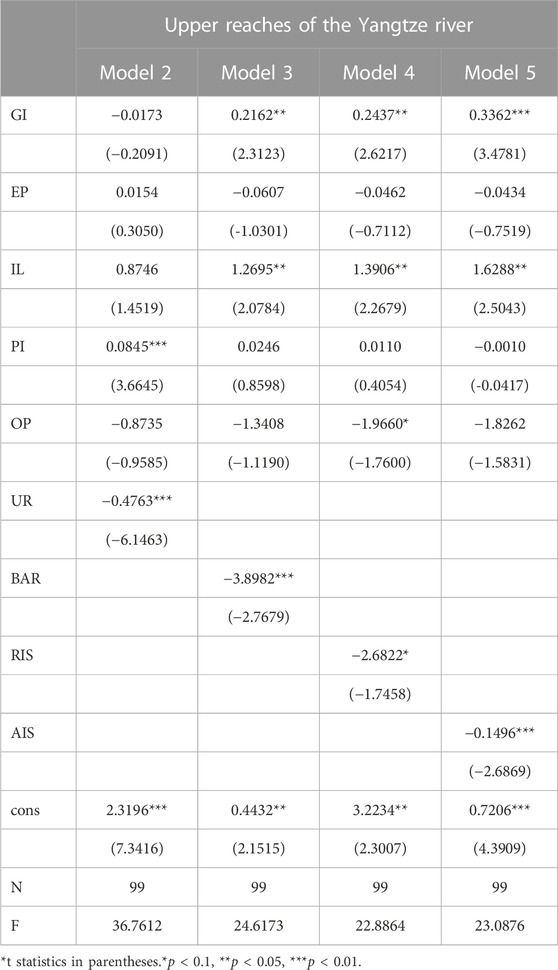
TABLE 5. Impact of urban development on GDE in the upper reaches of the Yangtze River.
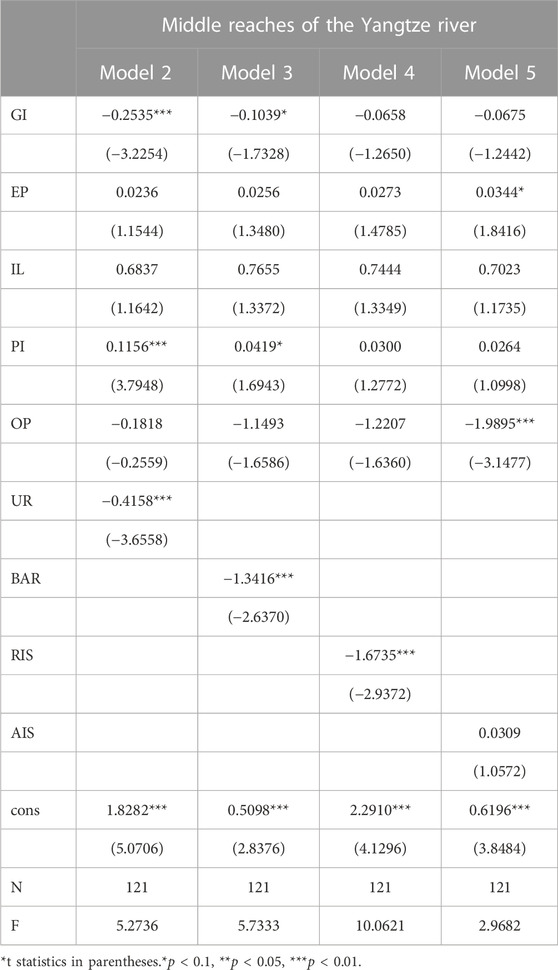
TABLE 6. Impact of urban development on GDE in the middle reaches of the Yangtze River.

TABLE 7. Impact of the urban development on GDE in the lower reaches of the Yangtze River.
Table 5 shows the regression results for the city cluster in the upper reaches of Yangtze River. The findings demonstrate a significantly and negative correlation between UR (B = −0.4763, p < 0.01), BAR (B = −3.8982, p < 0.01), RIS (B = −2.6822, p < 0.1), and AIS (B = −0.1496, p < 0.01). It shows that the growth of urban population, the increase of urban land use, the optimization of industrial structure and the upgrading of industrial structure will all inhibit the efficiency of urban green development in the upper reaches of the Yangtze River.
The regression results of the city cluster in the middle reaches of Yangtze River are displayed in Table 6. The findings reveal a significantly and negative correlation between UR (B = −0.4158, p < 0.01), BAR (B = −1.3416, p < 0.01), and RIS (B = −1.6735, p < 0.01), but AIS is not significant at the level of 10%. Different from the upper reaches of the Yangtze River, the upgrading of urban industrial structure has no significant impact on the urban green development efficiency in the middle reaches of the Yangtze River, while the growth of urban population, the increase of urban land use and the optimization of industrial structure still inhibit the urban green development efficiency.
Table 7 presents the regression results for the city cluster in the lower reaches of Yangtze River. The results revealed that BAR (B = 0.7014, p < 0.05), RIS (B = 0.3763, p < 0.05) and AIS (B = 0.0949, p < 0.01) are significantly and positively correlated with GDE; while UR is not significant at the 10% level. It shows that the increase of urban land use as well as the optimization and upgrading of industrial structure in the lower reaches of the Yangtze River has the opposite effect on the urban green development as that in the upper and middle reaches, that is, they will promote the efficiency of urban green development. However, the increase of urban population has no significant impact on the efficiency of urban green development.
The UR and BAR of the city cluster in YREB demonstrate a significant negative correlation with GDE, indicating that population urbanization and land urbanization may generally inhibit the GDE. This phenomenon is particularly notable in the city cluster of upper and middle Yangtze River. Since 2010, land financing has played a significant role in generating these cities' tax revenues (Gu C et al., 2017), which has led to an increase in the rate of land urbanization. The accelerating pace of land urbanization has caused it to outpace economic growth (Chen M et al., 2013). In addition, in 2014, the Chinese government proposed the National New Urbanization Plan in order to increase the rate of population urbanization between 2014 and 2020. The urban population growth and urban area expansion increased the demand for land, water, electricity, coal, oil and natural gas, and also generated large amounts of urban waste and pollutants, thus increasing the environmental burden (Yao J et al., 2021). Finally, economic development and environmental capacity failed to afford the increase of energy consumption and pollution discharge caused by population urbanization and land urbanization, which led to the decrease of the GDE. This conclusion is similar to the findings of foreign studies. A series of studies have pointed out that uncontrolled urban expansion and green growth do not work well together. There is a clear negative correlation between population density and greenhouse gas emissions (Hoornweg, 2010; Kennedy, 2011; Khan, 2006). Typical examples are Atlanta and Barcelona, two cities with the same population but with a 28-fold difference in population per hectare and a four-fold difference in per capita greenhouse gas emissions. Cities with reasonable urban sprawl (e.g., Curitiba, Barcelona, Singapore) have significantly lower emissions per capita compared to cities with sprawl such as Albuquerque, Atlanta or Los Angeles (Zenghelis 2013). Conversely, unlike the cities in upper and middle reaches, the UR of the city cluster in the lower reaches of Yangtze River does not have a significant impact on the GDE. One plausible explanation is that the highly qualified personnel attracted by these cities indirectly affected GDE, such as indirectly improving the growth of regional economies and reducing management costs. Meanwhile, the GDE of the city cluster in the lower reaches of Yangtze River was improved in the process of land urbanization, and this finding is consistent with Li et al. (2022). In fact, Zhejiang Province, Jiangsu Province and Shanghai municipality in the lower reaches of Yangtze River have been the leaders of green development in China (Shan and Bi, 2012). The State Council has successively put forward some policies to improve urban green supporting facilities and urban landscaping in these regions since 2016, such as the Yangtze River Delta Urban Agglomeration Development Plan (2016) and the Yangtze River Delta Ecological and Green Comprehensive Development Demonstration Zone (2019). Therefore, these cities gave more consideration to environmental and ecological protection in the early days. These cities pay more attention to environmental and ecological protection in the process of land urbanization.
Several researches have revealed that both RIS and AIS show a significant positive correlation with GDE. These studies contend that along with the change in the driving force of economic development, there is a free flow of production factors between industries, such as labor and capital. This process will lead to the dynamic optimization of industrial structure, which is called the RIS (Jin and Li, 2013). At the same time, the industrial structure will gradually shift from the primary industry to the secondary and tertiary industries, and the industrial type will increasingly transform from labor and capital intensive industries to technology and knowledge intensive, that is, the AIS (Peneder, 2002). Through RIS and AIS, traditional industries with high energy consumption, low production capacity, and high pollution will be gradually replaced by new industries with high added value, high yield, and low pollution, thus increasing the GDE (Liang G et al., 2021). Using data from the United Kingdom, Jan Eeckhout shows that if large cities are energy-efficient ways of generating output, energy efficiency can be improved by encouraging urbanization and thus green living. In addition to the inherent impact of RIS and AIS on the GDE, the Chinese government has vigorously supported new energy and environmental industries during the 12th (2011–2015) and 13th (2016–2020) Five-Year Plans to address the impact of environmental pollution and climate change. According to statistics, the share of clean energy consumption in total energy consumption in China rises from 13.0% to 24.3% between 2011 and 2020. Meanwhile, China’s annual investment in environmental industries is about RMB 100 billion (Zhao., 2010). Therefore, in general, the industrial development of the city cluster in YREB will promote GDE. However, the results of our heterogeneity analysis found the opposite effect in the city cluster of upper and middle Yangtze River. In fact, the industrial structure of these cities is often low and relatively backward. It is difficult to ensure the matching of industrial development and resource structure when industrial adjustment is implemented blindly (Tang, 2019). What is more, it may absorb some enterprises with high energy consumption and low efficiency (Guo et al., 2020). Although the local government will regulate these enterprises, after comprehensively weighing the benefits of economic development and environmental protection, they are still inclined to choose deregulation to achieve economic growth (Wang and Shen, 2016).
The limitation of the study is that due to the availability of data, no mechanism testing was performed. It is also possible that urban growth is unplanned due to accidents such as natural disasters, and its impact on urban green development is unknown. Future studies could explore this issue in more depth. We hope you are satisfied with our modifications and explanations.
5 Conclusion
This research first constructs an index system of GDE. Then, we measure the GDE of the city cluster in YREB by SBM from 2010 to 2020. Finally, the Tobit model is used to measure the impact of urban development elements, namely, population urbanization, land use urbanization, and urban industrial development, on GDE and perform a heterogeneity analysis. The conclusions reached are as follows.
(1) Through the measurement, we discover that the GDE of the city cluster in YREB has generally been improved. Between 2010 and 2018, the GDE of the city cluster in YREB has improved, but in 2020, the GDE of the city cluster in YREB decreased.
(2) The policy has led to a general improvement in the GDE of the city cluster in YREB based on the second column of the full sample regression results.
(3) From the regression results of the upper and middle reaches of the Yangtze River, we can see that blindly promoting population urbanization and land urbanization can inhibit the GDE.
(4) The RIS and AIS have contributed to the GDE. However, the results of our heterogeneity analysis found that RIS and AIS of the city cluster in the upper and middle reaches of the Yangtze River showed a significant negative correlation with GDE to different degrees.
Based on these findings, the following suggestions are made.
First, a good policy can only realize its value if it is implemented properly. Accelerating the formation of green production methods and promoting the overall green transformation of economic and social development requires the implementation of cleaner production, the implementation of the basic state policy on resources and protection of the environment and the new environmental protection law.
Second, it is essential to avoid the situation that the economic development and environmental capacity failure to afford the increase of energy consumption and pollution discharge in the urban city. Hence, local governments need to promote energy transformation, increase environmental protection efforts and attract top-tier talent.
Finally, the promotion effect of RIS and AIS on the GDE, is a dynamic and slow process and requires a certain industrial foundation. If the relevant policies do not match the current industrial structure, the blind promotion of industrial restructuring will lead to a decrease in the GDE. The Chinese government needs to adopt industrial structure upgrading according to local conditions, respect the heterogeneity of green development in different cities. Formulate targeted and focused policy measures and focus on the development of a well-balanced economic and industrial structure. Avoid ‘pulling out the seedlings’ and ‘one-size-fits-all’ approach. At the same time, cities with high GDE should play a good role in demonstration and leadership, and cities with low GDE should be given more support in industrial transfer and environmental protection.
Data availability statement
The raw data supporting the conclusion of this article will be made available by the authors, without undue reservation.
Author contributions
ZS initiated the study. JH, TG, and JL collected the data and wrote the manuscript. JH and TG processed the data and performed statistical analysis. ZS revised the manuscript. All authors read and approved the final manuscript.
Funding
This research is funded by Key Program of the National Social Science Fund (grant number: 19AJL016).
Conflict of interest
The authors declare that the research was conducted in the absence of any commercial or financial relationships that could be construed as a potential conflict of interest.
Publisher’s note
All claims expressed in this article are solely those of the authors and do not necessarily represent those of their affiliated organizations, or those of the publisher, the editors and the reviewers. Any product that may be evaluated in this article, or claim that may be made by its manufacturer, is not guaranteed or endorsed by the publisher.
References
Barbier, E. (2011). The policy challenges for green economy and sustainable economic development. Nat. Resour. Forum 35, 233–245. doi:10.1111/j.1477-8947.2011.01397.x
Bloom, D. E., Canning, D., and Gunther, F. (2008). Urbanization and the wealth of nations. Science, 772–775. doi:10.1126/science.1153057
Brown, L. (2012). World on the edge: How to prevent environmental and economic collapse. London,United Kingdom: Routledge.
Carraro, C., Favero, A., and Massetti, E. (2012). Investments and public finance in a green, low carbon, economy. Energy Econ. 34, S15–S28. S15–S28. doi:10.1016/j.eneco.2012.08.036
Chen, M., Liu, W., and Tao, X. (2013). Evolution and assessment on China's urbanization 1960–2010: Under-urbanization or over-urbanization? Habitat Int. 38, 25–33. doi:10.1016/j.habitatint.2012.09.007
Chen, S., Zhang, Y., and Chen, X. (2017). Technology choice, upgrading of industrial structure and economic growth. Econ. Surv. 5, 87–92.
Deng, Y. (2016). The analysis of relationship between carbon dioxide emission and GDP (D). Beijing, China: Beijing Institute of Technology.
Ding, J., Liu, B., and Shao, X. (2022). Spatial effects of industrial synergistic agglomeration and regional green development efficiency: Evidence from China. Amsterdam, Netherlands: Energy Economics, 106156.
Du Pisani, J. A. (2006). Sustainable development–historical roots of the concept. Environ. Sci. 3 (2), 83–96. doi:10.1080/15693430600688831
Dutt, A. K., and Jaime, R. (2008). International handbook of development economics. Vilnius, Lithuania: Edward Elgar Publishing.
Fang, G., Wang, Q., and Tian, L. (2020). Green development of Yangtze River Delta in China under population-resources-environment-development-satisfaction perspective. Sci. Total Environ. 727, 138710. doi:10.1016/j.scitotenv.2020.138710
Feng, S., and Xu, L. D. (1999). Decision support for fuzzy comprehensive evaluation of urban development. Fuzzy Sets Syst. 105, 1–12. doi:10.1016/s0165-0114(97)00229-7
Feng, Z., and Chen, W. (2018). Environmental regulation, green innovation, and industrial green development: An empirical analysis based on the spatial Durbin model. Sustainability 10 (1), 223. doi:10.3390/su10010223
Godlewska, J., and Sidorczuk-Pietraszko, E. (2019). Taxonomic assessment of transition to the green economy in polish regions. Sustainability 25 (18), 5098. doi:10.3390/su11185098
Gu, C., Hu, L., and Cook, I. G. (2017). China’s urbanization in 1949–2015: Processes and driving forces. Chin. Geogr. Sci. 27 (6), 847–859. doi:10.1007/s11769-017-0911-9
Guo, Y., Tong, L., and Mei, L. (2020). The effect of industrial agglomeration on green development efficiency in Northeast China since the revitalization. J. Clean. Prod. 258, 120584. doi:10.1016/j.jclepro.2020.120584
Han, Y., Huang, L., and Wang, X. (2017). Do industrial policies promote industrial structure upgrading? Theory and evidence from China's development-oriented local government. Econ. Res. J., 35–50.
Hao, F., Xie, Y., and Liu, X. (2020). The impact of green credit guidelines on the technological innovation of heavily polluting enterprises: A quasi-natural experiment from China. New York, United States: Mathematical Problems in Engineering.
Henderson, V. (2003). The urbanization process and economic growth: The so-what question. J. Econ. growth 81, 47–71. doi:10.1023/a:1022860800744
Hong, Y., Liu, W., Gao, P., Jin, B., Yan, K., Gao, S., et al. (2018). The conversation in writing on “xi jinping’s economic thought on socialism with Chinese characteristics for a new era. Beijing, China: Social Sciences in China, 4. 73+204-205.
Hu, S., Zeng, G., Cao, X., Yuan, H., and Chen, B. (2021). Does technological innovation promote green development? A case study of the Yangtze River Economic belt in China. Int. J. Environ. Res. Public Health 18 (11), 6111. doi:10.3390/ijerph18116111
Huang, L., Wang, L., Liu, Z., and Li, Y. (2021). Evolutionary game analysis of green industry development in the age of sharing economy. Appl. Econ. 53 (27), 3065–3079. doi:10.1080/00036846.2021.1874609
Jácome Polit, D., Rodriguez, A., Santandreu, A., Paredes, D., and Alvaro, N. P. (2022). Agro-ecological urban agriculture and food resilience: The case of quito, Ecuador. Front. Sustain. Food Syst. 404. doi:10.3389/fsufs.2022.550636
Jin, B., and Li, G. (2013). Green economic growth from a developmental perspective. China Finance Econ. Rev. 1 (1), 4–7. doi:10.1186/2196-5633-1-4
Karimian Shamsabadi, M., Yeganeh, M., and Pourmahabadian, E. (2022). Urban buildings configuration and pollutant dispersion of PM 2.5 particulate. Front. Sustain. Food Syst. 339.
Kraftova, I., Zdrazil, P., and Mateja, Z. (2016). Reflection of industrial structure in innovative capability. Eng. Econ. 27, 304–315. doi:10.5755/j01.ee.27.3.13634
Lam, M. L. L. (2011). Challenges of sustainable environmental programs of foreign multinational enterprises in China. Manag. Res. Rev. 34, 1153–1168. doi:10.1108/01409171111178729
Lei, W., Xie, Y., Hafeez, M., and Ullah, S. (2022). Assessing the dynamic linkage between energy efficiency, renewable energy consumption, and CO2 emissions in China. Environ. Sci. Pollut. Res. 29 (13), 19540–19552. doi:10.1007/s11356-021-17145-7
Li, D., Shangguan, Z., Huang, M., Zhang, X., and Tang, L. (2022). Impacts of urban development on regional green development efficiency—a case of the Yangtze River Delta in China. Energies 15 (13), 4785. doi:10.3390/en15134785
Li, F., Liu, S., and Cheng, Y. (2017). Effect of value-added in China's exports on regional industrial structure advancement. Sci. Geogr. Sin., 40–48.
Li, G., Zhou, Y., Liu, F., and Wang, T. (2021). Regional differences of manufacturing green development efficiency considering undesirable outputs in the yangtze river economic belt based on super-SBM and WSR system methodology. Front. Environ. Sci., 8, 631911, doi:10.3389/fenvs.2020.631911
Li J, J., Liang, M., Cheng, W., and Wang, S. (2021). Life cycle cost of conventional, battery electric, and fuel cell electric vehicles considering traffic and environmental policies in China. Int. J. Hydrogen Energy 46 (14), 9553–9566. doi:10.1016/j.ijhydene.2020.12.100
Li-ming, B., Wei, W., Yin, L., Zhao, L., and Xia, J. (2022). Evolution characteristics and influencing factors of water eco-space pattern in the Yangtze River Economic belt from 2000 to 2020. Basel, Switzerland: China Environmental Science, 1–15.
Liang, G., Yu, D., and Ke, L. (2021). An empirical study on dynamic evolution of industrial structure and green economic growth—based on data from China’s underdeveloped areas. Sustainability 13 (15), 8154. doi:10.3390/su13158154
Liu, D., Xie, Y., Hafeez, M., and Usman, A. (2022). The trade-off between economic performance and environmental quality: Does financial inclusion matter for emerging asian economies? Environ. Sci. Pollut. Res. 29 (20), 29746–29755. doi:10.1007/s11356-021-17755-1
Liu, Y., Wang, Q., Jiang, Y., Xin, C., et al. (2022). Research on the estimation of port emission and sustainable development from the perspective of big data(C)//2nd International Conference on Applied Mathematics, Modelling, and Intelligent Computing (CAMMIC 2022). SPIE 12259, 1010–1015.
Luo, K., Liu, Y., Chen, P. F., and Zeng, M. (2022). Assessing the impact of digital economy on green development efficiency in the Yangtze River Economic Belt. Energy Econ. 12, 106127. doi:10.1016/j.eneco.2022.106127
Ma, X., Liu, Y., Wei, X., Li, Y., Zheng, M., Li, Y., et al. (2017). Measurement and decomposition of energy efficiency of Northeast China-based on super efficiency DEA model and Malmquist index. Environ. Sci. Pollut. Res. 24, 19859–19873. doi:10.1007/s11356-017-9441-3
Neira, M. P. (2020). Energy transition for better air quality: A public health issue. Field actions science reports. J. field actions, Special Issue 21, 14–17.
Peneder, M. (2002). Industrial structure and aggregate growth. Struct. Change Econ. Dyn. 14, 427–448. doi:10.1016/s0954-349x(02)00052-8
Reddy, K., Sasidharan, S., and Doytch, N. (2022). Outward foreign direct investment and domestic innovation efforts: Evidence from India. J. Econ. Bus. 122, 106084. doi:10.1016/j.jeconbus.2022.106084
Saglam, U. (2018). A two-stage performance assessment of utility-scale wind farms in Texas using data envelopment analysis and Tobit models. J. Clean. Prod. 201, 580–598. doi:10.1016/j.jclepro.2018.08.034
Sassen, S. (2010). Cities are at the center of our environmental future. Rev. Ing. 31, 72–83. doi:10.16924/revinge.31.8
Seiford, L. M., and Zhu, J. (2002). Modeling undesirable factors in efficiency evaluation. Eur. J. operational Res. 142 (1), 16–20. doi:10.1016/s0377-2217(01)00293-4
Shan, S., and Bi, X. (2012). Low carbon development of China’s Yangtze River Delta region. Problemy Ekorozwoju–Problems Sustain. Dev. 7 (2), 33–41.
Shui, H., Jin, X., and Ni, J. (2015). Manufacturing productivity and energy efficiency: A stochastic efficiency frontier analysis: Stochastic efficiency frontier analysis. Int. J. Energy Res. doi:10.1002/er.3368
Su, Y., Xue, H., and Liang, H. (2019). An evaluation model for urban comprehensive carrying capacity: An empirical case from Harbin city. Int. J. Environ. Res. Public Health 16, 367. doi:10.3390/ijerph16030367
Sun, P., Wu, Y., and Bao, S. (2018). Study on the effects of industrial structure change on carbon reduction. Econ. Surv. 35 (2), 93–98.
Tang, L. (2019). Propel the transformation of industrial structure to green development: Type, problems and solutions. Econ. Res. Reference 15, 99–106.
Tone, K. (2001). A slacks-based measure of super-efficiency in data envelopment analysis. Eur. J. Oper. Res. 143 (1), 32–41. doi:10.1016/s0377-2217(01)00324-1
Unep, U. (2011). Towards a green economy: Pathways to sustainable development and poverty eradication. Nairobi, Kenya: UNEP.
Vignola, R., and Oosterveer, P. (2022). Street food environmental sustainability in an urbanizing global south: A social practice perspective. Front. Sustain. Food Syst. 6, 910547.
Wang, F., Zhen, J., and Wang, Z. (2019). Analysis of the influence of urbanization and industrialization level on Air quality: Based on the space-time model of data from 16 cities in hubei province in 2005-2017, resources and environment in the Yangtze basin, 1411–1421.
Wang M, M., Zhao, X., Gong, Q., and Ji, Z. (2019). Measurement of regional green economy sustainable development ability based on entropy weight-topsis-coupling coordination degree—a case study in shandong province, China. Sustainability 11 (1), 280. doi:10.3390/su11010280
Wang, X., and Li, Y. (2020). Research on measurement and improvement path of industrial green development in China: A perspective of environmental welfare efficiency. Environ. Sci. Pollut. Res. 27 (34), 42738–42749. doi:10.1007/s11356-020-09979-4
Wang, Y., and He, L. (2022). Can China’s carbon emissions trading scheme promote balanced green development? Consideration of efficiency and fairness. J. Clean. Prod. 367, 132916. doi:10.1016/j.jclepro.2022.132916
Wang, Y., and Shen, N. (2016). Environmental regulation and environmental productivity: The case of China. Renew. Sustain. Energy Rev. 62, 758–766. doi:10.1016/j.rser.2016.05.048
Wang, Z., Zhang, X., Zhang, C., and Yang, Q. (2022). How regional integration affects urban green development efficiency: Evidence from urban agglomeration in the middle reaches of the Yangtze River. Int. J. Environ. Res. Public Health 19 (13), 7937. doi:10.3390/ijerph19137937
Wells, D. (1993). Green politics and environmental ethics: A defence of human welfare ecology. Aust. J. Political Sci. 28 (3), 515–527. doi:10.1080/00323269308402257
White, S. S., and Ellis, C. (2007). Sustainability, the environment, and new urbanism: An assessment and agenda for research. J. Archit. Plan. Res., 125–142.
Wu, K. (2019). Urban shrinkage in the beijing-tianjin-hebei region and Yangtze River Delta: Pattern, trajectory and factors(M)//Shrinking cities in China. Singapore: Springer, 43–61.
Xiao, Y., Chen, J., Wang, X., and Lu, X. (2022). Regional green development level and its spatial spillover effects: Empirical evidence from Hubei Province, China. Amsterdam, Netherlands: Ecological Indicators, 109312.
Xie, S., Sun, M., and Qin, H. (2022). Research on the space-time difference of green logistics leading the high-quality development of the Yangtze River Economic belt and the construction of leading strategy ——based on the perspective of resilient economy. China Bus. Mark. 36 (09), 17–31.
Yang, T., Zhou, K., and Zhang, C. (2022). Spatiotemporal patterns and influencing factors of green development efficiency in China’s urban agglomerations. Amsterdam, Netherlands: Sustainable Cities and Society, 104069.
Yao, J., Xu, P., and Huang, Z. (2021). Impact of urbanization on ecological efficiency in China: An empirical analysis based on provincial panel data. Ecol. Indic. 129, 107827, doi:10.1016/j.ecolind.2021.107827
Yu, B. (2017). How does industrial restructuring improve regional energy efficiency? An empirical study based on two dimensions of magnitude and quality. J. Finance Econ., 86–97.
Zhang, Y. Y., Sun, M. Y., Yang, R. J., Li, X. H., and Li, M. Y. (2021a). Decoupling water environment pressures from economic growth in the Yangtze River Economic Belt. China Ecol. Indic, 122.
Zeng, T., and Wu, Z. (2020). Research progress and trend analysis of international green development, 5–15. Beijing, China: Environment and Sustainable Development.
Zhang, J., and Wu, F. (2006). China's changing economic governance: Administrative annexation and the reorganization of local governments in the Yangtze River Delta. Reg. Stud. 40 (1), 3–21. doi:10.1080/00343400500449085
Zhang, J., Chang, Y., Zhang, L., and Li, D. (2018). Do technological innovations promote urban green development? -- a spatial econometric analysis of 105 cities in China. J. Clean. Prod. 182, 395–403. doi:10.1016/j.jclepro.2018.02.067
Zhang, J., Wu, G., and Zhang, J. (2004). Estimation of Chinese inter-provincial material capital stock: 1952-2000. Econ. Res. J. 10, 35–44.
Zhang, R., Ma, Y., and Ren, J. (2022). Green development performance evaluation based on dual perspectives of level and efficiency: A case study of the Yangtze River Economic belt, China. Int. J. Environ. Res. Public Health 19 (15), 9306. doi:10.3390/ijerph19159306
Zhang, S., Li, H., Zhang, Q., Tian, X., and Shi, F. (2019). Uncovering the impacts of industrial transformation on low-carbon development in the Yangtze River Delta. Resour. Conservation Recycl. 150, 104442. doi:10.1016/j.resconrec.2019.104442
Zhang, Y., Liu, X., and Ding, M. (2021b). Energy-consumption-based comprehensive evaluation of urban green development-cases of 27 cities in the integrated central area of the Yangtze River Delta, China. IEEE Access 9, 79105–79117. doi:10.1109/access.2021.3083706
Zhao, K., Zhang, R., Liu, H., Wang, G., and Sun, X. (2021). Resource endowment, industrial structure, and green development of the Yellow River Basin. Sustainability 13 (8), 4530. doi:10.3390/su13084530
Appendix
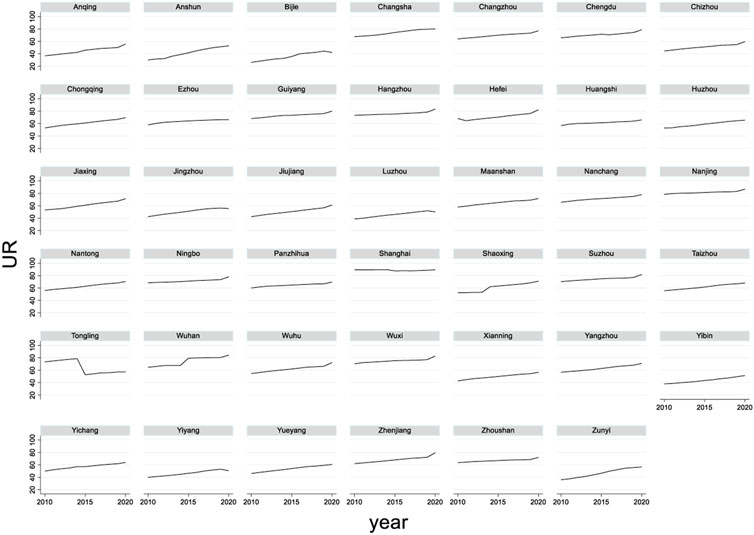
FIGURE A1. Urbanization rate.
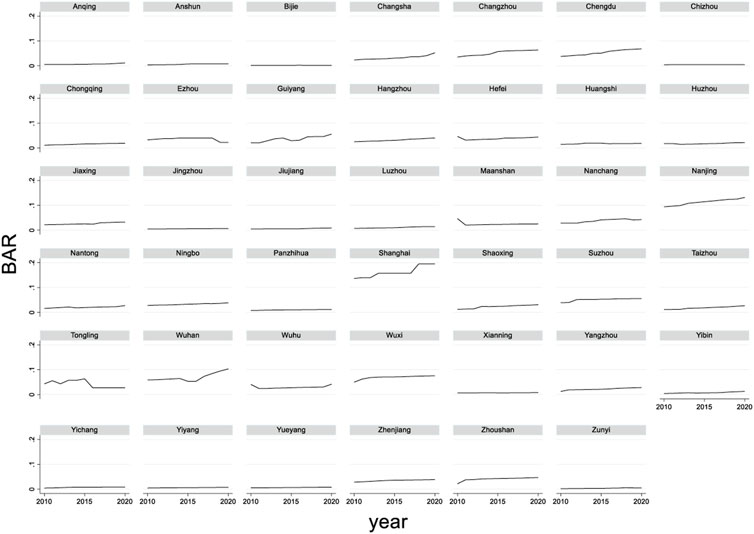
FIGURE A2. Urban built-up area rate.
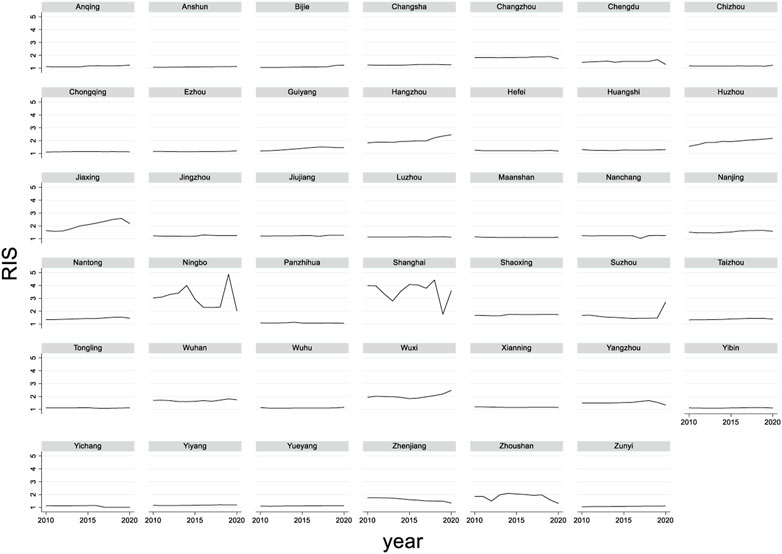
FIGURE A3. Rationalization of industrial structure.
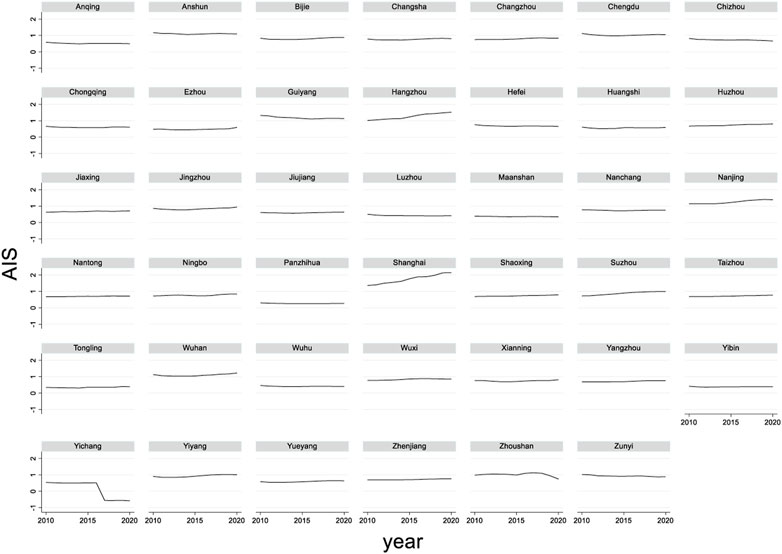
FIGURE A4. Advancement of industrial structure.
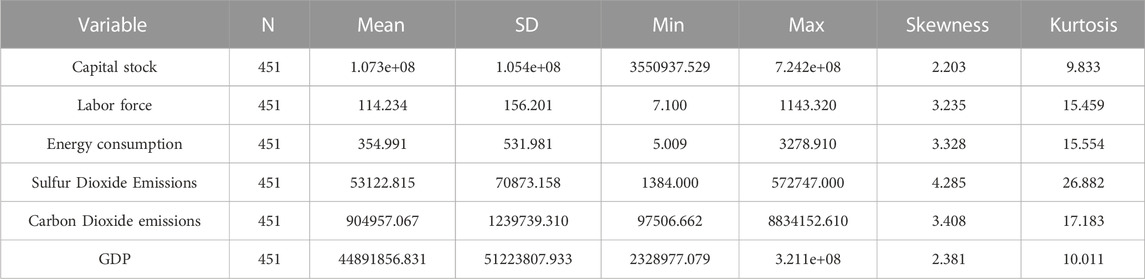
TABLE A1. Descriptive statistics of variables.
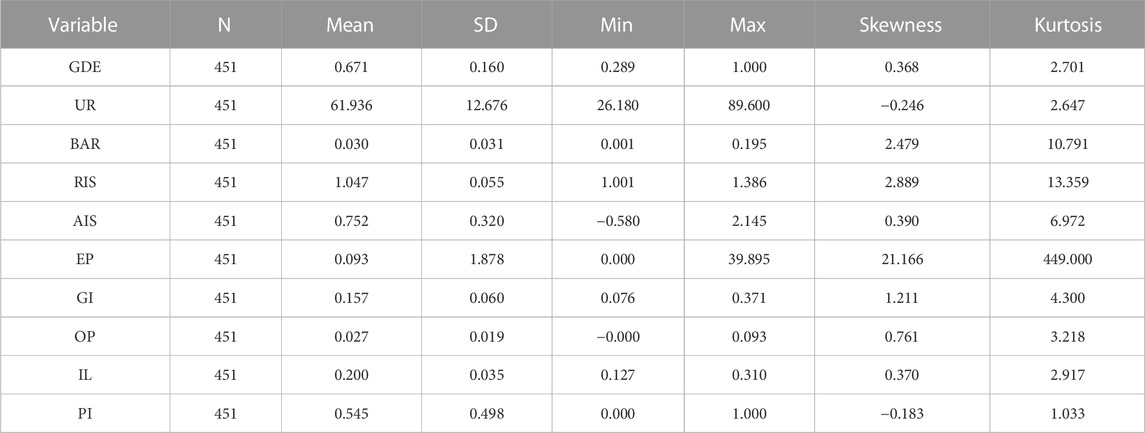
TABLE A2. Descriptive statistics of variables.
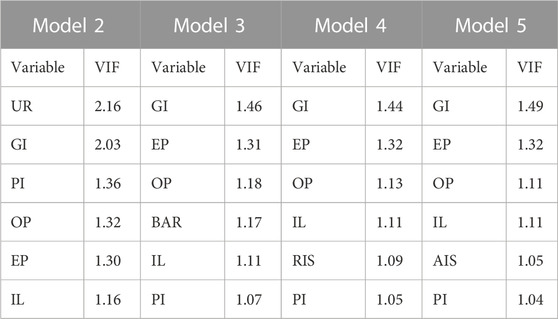
TABLE A3. VIF test results.
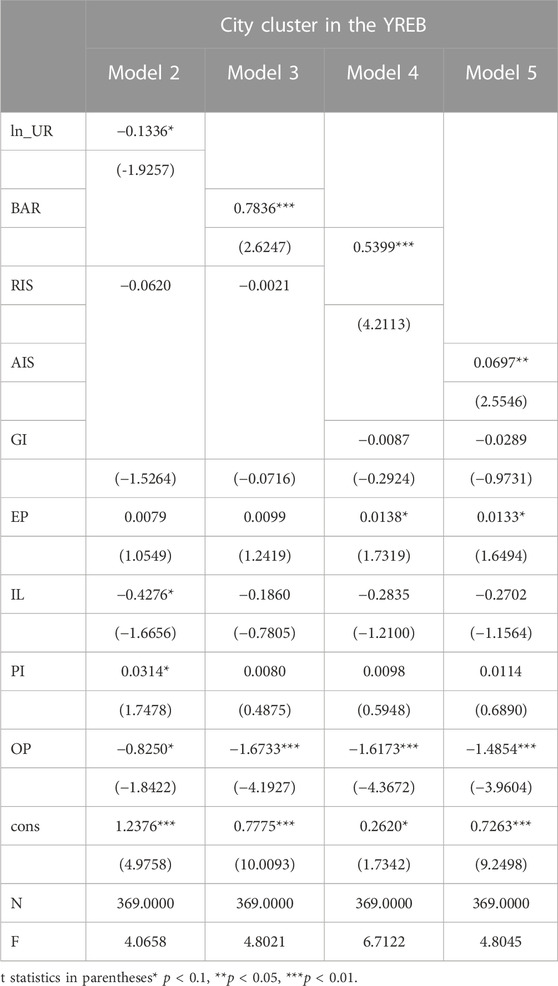
TABLE A4. Robustness test results.
Keywords: urban development, green development efficiency, SBM model, tobit model, China
Citation: Huang J, Shangguan Z, Gui T and Liu J (2023) How urban development affects green development efficiency in China: Taking the city cluster of Yangtze river economic belt as an example. Front. Environ. Sci. 11:1169226. doi: 10.3389/fenvs.2023.1169226
Received: 19 February 2023; Accepted: 20 March 2023;
Published: 30 March 2023.
Edited by:
Yuantao Xie, University of International Business and Economics, ChinaCopyright © 2023 Huang, Shangguan, Gui and Liu. This is an open-access article distributed under the terms of the Creative Commons Attribution License (CC BY). The use, distribution or reproduction in other forums is permitted, provided the original author(s) and the copyright owner(s) are credited and that the original publication in this journal is cited, in accordance with accepted academic practice. No use, distribution or reproduction is permitted which does not comply with these terms.
*Correspondence: Ziheng Shangguan, c2d6aEBodWJ1LmVkdS5jbg==