 Diana Francis
 Michael Weston1,3
 Ricardo Fonseca
 Aisha Alsuwaidi
- 1Environmental and Geophysical Sciences (ENGEOS) Lab, Khalifa University, Abu Dhabi, United Arab Emirates
- 2Earth Sciences Department, Khalifa University, Abu Dhabi, United Arab Emirates
- 3Dubai Electricity and Water Authority (DEWA), Dubai, United Arab Emirates
- 4Department of Civil, Environmental and Ocean Engineering (CEOE), Stevens Institute of Technology, Hoboken, NJ, United States
Methane (CH4) is a potent greenhouse gas with an important contribution to global warming. While national and international efforts have been put in place to reduce methane emissions, little is known about its variability, especially in hotspot regions where natural and anthropogenic emissions are compounded. In this study, the current state of CH4 concentrations and their trends over the United Arab Emirates (UAE) and surrounding region are investigated with satellite and reanalysis data. CH4 concentrations have increased over the last 5 years, with a trend in the satellite-derived column values (XCH4) of about 9 ppb/year. A clear annual cycle is detected in XCH4, with an amplitude of up to 75 ppb and peak values in the warmer months. The largest concentrations are found in coastal sites, where sabkhas and landfills are present, and along the Al Hajar mountains, where agricultural activities and microhabitats that may host CH4-producing microbes occur and where advection by the background flow is likely an important contributor. The reanalysis data shows a good agreement with the satellite-derived estimates in terms of the spatial pattern, but the magnitudes are smaller by up to 50 ppb, due to deficiencies in the data assimilated. Surface CH4 concentrations in the reanalysis data account for more than 50% of the corresponding XCH4 values, and exhibit a seasonal cycle with the opposite phase due to uncertainties in the emissions inventory. Our findings provide an overview of the state of CH4 concentration in the UAE and surrounding region, and may aid local authorities to propose the appropriate emission reduction strategies in order to meet the proposed net-zero greenhouse gas emission target by 2050. This study highlights the need for the establishment in the Arabian Peninsula region of a ground-based observational network for greenhouse gas concentrations which is still lacking to date.
Highlights
➢ Variability of methane concentration in the eastern Arabian Peninsula over 2018–2021 is analyzed with satellite-derived and reanalysis data.
➢ Satellite data shows a trend of 9 ppb/year, 50% larger than that estimated elsewhere, consistent with the region being a methane hotspot.
➢ Largest column methane concentrations in coastal sites, due to the presence of sabkhas and landfills, and at the Al Hajar mountains.
1 Introduction
Methane (CH4) is a potent greenhouse gas, absorbing roughly 80 times more energy over a 20-year period compared to the same mass of carbon dioxide (CO2) (Forster et al., 2021). It has an atmospheric residence time of about 10 years (Prather et al., 2012) and hence has an important short-term effect on the atmospheric warming potential in comparison to CO2, which is longer-lived but has a lower radiative efficiency (i.e., reduced ability to absorb energy). The global mean methane concentration has increased since 2007 (Rigby et al., 2008; Zou et al., 2019), as evident in both surface observations (Houweling et al., 2014; Dalsoren et al., 2016) and remote sensing data collected by the instruments onboard the Greenhouse Gases Observing Satellite (GOSAT; Butz et al., 2010; Yokota et al., 2009; Zhang et al., 2021) and the Environmental Satellite (EnviSat; Houweling et al., 2014; Schneising et al., 2009). Global mean concentrations are currently around 1900 parts per billion (ppb; Dlugokencky, 2022a), and have increased by as much as 13 ppb/year in the past 15 years (Feng et al., 2022). Currently, methane is estimated to contribute to an increase of 0.5°C in the global mean temperature (IPCC, 2021), with a 30% reduction in global CH4 emissions predicted to lower the expected rise in global mean temperature by 2050 by around 0.12°C or a third of the expected rise in the global mean temperature (Meinshausen et al., 2022) Given its short residence time, lower CH4 levels will have a relatively rapid impact on rising temperatures, in particular in comparison to CO2 and nitrogen oxides (NOX) that have residence times of about 200 and 100 years, respectively (IPCC, 2021).
The mechanisms driving the increase in atmospheric methane concentration are a topic for debate (c.f. Jackson et al., 2020; Lan et al., 2021; Lauvaux et al., 2022; Turner et al., 2019). There are both natural (e.g., wetlands and sabkhas) and anthropogenic (e.g., agriculture, industry and energy activities) sources of CH4 (Schaefer, 2019). Microbes in wetlands release methane as a natural process. The emission rate is linked to their respiration rate, which increases as the climate warms and atmospheric CO2 becomes more abundant (Spahni et al., 2011; Nisbet et al., 2016; Nisbet et al., 2019; Lan et al., 2021; Nisbet et al., 2022). Sabkhas, which are coastal, supratidal (i.e., seawater only penetrates during storms with high tides) mudflats or sandflats that form in semi-arid or arid regions as a result of strong surface evaporation (Bebout et al., 2004; Kelley et al., 2012; Tazaz et al., 2013; McKay et al., 2016), are important methane emitters. The hypersaline layer sits on top of the freshwater layers below, with the salt crust shielding the microbes from the extreme conditions outside, allowing for the emission of CH4 with instantaneous concentrations as high as 3,400 ppm (McKay et al., 2016).
Agriculture, in particular domestic livestock, also contributes to increases in CH4 emissions especially in the tropics where forests are being rapidly replaced with rangelands (Nisbet et al., 2016). While some analysts argue that this is the major source of increased emissions since 2007 (Nisbet et al., 2016; Nisbet et al., 2019; Lan et al., 2021; Nisbet et al., 2022), evidence also suggests that the increase in global atmospheric methane concentration is linked to emissions from the oil and gas industry, as methane is the primary component of natural gas (Worden et al., 2017; Howarth, 2019; McIntosh et al., 2019; de Gouw et al., 2020; Hmiel et al., 2020; Saunois et al., 2020; Scarpelli et al., 2020). Emissions from oil and gas facilities are often unplanned and related to leaks during daily operations or sporadic accidental releases (Alvarez et al., 2018; Pignal et al., 2020). These unplanned emissions, however, can be abated in the short-term, slowing the increase in atmospheric methane concentrations and atmospheric warming. Landfills, which comprise solid waste, emit CH4 through anaerobic decay (i.e., in an oxygen-deprived environment) of organic material (Maasakkers et al., 2022). In the Middle East landfills are the main way of disposing municipal solid waste, and with an increasing population, they play an important role in CH4 emissions in the near future (Elmi et al., 2021). In Bahrain and Saudi Arabia there has been an increase not just in municipal landfill generation, but also in the amount of CH4 emitted by these landfills (Ouda et al., 2016; Coskuner et al., 2020), with the emissions continuing for decades after a landfill is closed (Al-Yaqout and Hamoda, 2020). Although CH4 has a lower dispersion rate than CO2, model simulations in Kuwait City suggest it can reach distances of up to 25 km from the landfill site, depending on the atmospheric conditions (Elmi et al., 2021). The study of Maasakkers et al. (2022), which makes use of satellite data and considers landfills in Argentina, Pakistan and India, reveals that CH4 can be detected even further away from the source, therefore presenting a health risk to individuals living in the area. The role of advection on the CH4 concentration has been highlighted by Metya et al. (2022), which reported on in-situ measurements collected at an urban site in western India from March 2018 to December 2020. The authors found a minimum in the CH4 concentration in the summer season, when clean air originating from the Southern Hemisphere was transported to the site, while continental air masses in the post-monsoon and winter seasons led to higher CH4 values, as also noted by Sreenivas et al. (2016). In general, high CH4 events co-occurred with air coming from the Indian landmass, while low CH4 values were associated with an air mass coming from southern India and the Arabian Sea.
The aforementioned methane sources (namely, landfills, wetlands, sabkhas and agricultural and energy activities) are spatially confined. Satellite detection has therefore been hindered by the small-scale nature of CH4 emissions, as plumes can only be identified if much larger than the background values. However, the recent deployment of higher spatial and temporal resolution satellite products is making it possible to detect them (Lorente et al., 2021). Satellites such as GOSAT, EnviSat and the Sentinel-5 Precursor (Sentinel-5P; Landgraf et al., 2022) carry instruments that allow for a global monitoring of CH4 emissions. Their products, however, have different spatial and temporal resolutions: GOSAT, launched on 23 January 2009 and still operating, methane data are available at ∼10.5 km resolution with a global coverage achieved in 3 days; EnviSat data has a horizontal and vertical resolution of 30 km and 3 km, respectively, with the satellite orbiting the Earth in about 100 min and with measurements available from July 2002 to April 2012; CH4 data collected by the Sentinel-5P are available at least on a 7 km × 7 km grid and on a daily basis since 01 July 2021. Landfill emissions have to be considered as well, and statistical techniques have been proposed to quantify them (Ishigaki et al., 2005; Kormi et al., 2017). The same is true for emissions from wetlands and sabkhas (Fiedler and Sommer, 2000; Duan et al., 2005; Lovelock and Duarte, 2019).
Despite the studies listed above, a regional assessment of the CH4 concentration in the Arabian Peninsula is yet to be conducted. What is more, over 100 countries, including the United Arab Emirates (UAE), have signed a pledge to reduce global methane emissions by at least 30% from 2020 levels by 2030 at the United Nations Climate Change Conference-26 (COP26) in 2021 (GMP, 2022), with the UAE further announcing a drive to achieve net-zero greenhouse gas emissions by 2050 (Ibrahim et al., 2022). As a result, there is a need to accurately assess and monitor the CH4 concentration as a first step to develop and subsequently implement emission-reduction strategies (Ganesan et al., 2019). This is crucial for the Arabian Peninsula, which is a methane hotspot in global maps (Stavert et al., 2021). The objective of this study is to perform an analysis of CH4 concentrations over the UAE and surrounding region based on global datasets of methane concentration, which can later be used to develop mitigation strategies.
The paper is structured as follows: the methods and datasets used are described in Section 2. A brief summary of the methane sources in the UAE is provided in Section 3, while a discussion of the annual variability in CH4 concentration is given in Section 4. In Section 5 the focus is on its trends over 2004–2021, while an overview of the seasonality of the methane concentration is presented in Section 6. Closing remarks and conclusions are outlined in Section 7.
2 Datasets and methodology
2.1 Observational datasets
The TROPOspheric Monitoring Instrument (TROPOMI; Veefkind et al., 2012) on board the Sentinel-5P satellite is used to characterize total column methane concentration (XCH4; X refers to total column). TROPOMI has a wide swath of 2,600 km and a horizontal pixel resolution of 7 × 5.5 km. The ascending limb of the orbit crosses the equator at 13h30 local time (LT) every day, meaning that detection at the center of the swath is 6 min later. Over the study region, the detection timing is a function of the swath position (instrument viewing angle), which can be over ±1 h with respect to 13 h 36 LT (i.e., as early as 12 LT and as late as 15 LT).
Methane detection is based on the absorption of solar light and is measured at different wavelengths including the short-wave infrared (SWIR) channel at a wavelength of 2.3 µm (Hu et al., 2018) considered here. The principle of methane detection is based on the difference in absorption and reflectance of the atmosphere in the SWIR channel. The RemoTec full physics algorithm is used to detect methane from TROPOMI measurements (Hasekamp et al., 2019; Lorente et al., 2021). The algorithm takes into account measurement of reflectance in the SWIR and concurrent atmospheric scattering properties to calculate the methane retrieval. The albedo of the land surface, which is derived from Tilstra et al. (2017), is required to remove this component from the reflected measurements. Cloud identification is done using the Visible and Infrared Imager Radiometer Suite (VIIRS; Wolfe et al., 2013) cloud product at 750 m spatial resolution (Veefkind et al., 2012), as cloudy pixels are not retrieved in the standard operational processor. VIIRS and Sentinel-5P were designed to complement each other and are in the same orbit, with VIIRS preceding Sentinel-5P by about 5 min (Apituley et al., 2021).
Level-2 data, available at the Copernicus Open Access Hub (COAH, 2022), was downloaded over the period 01 May 2018 to 21 September 2021 over the UAE and surrounding region (21.76–26.25 N; 49.66–57.11 E). This data gives the total column mixing concentration, which is reported as XCH4 ppb. The bias-corrected methane mixing ratio was used in the analysis as recommended in the user guide (Apituley et al., 2021). This data set has an average bias of −3.4 ppb over the period December 2018—December 2019, which is less than 1% of its absolute magnitude, when evaluated against observations from the Total Carbon Column Observing Network (TCCON; Wunch et al., 2011) network (Apituley et al., 2021). The TROPOMI data was re-gridded from its coarser 7 × 5.5 km resolution onto a regular 1 × 1 km grid to allow for easier processing of annual and seasonal mean methane concentrations. This is required as TROPOMI data is not on a regular grid, in fact the pixel size changes in both the across-track and along-track directions, and hence pixels from overlapping overpasses do not align. To re-grid the data, thiessen polygons were created around each pixel. A thiessen polygon uses the halfway point between two pixels as the border of a grid cell. The value of each pixel is assigned to the polygon that it is located within. These polygons are then converted to a 1 × 1 km regular grid, allowing for co-located pixels from multiple overpasses. There is no specific reason for selecting a resolution of 1 km, other than that it is practically feasible and some information is lost when averaging to a coarser resolution. The mean maps are then constructed from the 1 km re-gridded overpasses. TROPOMI’s high spatial resolution means it can be used to detect leakages e.g., from coal mining activities (Peng et al., 2023).
It is important to note that, despite the processing described above, there could still be biases in the TROPOMI estimates in particular in areas of complex albedo patterns and topography that are not accounted for. However, the goal of this work is not to validate the TROPOMI estimates over the UAE but to use them to gain insight into the spatial and temporal distribution and variability of the CH4 concentration in the country, acknowledging they likely still have biases. In addition, TROPOMI’s low temporal frequency (at best available once daily) precludes it from being used to isolate the contribution of the sources from the background flow, with the focus being on the total concentrations.
In addition to satellite-derived observations, globally-averaged, monthly-mean atmospheric CH4 concentrations averaged over marine sites maintained by the National Oceanic and Atmospheric Administration (NOAA; Dlugokencky et al., 2022a) are used for comparison with the UAE-averaged values. These global monthly means are generated following Masarie and Tans (1995) from the measurements collected at the 36 fixed sites from 90 S to 82 N given in Supplementary Figure S1, and ship observations in the Pacific Ocean between 45 N and 35 S (Dlugokencky et al., 1994). Such a comparison will highlight how different the magnitudes and trends in a methane hotspot region are with respect to those estimated at mostly remote and largely undisturbed areas.
Anthropogenic CH4 emissions for the UAE are extracted from the Emissions Database for Global Atmospheric Research (EDGAR) version 7.0 (EDGARv7; European Commission, 2023; Crippa et al., 2021; Crippa et al., 2022). These include the total emissions as well as the emissions from different sources ranging from the energy sector to the transport sector and waste treatment, from which the respective relative contribution can be estimated.
2.2 Reanalysis data
The Copernicus Atmosphere Monitoring Service (CAMS; Inness et al., 2019) is an integrated model forecast system which assimilates satellite data and emissions inventories to provide a coupled model simulation of atmospheric composition. For the analysis in this study, the CAMS global greenhouse gas reanalysis (EGG4; ECMWF, 2022) was used. Anthropogenic emissions of methane are sourced from EDGAR v4.2FT 2010 (Janseens-Maenhout et al., 2014; Muntean et al., 2018; European Commission, 2022), while natural emissions from wetlands are sourced from the Lund-Potsdam-Jena dynamic global vegetation model with Wetland Hydrology and Methane (LPJ-WHyMe; Spahni et al., 2011). The LPJ-WHyMe model has a seasonal cycle in emissions, with peak values occurring during the Northern-Hemisphere summer months of July and August (Spahni et al., 2011). Satellite data of total column mixing ratio is sourced from the Infrared Atmospheric Sounding Interferometer (IASI; Blumstein et al., 2004; de Wachter et al., 2017; Razavi et al., 2009) instrument on board Metop-B from 2011 until 2020 in the CAMS EGG4 dataset (ECMWF, 2022). It is worth mentioning that Metop-B has an equator crossing time of 09 h 30 LT on the descending limb of the orbit.
CAMS EGG4 data has a spatial resolution of 0.75⁰ × 0.75⁰ and a temporal resolution of 3 h starting at 00 UTC. The total column mixing ratio data was downloaded for the years 2018–2020 from the available years of 2003–2020. The time stamp 09 UTC (13 LT) was used in the analysis as it is the closest time to the TROPOMI overpass. The coarse CAMS EGG4 data was bilinearly interpolated to the same resolution as the TROPOMI data (1 km × 1 km) for the spatial plots presented in this manuscript. It is important to note that the TROPOMI data used in this study were not assimilated in CAMS. The bilinear interpolation works as follows. Let’s assume we know the methane concentration at four points (x1,y1), (x1,y2), (x2,y1), and (x2,y2) with x2 > x1 and y2 > y1 and would like to know the concentration at (x,y), denoted as
with
As CH4 emissions are linked to changes in meteorological fields such as the temperature, relative humidity and precipitation (e.g., Javadinejad et al., 2019; Peacock et al., 2021), ERA-5 reanalysis data (Hersbach et al., 2020) are analyzed over the eastern Arabian Peninsula. ERA-5 is available every hour on a 0.25° × 0.25° grid (∼27 km) from 1950 to present. It is selected as its spatial and temporal resolutions are higher than those of other reanalysis datasets (e.g., Francis et al., 2021), and is found to compare well with in-situ observations in the region (e.g., Al Senafi et al., 2019; Arshad et al., 2021; Fonseca et al., 2022). In order to explore the effects of advection on the methane concentration, the XCH4 fluxes, obtained by multiplying TROPOMI’s XCH4 by ERA-5’s 10-m wind vectors following Li et al. (2023), are estimated for each season. First, and for each TROPOMI overpass, the median of the XCH4 values in the reanalysis 0.25° × 0.25° grid is computed and subsequently multiplied by the 10-m wind vector. The process is subsequently repeated for all overpasses in a given season and the seasonal average is extracted. The ERA-5 winds used depend on the timing of the overpass: if it took place before minute 15 of hour X, the winds at hour X are used; if it occurred after minute 45, the winds at hour X + 1 are considered, whereas in between the average winds at hours X and X + 1 are employed.
3 Methane emissions in the UAE
The UAE is located in the eastern Arabian Peninsula, bounded by Saudi Arabia to the south and southwest, Oman to the southeast, the Arabian Gulf along its northwestern coastline and the Sea of Oman along its eastern coastline (Figure 1A). The country is relatively flat except for the Al Hajar mountains located in the northeastern part, with the highest peak (Jebel Jais) reaching around 1,700 m above ground level. The UAE features an arid climate, with air temperatures generally in the range 15-20°C in winter to 30–40°C in the summer (Nelli et al., 2020; Nelli et al., 2022), Figure 2A, and annual precipitation amounts ranging from around 30 mm in the inland (Rub’ Al Khali or the Empty Quarter) desert to 120 mm at the Al Hajar mountains (Temimi et al., 2020), Figure 2B The vast majority of the precipitation falls in the cold months from December to March in association with mid-latitude weather disturbances (Wehbe et al., 2017; Wehbe et al. 2018; Wehbe et al. 2020). Summertime rainfall, although less common, does occur, and is more frequent on the eastern side along the Al Hajar mountains, Figure 2B Here, convection develops due to the interaction of the sea-breeze and topography-driven flows with the cyclonic circulation associated with the thermal/heat low, occasionally aided by the presence of a mid-level trough (Branch et al., 2020; Francis et al., 2021; Fonseca et al., 2022). The prevailing wind flow is from the northwest, with typical speeds of 1–3 m s−1 (Naizghi and Ouarda, 2017; Nelli et al., 2022), Figure 2A, and with a marked sea-breeze circulation on a daily scale (Eager et al., 2008; Weston et al., 2021). The moist air arriving in the UAE comes primarily from the Arabian Gulf, Figure 2A However, and in particular in the colder months, the Red Sea, Arabian Sea and Mediterranean Sea are also important moisture sources for the eastern Arabian Peninsula (Massoud et al., 2020; Nelli et al., 2021; Fonseca et al., 2023).
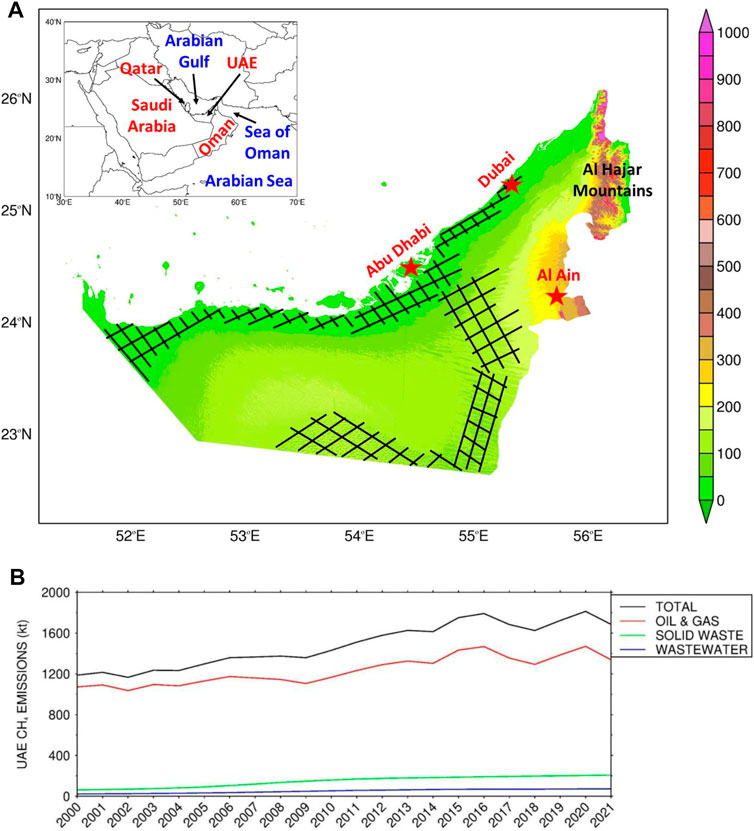
FIGURE 1. (A) Topography (m) of the UAE at 30 m resolution from a Digital Elevation Model (Hulley et al., 2015). The hatched regions denote the approximate location of the sabkhas, following Qureshi and Ismail (2017). The three major cities, namely, Abu Dhabi, Dubai and Al Ain, are highlighted with a star, and the Al Hajar mountains are labelled. The inset shows the Middle East and highlights the location of the UAE and surrounding countries and water bodies. (B) UAE CH4 emissions (kt) as given by the EDGARv7 dataset. The black line gives the total annual emissions for 2000–2021, with the colour lines showing the three largest contributors: oil and natural gas in red; solid waste disposal in green; wastewater treatment and discharge in blue.
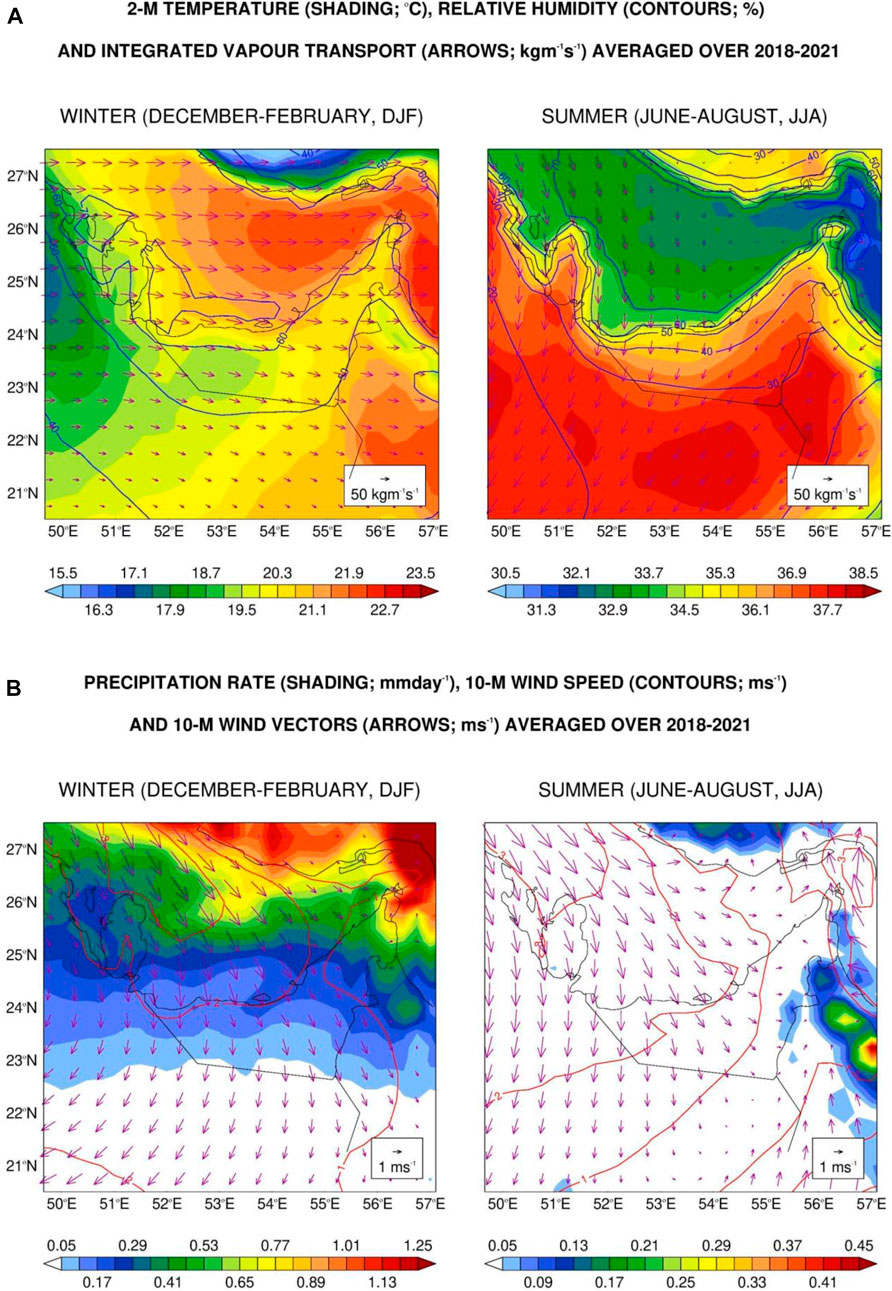
FIGURE 2. (A) Winter (December to February, DJF; left) and summer (June to August, JJA, right) air temperature (ºC; shading), relative humidity (blue solid contours, every 10%) and integrated vapour transport (kg m−1 s−1; vectors) averaged over 2018–2021 from ERA-5. (B) is as (A) but with the shading giving the seasonal-mean precipitation rate (mm day−1), the red solid contours giving the 10-m wind speed (m s−1) and the arrows giving the 10-m horizontal wind vectors (m s−1).
Figure 1B shows the total CH4 emissions, and its three largest contributors, in the UAE for 2000–2021 as given by the EDGARv7 dataset (European Commission, 2023). There has been an increase from ∼1,200 kt in 2000 to ∼1800 kt in 2016, with the values remaining roughly constant in the last 6 years, hovering around 1,600–1800 kt. More than 95% of the emissions come from the oil and natural gas sector, which by itself accounts for 80%–90%, solid waste disposal and wastewater treatment and discharge. At an urban site in western India, Metya et al. (2022) found that the natural gas and waste sectors were the major methane sources in the region. Regarding the emissions from the energy sector, the Abu Dhabi National Oil Company (ADNOC) in the UAE has reduced natural gas flaring, a major source of NOX and CH4 emissions (Calel and Mahdavi, 2020; Ialongo et al., 2021), by about 78% from 1995 to 2010. When combined with more efficient extraction techniques, this has led to a roughly 20% reduction in greenhouse gas emissions associated with oil and gas activities in the Abu Dhabi Emirate from 2016 to 2018 (EAD, 2021), consistent with the drop seen in Figure 1B The increase in emissions from 2019 to 2020 reflects the increased oil production in the region as noted by Farahat (2022), while the subsequent drop from 2020 to 2021 is attributed to the slowdown that followed COVID-19. In addition, there has been an increase in agricultural cultivation and livestock (both dairy and meat) as well as fresh and salt water aquaculture in the country to achieve food security, which has also contributed to the rise in CH4 emissions in the country in particular in the last 5 years (EAD, 2021).
Regarding natural sources, coastal and man-made wetlands created to retain recycled treated sewage water (e.g., Al Wathba Wetlands, Abu Dhabi) and sabkhas are the major contributors in the UAE. Sabkhas are ubiquitous in the Middle East, including in the UAE (e.g., Bontognali et al., 2010; McKay et al., 2016), as highlighted in Figure 1B, meaning they may play a major role in the regional methane budget. In fact, the modeling work of Agarwal and Garg (2009) showed that mudflats and salt flats in India can emit up to 0.08 Tg (or 80 kt) of methane over a month, which is up to 80% of the total anthropogenic emissions for 2000–2021 assuming a constant CH4 emission during the year. This stresses that natural methane emissions in the region can be quite substantial, and have to be quantified. A separation of the contributions from natural and anthropogenic sources is not attempted in this study as it requires ground-based observations, medium- and high-resolution satellite data and perhaps additional measurements which are not available to date.
It is important to note that the focus of this work is on CH4 concentrations and not emissions. The two may be very different in particular in this region due to the high number of sources, including the many oil and gas platforms around the Arabian Gulf (Du et al., 2015). The latter may lead to methane being advected by the background flow towards coastal UAE and increasing the local concentrations here. As the vast majority of the oil and gas fields are located in the adjacent coastal waters (Breteler, 2014), CH4 emitted here can be transported into the country and detected by remote sensing assets. Hence, a one-on-one link between CH4 concentrations and emissions would be inaccurate. What is more, an investigation of the methane emissions would require an estimation of its background values so as to isolate the source concentration from the total value. This can only be achieved through the combination of a dense network of surface observations with measurements collected at high temporal frequency (at least once hourly) with medium- and high-resolution satellite data for background assessment over the entire atmospheric column, which is not available in the region. In fact, the ground-based CH4 concentration is currently not sampled in the UAE and surrounding region. Given this, the discussion in this work will be focused on CH4 total concentrations, as estimated by satellite-derived products and a state-of-the-art reanalysis dataset.
4 Annual variability of methane concentrations
The mean annual XCH4 concentration for 2018–2021 from TROPOMI is presented in Figure 3. The number of TROPOMI observations per year is given in Supplementary Figure S2, varying from 200–280 over the vast majority of the domain in 2019, to less than 200 in 2018 and 2021. The range of XCH4 values is ∼100 ppb between 1860 and 1960 ppb, with a year-on-year increase from below 1900 ppb in 2018–2019 to an excess of 1900 ppb in 2020–2021. These XCH4 concentrations are comparable to those measured in-situ at an urban and suburban site in India (Sreenivas et al., 2016; Metya et al., 2022). Overall, the methane concentrations are largely unchanged from 2018 to 2019 (cf. Figures 3A, B), while the CH4 anthropogenic emissions rose steadily from 2018 to 2020 (Figure 1B), largely due to increased oil production in the region (Farahat, 2022). Figure 4B shows the difference in surface temperature and in the 10-m horizontal wind vectors between 2019 and 2018. In 2019 there was a weakening of the background northwesterly flow over the UAE and adjacent Arabian Gulf. This may have led to a reduced advection of the CH4 emitted by the several oil and gas platforms in the region (Bateni et al., 2022; Farahat, 2022) and by the major sources in coastal sites into the country, explaining the small changes in the XCH4 values. The role of advection in the spatial distribution of CH4 by both local mesoscale circulations at low-levels (Sreenivas et al., 2016; Elmi et al., 2021; Metya et al., 2022) and the background flow throughout the column (Ricaud et al., 2014) has been reported in the literature. The XCH4 seasonal fluxes (Supplementary Figure S3) indicate that advection likely plays the largest role over the Al Hajar mountains, where there is low-level convergence of the northwesterly flow from the Arabian Gulf with the easterly flow from the Sea of Oman, in particular in the warmer months. The pronounced increase in XCH4 concentration from 2020 to 2021, in particular in coastal regions, reflects i) the effects of the COVID-19 pandemic in 2020, when there were much reduced amounts of atmospheric pollutants in cities such as Abu Dhabi (Teixido et al., 2021; Francis et al., 2022), and ii) a marked rise in air temperatures (cf. Figures 4C, D), in line with the fact that, for the same biogeochemical state, CH4 emissions increase at higher temperatures (e.g., Javadinejad et al., 2019; Peacock et al., 2021).
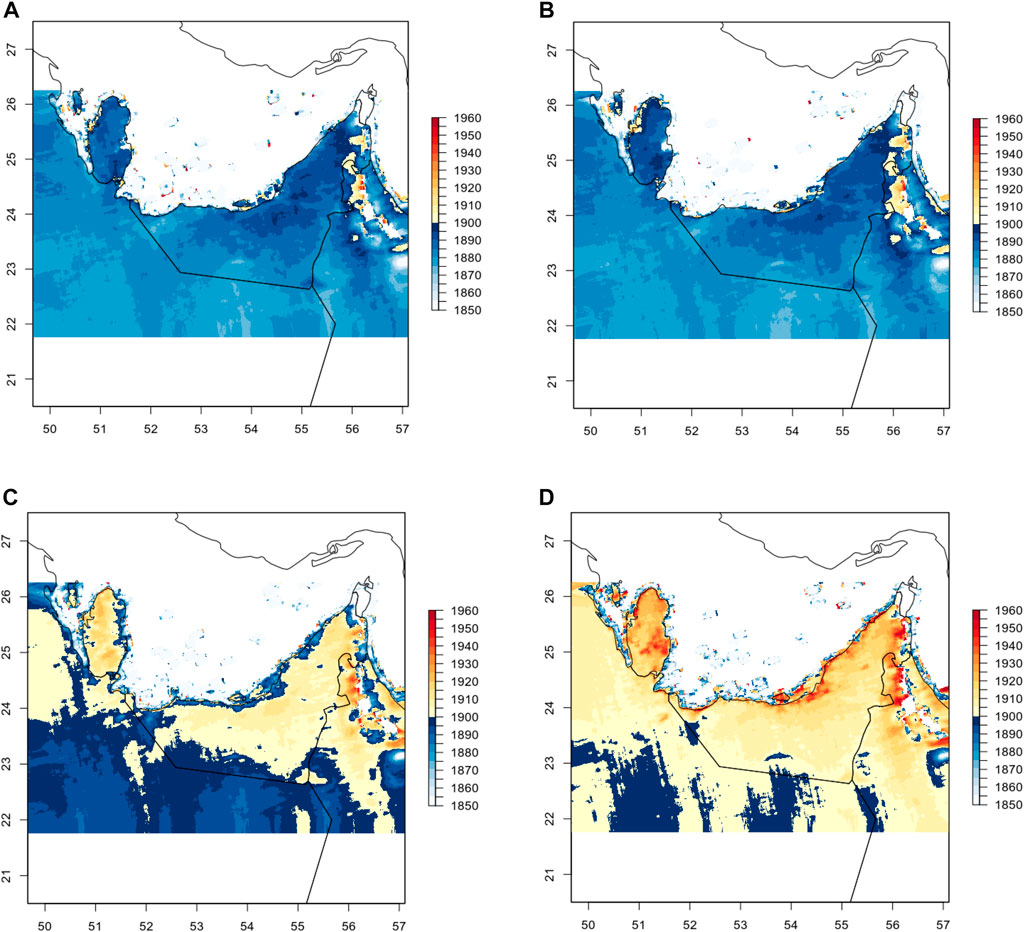
FIGURE 3. Methane total column concentration (XCH4; ppb) from TROPOMI for the UAE and surrounding region for (A) 2018, (B) 2019, (C) 2020, and (D) 2021. The data is bounded between 22 and 27°N and the concentrations are truncated to 1850 and 1960 ppb, with white shading denoting missing data. The correspondent data density maps are given in Supplementary Figure S2.
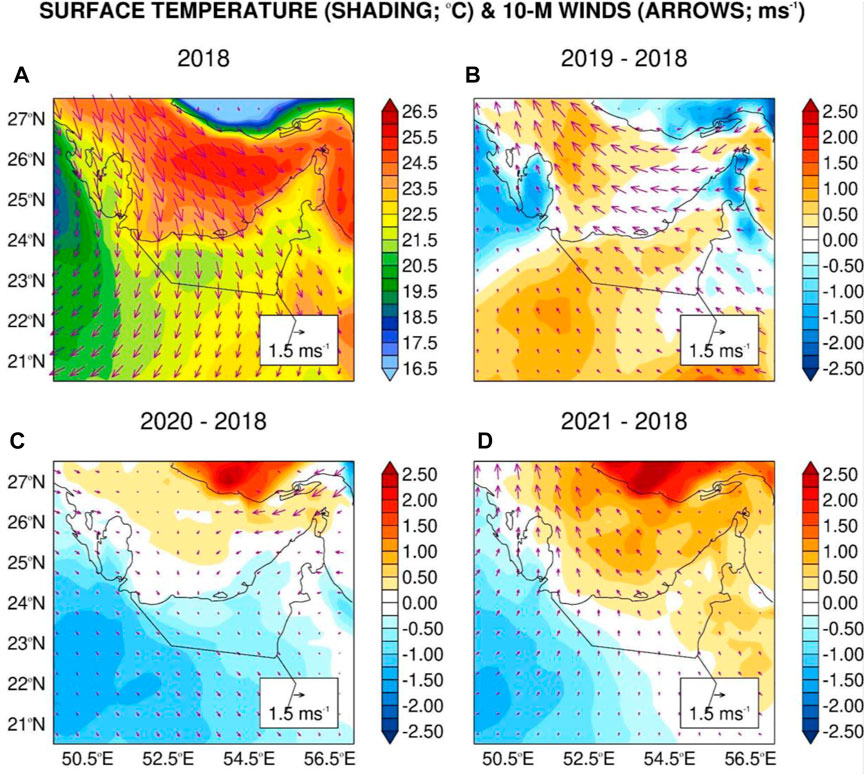
FIGURE 4. (A) Surface temperature (shading; ºC) and 10-m horizontal wind vectors (arrows; m s−1) averaged over 2018. (B–D) are as (A) but for the differences between the annual means for 2019, 2020, and 2021, respectively, and that of 2018.
Regarding the spatial distribution, CH4 concentrations tend to be highest in coastal regions and along the slopes of the Al Hajar mountains, decreasing towards the inland desert. The peak concentration in coastal areas of Qatar, UAE and Oman are related to the presence of i) coastal wetlands, including sabkhas, mangroves, and seagrass (Bontognali et al., 2010; McKay et al., 2016; Rosentreter et al., 2018; Jeffrey et al., 2019a; Jeffrey et al., 2019b; Rosentreter et al., 2021), as evidenced by the location of the sabkhas in Figure 1A; ii) landfills, which also emit substantial amounts of CH4 (Maasakkers et al., 2022), and are typically adjacent to the urban areas (Elmi et al., 2021). The highest XCH4 values are concentrated in major coastal cities such as Doha and Abu Dhabi, where both coastal wetlands and landfills are present, and where NO2 emissions are also high (Valin et al., 2011). This is particularly the case in 2021 (Figure 3D), which was hotter compared to 2018–2020 (Figure 4), leading to higher CH4 concentrations (Al-Haj and Fulweiler, 2020; Elmi et al., 2021). Changes in land use and land cover, in particular cultivated areas, urbanization, aquaculture and domestic livestock may also play a role in the increased concentration from 2018 to 2021. The higher amounts of precipitation at the Al Hajar mountains (Wehbe et al., 2017; Wehbe et al., 2018; Francis et al., 2020; Wehbe et al., 2020), Figure 2B, leads to the formation of microhabitats at wadis (dry riverbeds), in particular along the south-facing slopes (El-Keblawy et al., 2016). These environments promote the emission of CH4, as microbes, which release CH4 through anaerobic respiration, can thrive there (Schulze-Makuch et al., 2021; Wang et al., 2021; Wang et al., 2022). The development of aquaculture farms and the Wadi Hatta Dam may be contributors in the Hatta area in the southern part of the mountain range (Tokhi et al., 2016; El Hoummaidi and Larabi, 2019). Advection may also play a role in the higher XCH4 amounts over the Al Hajar mountains, as indicated by the XCH4 fluxes (Supplementary Figure S3). It is important to note that the CH4 concentrations given in Figure 3 are column values whereas the CH4 emission processes discussed above are all surface-based. Some of the sources mentioned can emit very high amounts of CH4 e.g., sabkhas can contain CH4 in concentrations as high as 3.4 × 10⁶ ppb (McKay et al., 2016), with Agarwal and Garg (2009) suggesting that mudflats and salt flats can emit up to 80 kt of CH4 in a month. These amounts are sufficiently high to impact the column CH4 values through vertical mixing in the daytime desert boundary layer that can extend beyond 3 km (Wang et al., 2016). Other mechanisms such as advection by the background flow may also play a role as stated before.
The mean XCH4 concentration per year from CAMS is presented in Figure 5. The range in mixing ratio is narrower than that of TROPOMI at about 30 ppb between 1860 and 1890 ppb. In general, there is a year-on-year increase in XCH4 mixing ratio from 2018 to 2020 with a decreasing gradient in concentration from north to south, as in the TROPOMI maps (cf. Figure 3). The hot spots over Qatar and northern UAE are presumably from the EDGAR emissions inventory, which show the highest anthropogenic emissions in these areas (Janseens-Maenhout et al., 2014). In fact, there is a maximum around Doha in 2019 (Figure 5B). The higher values over the Strait of Hormuz may be attributed to the oil and gas platforms in southern Iran (Bateni et al., 2022). Mixing ratios are lower in CAMS than TROPOMI, which could be due to the assimilation of IASI data in CAMS (Agusti-Panareda et al., 2022) as estimates of XCH4 from IASI are typically lower than TROPOMI. Siddans et al. (2017) reports a maximum mixing ratio of about 1820 ppb XCH4 globally from IASI, increasing to 1900 ppb XCH4 in the lower troposphere. Maximum estimates from TROPOMI are higher, exceeding 1900 ppb (Hu et al., 2018). Siddans et al. (2017) notes that the error range for IASI estimates in the lower troposphere is higher than in the upper troposphere (20–100 ppb and 30–40 ppb, respectively). Schneider et al. (2022) further highlights that TROPOMI has a higher sensitivity near the surface than IASI, which arises because the former observes in the shortwave infrared (2.3 µm) while the latter observes in the thermal infrared (3.62–15.5 µm), and should retrieve a more accurate XCH4 concentration. This is supported by the TROPOMI’s −3.4 ppb bias with respect to in situ measurements over a two-year period reported by Lorente et al. (2021).
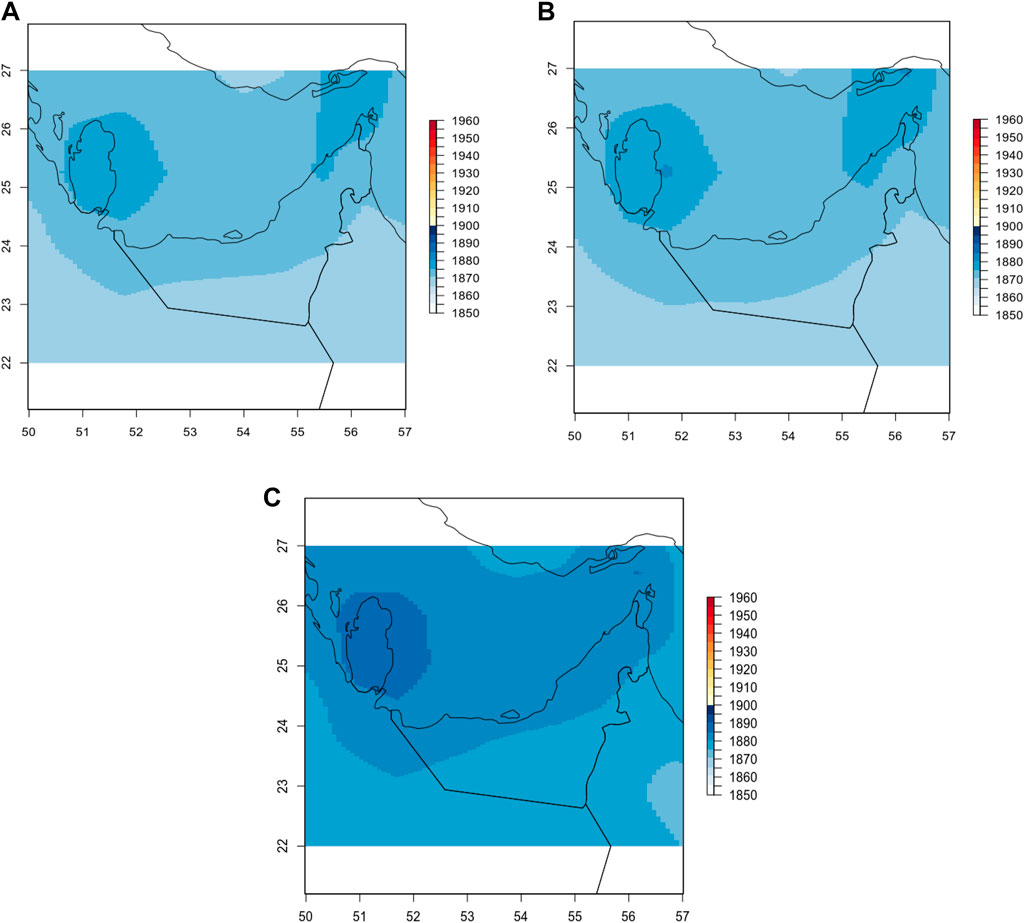
FIGURE 5. Methane total column concentrations (XCH4; ppb) from CAMS for (A) 2018, (B) 2019, and (C) 2020. For an easier comparison, the colour scale matches that used in the TROPOMI images in Figure 3.
5 Trend analysis of methane concentrations
The time-series of the UAE area-averaged XCH4 concentration (i.e., the column methane values are averaged over the UAE, as defined by the country border in the inset in Figure 1A) shows a clear seasonal cycle in the TROPOMI and CAMS products (Figure 6B). Seasonal cycles have been reported also in IASI (Crevoisier et al., 2009), TROPOMI (Lorente et al., 2021) and in-situ observations (Nisbet et al., 2016). XCH4 seasonal cycles have been shown to vary based on location and the relative contribution of methane sources and sinks (Kivimaki et al., 2019). In this case, the month with the highest mean XCH4 concentration is August, which is the estimated month of peak emissions from natural sources (including peatlands, wetlands, wet mineral soil and sabkhas), as reported by Spahni et al. (2011). A similar seasonal cycle is not evident in the NOAA time-series, which indicates that the respective observations and the total column values are representative of different CH4 sources. In other words, the seasonal cycle in TROPOMI and CAMS suggests that a wide range of emission sources are contributing to the total column concentration, while the surface measurements from NOAA are more representative of emission sources close to the monitoring stations (Supplementary Figure S1). In addition, the fact that stations in both the Northern and Southern Hemispheres are considered in the NOAA data, and the opposing time of the yearly maximum in both, means the annual cycle will be smoothed out when computing the average. The TROPOMI and CAMS XCH4 concentrations exhibit a similar seasonal cycle with an amplitude of about 75 ppb (Figure 6B). They demonstrate an upward trend, confirmed with the non-parametric Mann-Kendall test (Mann, 1945; Kendall, 1975), in line with NOAA global background observations (Dlugokencky, 2022a). The TROPOMI trend for 2019–2020 is roughly 9 ppb/year, twice that estimated over northern Finland (Karppinen et al., 2020) and Argentina (Puliafito et al., 2020) using the same dataset.
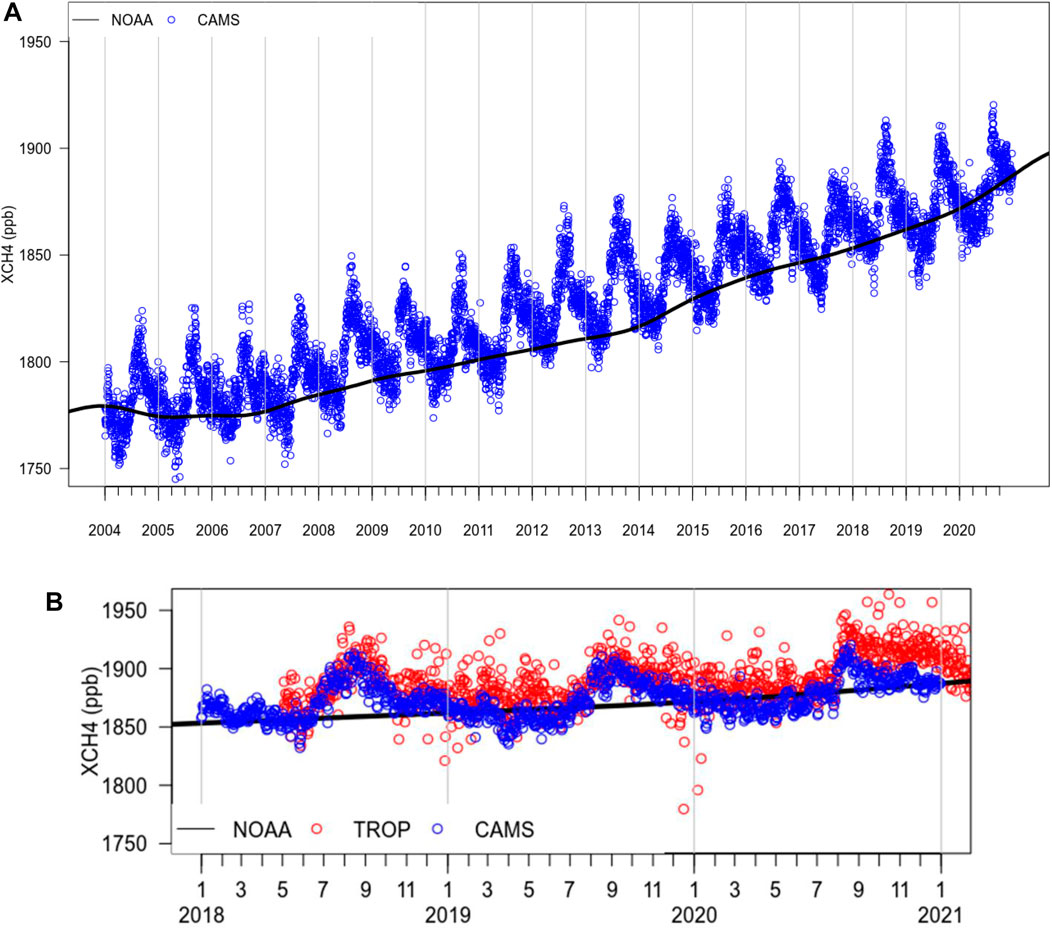
FIGURE 6. (A) CAMS total column CH4 (XCH4; ppb) mean over the UAE from 2004–2020 (blue circles). The mean is calculated from the daily 09 UTC timesteps, the closest time to the TROPOMI overpasses. (B) Area-averaged time series of XCH4 concentrations (ppb) from TROPOMI (red) and CAMS (blue). The NOAA deseasonalized monthly mean is given by the black line.
The data range of XCH4 is below 100 ppb (Figure 6A), while the surface observations of CH4 have a wider range of about 200 ppb (Figure 7A). This is expected, as a column concentration has fewer degrees of freedom compared to the values at the surface (or in an individual layer), which are more susceptible to change in particular as CH4 sources are mostly located at the surface. The dispersion of the mid-to upper-level methane levels by the circulation associated with the Asian monsoon anticyclone also modulates the column values (Ricaud et al., 2014). The trends in the surface and column values are given in Figure 7B, with the former only plotted for 2004–2017 as the goal is to place the trends in XCH4 given in Figure 6B in context with the longer-term trends. The surface concentration exhibits an increasing trend as does XCH4, which suggests that local methane emissions are also increasing. Interestingly, the seasonal cycle in the surface concentrations is nearly opposite to that of the column values, with higher magnitudes in winter and spring and lower values in the summer (cf. Blue and green lines in Figure 7B). This likely reflects an incorrect representation of the observed emissions in the reanalysis data. CAMS XCH4 concentrations are higher than the global mean observed by NOAA from January 2018 until about July 2020, at which point the two datasets are of similar magnitude with CH4 concentrations around 1900 ppb. This does not necessarily suggest that the global CH4 concentration is increasing at a faster rate than the regional ones. In fact, it is more a reflection of i) a change in the sign of the CAMS XCH4 bias from positive to negative since 2019, as a result of the assimilation of near real-time satellite retrievals, and ii) an incorrect representation of the emissions during the COVID slowdown in 2020, as highlighted by Agusti-Panareda et al. (2022).
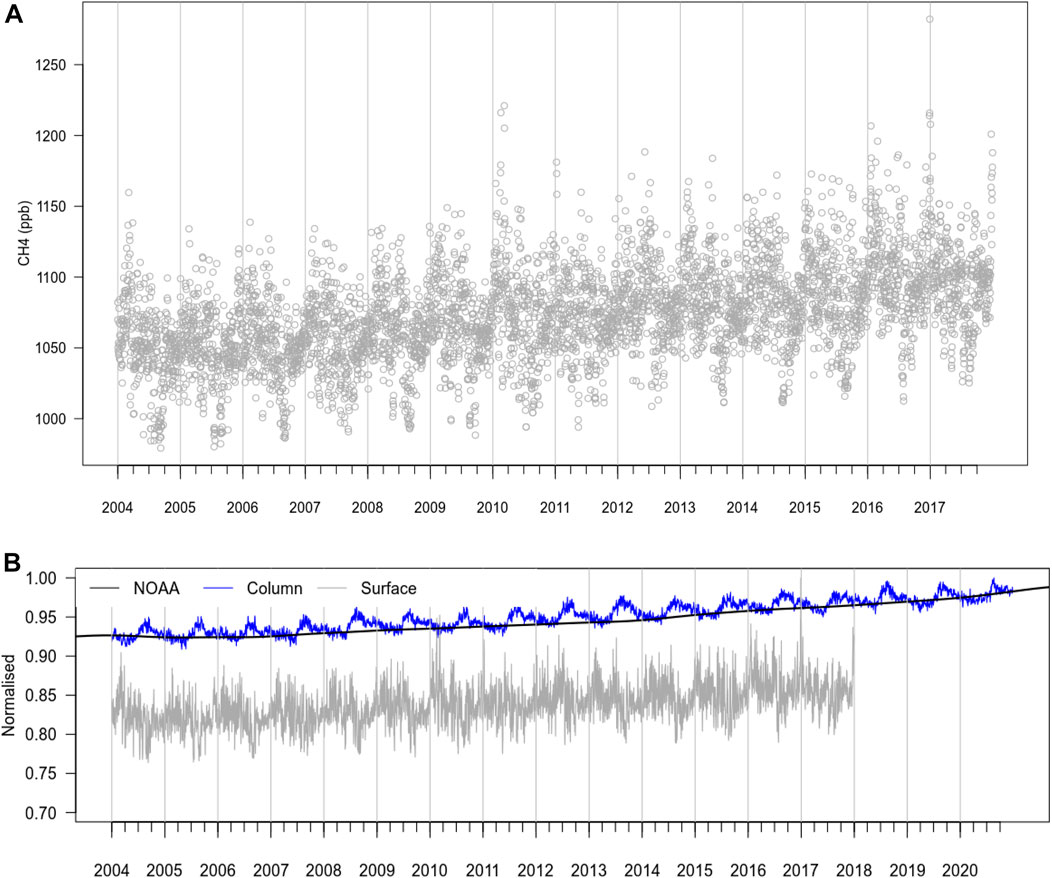
FIGURE 7. (A) CAMS surface CH4 (ppb) area-averaged over the UAE for the period 2004–2017. The mean is calculated from the daily 09 UTC timesteps. (B) Normalized surface concentrations, so as to allow for a direct comparison between the CAMS surface concentration given in (A) and the column (XCH4) values. The brown line shows the surface concentration divided by the maximum surface value, while the blue and black lines give the CAMS XCH4 and NOAA surface observations normalized to the CAMS XCH4 maximum value, respectively.
6 Seasonality
In this section, the seasonal cycle of the XCH4 concentration in the UAE and surrounding region in TROPOMI and CAMS are analyzed. Both the satellite-derived and reanalysis datasets show higher column concentrations in the warmer months (Figure 8), in line with increased emissions (Spahni et al., 2011) which also result from the higher air temperatures (Figure 2A). They exhibit a broadly similar spatial pattern that features larger values over coastal sites, northern UAE and around the Al Hajar mountains, and lower values in the inland desert as seen in the annual maps (Figure 3). Javadinejad et al. (2019) noted a positive relationship between the methane gas concentration and the 2-m temperature, and a negative relationship with the vegetation, precipitation and relative humidity. As reported in Nelli et al. (2020), Nelli et al. (2022), and as seen in Figure 2, summer months feature the highest air temperatures and the lowest precipitation and relative humidity values (the specific humidity is higher due to the strong evaporation from the Arabian Gulf, but the relative humidity is lower owing to the higher temperatures). This is in line with the findings of Javadinejad et al. (2019), with the region largely devoid of vegetation (e.g. Gherboudj and Ghedira, 2016). Figure 8C quantifies the surface concentration changes between the solstice seasons. The seasonal mean variations are generally within ±15 ppb, or about 0.75% of the absolute values, and hence five times smaller than the monthly annual cycle (Figure 6). The largest differences are seen over the Rub’ Al Khali (Empty Quarter) desert, where the background values are also the smallest in the region (Figures 8A, B). This area, away from the moderating effects of the Arabian Gulf and Arabian Sea, experiences huge swings in surface and air temperature throughout the year, Figure 2A, from near freezing conditions in winter to scorching weather in the summer (Syed et al., 2019). This leads to more pronounced variations in the XCH4 concentrations. The negative change in methane concentration between summer and winter in parts of northwestern Qatar and northeastern UAE and coastal Oman, generally by less than 5 ppb, arises because of the stronger winds (Figure 2A) and associated unstable boundary layers at this time of the year. Such conditions promote increased dispersion of the gas and subsequently lead to locally reduced amounts. This is confirmed by the enhanced divergence of the XCH4 fluxes in the warmer months (Supplementary Figure S3). Summertime precipitation is mostly restricted to the Al Hajar mountains and surrounding region (Figure 2B) and explains the smaller CH4 concentration at some sites. Throughout the year, the advection of the CH4 emitted by the several refineries and oil fields in the region (Bateni et al., 2022; Farahat, 2022) by the background northwesterly flow (Figure 2B; Supplementary Figure S3), contributes to the XCH4 concentration over the region. As is the case for the annual maps (Figures 3, 4), the spatial pattern of the seasonal-mean CAMS XCH4 concentrations largely agrees with the corresponding TROPOMI ones (Figures 8A, B, D, E). The CAMS spatial plots show higher summertime CH4 values over eastern Qatar and northeastern UAE, roughly where the satellite-derived methane concentrations are also the largest.
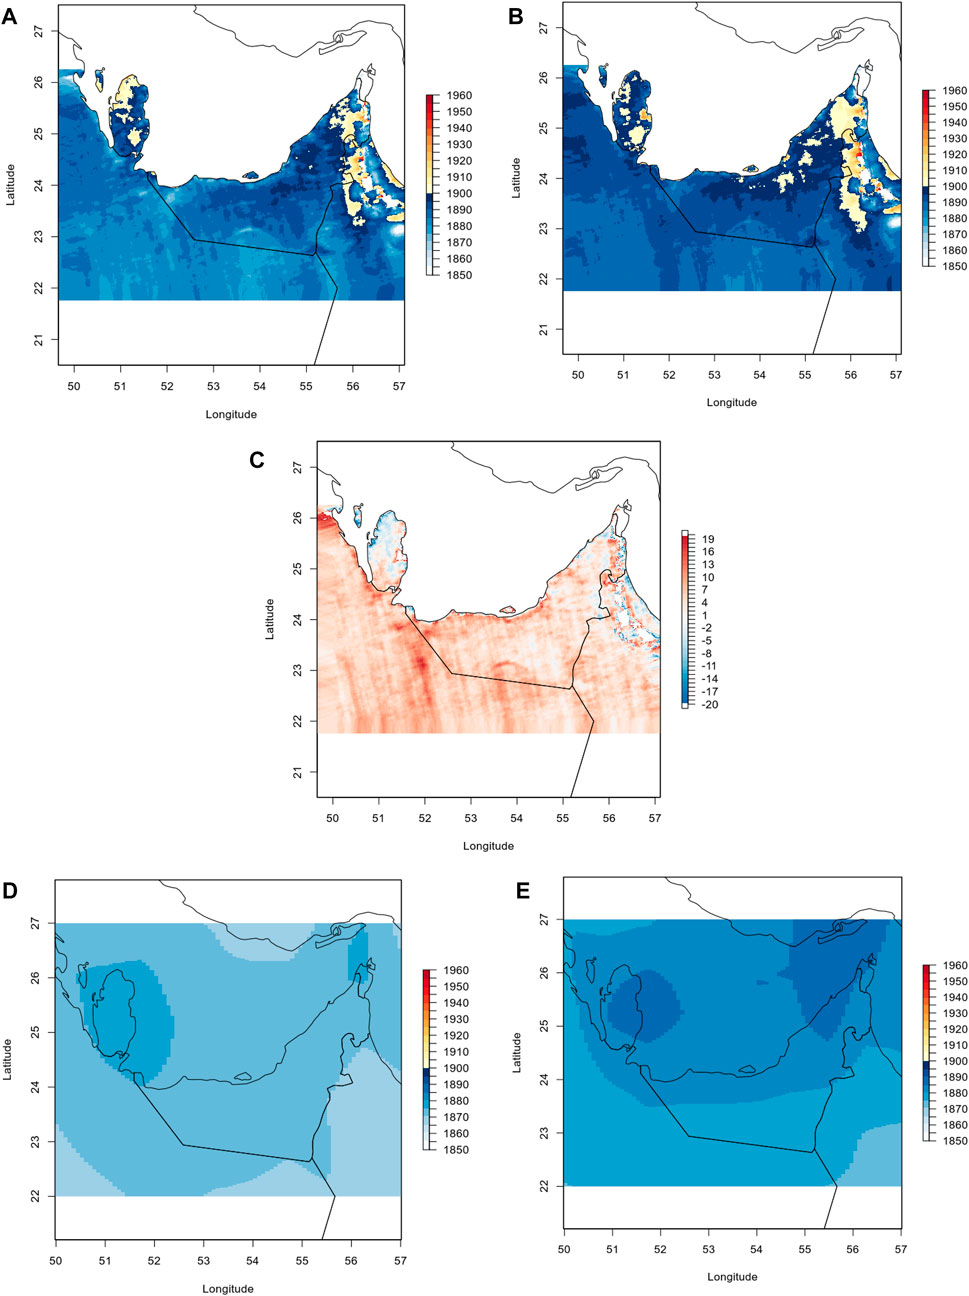
FIGURE 8. XCH4 concentration (ppb) over (A) winter (December-February, DJF, 2019–2020) and (B) summer (June to August, JJA, 2018–2020) from TROPOMI. (C) Gives the difference between the summer and winter values. (D,E) are as (A,B) but for CAMS.
7 Discussion and conclusion
Methane (CH4) is a potent greenhouse gas, whose global mean concentration reached 1900 parts per billion (ppb) in late 2021 (Dlugokencky, 2022b) and has increased at a rate of about 13 ppb/year in the last 15 years (Hersbach et al., 2018; Feng et al., 2022). One of the emission hotspots is the eastern Arabian Peninsula, where an understanding of the spatial and temporal variability of the CH4 concentration is lacking. This is achieved here through the analysis of satellite-derived and reanalysis methane concentrations for the period 2004–2021 for the United Arab Emirates (UAE) and surrounding region.
Column methane concentrations (XCH4), as estimated from the measurements collected by the Tropospheric Monitoring Instrument (TROPOMI) on board the Sentinel-5 Precursor satellite, revealed an increase during 2018–2021. The annual trend of 9 ppb/year is twice as large as that estimated over the Arctic (Karppinen et al., 2020) and Argentina (Puliafito et al., 2020) where the trends in XCH4, as measured by TROPOMI, have also been computed. Spatially, the highest values are observed in coastal regions, where landfills (waste dumps) and coastal wetlands (such as seagrass beds, sabkhas, coastal supratidal mudflats or sandflats), strong methane emitters, are present. Concentrations are also high around the Al Hajar mountains, where microhabitats, which harbor microbes that release CH4 through anaerobic respiration, form in the wadis (dry river beds) in response to higher amounts of precipitation. Here, the convergence of the northwesterly flow from the Arabian Gulf with the easterly flow from the Sea of Oman and subsequent transport of CH4 plays a role in the higher XCH4 amounts, in line with the findings of Metya et al. (2022). Agricultural activities, aquaculture farms and the Wadi Hatta Dam also contribute to the CH4 concentration in the mountains. Other CH4 sources include oil and gas production, urbanization and agriculture (cultivated lands and livestock).
Monthly XCH4 concentrations exhibit a peak in August, when natural and anthropogenic CH4 emissions are maximized, and an overall annual amplitude of 75 ppb. The highest seasonality is found in the Rub’ Al Khali desert, where the largest temperature swings impact local concentrations. A comparison of the satellite-derived XCH4 with the column concentrations given by the Copernicus Atmosphere Monitoring Service (CAMS) reanalysis data revealed the latter underestimates the magnitude by up to 50 ppb (or 1%–2% of the absolute values), even though the spatial pattern is similar. The lower CAMS values arise from the assimilation of CH4 measurements from the Infrared Atmospheric Sounding Interferometer (IASI) on board the Metop-B satellite in the reanalysis dataset, which are typically lower than those of TROPOMI with the latter regarded as more accurate (Agusti-Panareda et al., 2022; Schneider et al., 2022). Surface CH4 concentrations from CAMS are also analyzed, and are found to have the opposite seasonal cycle phase to that of the column concentration, which is attributed to an incorrect representation of the emissions in the reanalysis dataset.
While it is unclear the exact mechanisms behind the positive trend in the CH4 concentration, both TROPOMI and CAMS highlight an increase in the UAE and surrounding regions over the last 5 years, and provide insight into how we may better geographically study and constrain the amount and source of the CH4 emissions. This may result in new policy and procedures to reduce emissions through mitigation and adaptation. Ground-based CH4 measurements, collected through a dense network of surface observations, and higher spatial and temporal resolution satellite products are needed to identify the major sources and further our understanding of the processes behind the observed CH4 variability in the region.
Data availability statement
The original contributions presented in the study are included in the article/Supplementary Material, further inquiries can be directed to the corresponding author.
Author contributions
DF: conceptualization, methodology, supervision, original draft preparation and reviewing, fund acquisition. MW: investigation, formal analysis, data curation, software and visualization, original draft preparation. RF: writing—original draft preparation and reviewing, formal analysis and data curation. MT: validation and inputs to the draft. AA: validation and inputs to the draft. All authors contributed to the article and approved the submitted version.
Acknowledgments
The authors wish to acknowledge the contribution of Khalifa University’s high-performance computing and research computing facilities to the results of this research. We would also like to thank the editor and the two reviewers who made several insightful comments and suggestions which helped to significantly improve the manuscript.
Conflict of interest
The authors declare that the research was conducted in the absence of any commercial or financial relationships that could be construed as a potential conflict of interest.
Publisher’s note
All claims expressed in this article are solely those of the authors and do not necessarily represent those of their affiliated organizations, or those of the publisher, the editors and the reviewers. Any product that may be evaluated in this article, or claim that may be made by its manufacturer, is not guaranteed or endorsed by the publisher.
Supplementary material
The Supplementary Material for this article can be found online at: https://www.frontiersin.org/articles/10.3389/fenvs.2023.1177877/full#supplementary-material
References
Agarwal, R., and Garg, J. K. (2009). Methane emission modelling from wetlands and waterlogged areas using MODIS data, Current Science Available at: http://www.indiaenvironmentportal.org.in/files/Methane%20emission%20modelling.pdf (Accessed September 25, 2023).
Agusti-Panareda, A., Barre, J., Massart, S., Inness, A., Aben, I., Ades, M., et al. (2022) Technical note: The CAMS greenhouse gas reanalysis from 2003 to 2020. EGUsphere. doi:10.5194/egusphere-2022-283
Al Senafi, F., Anis, A., and Menezes, V. (2019). Surface heat fluxes over the northern arabian Gulf and the northern Red Sea: Evaluation of ECMWF-ERA5 and NASA-MERRA2 reanalyses. Atmosphere 10, 504. doi:10.3390/atmos10090504
Al-Haj, A. N., and Fulweiler, R. W. (2020). A synthesis of methane emissions from shallow vegetated coastal ecosystems. Glob. Change Biol. 26, 2988–3005. doi:10.1111/gcb.15046
Al-Yaqout, A., and Hamoda, M. F. (2020). Long-term temporal variations in characteristics of leachates from a closed landfill in an arid region. Water, Air, & Soil Pollut. 231, 319. doi:10.1007/s11270-020-04688-7
Alvarez, R. A., Zavala-Araiza, D., Lyon, D. R., Allen, D. T., Barkley, Z. R., Brandt, A. R., et al. (2018). Assessment of methane emissions from the U.S. oil and gas supply chain. Science 361, 186–188. doi:10.1126/science.aar7204
Apituley, A., Pedergnana, M., Sneep, M., Veefkind, J. P., Loyola, D., Hasekamp, O., et al. (2021). Sentinel-5 precursor/TROPOMI level 2 product user manual methane. Available at: https://sentinel.esa.int/documents/247904/2474726/Sentinel-5P-Level-2-Product-User-Manual-Methane.pdf/1808f165-0486-4840-ac1d-06194238fa96 (Accessed September 21, 2022).
Arshad, M., Ma, X., Yin, J., Ullah, W., Liu, M., and Ullah, I. (2021). Performance evaluation of ERA-5, JRA-55, MERRA-2, and CFS-2 reanalysis datasets, over diverse climate regions of Pakistan. Weather Clim. Extrem. 33, 100373. doi:10.1016/j.wace.2021.100373
Bateni, F., Mehdinia, A., Lundin, L., and Hashtroudi, M. S. (2022). Distribution, source and ecological risk assessment of polycyclic aromatic hydrocarbons in the sediments of northern part of the Persian Gulf. Chemosphere 295, 133859. doi:10.1016/j.chemosphere.2022.133859
Bebout, B. M., Hoehler, T. M., Thamdrup, B., Albert, D., Carpenter, S. P., Hogan, M., et al. (2004). Methane production by microbial mats under low sulphate concentrations. Geobiology 2, 87–96. doi:10.1111/j.1472-4677.2004.00024.x
Blumstein, D., Chalon, G., Carlier, T., Buil, C., Hebert, P., Maciaszek, T., et al. (2004). IASI instrument: Technical overview and measured performances. Proc. SPIE 12, 5543. doi:10.1117/12.560907
BontognaliVasconcelos, T. R. R. C., Warthmann, R. J., Bernasconi, S. M., Dupraz, C., Strohmenger, C. J., and McKenzie, J. A. (2010). Dolomite formation within microbial mats in the coastal sabkha of Abu Dhabi (United Arab Emirates). Sedimentology 57, 824–844. doi:10.1111/j.1365-3091.2009.01121.x
Branch, P., Behrendt, A., Gong, Z., Schwitalla, T., and Wulfmeyer, V. (2020). Convection initiation over the eastern arabian Peninsula. Meteorol. Z. 29, 67–77. doi:10.1127/metz/2019/0997
Breteler, R. F. (2014). Strategies for UAE oil & gas field management. Available at https://www.energydubai.com/strategies-uae-oil-gas-field-management/ (Accessed on September 25, 2023).
Butz, A., Hasekamp, O. P., Frankenberg, C., Vidot, J., and Aben, I. (2010). CH4 retrievals from space-based solar backscatter measurements: Performance evaluation against simulated aerosol and cirrus loaded scenes. J. Geophys. Res. 115, D24302. doi:10.1029/2010JD014514
Calel, R., and Mahdavi, P. (2020). The unintended consequences of antiflaring policies - and measures for mitigation. Proc. Natl. Acad. Sci. U. S. A. 117, 12503–12507. doi:10.1073/pnas.2006774117
Coskuner, G., Jassim, M., Nazeer, N., and Damindra, G. H. (2020). Quantification of landfill gas generation and renewable energy potential in arid countries: Case study of Bahrain. Waste Manag. Res. 38, 1110–1118. doi:10.1177/0734242X20933338
Crevoisier, C., Nobileau, D., Fiore, A. M., Armante, R., Chedin, A., and Scott, N. A. (2009). Tropospheric methane in the tropics - first year from IASI hyperspectral infrared observations. Atmos. Chem. Phys. 9, 6337–6350. doi:10.5194/acp-9-6337-2009
Crippa, M., Guizzardi, D., Banja, M., Solazzo, E., Muntean, M., Schaaf, E., et al. (2022). “CO2 emissions of all world countries - 2022 Report,” in Eur 31182 en (Luxembourg: Publications Office of the European Union). doi:10.2760/730164
Crippa, M., Guizzardi, D., Solazzo, E., Muntean, M., Schaaf, E., Monforti-Ferrario, F., et al. (2021). “GHG emissions of all world countries - 2021 Report,” in Eur 30831 en (Luxembourg: Publications Office of the European Union). doi:10.2760/173513
Dalsoren, S. B., Myhre, C. L., Myhre, G., Gomez-Pelaez, A. J., Sovde, O. A., Isaksen, I. S. A., et al. (2016). Atmospheric methane evolution the last 40 years. Atmos. Chem. Phys. 16, 3099–3126. doi:10.5194/acp-16-3099-2016
COAH (2022). Copernicus open access Hub. Available at https://scihub.copernicus.eu/ (Accessed on September 21, 2022).
de Gouw, J. A., Veefkind, J. P., Roosenbrand, E., Dix, B., Lin, J. C., Landgraf, J., et al. (2020). Daily satellite observations of methane from oil and gas production regions in the United States. Sci. Rep. 10, 1379. doi:10.1038/s41598-020-57678-4
de Wachter, E., Kumps, N., Vandaele, A. C., Langerock, B., and De Maziere, M. (2017). Retrieval and validation of MetOp/IASI methane. Atmos. Meas. Tech. 10, 4623–4638. doi:10.5194/amt-10-4623-2017
Dlugokencky, E. J. (2022b). NOAA/GML calculation of global means. Global monitoring laboratory, Earth system research laboratories. Available at https://gml.noaa.gov/ccgg/about/global_means.html (Accessed on September 21, 2022).
Dlugokencky, E. J., Steele, L. P., Lang, P. M., and Masarie, K. A. (1994). The growth rate and distribution of atmospheric methane. J. Geophys. Res. 99, 17021–17043. doi:10.1029/94JD01245
Dlugokencky, E. J. (2022a). Trends in atmospheric methane, global monitoring laboratory, Earth system research laboratories. Available at https://gml.noaa.gov/ccgg/trends_ch4/ (Accessed on September 21, 2022).
Du, Y., Zhang, J.-L., Zeng, S.-F., Xin, J., Chen, J., and Li, Y.-Z. (2015). The rudist buildup depositional model, reservoir architecture and development strategy of the cretaceous Sarvak formation of Southwest Iran. Petroleum 1, 16–26. doi:10.1016/j.petlm.2015.04.001
Duan, X., Wang, X., Mu, Y., and Ouyang, Z. (2005). Seasonal and diurnal variations in methane emissions from Wuliangsu Lake in arid regions of China. Atmos. Environ. 39, 4479–4487. doi:10.1016/j.atmosenv.2005.03.045
EAD (2021). Greenhouse gas inventory and projections for Abu Dhabi emirate. Executive summary of the fourth cycle. Available at: https://www.ead.gov.ae/-/media/Project/EAD/EAD/Documents/Resources/EAD-GHG-Executive-Summary-Report-EN-final.pdf (Accessed on September 21, 2022).
Eager, R. E., Raman, S., Wootten, A., Westphal, D. L., Reid, J. S., and Al Mandoos, A. (2008). A climatological study of the sea and land breezes in the Arabian Gulf region. J. Geophys. Res. 113, D15106. doi:10.1029/2007JD009710
ECMWF (2022). CAMS global greenhouse gas reanalysis (EGG4). Available at: https://ads.atmosphere.copernicus.eu/cdsapp#!/dataset/cams-global-ghg-reanalysis-egg4 (Accessed on September 21, 2022).
El Hoummaidi, L., and Larabi, A. (2019). Impact of soil erosion on water quality in the Hatta Dam (Dubai emirate). Int. J. Civ. Struct. Environ. Infrastructure Eng. Res. Dev. 9 (6), 1–16. doi:10.24247/ijcseierddec20191
El-Keblawy, A. A., Khedr, A.-H. A., and Khafaga, T. A. (2016). Mountainous landscape vegetation and species composition at wadi helo: A protected area in hajar mountains, UAE. Arid Land Res. Manag. 30, 389–399. doi:10.1080/15324982.2015.1136970
Elmi, A., Al-Harbi, M., Yassin, M. F., and Al-Awadhi, M. M. (2021). Modeling gaseous emissions and dispersion of two major greenhouse gases from landfill sites in arid hot environment. Environ. Sci. Pollut. Res. 28, 15424–15434. doi:10.1007/s11356-020-11760-6
European Commission (2022). Emissions Database for global atmospheric research version 4.2. Available at: 10.2904/JRC_DATASET_EDGAR (Accessed on September 21, 2022).
European Commission (2023) Emissions Database for global atmospheric research version 7.0. Available at: https://edgar.jrc.ec.europa.eu/dataset_ghg70. (Accessed on 25 January 2023).
Farahat, A. (2022). The impact of the 2020 oil production fluctuations on methane emissions over the Gulf cooperation council (gcc) countries: A satellite approach. Atmosphere 13, 11. doi:10.3390/atmos13010011
Feng, L., Palmer, P. I., Zhu, S., Parker, R. J., and Liu, Y. (2022). Tropical methane emissions explain large fraction of recent changes in global atmospheric methane growth rate. Nat. Commun. 13, 1378. doi:10.1038/s41467-022-28989-z
Fiedler, S., and Sommer, M. (2000). Methane emissions, groundwater levels and redox potentials of common wetland soils in a temperate-humid climate. Glob. Biogeochem. Cycles 14, 1081–1093. doi:10.1029/1999GB001255
Fonseca, R., Francis, D., Nelli, N., and Cherif, C. (2023). Regional atmospheric circulation patterns driving consecutive fog events in the United Arab Emirates. Atmos. Res. 282, 106506. doi:10.1016/j.atmosres.2022.106506
Fonseca, R., Francis, D., Nelli, N., and Thota, M. (2022). Climatology of the heat low and the intertropical discontinuity in the Arabian Peninsula. Int. J. Climatol. 42, 1092–1117. doi:10.1002/joc.7291
Forster, P., Storelvmo, T., Armour, K., Collins, W., Dufresne, J.-L., Frame, D., et al. (2021). The earth’s energy budget, climate feedbacks and climate sensitivity, climate change 2021: The physical science basis. Contribution of working Group I to the sixth assessment report of the intergovernmental panel on climate change (IPCC). Available at: https://www.ipcc.ch/report/ar6/wg1/downloads/report/IPCC_AR6_WGI_Chapter07.pdf (Accessed on September 21, 2022).
Francis, D., Chaboureau, J.-P., Nelli, N., Cuesta, J., Alshamsi, N., Temimi, M., et al. (2020). Summertime dust storms over the Arabian Peninsula and impacts on radiation, circulation, cloud development and rain. Atmos. Res. 2020, 105364. doi:10.1016/j.atmosres.2020.105364
Francis, D., Fonseca, R., Nelli, N., Teixido, O., Mohamed, R., and Perry, R. (2022). Increased Shamal winds and dust activity over the Arabian Peninsula during the COVID-19 lockdown period in 2020. Aeolian Res. 55, 100786–109637. doi:10.1016/j.aeolia.2022.100786
Francis, D., Temimi, M., Fonseca, R., Nelli, N. R., Abida, R., Weston, M., et al. (2021). On the analysis of a summertime convective event in a hyperarid environment. Q. J. R. Meteorological Soc. 147, 501–525. doi:10.1002/qj.3930
Ganesan, A. L., Schwietzke, S., Poulter, B., Arnold, T., Lan, X., Rigby, M., et al. (2019). Advancing scientific understanding of the global methane budget in support of the Paris Agreement. Glob. Biogeochem. Cycles 33, 1475–1512. doi:10.1029/2018GB006065
Gherboudj, I., and Ghedira, H. (2016). Assessment of solar energy potential over the United Arab Emirates using remote sensing and weather forecast data. Renew. Sustain. Energy Rev. 55, 1210–1224. doi:10.1016/j.rser.2015.03.099
Gmp (2022). Global methane pledge. Available at: https://www.globalmethanepledge.org/ (Accessed on September 21, 2022).
Hasekamp, O., Lorente, A., Hu, H., Butz, A., aan de Brugh, J., and Landgraf, J. (2019). Algorithm theoretical baseline document for sentinel-5 precursor methane retrieval. Sron-S5P-Lev2-Rp-001, CI-7430-ATBD, 1-67, Available at: http://www.tropomi.eu/sites/default/files/files/publicSentinel-5P-TROPOMI-ATBD-Methane-retrieval.pdf (Accessed on September 21, 2022).
Hersbach, H., Bell, B., Berrisford, P., Biavati, G., Horanyi, A., Munoz Sabater, J., et al. (2018). ERA5 hourly data on single levels from 1979 to present. Copernicus Climate Change Service (C3S) Climate Data Store (CDS). doi:10.24381/cds.adbb2d47
Hersbach, H., Bell, B., Berrisford, P., Dahlgren, P., Horanyi, A., Munoz-Sebater, J., et al. (2020) The ERA5 global reanalysis: Achieving a detailed record of the climate and weather for the past 70 years. European geophysical union general assembly. Vienna, Austria: Wiley. doi:10.5194/egusphere-egu2020-10375
Hmiel, B., Petrenko, V. V., Dyonisius, M. N., Buizert, C., Smith, A. M., Place, P. F., et al. (2020). Preindustral 14CH4 indicates greater anthropogenic fossil CH4 emissions. Nature 578, 409–412. doi:10.1038/s41586-020-1991-8
Houweling, S., Krol, M., Bergamaschi, P., Frankenberg, C., Dlugokencky, E. J., Morino, I., et al. (2014). A multi-year methane inversion using SCIAMACHY, accounting for systematic errors using TCCON measurements. Atmos. Chem. Phys. 14, 3991–4012. doi:10.5194/acp-14-3991-2014
Howarth, R. W. (2019). Is shale gas a major driver of recent increase in global atmospheric methane? Biogeosciences Discuss. 2019, 1–23. doi:10.5194/bg-2019-131
Hu, H., Landgraf, J., Detmers, R., Borsdorff, T., Aan de Brugh, J., Aben, I., et al. (2018). Toward global mapping of methane with TROPOMI: First results and intersatellite comparison to GOSAT. Geophys. Res. Lett. 45, 3682–3689. doi:10.1002/2018GL077259
Hulley, G. C., Hook, S. J., Abbott, E., Malakar, N., Islam, T., and Abrams, M. (2015). The ASTER global emissivity dataset (ASTER GED): Mapping earth’s emissivity at 100 meter spatial scale. Geophys. Res. Lett. 42, 7966–7976. doi:10.1002/2015GL065564
Ialongo, I., Stepanova, N., Hakkarainen, J., Virta, H., and Gritsenko, D. (2021). Satellite-based estimates of nitrogen oxide and methane emissions from gas flaring and oil production activities in Sakha Republic, Russia. Atmos. Environ. X 11, 100114. doi:10.1016/j.aeaoa.2021.100114
Ibrahim, M. D., Binofai, F. A. S., and Mohamad, M. O. A. (2022). Transition to low-carbon hydrogen energy system in the UAE: Sector efficiency and hydrogen energy production efficiency analysis. Energies 15, 6663. doi:10.3390/en15186663
Inness, A., Ades, M., Agusti-Panareda, A., Barre, J., Benedictow, A., Blenchschmidt, A.-M., et al. (2019). The CAMS reanalysis of atmospheric composition. Atmos. Chem. Phys. 19, 3515–3556. doi:10.5194/acp-19-3515-2019
IPCC (2021). in Climate change 2021: The physical science basis. Editors V. Masson-Delmotte, P. Zhai, A. Pirani, S. L. Connors, C. Pean, S. Bergeret al. (United States: Cambridge University Press).
Ishigaki, T., Yamada, M., Nagamori, M., Ono, Y., and Inoue, Y. (2005). Estimation of methane emission from whole waste landfill site using correlation between flux and ground temperature. Environ. Geol. 48, 845–853. doi:10.1007/s00254-005-0008-0
Jackson, R. B., Saunois, M., Bousquet, P., Canadell, J. G., Poutler, B., Stavert, A. R., et al. (2020). Increasing anthropogenic methane emissions arise equally from agricultural and fossil fuel sources. Environ. Res. Lett. 15 (7), 071002. doi:10.1088/1748-9326/ab9ed2
Janseens-Maenhout, G., GuizzardiBergamaschi, P. D., and Muntean, M. (2014). On the CH4 and N2O inventory compiled by EDGAR and improved with EPRTR data for the INGOS project. Available at: https://data.europa.eu/doi/10.2788/78669 (Accessed on September 21, 2022).
Javadinejad, S., Eslamian, S., and Ostad-Ali-Askari, K. (2019). Investigation of monthly and seasonal changes of methane gas with respect to climate change using satellite data. Appl. Water Sci. 9, 180. doi:10.1007/s13201-019-1067-9
Jeffrey, L. C., Maher, D. T., Johnston, S. G., Kelaher, B. P., Steven, A., and Tait, D. R. (2019a). Wetland methane emissions dominated by plant-mediated fluxes: Contrasting emissions pathways and seasons within a shallow freshwater subtropical wetland. Limnol. Oceanogr. 64, 1895–1912. doi:10.1002/lno.11158
Jeffrey, L. C., Reithmaier, G., Sippo, J. Z., Johnston, S. G., Tait, D. R., Harada, Y., et al. (2019b). Are methane emissions from mangrove stems a cryptic carbon loss pathway? Insights from a catastrophic forest mortality. New Phytol. Found. 224, 146–154. doi:10.1111/nph.15995
Karppinen, T., Lamminpaa, O., Tukiainen, S., Kivi, R., Keikkinen, P., Hatakka, J., et al. (2020). Vertical distribution of arctic methane in 2009-2018 using ground-based remote sensing. Remote Sens. 12, 917. doi:10.3390/rs12060917
Kelley, C. A., Poole, J. A., Tazaz, A. M., Chanton, J. P., and Bebout, B. M. (2012). Substrate limitation for methanogenesis in hypersaline environments. Astrobiology 12, 89–97. doi:10.1089/ast.2011.0703
Kivimaki, E., Lindqvist, H., Hakkarainen, J., Laine, M., Sussmann, R., Tsuruta, A., et al. (2019). Evaluation and analysis of the seasonal cycle and variability of the trend from GOSAT methane retrievals. Remote Sens. 11, 882. doi:10.3390/rs11070882
Kormi, T., Ali, N. B. H., Abichou, T., and Green, R. (2017). Estimation of landfill methane emissions using stochastic search methods. Atmos. Pollut. Res. 8, 597–605. doi:10.1016/j.apr.2016.12.020
Lan, X., Basu, S., Schwietzke, S., Bruhwiler, L. M. P., Dlugokencky, E. J., Michel, S. E., Sherwood, O. A., Tans, P. P., Thoning, K., Etiope, G., Zhuang, Q., Liu, L., Oh, Y., Miller, B., Petron, G., Vaughn, B. H., and Crippa, M. (2021). Improved constraints on global methane emissions and sinks using ?13C-CH4. Glob. Biogeochem. Cycles 35, e2021GB007000. doi:10.1029/2021GB007000
Landgraf, J., Lorente, A., Langerock, B., and Sha, M. K. (2022). S5P mission performance centre methane [L2__CH4___] readme. S5P-MPC-SRON-PRF-CH4, 1-16. Available at: https://sentinel.esa.int/documents/247904/3541451/Sentinel-5P-Methane-Product-Readme-File (Accessed on September 21, 2022).
Lauvaux, T., Giron, C., Mazzolini, M., D’Aspremont, A., Duren, R., Cusworth, D., et al. (2022). Global assessment of oil and gas methane ultra-emitters. Science 375, 557–561. doi:10.1126/science.abj4351
Li, S., Wang, C., Gao, P., Zhao, B., Jin, C., Zhao, L., et al. (2023). High-spatial-resolution methane emissions calculation using TROPOMI data by a divergence method. Atmosphere 14, 388. doi:10.3390/atmos14020388
Lorente, A., Borsdorff, T., Butz, A., Hasekamp, O., aan de Brugh, J., Schneider, A., et al. (2021). Methane retrieved from TROPOMI: Improvement of the data product and validation of the first 2 years of measurements. Atmos. Meas. Tech. 14, 665–684. doi:10.5194/amt-14-665-2021
Lovelock, C. E., and Duarte, C. M. (2019). Dimensions of blue carbon and emerging perspectives. Biol. Lett. 15, 20180781. doi:10.1098/rsbl.2018.0781
Maasakkers, J. D., Varon, D. J., Elfarsdottir, A., McKeever, J., Jervis, D., Mahapatra, G., et al. (2022). Using satellites to uncover large methane emissions from landfills. Sci. Adv. 8, eabn9683. doi:10.1126/sciadv.abn9683
Masarie, K. A., and Tans, P. P. (1995). Extension and integration of atmospheric carbon dioxide data into a globally consistent measurement record. J. Geophys. Res. 100, 11593–11610. doi:10.1029/95JD00859
Massoud, E., Massoud, T., Guan, B., Sengupta, A., Espinoza, V., De Luna, M., et al. (2020). Atmospheric rivers and precipitation in the Middle East and north africa (MENA). Water 12, 2863. doi:10.3390/w12102863
McIntosh, J. C., Hendry, M. J., Ballentine, C., Haszeldine, R. S., Mayer, B., Etiope, G., et al. (2019). A critical review of state-of-the-art and emerging approaches to identify fracking-derived gases and associated contaminants in aquifers. Environ. Sci. Technol. 53, 1063–1077. doi:10.1021/acs.est.8b05807
McKay, C. P., Rask, J. C., Detweiler, A. M., Bebout, B. M., Everroad, R. C., Lee, J. Z., et al. (2016). An unusual inverted saline microbial mat community in an interdune sabkha in the Rub’ al Khali (the empty quarter), united Arab Emirates. PLoS One 11, e0150342. doi:10.1371/journal.pone.0150342
Meinshausen, M., Lewis, J., McGlade, C., Gutschow, J., Nicholls, Z., Burdon, R., et al. (2022). Realization of Paris Agreement pledges may limit warming just below 2⁰C. Nature 604, 304–309. doi:10.1038/s41586-022-04553-z
Metya, A., Datye, A., Chakraborty, S., Tiwari, Y. K., Patra, P. K., and Murkute, C. (2022). Methane sources from waste and natural gas sectors detected in Pune, India, by concentration and isotopic analysis. Sci. Total Environ. 842, 156721. doi:10.1016/j.scitotenv.2022.156721
Muntean, M., Maenhout, G.-J., Song, S., Giang, A., Selin, N. E., Zhong, H., et al. (2018). Evaluating EDGARv4.tox2 speciated mercury emissions ex-post scenarios and their impacts on modelled global and regional wet deposition patterns. Atmos. Environ. 184, 56–68. doi:10.1016/j.atmosenv.2018.04.017
Naizghi, M. S., and Ouarda, T. B. M. J. (2017). Teleconnections and analysis of long-term wind speed variability in the UAE. Int. J. Climatol. 37, 230–248. doi:10.1002/joc.4700
Nelli, N., Francis, D., Fonseca, R., Bosc, E., Addad, Y., Temimi, M., et al. (2022). Characterization of the atmospheric circulation near the Empty Quarter Desert during major weather events. Front. Environ. Sci. 10, 972380. doi:10.3389/fenvs.2022.972380
Nelli, N. R., Francis, D., Fonseca, R., Abida, R., Weston, M., Wehbe, Y., et al. (2021). The atmospheric controls of extreme convective events over the southern Arabian Peninsula during the spring season. Atmos. Res. 262, 105788. doi:10.1016/j.atmosres.2021.105788
Nelli, N. R., Temimi, M., Fonseca, R. M., Weston, M. J., Thota, M. S., Valappil, V. K., et al. (2020). Micrometeorological measurements in an arid environment: Diurnal characteristics and surface energy balance closure. Atmos. Res. 234, 104745. doi:10.1016/j.atmosres.2019.104745
Nisbet, E. G., Allen, G., Fisher, R. E., France, J. L., Dee, J. D., Lowry, D., et al. (2022). Isotopic signatures of methane emissions from tropical fires, agriculture and wetlands: The MOYA and ZWAMPS flights. Philosophical Trans. R. Soc. A Math. Phys. Eng. Sci. 380, 2215. doi:10.1098/rsta.20210112
Nisbet, E. G., Manning, M. R., Dlugokecky, E. J., Fisher, R. E., Lowry, D., Michel, S. E., et al. (2019). Very strong atmospheric methane growth in the 4 years 2014-2017: Implications for the Paris Agreement. Glob. Biogeochem. Cycles 33, 318–342. doi:10.1029/2018GB006009
NisbetDlugokencky, E. G. E. J., Manning, M. R., Lowry, D., Fisher, R. E., France, J. L., Michel, S. E., et al. (2016). Rising atmospheric methane: 2007-2014 growth and isotopic shift. Glob. Biogeochem. Cycles 30, 1356–1370. doi:10.1002/2016GB005406
Ouda, O. K. M., Raza, S. A., Nizami, A. S., Rehan, M., Al-Waked, R., and Korres, N. E. (2016). Waste to energy potential: A case study of Saudi Arabia. Renew. Sustain. Energy Rev. 61, 328–340. doi:10.1016/j.rser.2016.04.005
Peacock, M., Audet, J., Bastviken, D., Futter, M. N., Gauci, V., Grinham, A., et al. (2021). Global importance of methane emissions from drainage ditches and canals. Environ. Res. Lett. 16, 044010. doi:10.1088/1748-9326/abeb36
Peng, S., Giron, C., Liu, G., d’Aspremont, A., Benoit, A., Lauvaux, T., et al. (2023) High resolution assessment of coal mining methane emissions by satellite in Shanxi, China. Earth ArXiv. doi:10.31223/X5493W
Pignal, E. E., Rigby, R., and Cooper, T. (2020). Kayrros and Copernicus images allow quantification of global Methane leaks equivalent to 1.8 gigatons of CO2 emissions. Available at: https://www.businesswire.com/news/home/20200330005801/en/Kayrros-and-Copernicus-Images-Allow-Quantification-of-Global-Methane-Leaks-Equivalent-to-1.8-Gigatons-of-CO%C2%B2-Emissions (Accessed on September 21, 2022).
Prather, M. J., Holmes, C. D., and Hsu, J. (2012). Reactive greenhouse gas scenarios: Systematic exploration of uncertainties and the role of atmospheric chemistry. Geophys. Res. Lett. 39, L09803. doi:10.1029/2012GL051440
Puliafito, S. E., Berna, L., Lopez-Norena, A., Pascual, R., and Bolano-Ortiz, T. (2020). Atmospheric methane emissions for Argentina. Comparison with TROPOMI satellite measurements. in 2020 IEEE Latin American Geosciences and Remote Sensing Society (GRSS) & International Society for Photogrammetry and Remote Sensing (ISPRS) Remote Sensing Conference (LAGIRS). Santiago, Chile, 22-26 March 2020 IEEE, 527–532. doi:10.1109/LAGIRS48042.2020.9165602
Qureshi, A. S., and Ismail, S. (2017). “Prospects of agroforestry for the marginal environments: Evidences from the united Arab Emirates,” in Agroforestry: Anecdotal to modern science. Editors J. C. Dagar, and V. P. Tewari (Berlin, Germany: Springer Nature), 455–477.
Razavi, A., Clerbaux, C., Wespes, C., Clarisse, L., Hurtmans, D., Payan, S., et al. (2009). Characterization of methane retrievals from the IASI space-borne sounder. Atmos. Chem. Phys. 9, 7889–7899. doi:10.5194/acp-9-7889-2009
Ricaud, P., Sic, B., El Amraoui, L., Attie, J.-L., Zbinden, R., Huszar, P., et al. (2014). Impact of the Asian monsoon anticyclone on the variability of mid-to-upper tropospheric methane above the Mediterranean Basin. Atmos. Chem. Phys. 14, 11427–11446. doi:10.5194/acp-14-11427-2014
Rigby, M., Prinn, R. G., Fraser, P. J., Simmonds, P. G., Langengelds, R. L., Huang, J., et al. (2008). Renewed growth of atmospheric methane. Geophys. Res. Lett. 35, L22805. doi:10.1029/2008GL036037
Rosentreter, J. A., Borges, A. V., Deemer, B. R., Holgerson, M. A., Liu, S., Song, C., et al. (2021). Half of global methane emissions come from highly variable aquatic ecosystem sources. Nat. Geosci. 14, 225–230. doi:10.1038/s41561-021-00715-2
Rosentreter, J. A., Maher, D. T., Erler, D. V., Murray, R. H., and Eyre, B. D. (2018). Methane emissions partially offset “blue carbon” burial in mangroves. Sci. Adv. 4 (6), eaao4985. doi:10.1126/sciadv.aao4985
Saunois, M., Stavert, A. R., Boulter, B., Bousquet, P., Canadell, J. G., Jackson, R. B., et al. (2020). The global methane budget 2000-2017. Earth Syst. Sci. Data 12, 1561–1623. doi:10.5194/essd-12-1561-2020
Scarpelli, T. R., Jacob, D. J., Maasakkers, J. D., Sulprizio, M. P., Sheng, J.-X., Rose, K., et al. (2020). A global gridded (0.1° × 0.1°) inventory of methane emissions from oil, gas, and coal exploitation based on national reports to the United Nations Framework Convention on Climate Change. Earth Syst. Sci. Data 12, 563–575. doi:10.5194/essd-12-563-2020
Schaefer, H. (2019). On the causes and consequences of recent trends in atmospheric methane. Curr. Clim. Change Rep. 5, 259–274. doi:10.1007/s40641-019-00140-z
Schneider, M., Ertl, B., Tu, Q., Dickmann, C. J., Khosrawi, F., Rohling, A. N., et al. (2022). Synergetic use of IASI profile and TROPOMI total-column level 2 methane retrieval products. Atmos. Meas. Tech. 15, 4339–4371. doi:10.5194/amt-15-4339-2022
Schneising, O., Buchwitz, M., Burrows, J. P., Bovensmann, H., Bergamaschi, P., and Peters, W. (2009). Three years of greenhouse gas column-averaged dry air mole fractions retrieved from satellite - Part 2: Methane. Atmos. Chem. Phys. 9, 443–465. doi:10.5194/acp-9-443-2009
Schulze-Makuch, D., Lipus, D., Arens, F. L., Baque, M., Bornemann, T. L. V., de Vera, J.-P., et al. (2021). Microbial hotspots in lithic microhabitats inferred from DNA fractionation and metagenomics in the atacama desert. Microorganisms 9 (5), 1038. doi:10.3390/microorganisms9051038
Siddans, R., Knappett, D., Kerridge, B., Waterfall, A., Hurley, J., Latter, B., et al. (2017). Global height-resolved methane retrievals from the infrared atmospheric sounding interferometer (IASI) on MetOp. Atmos. Meas. Tech. 10, 4135–4164. doi:10.5194/amt-10-4135-2017
Spahni, R., Wania, R., Neef, L., van Weele, M., Pison, I., Bousquet, P., et al. (2011). Constraining global methane emissions and uptake by ecosystems. Biogeosciences 8, 1643–1665. doi:10.5194/bg-8-1643-2011
Sreenivas, G., Mahesh, P., Subin, J., Kanchana, A. L., Rao, P. V. N., and Dadhwal, V. K. (2016). Influence of Meteorology and interrelationship with greenhouse gases (CO<sub>2</sub> and CH<sub>4</sub>) at a suburban site of India. Atmos. Chem. Phys. 16, 3953–3967. doi:10.5194/acp-16-3953-2016
Stavert, A. R., Saunois, M., Canadell, J. G., Poulter, B., Jackson, R. B., Regnier, P., et al. (2021). Regional trends and drivers of the global methane budget. Glob. Change Biol. 28, 182–200. doi:10.1111/gcb.15901
Syed, F. S., Latif, M., Al-Maashi, A., and Ghulam, A. (2019). Regional climate model RCA4 simulations of temperature and precipitation over the arabian Peninsula: Sensitivity to CORDEX domain and lateral boundary conditions. Clim. Dyn. 53, 7045–7064. doi:10.1007/s00382-019-04974-z
Tazaz, A. M., Bebout, B. M., Kelley, C. A., Poole, J., and Chanton, J. P. (2013). Redefining the isotopic boundaries of biogenic methane: Methane from endo evaporites. Icarus 224, 268–275. doi:10.1016/j.icarus.2012.06.008
Teixido, O., Tobias, A., Massague, J., Mohamed, R., Ekaabi, R., Hamed, H. I., et al. (2021). The influence of COVID-19 preventive measures on the air quality in Abu Dhabi (United Arab Emirates). Air Qual. Atmos. Health 14, 1071–1079. doi:10.1007/s11869-021-01000-2
Temimi, M., Fonseca, R., Nelli, N., Weston, M., Thota, M., Valappil, V., et al. (2020). Assessing the impact of changes in land surface conditions on WRF predictions in arid regions. J. Hydrometeorol. 21, 2829–2853. doi:10.1175/JHM-D-20-0083.1
Tilstra, L. G., Tuinder, O. N. E., Wang, P., and Stammes, P. (2017). Surface reflectivity climatologies from UV to NIR determined from Earth observations by GOME-2 and SCIAMACHY. J. Geophys. Res. Atmos. 122, 4084–4111. doi:10.1002/2016JD025940
Tokhi, M., Amin, D. M., and Arman, H. (2016). Geochemical characters of the gabbroic rocks in ophiolite sequences of north Hatta area, united Arab Emirates. Acta Phys. Pol. A 130, 17–22. doi:10.12693/APhysPolA.130.17
Turner, A. J., Frankenberg, C., and Kort, E. A. (2019). Interpreting contemporary trends in atmospheric methane. Proc. Natl. Acad. Sci. U. S. A. 116, 2805–2813. doi:10.1073/pnas.1814297116
Valin, L. C., Russell, A. R., Buscela, E. J., Veefkind, J. P., and Cohen, R. C. (2011). Observation of slant column NO<sub>2</sub> using the super-zoom mode of AURA-OMI. Atmos. Meas. Tech. 4, 1929–1935. doi:10.5194/amt-4-1929-2011
Veefkind, J. P., Aben, I., McMullan, K., Forster, H., de Vries, J., Otter, G., et al. (2012). TROPOMI on the esa sentinel-5 precursor: A gmes mission for global observations of the atmospheric composition for climate, air quality and ozone layer applications. Remote Sens. Environ. 120, 70–83. doi:10.1016/j.rse.2011.09.027
Wang, B., Li, Y., and Bao, Y. (2022). Grazing alters sandy soil greenhouse gas emissions in a sand-binding area of the Hobq Desert, China. J. Arid Land 14, 576–588. doi:10.1007/s40333-022-0095-8
Wang, B., Liu, J., Zhang, X., and Wang, C. (2021). Changes in soil carbon sequestration and emission in different succession stages of biological soil crusts in a sand-binding area. Carbon Balance Manage 16 (27), 27. doi:10.1186/s13021-021-00190-7
Wang, M. Z., Lu, H., Ming, H., and Zhang, J. (2016). Vertical structure of summer clear-sky atmospheric boundary layer over the hinterland and southern margin of Taklamakan Desert. Meteorol. Appl. 23, 438–447. doi:10.1002/met.1568
Wehbe, Y., Ghebreyesus, D., Temimi, M., Milewski, A., and Al Mandous, A. (2017). Assessment of the consistency among global precipitation products over the United Arab Emirates. J. Hydrology Regional Stud. 12, 122–135. doi:10.1016/j.ejrh.2017.05.002
Wehbe, Y., Temimi, M., and Adler, R. F. (2020). Enhancing precipitation estimates through the fusion of weather radar, satellite retrievals and surface parameters. Remote Sens. 12, 1342–42. doi:10.3390/rs12081342
Wehbe, Y., Temimi, M., Ghebreyesus, D. T., Milewski, A., Norouzi, H., and Ibrahim, E. (2018). Consistency of precipitation products over the Arabian Peninsula and interactions with soil moisture and water storage. Hydrological Sci. J. 63, 408–425. doi:10.1080/02626667.2018.1431647
Weston, M., Temimi, M., Burger, R., and Piketh, S. (2021). A fog climatology at Abu Dhabi international airport. J. Appl. Meteorology Climatol. 60, 223–236. doi:10.1175/JAMC-D-20-0168.1
Wolfe, R. E., Lin, G., Nishihama, M., Tewari, K. P., Tilton, J. C., and Isaacman, A. R. (2013). Suomi NPP VIIRS prelaunch and on-orbit geometric calibration and characterization. J. Geophys. Res. Atmos. 118, 11508–11521. doi:10.1002/jgrd.50873
Worden, J. R., Bloom, A. A., Pandey, S., Jiang, Z., Worden, H. M., Walker, T. W., et al. (2017). Reduced biomass burning emissions reconcile conflicting estimates of the post-2006 atmospheric methane budget. Nat. Commun. 8, 2227. doi:10.1038/s41467-017-02246-0
Wunch, D., Toon, G. C., Blavier, J.-F. L., Washenfelder, R. A., Notholt, J., Connor, B. J., et al. (2011). The total carbon column observing network. Philosophical Trans. R. Soc. A, Math. Phys. Eng. Sci. 369, 2087–2112. doi:10.1098/rsta.2010.0240
Yokota, T., Yoshida, Y., Eguchi, N., Ota, Y., Tanaka, T., Watanabe, H., et al. (2009). Global concentrations of CO2 and CH4 retrieved from GOSAT: First preliminary results. Sci. Online Lett. Atmos. 5, 160–163. doi:10.2151/sola.2009-041
Zhang, Y., Jacob, D. J., Lu, X., Maasakkers, J. D., Scarpelli, T. R., Sheng, J.-X., et al. (2021). Attribution of the accelerating increase in atmospheric methane during 2010-2018 by inverse analysis of GOSAT observations. Atmos. Chem. Phys. 21, 3643–3666. doi:10.5194/acp-21-3643-2021
Keywords: greenhouse gas, global warming, methane, TROPOMI, CAMs, Arabian Peninsula
Citation: Francis D, Weston M, Fonseca R, Temimi M and Alsuwaidi A (2023) Trends and variability in methane concentrations over the Southeastern Arabian Peninsula. Front. Environ. Sci. 11:1177877. doi: 10.3389/fenvs.2023.1177877
Received: 02 March 2023; Accepted: 15 May 2023;
Published: 24 May 2023.
Edited by:
Tirthankar Banerjee, Banaras Hindu University, IndiaReviewed by:
Supriyo Chakraborty, Indian Institute of Tropical Meteorology (IITM), IndiaPlamen Trenchev, Space Research Institute at the Bulgarian Academy of Sciences, Bulgaria
Copyright © 2023 Francis, Weston, Fonseca, Temimi and Alsuwaidi. This is an open-access article distributed under the terms of the Creative Commons Attribution License (CC BY). The use, distribution or reproduction in other forums is permitted, provided the original author(s) and the copyright owner(s) are credited and that the original publication in this journal is cited, in accordance with accepted academic practice. No use, distribution or reproduction is permitted which does not comply with these terms.
*Correspondence: Diana Francis, ZGlhbmEuZnJhbmNpc0BrdS5hYy5hZQ==