 Anna Serra-Llobet1*†
 John Radke1,2,3
 G. Mathias Kondolf2
 Larry Gurrola4
 J. David Rogers4,5
 Sarah Lindbergh2
 Johnny Douvinet6,7
- 1Center for Catastrophic Risk Management, Social Science Matrix, University of California Berkeley, Berkeley, CA, United States
- 2Department of Landscape Architecture and Environmental Planning, Berkeley, CA, United States
- 3City and Regional Planning, University of California Berkeley, Berkeley, CA, United States
- 4The Project for Resilient Communities, Montecito, CA, United States
- 5Department of Geosciences and Geological and Petroleum Engineering, Missouri University of Science and Technology, Rolla, MO, United States
- 6Department of Geography, University of Avignon, UMR ESPACE 7300 CNRS, Avignon, France
- 7Institut Universitaire de France, Paris, France
Historical information about floods is not commonly used in the US to inform land use planning decisions. Rather, the current approach to managing floods is based on static maps derived from computer simulations of the area inundated by floods of specified return intervals. These maps provide some information about flood hazard, but they do not reflect the underlying processes involved in creating a flood disaster, which typically include increased exposure due to building on flood-prone land, nor do they account for the greater hazard resulting from wildfire. We developed and applied an approach to analyze how exposure has evolved in flood hazard zones in Montecito, California, an area devastated by post-fire debris flows in January 2018. By combining historical flood records of the past 200 years, human development records of the past 100 years, and geomorphological understanding of debris flow generation processes, this approach allows us to look at risk as a dynamic process influenced by physical and human factors, instead of a static map. Results show that floods after fires, in particular debris flows and debris laden floods, are very common in Montecito (15 events in the last 200 years), and that despite policies discouraging developments in hazard areas, developments in hazard zones have increased substantially since Montecito joined the National Flood Insurance Program in 1979. We also highlight the limitation of using conventional Flood Insurance Rate Maps (FIRMs) to manage land use in alluvial fan areas such as Montecito. The knowledge produced in this project can help Montecito residents better understand how they came to be vulnerable to floods and identify action they are taking now that might increase or reduce their vulnerability to the next big flood. This science-history-centric approach to understand hazard and exposure evolution using geographic information systems (GIS) and historical records, is generalizable to other communities seeking to better understand the nature of the hazard they are exposed to and some of the root causes of their vulnerabilities, in other words, both the natural and social processes producing disasters.
1 Introduction
After a severe flood in Boulder, Colorado, in 1994, Gilbert F. White, renown flood expert and Director of the Natural Hazards Center at the University of Colorado, proposed a template with which communities could record the effects of the flood but also to reflect on decisions that had made the community vulnerable, the “Boulder Creek Flood Notebook” (White, 1994). The purpose was so that “the citizens of Boulder may be helped to understand how their community came to be vulnerable to the flood, and the kinds of decisions that may either reduce or enlarge the human consequences of the next large flood.”
While the concept might strike one as an obvious thing to do—to learn from the past, to avoid building/rebuilding in harms’s way—in fact it would be a revolutionary approach to flood management in the US, where, unlike many countries in Europe, historical information is commonly overlooked in assessing flood risk (Keller and Capelli, 1992; Serra-Llobet et al., 2022), in deference to standardized hydraulic models. Historical information on floods includes historical maps, drawings, photographs, and historical accounts (both formal records and informal journals, correspondence, or press accounts) (Grabowski and Gurnell, 2016). Field evidence (such as mud marks on trees and buildings, sediment deposited on structures and property, debris jams, damage to trees and buildings) can provide valuable information on past floods, but the extent, availability, and quality of this kind of information tends to decline rapidly after the flood. In favorable settings, techniques such as stratigraphic analysis of slackwater deposits can extend the record of major floods back centuries or even millenia (Patton et al., 2020). Adding to this, recognizing the spatial context of extreme events, such as recent wildfires, can provide insights into changes such as impacted vegetation and soils, which can influence the dynamic of a flood.
1.1 A process-based approach to analyze flood risk
Flood risk management infrastructure comprises not only the physical components (levees, dams, engineered channels) but also the natural elements in the landscape (riparian habitat, wetlands, areas of channel migration), and the social and institutional elements (land-use planning, insurance, emergency management, public education). The design, development, and sustainability of flood risk management infrastructure is deeply conditioned by the way we conceptualize risk. “Risk” is conceptualized in conventional flood control as a near static condition, as reflected in infrequently changing maps showing the “Special Flood Hazard Area”, the regulatory flood prone area in the US. In reality, flood risk is dynamic and evolving—both in response to changes in hazard (natural and physical processes producing floods, including land use changes, the performance of flood “control” infrastructure, or climate change) and, more importantly, changes in vulnerability (human factors), for example changes in exposure (e.g., further development on flood-prone lands), resistance (the capacity to withstand a flood event) or resilience (the capacity to cope with, recover and adapt after a flood). But human vulnerability to hazards is not only related the “physical vulnerability” (e.g., the structure of the building impacted), but also to aspects related to the “social vulnerability” (socio-demographic variables, e.g., elderly or disabled people) (Rufat et al., 2015), “institutional vulnerability” (e.g., policy constraints, lack of information transfer, organizational problems during the emergency management) (Cho and Chang, 2017), or “procedural vulnerability”, meaning historical processes that have increased the vulnerability of certain communities (e.g., racism, classism) (Rivera et al., 2021). The different components of vulnerability, in all its dimensions, are constantly changing as a result of local and global social, economic and political pressures. (Figure 1). Depending on how we manage the different components of risk, the combination of vulnerability and hazard may (or may not) become a disaster.
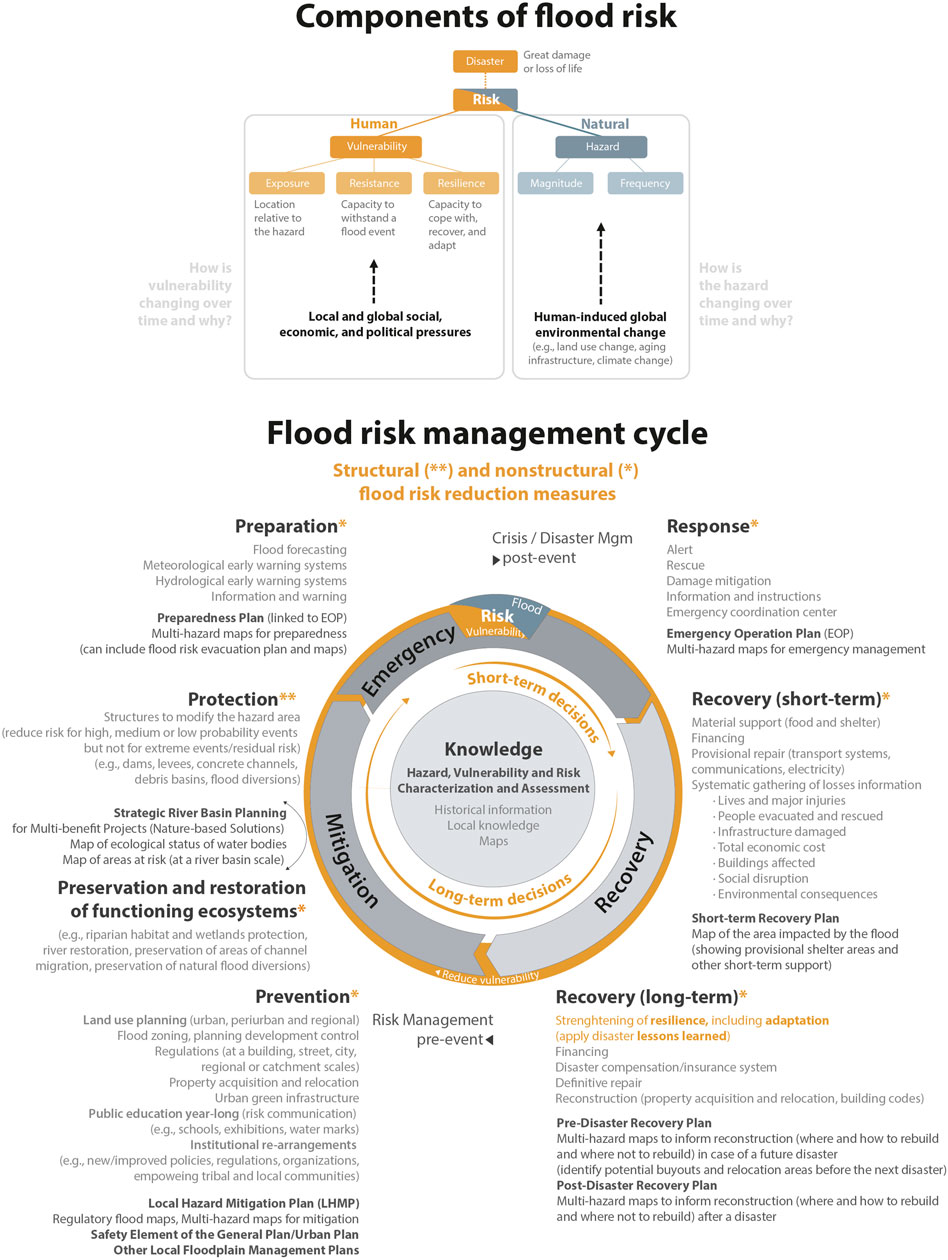
FIGURE 1. An integrated view of flood risk and key research questions (source: modified from Pelling, 2001) (top), and flood risk management cycle showing different flood risk reduction measures (bottom).
Figure 2 shows different conceptualizations of risk, the current “form-based approach” (left) to risk (e.g., thinking about risk as a hazard or risk map) versus an approach that recognizes “risk as a process” (right). On one side, a form-based, static map depicts the area modeled to be inundated by a given return interval of flood (in the US, usually the 100-year flood). This area is, in some countries, used for regulatory purposes, and it is sometimes further divided into different zones each with its own implications for insurance, building codes, emergency management, risk communication, etc. (Serra-Llobet et al., 2022). These “official” maps typically do not depict assets that are exposed to floods (e.g., buildings), aging infrastructure (e.g., levees) or the residual hazard area. Rather the focus is entirely on the “official” hazard area, in the case of the US, the ‘Special Flood Hazard Area’. On the other side, a process-based approach (Figure 2 right) views flood risk as the result not only of hazard but also vulnerability (including exposure and other social factors) (Hewitt, 1997; Pelling, 2001), which is constantly evolving as new houses are built on flood-prone lands, new flood control infrastructure is built, as wildfire control strategies are adopted, etc.
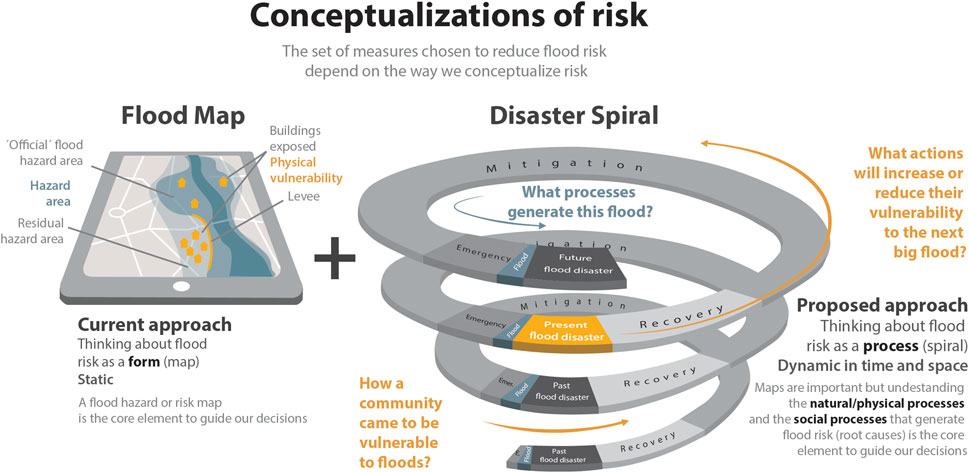
FIGURE 2. Conceptualizations of flood risk: “Form-based” approach (left) versus “Process-based” approach (right).
The emergence of social attribution to disaster risk reduction (DRR) from the DRR school, also called “human ecology”, had three important phases in western environmental sciences. The first phase was the “human adjustment” approach to flood management outlined by Gilbert F. White in the 1930s–1940s (Hass and White, 1975). This approach was augmented in the 1970s and 1980s by efforts to take the “naturalness” out of natural disasters (O’Keefe et al., 1976; Hewitt, 1983). Finally, this approach was mainstreamed in the 1990s and early 2000s with the “pressure-and-release” (PAR) vulnerability model from the human ecology school in the US, first developed by Wisner et al., in 1994 (Adger, 1996; Cutter, 1996; Wisner et al., 2004, 2012; Tierney, 2014) and is now widely used in United Nations disaster risk reduction and climate adaptation reports (IPCC, 2007, 2014, 2022; UNISDR, 2015). The PAR model was designed to identify the progression of vulnerability looking through the links of “root causes” and “dynamic pressures” that create “fragile livelihoods” or “unsafe location conditions” which, when intersected in time and space with hazards, provide a chain of explanation to disaster risk. By understanding the links that feed into these dynamic pressures of vulnerability, we can also develop methods to “reverse-engineer” the process and introduce coping or resilience capacities and “release the pressures”. PAR functions as a process-tracing inquiry system to understand risk by emphasizing the vulnerability component, thus expanding on socioeconomic, ideological, cultural, political, and historical processes.
The “process-based approach” presented in this paper goes one step further, by applying an approach that aims to complement this framework by not only better understanding the human drivers that increase vulnerability, what we call the “social processes”, but also the “natural and physical processes” that generate a flood (eg., what is alluvial fan flooding? What are the beneficial aspects of flooding? What are the compound hazards associated with alluvial fan flooding? How do fires affect this type of flooding? How is climate change impacting the frequency and magnitude of this type of flooding? How do the fluid dynamics of this type of flooding changes when it intersects the built environment? What is the residual risk associated with debris basin overtopping?). To understand our risk, we must understand the social drivers of vulnerability but also the nature of flooding to inform effective management response. Different types of flooding require different risk reduction measures. For example, a dam might reduce the risk of riverine flooding in downstream settlements, but will not help if we are dealing with pluvial flooding generated by local rain.
Furthermore, current maps fail to account for historical processes and the increasing threat of climate change, projected population changes, aging infrastructure, flood-control infrastructure investments, and their implications for inequity. Flood maps are necessary for flood risk management. A process-based approach acknowledges the need for improved flood mapping but it can be better visualized as a flood disaster spiral, emphasizing the notion of time and constant change (Figure 2 right). A spiral getting bigger represents future flood risk getting bigger, as happens when societal action increases exposure and/or other aspects of vulnerability (such as allowing new development in the path of hazardous flooding) and/or flood hazard (such as land-use change that accelerates runoff). On the other side, if the spiral gets smaller, that represents the risk getting smaller because societal action reduces exposure and/or other aspects of vulnerability and/or flood hazard. This can be linked to the idea of resilience. When a society is able to cope with, recover and adapt from a flood in an equitable and environmentally sustainable way the spiral gets smaller (flood risk is reduced) and the community, and future generations, are more resilient (Figure 3).
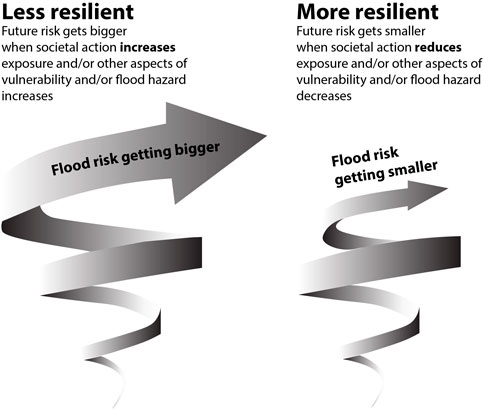
FIGURE 3. Disaster spiral in relation to resilience.
A process-based approach emphasizes the need to better understand the type of hazard the community is exposed to (natural and physical processes) but also how exposure and vulnerability may be increasing due to land-use decisions and other choices. Understanding how and why risk is changing over time, as a result of decisions made in the floodplain over time, can help us understand how a community came to be vulnerable to floods, the root causes (social processes) that explain why exposure, and vulnerability in general, is increasing.
Debris flows cause significant damage and fatalities in the US (NRC, 2004) and throughout the world (Dowling and Santi, 2014). In January 2018, a series of debris flows claimed 23 lives in Montecito, California. These debris flows have been examined by researchers from a range of disciplines. Most papers and reports published on the events either look at the physical processes (Kean, 2019; Keaton, 2019; Alessio et al., 2021), the emergency management aspects (Goto et al., 2021) and short-term consequences (Keller et al., 2020a; Keller et al., 2020b; Goto et al., 2021), but not the processes that encouraged development in hazardous areas over recent decades.
In this paper we emphasize seeing risk as a process (White, 1945; Hewitt, 1997) using the community of Montecito as a case study. In Section 2 we describe the method we used to analyze: 1) how flood hazard has evolved over time in Montecito and why (by analyzing scientific data and historical information on floods over the last 200 years), and 2) how the physical vulnerability evolved over time and why (by quantifying the increase of exposure in flood hazard areas over the last 100 years and analyzing historical records and local plans). We also consider the limitations of using conventional Flood Insurance Rate Maps (FIRMs) to manage land use in alluvial fan areas such as Montecito. The results are presented in Section 3.
Our goal is to develop an approach that is transferable to other locations, and that recognizes risk as a dynamic process, co-produced by the natural processes that generate floods and the social processes that lead to human exposure and vulnerability (Wisner et al., 2004). In the spirit of Gilbert F. White’s (1994) Boulder Creek Flood Notebook, this study provides insights into how the community of Montecito came to be vulnerable to floods through steadily increasing exposure in high hazard zones and how some residents did not understand the nature of their hazard. Our hope is that this paper can promote the understanding of how future land-use decisions may either reduce or increase the human consequences of the next large flood.
1.2 Study area
Montecito, an unincorporated community in Santa Barbara County with 8,600 inhabitants, is built on alluvial fans also referred to as debris fans, sloping southward from the front of the Santa Ynez Mountains down to the gently-sloping coastal plain of the Pacific Ocean (Figure 4). Between the steep Santa Ynez Mountains and the coast sits a forested upland, a wide swath of urbanized areas, traversed by north-south trending creeks and east-west trending Highways 101 and 192. Debris flows after wildfires are common in Southern California (Keller et al., 2020b).
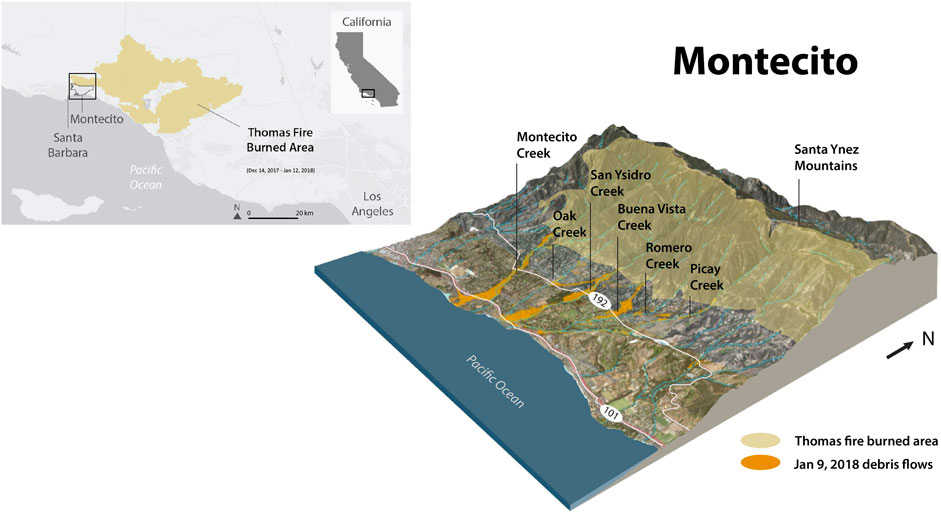
FIGURE 4. Location map and 3-D model of the community of Montecito showing area burned by the Thomas wildfire and the area impacted by the 9 January 2018 Montecito debris flows.
On 9 January 2018, intense rains over the recently burned catchments of Santa Ynez Mountains in Montecito, California, triggered debris flows (Oakley et al., 2018), leading to 23 fatalities (Lancaster et al., 2021), 167 injuries (Diskin, 2020), and 558 buildings damaged (CAL FIRE, 2018), and over a billion dollars in debris removal costs and damages to homes and infrastructure (Lancaster et al., 2021). The debris flows were generated on lands recently burned by the Thomas Fire, the biggest fire recorded in California to that date, which burned 1,140 km2 in Santa Barbara and Ventura Counties over the prior month (Diskin, 2020). The denuded slopes and impermeable soils resulting from the fire, together with intense precipitation, produced the debris flows (Keller et al., 2020b; Kean et al., 2019).
2 The history informed hazard planning (HIHP) approach
We developed a process-based approach to analyze flood risk based on answering two main sets of questions: 1) How a community came to be vulnerable to floods, and what actions will increase or reduce their vulnerability to the next big flood? and 2) How is hazard evolving in this community and why, and how is vulnerability evolving in this community and why? We have focused our efforts on better understanding the physical and human factors that have been modifying the risk of floods after fire in Montecito over the last 200 years, the period for which we have historical records. The specific data and methods to answer each of the sub questions related to the analysis of historical and scientific records and information related to future projections are detailed in Figure 5.
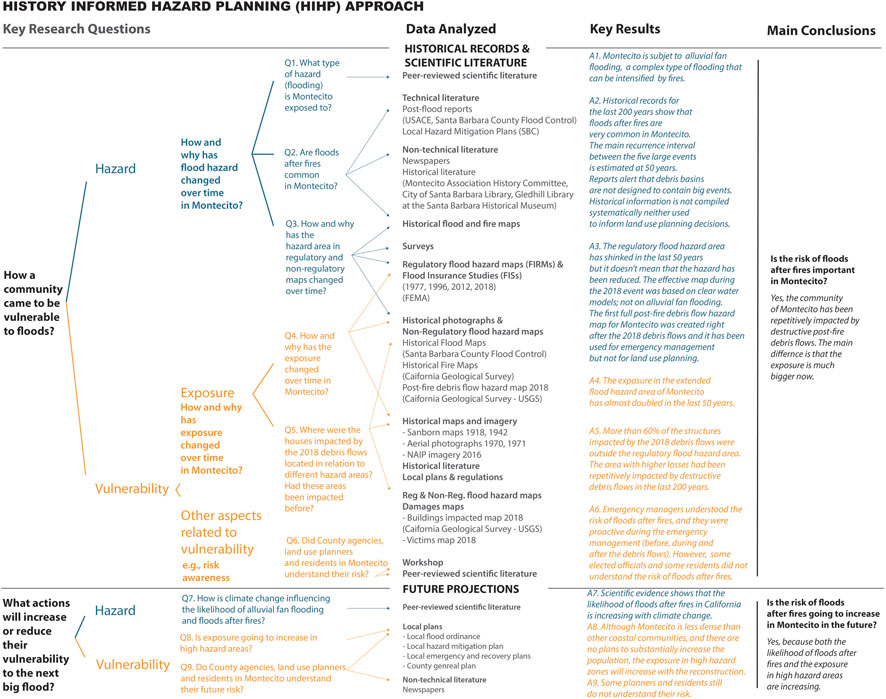
FIGURE 5. History informed hazard planning (HIHP) approach.
2.1 How did the community of Montecito become vulnerable to floods?
2.1.1 How has flood hazard changed over time in Montecito and why?
• What type of flooding is Montecito exposed to?
To answer this question, we compiled peer-reviewed scientific literature on the impacts of floods after fires, and we created a comprehensive diagram to explain the different processes and different types of flooding that affect alluvial fans in the region.
• Are floods and fires common in Montecito?
Drawing upon data compiled by Gurrola and Rogers (2022a), we assessed the occurrence, intensity, and frequency of events over the last 200 years (e.g., extent of inundation, reconstructed flows paths, and classification of events as debris flows, debris laden floods and “clear water floods”). We also inventoried landslide dam outbreak floods over this period, resulting in a record of outbreak floods, debris flows, and debris-laden floods. We recorded details of the floods and debris flows such as area affected, type of flood, type of damage, and relative magnitude. We drew upon technical literature such as fire and post-flood reports by U.S. Army Corps of Engineers (1965, 1974, 2018) and County agencies (Santa Barbara County Flood Control District, 1974; Santa Barbara County Flood Control and Water Conservation District, 1995; Santa Barbara County, 2018), non-technical literature such as newspaper accounts, local historical literature, and archives from the Montecito Association History Committee, City of Santa Barbara Library, and the Gledhill Library at the Santa Barbara Historical Museum. We used historical maps, surveys, and Sanborn insurance maps (early-mid 20th century) to evaluate extent of inundation and to reconstruct flows paths of past events. We also compiled data on historical wildfires occurring within a 5-year period prior to debris flows and debris laden flood events over the last 200 years. In total, Gurrola and Rogers (2022a) reviewed some 320 documents including maps, peer-reviewed scientific articles, reports and historical records to assemble a chronological record.
• How has the hazard area in regulatory and non-regulatory maps changed over time and why?
To document how official FEMA flood hazard maps have evolved over time, we compiled, georectified and digitized the first flood hazard map created for Montecito, the Flood Hazard Boundary Map (FHBM) produced by the Federal Insurance Administration in 1977, and the 1996 Flood Insurance Rate Map, FIRM produced by the Federal Emergency Management Agency (FEMA), so we could overlay digital maps from 2012 to 2018 (the current “effective FIRM”), as well as the FEMA recovery map created in 2018 for the reconstruction process after the January 2018 debris flows. We delineated an extended flood hazard area for Montecito beyond the current Special Flood Hazard Area by overlaying all the FEMA maps over time (going back to the original one in 1977) with the map of the 2018 debris flows footprint (California Geological Survey - US Geological Survey, 2018) (Figure 6).
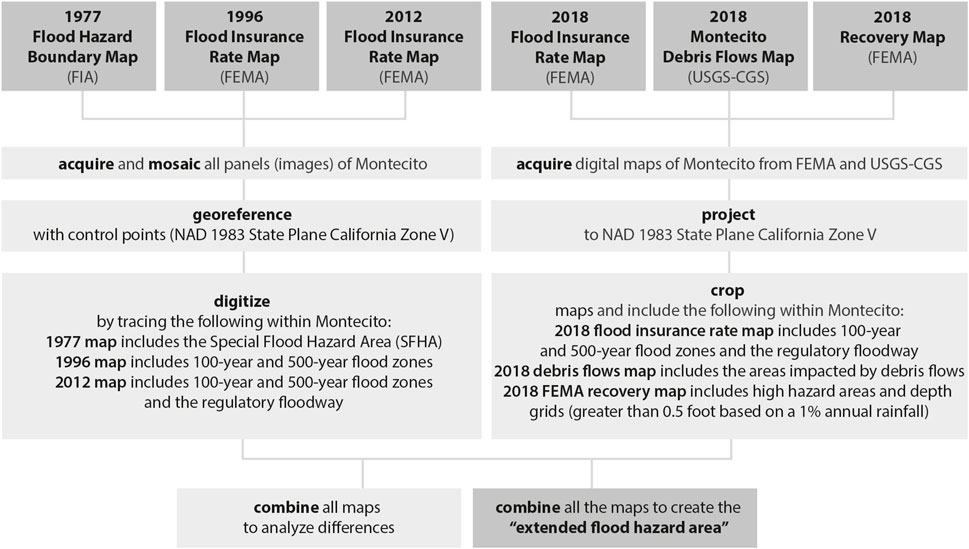
FIGURE 6. Steps to create the extended flood hazard area (overlay of FEMA maps produced over the last 50 years and the 2018 debris flows footprint).
2.1.2 How has exposure changed over time in Montecito and why?
Our hypothesis is that despite policies discouraging developments in flood hazard areas, exposure increased significantly not only outside, but also inside the current regulatory flood hazard area (called the Special Flood Hazard Area or SFHA), even after Montecito joined the National Flood Insurance Program (NFIP) in 1979. To test this hypothesis, we compiled and analyzed information on hazard and exposure.
• How has exposure changed over time?
We analyzed how exposure has changed by quantifying the exposure evolution in this extended flood hazard area using Sanborn (Fire) Insurance Maps from 1918 to 1942 (which provide detailed locations of structures at the time), aerial imagery from 1970 to 1971, National Agriculture Imagery Program (NAIP) Imagery from 2016 (US Department of Agriculture, USDA), and a GIS data layer with the structures (buildings) from 2016 provided by Santa Barbara County (Figure 7).
• Why has exposure changed over time?
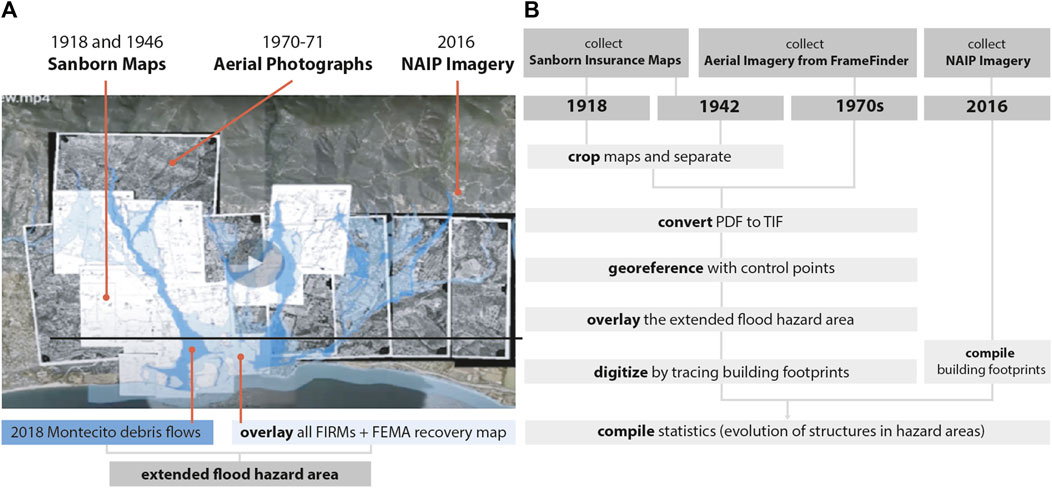
FIGURE 7. Image showing: (A) the extended flood hazard area (overlay of FEMA maps produced over the last 50 years and the 2018 Montecito debris flows footprint), and the material used to analyze the evolution of the exposure over time, and (B) the steps followed to georectify and digitize historical documents and quantify the evolution of structures in hazard areas of Montecito.
We analyzed historical literature and local land use plans and regulations to understand why exposure has changed over time.
• Where were the buildings impacted by the 9 January 2018 debris flows located in relation to different hazard areas?
We compared the pattern of damage and loss of life from the January 2018 debris flows (California Geological Survey, 2018) to areas previously included in hazard areas designated on regulatory maps.
• Had these areas been impacted before?
To see if the areas affected in 2018 had been previously affected by debris flows or flash flooding, we reviewed technical post-flood reports, non-technical literature (newspaper accounts, historical literature) and historical flood maps.
2.1.3 Other aspects of vulnerability
• Do emergency management professionals understand the risk of post-fire debris flows?
To answer this question, we reviewed documents related to the 2018 Montecito debris flow, including official reports and peer-reviewed literature, and we organized a workshop at the University of California Berkeley at which emergency managers, floodplain managers from Montecito, scientists from engineering, geomorphology, natural and social sciences and experts from California Geological Survey shared experiences.
2.2 What actions will increase or reduce vulnerability to the next big flood?
We reviewed published studies on potential impacts of climate change on the frequency and extent of wildfires and thus on the likelihood of floods after fires, i.e., an increase in hazard. Through a policy review (with focus on the National Flood Insurance Program), analysis of the local flood ordinance, local hazard mitigation, emergency management, and recovery plans, as well as a review of the Santa Barbara General Plan, we assessed the likelihood that exposure will increase in high hazard areas in the future.
3 Results
3.1 How a community came to be vulnerable to floods?
3.1.1 Why has exposure changed over time in Montecito?
Native Americans occupying the coastal region of California, later to be referred as the Barbareno Chumash, were the first human occupants in the Santa Barbara area, dating back as far as 8,000 years before present (City of Santa Barbara Planning Division, 1999). During Juan Rodriguez Cabrillo’s exploration of the Alta California coastline to claim the lands for Spain, Cabrillo sailed through the Santa Barbara Channel. He made the first contact with the Native Americans on the Channel Islands in 1542 (City of Santa Barbara, 2018). Decades later in 1602, Sebastian Vizcaino visited Santa Barbara and surveyed the coastline designating the name, Santa Barbara for the area (City of Santa Barbara, 2018). Subsequently, the government of Spain sent explorers to establish Presidios and Missions along the Alta California coast with Gaspar de Portola leading the expedition. Portola described encounters with a number of Chumash villages during his journey along the Alta California coast in 1769, in what are now Carpinteria, Montecito and Santa Barbara (Myrick, 1987).
The Santa Barbara Presidio was the first Spanish settlement in 1782, located in the upland area in Santa Barbara (City of Santa Barbara, 2018), and Santa Barbara Mission was established in 1784 near the banks of Mission Creek. The Spanish referred to the Chumash village of Shalawa (aka Salaguas) on the Montecito coast just west of the mouth of Montecito Creek as Ranchería San Bernadino (Geiger, 1965). The Spanish also named the valley of Montecito, El Montecito, which means the little hinterland, the little pastureland, and the little woods (Geiger, 1965). There were 62 Native Americans reported living in El Montecito in 1796 (Myrick, 1987). During this time, the population of Chumash was largely decimated by the introduction of European diseases by Spanish explorers (Santa Ynez Band of Chumash Indians, 2020).
The Presidio attracted men and their families from Mexico arriving to work at the Presidio. In lieu of pensions, soldiers of the Presidio were given parcels of land in Montecito. Most chose to live along the banks of Montecito Creek, a source of water and fish, and the settlement along the creek (near present-day Parra Grande and East Valley Road) became known as Spanishtown. While some soldiers chose to settle on Romero Hill (Myrick, 1987), many chose to settle in Spanishtown with its creekside amenities, despite its flood hazard.
As a result of the independence of Mexico from Spain in 1822, the Mexican secularization of the missions in 1834 broke up vast land holdings into ranchos and land grants to presidio soldiers and settlers (California Missions Foundation, 2020). In 1850, California was incorporated as the 31st state and the County of Santa Barbara was one of 27 original counties formed at the time of statehood (California Department of Parks and Recreation, 2020).
The second half of the nineteenth century was a period of systematic killing of native peoples in California, where official records document public expenditures exceeding $1.7 million on campaigns to kill California Indians and seize their land (Madley, 2016). With the availability of the resulting cheap land, European settlers were attracted to various parts of the state, including Montecito.
From the 1850s to the 1870s, cheap land attracted two types of immigrants: land speculators and farmers (Myrick, 1987). The City of Santa Barbara inherited considerable “Pueblo Lands”, particularly outside of the city and stretching all the way to Carpinteria Creek (Myrick, 1987). The City encouraged development of this area and individuals could petition the City’s Common Council for a desired parcel, and for a very small fee, one could claim large parcels of land up to 40 acres (Myrick, 1987).
The Great Register of 1866–1869 accounted for 47 voters residing in Montecito with 24 Spanish residents, 17 residents born in the eastern states, and six residents from Europe (Myrick, 1987). By the late 1870s to early 1880s, affluent eastern settlers became “gentlemen farmers” who were enthusiastic horticulturalists farming citrus, fruit, decorative trees, plants and flowers (Montecito Association History Committee, 2020). Small farms of 15–50 acres with praiseworthy farmhouses and elegant residences surrounded by colorful gardens and productive orchards dotted the Montecito landscape (Myrick, 1987). The arrival of the Southern Pacific Railroad in 1887 and the introduction of electricity to the area attracted many immigrants, which inflated land prices. The Montecito Land Company (1887), the first land development company, set out to develop roads, subdivide land, and to promote lot sales (Myrick, 1987).
The Golden Age of the Great Estates began in the 1920s, but the lack of a reliable source of water was a real hindrance to development (Myrick, 1987). Domestic water was an individual matter, or at best, small cooperative groups were formed to serve small areas. Many wells and horizontal wells were drilled, small reservoirs built, and water companies formed. However, the development of Juncal Dam on the upper Santa Ynez River about 10 km northeast of Montecito, and drilling of the Doulton tunnel to bring water to Montecito accelerated the population growth in the 1920s. The Sanborn Map Company reported a population of 2,500 in Montecito in 1918, which increased to 3,000 in 1940 (Sanborn Map Company, 1918, Sanborn Map Company, 1940).
According to a history compiled by the Santa Barbara Board of Realtors (1980), during this period of rapid growth in the mid-20th century, some Montecito residents were victims of a scam in which construction would begin on an objectionable house on a small lot adjacent to a large estate, forcing the estate owner to pay premium prices for the title to the offending projects. At the request of Montecito property owners, the state legislature passed the Planning and Enabling Act in 1929 to allow communities such as Montecito to restrict development and set minimum lot sizes. Residents rallied together to pass a county zoning ordinance, the first in California history, enabling the community to restrict lot sizes, lot splits, and allowing no development on lots less than one acre (Santa Barbara Board of Realtors, 1980). The Montecito Protective and Improvement Association was formed in 1948 to prohibit sidewalks, concrete curbs and gutters, and other unsightly threats to the rural look of Montecito (Santa Barbara Board of Realtors, 1980). The population of Montecito was reported as 9,500 in 1980, however the population in 2010 reduced to 9,000 and in 2020, declined to 8,600 (Santa Barbara Board of Realtors, 1980; United States Census, 2010; World Population Review, 2020).
3.1.2 How has flood hazard changed over time in Montecito and why?
• What type of flooding is the community of Montecito exposed to?
In the US, the regulatory flood hazard area is termed “Special Flood Hazard Area” (SFHA) and is depicted on Flood Insurance Rate Maps (FIRMs) created by the Federal Emergency Management Agency (FEMA). The SFHA is delineated based on hydraulic models that assume riverine (fluvial) and coastal flooding. It is within the SFHA that the NFIP’s floodplain management regulations related to land use planning and building codes must be enforced. This is also the area where the mandatory flood insurance purchase requirement applies. One important limitation of using FIRMs to manage land use in Montecito is that these maps are made using tools developed for riverine flooding, assuming there is a floodplain, which floods when the adjacent river tops its banks. However, Montecito is built on alluvial fans, which are essentially cones of sediment transported down from the mountains and deposited on the plain, as the gradient decreases. The channels on alluvial fans are flowing down these cones, building elevation through sediment deposition, and thus the channel itself is typically higher in elevation than the surrounding fan surface. Thus, if the channel overtops, it can flows across the surface away from the original channel (often reoccupying former channels). This frequent switching of channels is termed ‘avulsion’. FIRMs are based on simple 1-D (one-dimensional) or 2-D (two-dimensional) hydraulic models that are not designed to capture the complexities of alluvial fan flooding. Moreover, alluvial fan floods are highly charged with sediment, and can include debris flows and debris laden floods (Church and Jakob, 2020). However, the models upon which the FIRMs are based assume clear water and cannot simulate debris flows and debris floods. In sum, FIRMs are based on models and assumptions that don’t capture the complexity of alluvial fan behavior, such as avulsion and debris flows.
Alluvial fan flooding is a complex type of flooding. Depending on the amount of sediment and debris transported in the fluid we can have very different types of flooding in alluvial fans, and in order of increasing hazard: flash floods, mudflows, debris laden floods, and debris flows (Figure 8).
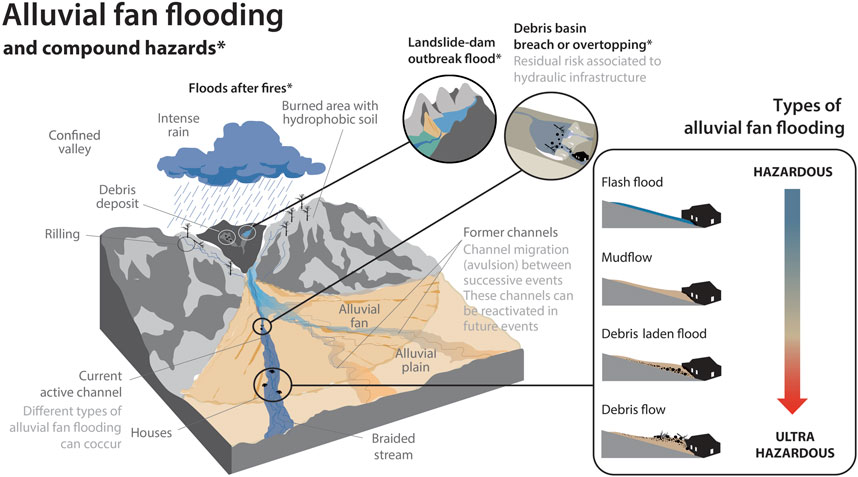
FIGURE 8. Alluvial fan flooding and processes related to floods after fires.
Flash floods are short-lived floods that occur with little warning, and produce raging torrents in a short time period during a precipitation event. It is important to distinguish between “mudslide” and “mudflow”. Both are general terms, often (mis)used by media to describe a range of landslide processes, debris flows, earthflows, and floods that deposit mud in communities and roads (Keaton, 2019). A mudslide is a poorly defined term that denotes a translational or rotational (land)slide with the consistency of mud. Mudflows are non-Newtonian fluid flows, meaning that the water is not the transporting fluid. Rather the transporting fluid is flowing mud. Mudflows (as well as debris laden floods and debris flows) follow preexisting channels and can transport small debris.
During an intense rainstorm, a slurry of sediment-charged water can be generated by extensive rill erosion of hillslope colluvium, which can enter channel networks, leading to the mobilization of dry ravel (individual particles moved down-slope by rolling, sliding, and bouncing) and boulder-rich sediment, previously supplied by colluvial and debris-flow processes (Kean et al., 2019; Lancaster et al., 2021; Morell et al., 2021). This can generate debris laden floods and debris flows. Debris laden floods are very rapid, surging flows of turbid water heavily charged with debris and transporting large volumes of boulders as bedload (Figure 8) (Jakob and Hungr, 2005; Church and Jakob, 2020). Finally, debris flows consist of fluidized masses of sediment, boulders, logs, trees and other debris picked up along the way. Because of the high density and viscosity of the muddy matrix, boulders can “float” in the debris flows and are commonly seen transported at the snout (front) and top of debris flows. Debris flows differ from mudflows in the grain size of material carried: Debris flows are typically defined as having more than 50% of the material coarser than sand. Debris flows often overwhelm channel capacity due to bulked up volume and follow pre-existing drainage pathways (the paths of least resistance) until they encounter some constriction which produces a blockage and causes the flows to avulse or breakout from the channel. The breakout flows can follow roads or re-occupy former drainages to flow down the fans, and may impact areas a significant distance away from the main channel. Coming out of steep mountains, these flows can be considered “ultrahazardous” by virtue of their speed and the debris carried (Sanders and Grant, 2020), such as large boulders and logs, which can destroy houses, bridges and pipeline crossings, and roadway corridors (United States Geological Survey, 2022). Sediment-water slurry processes reflect a continuum of transport mechanisms that are complex and gradational, and a single storm event may produce a range of flows phases from flood to debris laden floods to debris flows (Keaton, 2019). Thus, a given storm can produce multiple types of flooding, as a debris flows can transition downstream into a debris flood, and over time into a more water dominated flood as sediment is deposited.
The greatest compound hazard that can occur on alluvial fans are landslides-dam outbreak floods (Gurrola and Rogers, 2022a) (Figure 8). Bedrock landslides often produce slide debris dams that temporarily block the main canyon drainage or tributaries in the catchments and form a temporary lake behind the dams (Lancaster and Grant, 2006). These dams are typically breached in 12–24 h creating an outbreak flood that often transitions into debris flows. Outbreak floods produce peak discharges in excess of runoff-produced floods (Gurrola and Rogers, 2020a and Gurrola and Rogers, 2020b, Gurrola and Rogers 2022a, Gurrola and Rogers 2022b, Gurrola and Rogers 2022c).
Another type of compound hazard in alluvial fans are floods after fires. Many urban areas in southern California are located at the toe of steep mountains, where they are exposed to debris flows and flash floods, as aptly described by McPhee (1989). The magnitude of runoff from the mountainous areas is amplified when the catchment has recently burned. Wildfire can create a hydrophobic layer in the soil, especially in chapparal-covered hillslopes where the oils dripping from the burning chapparal vegetation can collect in an impermeable layer typically around 10 cm below the surface. Hydrophobic conditions can persist for years after the fire (often assumed to be 5 years), during which time they reduce infiltration during rainstorms and result in the well-known “wildfire-debris flows cycle” (Doehring, 1968; Keller, 2020). Such debris flows after fires can be considered a type of “compound hazard”, in that they result from the co-occurrence of wildfire and intense rainfall. Such post-fire debris flows have been common in Montecito throughout its recorded history (Gurrola and Rogers, 2020a and, 2020b), and in other mountainous and Mediterranean climate regions in the world (Verkaik et al., 2013). The problem is that by building in high hazard zones, we have turned what was formerly a “natural cycle” of wildfire leading to debris flows (Doehring, 1968) into a “disaster cycle” (Figure 9).
• Are floods and fires common in Montecito?
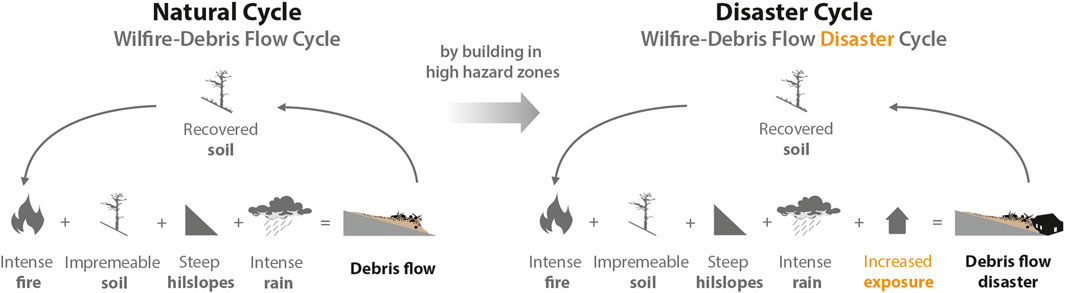
FIGURE 9. The wildfire-debris flows cycle (left) and the wildfire-debris flows disaster cycle (right).
A total of 56 damaging flood events including “clear water” floods, debris flows, and debris laden flood events occurred in the southern Santa Barbara County area since 1825 (Gurrola and Rogers, 2022a; Santa Barbara County Flood Control District, 1974; NOAA, 1994; FEMA, 2005; City of Santa Barbara General Plan, 2011; California Department of Water Resources, 2013; Santa Barbara County Flood Control and Water Conservation District, 1995; Ward et al., 2018). 36 of the 54 damaging flood events of the last two centuries in southern Santa Barbara County (approximately 64%) were debris flows or debris laden flood events, and 25 (approximately 69%) occurred within a 5-year period following a wildfire. The total number of flood and debris flow/debris laden flood events is a minimum number, because unreported or unwitnessed events likely occurred in the early 19th century. All the debris flows and debris laden flood events produced some degree of damage in communities downstream of the mountain catchments.
The method used by Gurrola and Rogers (2022) to classify these events according to the different magnitudes shown in Table 1 is based on the classification scheme developed by Jakob (2005) using parameters that are easily obtainable and provide a meaningful measure of assessing hazard and risk: total debris volume, peak discharge, and inundation area (Kean et al., 2019; Lukashov et al., 2019; Lancaster et al., 2021). The magnitude classes increase with volume, peak discharge, and area: 1 to 6 events include boulder debris flows and lahars (volcanic debris flows), while larger magnitude 7 to 10 events are only known from lahars initiated by volcanic events which typically run out considerable distances due to their fluidized nature (Gurrola and Rogers, 2022a). Only debris flows were classified (not floods, outbreak floods unless generated debris flows, nor debris laden floods) as floods/debris laden floods are not classified by Jakob’s classification scheme. If insufficient information or data exists regarding a debris flow, then it was not classified.
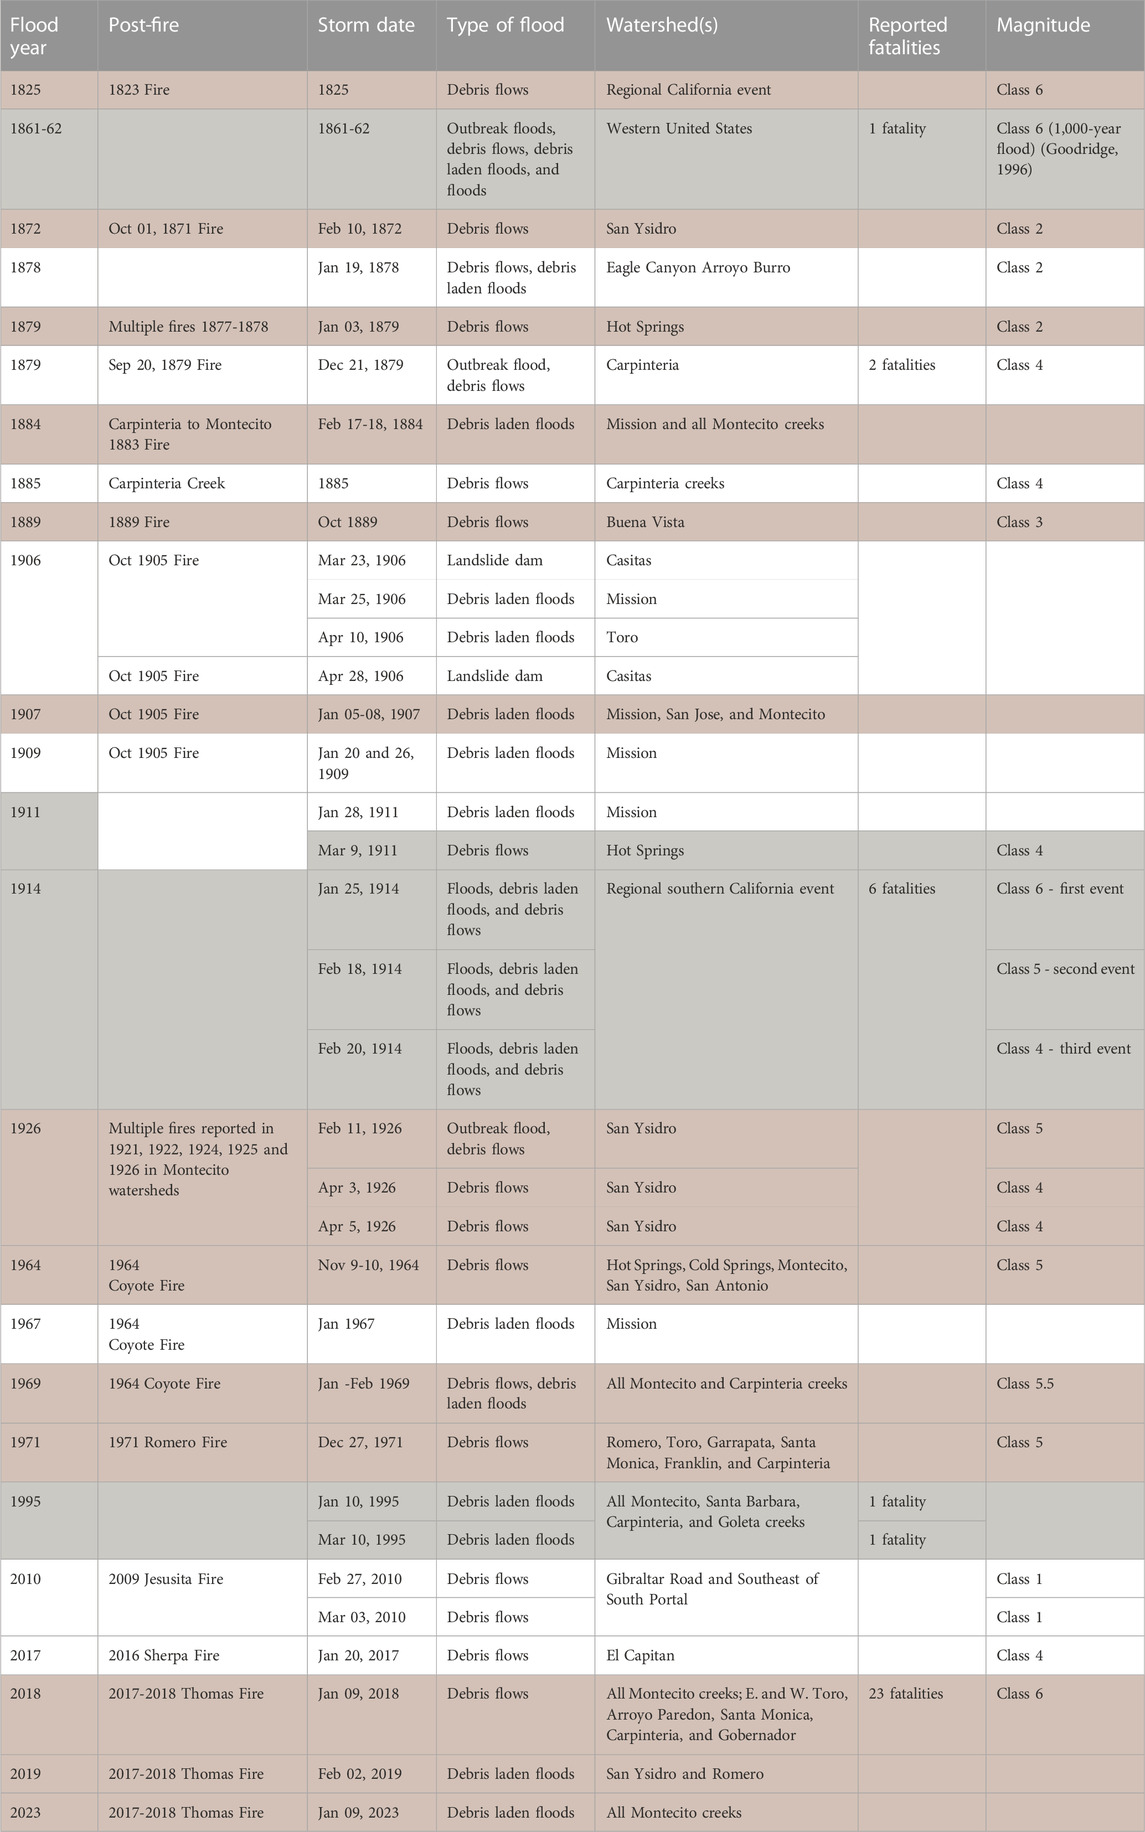
TABLE 1. List of flood events in the Montecito region, including debris flows and debris laded floods and assignment of magnitude classification for debris flow events. In red post-fire debris flows and debris ladedn floods in Montecito creeks, in brown debris flows and debris ladedn floods in Montecito creeks. This table do not include the rest of floods (quasi-clear water floods).
The largest magnitude debris flows and debris laden flood events occurred in 1825, 1861-62, 1914, 1995, and 2018, with both 1825 and 2018 events produced in post-fire conditions. The 1861-62 event(s) was by far the largest magnitude event in the last 200 years, the 2018 event being the smallest of the top five. Thus, events of the magnitude of the 2018 debris flows (or greater) have an average recurrence interval of about 50 years. A total of 22 debris flows and debris laden flood events damaged the downstream community of Montecito and roughly 63% of these events were post-fire floods occurring within 5 years of a wildfire. Post-fire debris flows and debris laden floods occurred in 1825, 1872, 1879, 1884, 1889, 1907, 1926 (3 events), 1964, 1969, 1971, 2018, and 2019 (Table 1; Figures 10, 11), and the most recent in January 2023, a relatively small event on the fifth anniversary of the 2018 debris flows.
• How has the hazard area in regulatory and non-regulatory maps changed over time and why?
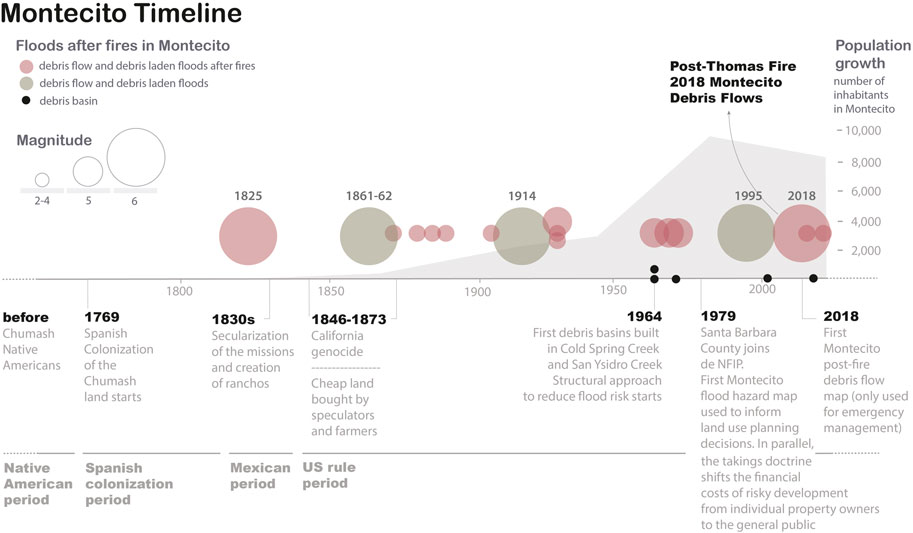
FIGURE 10. Timeline showing the history of floods after fires in Montecito, the construction of debris basins, growth of the population, and relevant historical events. This figure does not include all the floods in Montecito, only debris laden floods and debris flows.
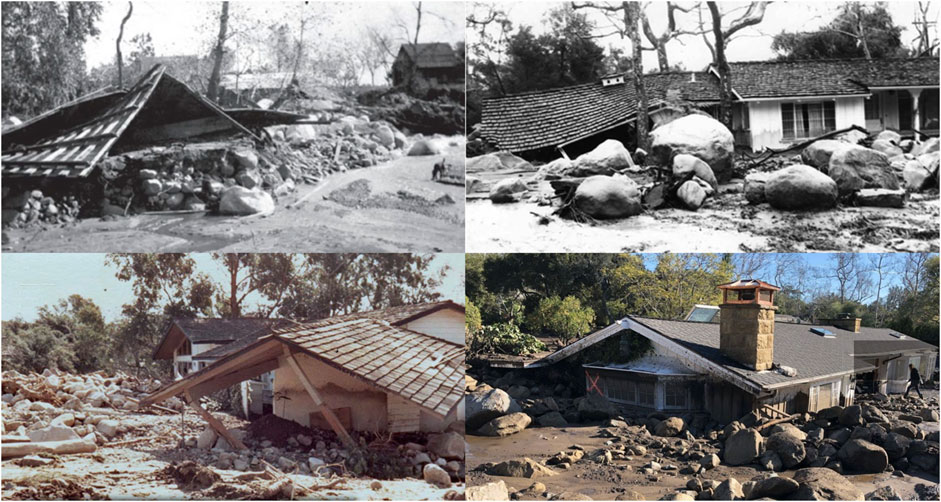
FIGURE 11. Images from past post-fire debris flows. 1914 debris flows (top left, source: Noticias, 2019), 1964 debris flows (top right, source: courtesy of the Montecito Association History Committee), 1969 debris flows (bottom left, source: Santa Barbara County Flood Control, 1969), and 2018 debris flows (bottom right, source: courtesy of Mike Eliason, Santa Barbara County Fire Department).
To determine a community’s risk to flood hazards, FEMA performs an engineering study called a Flood Insurance Study (FIS). A FIS is a compilation and presentation of flood hazard areas along rivers, streams, coasts, and lakes within a community (FEMA, 2022). This information is used for community planning and development, to complement the designations shown on the FIRMs. In the Montecito area of Santa Barbara County, the area mapped in the FIRMs as being within the flood hazard footprint has decreased considerably in the last 50 years (Figure 12). Analyzing the FISs associated to the different FIRMs maps (Department of Housing and Urban Development. Federal Insurance Administration DHUD-FIA, 1978; FEMA, 1996, 1999, 2004, 2005, 2012, 2015, 2018, 2022) is not clear why the regulatory flood hazard aera has been reduced. One possible explanation would be that the hydraulic models used in newer maps have been refined and extent of the SFHA can by mapped more precisely, thereby reducing its footprint. However, the reduced area of the SFHA does not necessarily imply that the risk has reduced.
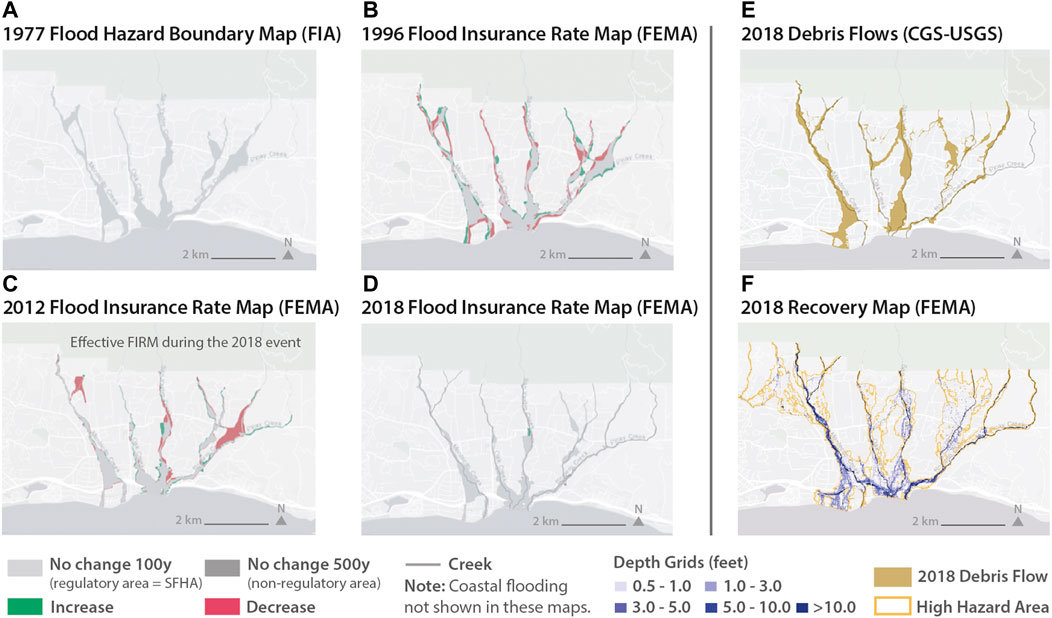
FIGURE 12. Evolution of the regulatory flood hazard maps produce by FEMA for Montecito showing a decrease of the Special Flood Hazard Area (SFHA) (A-D), the 2018 Montecito debris flows mapped by the California Geological Survey (CGS) and the US Geological Survey (USGS) (E) and the 2018 recovery map produced by FEMA (F).
The reduced area mapped as the SFHA cannot be explained by the construction of hydraulic infrastructure. In the US, lands protected from the 100-year flood (by levees, dams, or other hydraulic infrastructure) are not depicted as part of the SFHA in the FIRMs (Serra-Llobet et al., 2022). However, no such infrastructure large enough to control the 100-year event has been constructed in Montecito. The main strategy to reduce debris flows risk in Montecito has been the post-disaster construction of debris basins, but the debris basins were not sized to contain debris from a 100-year event, only to trap smaller volumes of sediment that could be expected during smaller, more frequent events. As acknowledged by the US Army Corps of Engineers Los Angeles District (1965, 1974; 2018b), these structures are not intended to provide a high level of protection, but serve to reduce the magnitude of subsequent small or medium floods.
Debris basins provide some level of protection but they arguably increase residual risk by encouraging settlement in the path of debris flows. Most debris basins are constructed at canyon mouths, where they trap sediment sizes from boulders down to fines, logs, and other large debris transported by mudflows, debris flows, and debris laden floods. While debris basins can be effective in trapping debris before it reaches urbanized areas downstream, they can be overwhelmed. Many of the debris basins built in Los Angeles County have sufficient capacity to trap debris even from large events (CLADPW-LACFCD, 2013). However, such large debris basins occupy a large area and may be visible from a long distance. The debris basins in Montecito and San Ysidro Creeks have much smaller capacity. A variant on the debris basin is the ring net, which consists of large steel mesh fixed to the canyon walls, allows finer sediment to pass but traps larger rocks and woody debris. The ring net normally have a shorter service life (usually considered to be 10–20 years) and small capacity, so they would be easily overwhelmed by many of the historic debris flows that occurred in Montecito.
The existence of debris basins (or ring nets) upstream can induce a false sense of security among downstream residents, a variant of the “levee effect” (White et al., 2001; Hutton et al., 2019; Serra-Llobet et al., 2022), which may encourage further development in a hazardous area.
In summary, Montecito’s debris basins are only designed to reduce the impact of frequent, smaller events. They were not intended to control sediment from large debris flows and floods. The new Randall Road Debris Basin (build after the 2018 debris flows), the largest to date, is very small compared to the volume of the 2018 debris flows (see gray bar in Figure 13). However, many members of the public perceive this risk reduction measure as having “solved” the debris flows threat, a view also reflected in the headlines of some recent articles in the local press: “Making Montecito Safer: Part One” (Burns, 2019), the “Holy Grail of Flood Control to Be Built in Montecito” (Yamamura, 2020), “‘We Pulled off a Miracle with Randall Road’: $18 Million Debris Basin Project Set to Begin” (Burns, 2021).
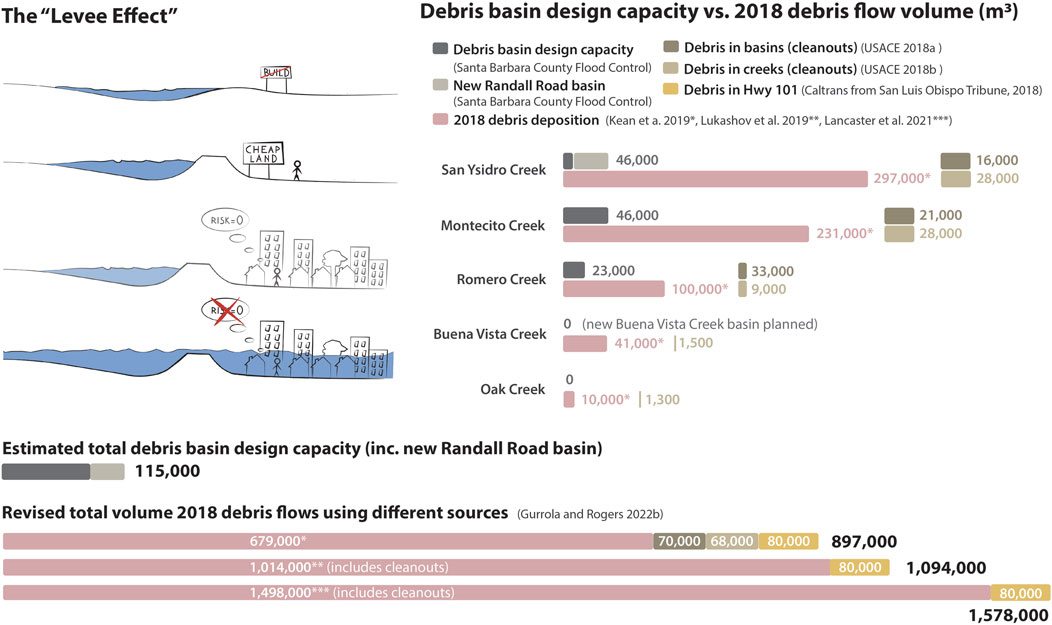
FIGURE 13. The levee effect (left) (source: modified from Ludy, 2009) and graphic showing approximate debris basin capacity vs. 2018 debris flows volume (right and bottom). The debris basins capacity (gray bars) is based on estimates reported by Santa Barbara County Flood Control, the debris estimates for the 2018 debris flows are based on aerial and ground geological surveys from US Geological Survey and California Geological Survey, the volumes removed in a US Army Corps of Engineers cleanout of four debris basins and along the creeks on Cold Springs, Hot Springs, Montecito, Oak, San Ysidro and Romero watersheds, the estimate of debris cleared from Highway 101 by CalTrans, reported in San Luis Obispo Tribune, and the revised total volume for the 2018 debris flows from Gurrola and Rogers 2022 report. Sources: Kean et al., 2019, Lukashov et al., 2019, Lancaster et al., 2021, US Army Corps of Engineers Los Angeles District 2018a and 2018b, Ferreira and Holden 2018, Gurrola and Rogers 2022b.
Easily overlooked in the discourse over debris basins are the profound effects of the basins on habitat for anadromous steelhead trout and the resident populations of rainbow trout (Oncorhynchus mykiss). This species requires longitudinal continuity through the river system, notably to access spawning and rearing habitats in cold headwaters. The debris basins are essentially impassable, despite some (mostly ineffective) efforts to build fish ladders around them. Most critical steelhead spawning habitat (coarse gravels, deep pools) is upstream from debris basins. The National Marine Fisheries Service (NMFS) (2014) reported that an estimated 39 km of high-quality habitat is upstream of the debris basins, inaccessible to steelhead. Being aware of these impacts, the new debris basin (Randall Road basin) has been designed to accommodate fish passage. However, in addition to blocking migration to critical habitats, debris basins trap gravels that would naturally be carried downstream to replace gravels that are washed away in high flows, creating sediment-starved conditions downstream of the debris dams and resulting in a lack of suitable habitat as documented in prior studies (National Marine Fisheries Service, 2014). Because the sediments trapped in the debris basins (including gravels) are removed periodically and taken to disposal sites (around three million m3 as of 2014), gravels are permanently lost to the system, eliminating any possibility of recovery of habitats downstream of debris basins (National Marine Fisheries Service, 2014).
During the 2018 Montecito debris flow, 558 structures were damaged, 162 of which were considered destroyed (CAL FIRE, 2018; Lancaster et al., 2021). After this event, Santa Barbara County facilitated the reconstruction of all the structures impacted by the 2018 event, even if they were located inside the SFHA. By coincidence, in 2018 FEMA released a new FIRM for the area (Figure 12D), but this update was only to the area of coastal flooding; the upstream areas were not revised. FEMA never conflated flood hazard mapping with debris flows mapping. The debris flows changed entirely the topography in Montecito, thus rendering the effective FIRMs (Figure 12C) in those areas unusable for use in administering the NFIP and rebuilds from that point forward. For that reason FEMA offered up a “Recovery Map” (Figure 12F), to provide the community with a timely flood hazard map to allow citizens to begin the rebuild process. Because a true FIRM update takes years to accomplish, the Recovery Map was not considered “effective,” because it didn’t go through the formal FIRM update process, which includes public noticing, appeal periods, etc. Technically, the mapping was based on modeling that tried to replicate a debris-laden flood event, not a debris flow. The Recovery Map was based on the model that considered bridges plugged, burned watershed parameters, topography based on post-debris flows conditions, in which many creeks were filled in with material by the debris flow. This still though represented a flood hazard map (clear water model), not a debris flows hazard map (sediment transport model). This map did not replace the effective FIRM but was intended to inform the recovery process (e.g. requiring flood-related building codes for the reconstruction beyond the SFHA boundaries), since most of the houses destroyed, not surprisingly, were located outside of the SFHA shown on the FIRM. However, the building codes enforced by the County under the NFIP assume clear water flow and do not account for sediments and debris. This is a shortcoming of the building codes more broadly (Lancaster et al., 2015). Debris flows loading guidance from the California Geological Survey was provided by the County to building permit applicants but its use was voluntary.
3.1.3 How has exposure changed over time in Montecito?
Figure 14 shows the evolution of the structures in the extended flood hazard area of Montecito (delineated following the methods described in Section 2.1) during the 20th century and beginning of the 21st century. Figures 14A, B show how the number of structures in the part of the hazard area covered by the Sanborn maps increased from 624 in 1918 to 886 in 1942. Over the last 50 years, the number of structures in the overall flood hazard area has almost doubled, increasing from 1,164 in 1970 to 1,976 in 2016 (Figures 14C, D). Although the intervals of time in between the observations are not consistent, this plot conveys that Montecito was much less dense 100 years ago, and the most rapid development happened during the second half of the 20th century. However, the structures in the community on Montecito as a whole are less dense than similar areas in southern coastal California. The extended flood hazard area also has to be used cautiously - beyond this boundary, there is still an area of uncertainty where floods (and debris flows) may occur.
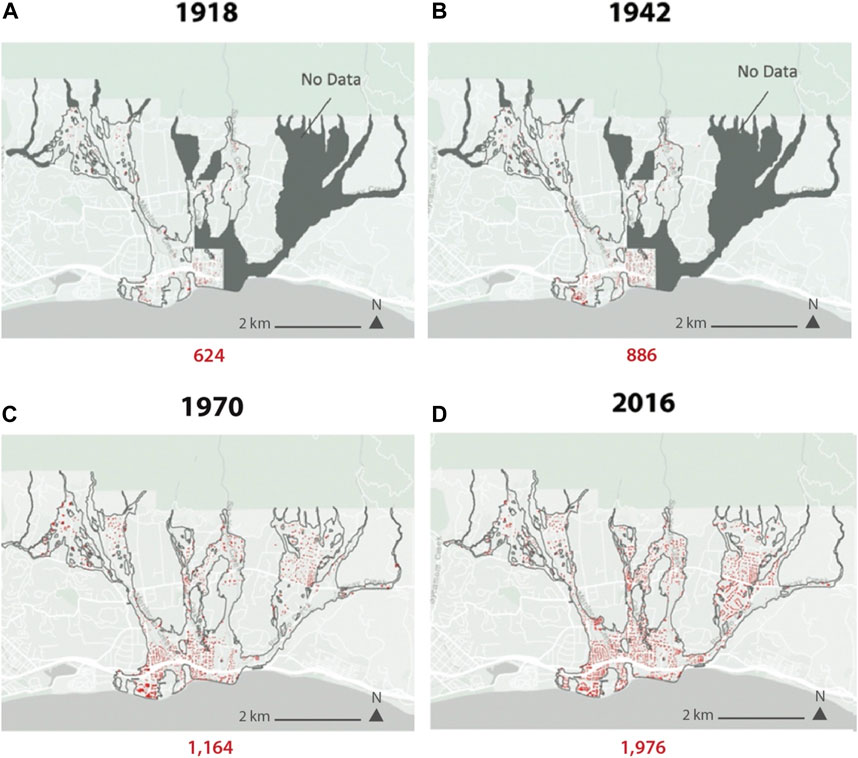
FIGURE 14. Evolution of exposure (structures) in the extended flood hazard areas of Montecito during the last 100 years. Based on Sanborn Map Company, 1918 (A), Sanborn Map Company, 1942 (B) Imagery from 1970 to 1971 (C), National Agriculture Imagery Program (NAIP) Imagery from 2016 (D).
While the magnitude of the 2018 event was considered unusually large (Keller et al., 2020a), the last two centuries have seen four events of the same magnitude or larger affecting Montecito, Oak, San Ysidro, Buena Vista and Romero Creeks, causing repeated damage from floods and debris flows over the past century (Gurrola and Rogers, 2020a; Gurrola and Rogers, 2022b). However, damaged houses had been rebuilt and new houses constructed within the hazard zone.
Santa Barbara County joined the NFIP in 1979. Although this program is intended to reduce exposure in hazard areas, in fact the number of houses within the flood hazard area (SFHA) has increased substantially since 1979. Our analysis also shows that currently, more than 90% of land use in flood hazard areas is zoned as residential, the land use considered least compatible with flood hazard. Montecito is not a unique case; increased exposure within flood hazard areas has occurred across the US, even in communities belonging to the NFIP. This is in part due to the fact that land use decisions are the purview of local governments, and under the NFIP, developments in high hazard zones are highly discouraged but not forbidden unless explicitly stated in the local floodplain ordinance. Most local governments have proven unable to stop rebuilding in areas repeatedly devastated by floods and/or debris flows because of strong political pressure from private property owners and developers, and because of the threat of lawsuits under the “takings doctrine” (Klein, 2019). Although, less than 10% of takings claims have been successful in court, the threat of such lawsuits has created a “regulatory chill” such that, “The threat of takings litigation deters some regulators from enacting land-use restrictions” (Klein, 2019). Thus, in the US, floodplain land use is closely linked to private property rights. How such private property rights came to be and how they evolved in Montecito is explained in Section 3.1.1.
In contrast, some other countries (such as Spain, France or Austria) prohibit developments in high hazard zones, notably in areas that have suffered important damage or fatalities from prior floods. Ironically, if the NFIP was implemented as originally intended and designed, it would ensure enactment of sound land-use regulation and prevent further development in high hazard areas, provide only temporary subsidies for insurance premiums, encourage partial retreat, and advance social equity (Klein, 2019).
• Where were the houses impacted by the 2018 debris flows located in relation to different hazard areas?
One striking aspect of our results is that more than 60% of the houses affected by the 2018 debris flows were located outside the SFHA (Figure 15). This should not come as a surprise. FIRMs are created using assumptions and simplifications that don’t reflect the complexity of alluvial fan flooding and debris flows. Because of the high probability of avulsion, alluvial fan flooding is much less predictable than flooding of a floodplain along a large alluvial river. Even if the flood hazard predictions were more reliable, the mapping attempts to show the hazard only up to a given recurrence interval (the 100-year or 1% flood). This is why it is important to look at a more extended area (beyond the SFHA) when we analyze the evolution of exposure in flood hazard areas.
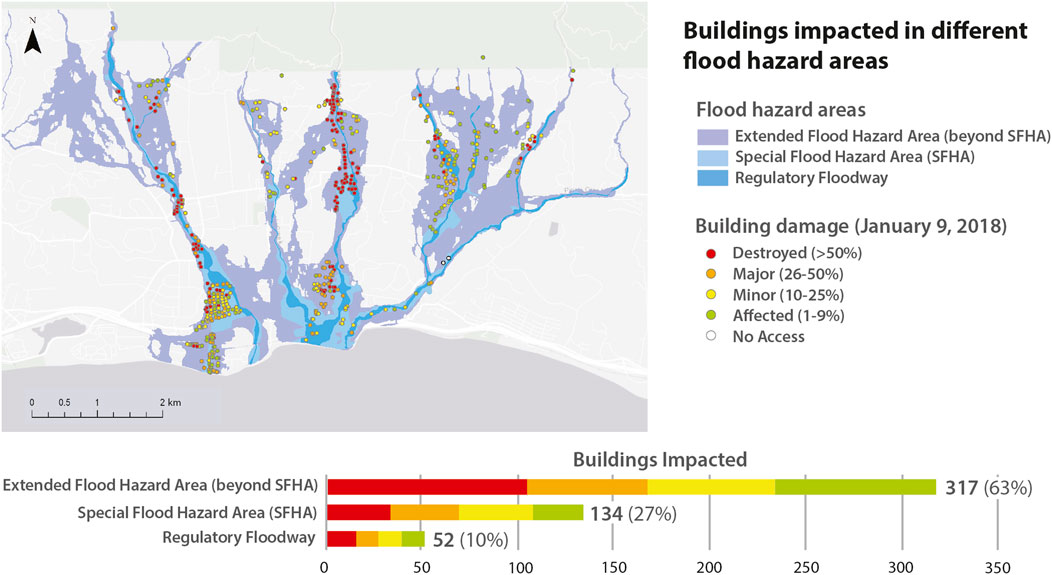
FIGURE 15. Location of the buildings affected by the 2018 debris flows in relation to different flood hazard areas. The information about building damage is based on the damage inspection (Cal Fire, 2018), the Special Flood Hazard Area and the Regulatory Floodway are from the 2012 Flood Insurance Rate Map (the effective FIRM during the event), and the extended flood hazard area has been delineated following the methods explained in Section 2.
3.1.3.1 Had these areas been impacted before?
Historic debris flows and debris laden flood flows paths were recreated using descriptions of property damages in accounts including damages and destruction to residential estates and buildings; inundation and deposition of mud, boulders, and logs in fields and roads; and destroyed bridge crossings and inaccessible road corridors. These descriptions permitted the mapping of inundation flow paths beginning with the 1914 debris flow event and continuing through the 2023 post-fire debris laden floods. We established that debris flows and debris laden floods utilized similar creek corridors and the same constriction sites produces avulsions with alike flow paths. There are subtle differences in the diversion of smaller flows or where the flows terminate but the main flow paths remain surprisingly similar with redundant avulsion sites. In summary, it was somewhat surprising that creek corridor areas in Montecito have been redundantly inundated with mud, debris, and logs causing much damage and destruction to property and life, and that these inundation events have not resulted in much change over time in location of the channels and the zones affected by debris flows.
Essentially, flood risk has increased due to increased population from the early development of the community and over time, development has encroached the principal creeks that drain the steep catchments (Gurrola and Rogers, 2022b). The result is an increased exposure to flood and debris flows hazard to more residents in the 21st century as compared to the early history in the 19th century. In addition, creek channel conveyance capacities remain low and they are readily overwhelmed with high discharge floods and by bulked, large volume debris flows. Creek channels are overwhelmed producing overbank flows, bridge and culvert constrictions are plugged with debris producing avulsions, causing flows on the fan surface and may divert flows considerable distances from the main creeks. The January 2018 event resulted in most deaths occurring along the Montecito Creek corridor. Direct impacts by large boulders and logs caused complete destruction of houses and many deaths (Lancaster, 2021) along this corridor. Debris flows within a 100-year period prior to 2018, destroyed the same bridge crossings and avulsed to produce out-of-channel flows with notably similar flows paths (Gurrola and Rogers, 2022b). Post-2018 replacement bridges and culverts were required to be designed based on the recovery map so mostly were, in fact, rebuilt larger than the pre-2018 structures. Nonetheless, the potential for avulsions still remains high since these structures are not design to convey extreme events. Because of new and rebuilt structures in the path of debris flows, the number of residents at risk is comparable to the number at risk in 2018.
3.1.4 Other aspects of vulnerability
• Do County agencies (County Flood Control/first responders), land use planners and residents in Montecito understand their risk?
Risk (mis)perception was a critical element of flood risk management that increased vulnerability in Montecito during the 2018 debris flows both long-term, with land use planning decisions over time, and short term, during the emergency management. Some county officials and residents understood the risk of floods after fires, and debris flows but many did not. Reports completed by the Santa Barbara Flood Control District (1969) (Stubchaer, 1972) and by the US Army Corps of Engineers (1965, 1974; 2018b) make clear that flood risk professionals in these agencies understood the debris flows risk. However, some residents “protected” by debris basins had, and still have, unrealistic expectations of the protection provided by the debris basins, as reflected in a press account of the 2023 event ““I wanted to show them how the debris basin had done its job,” she said. “Not to scare them, but to show how nature is beautiful and powerful and meant to be respected. And we can coexist if we pay attention.”” (Cowan and Knoll, 2023). Another example is a newspaper headline “Holy Grail of Flood Control to Be Built in Montecito” (Yamamura, 2020), which reflects a lack of understanding of the “residual risk” associated with these structural measures. A resident interviewed after the 2018 debris flows stated “I did not understand the history of Montecito” (Goto et al., 2021). According to Goto et al. (2021) the “majority of the respondents mentioned that before the 2018 debris flows, they did not know what debris flows were and did not know they could happen in Montecito or Santa Barbara area.”
Despite policies discouraging developments in hazard zones implemented since Montecito joined the NFIP in 1979, developments in these areas have increased substantially, even within the Special Flood Hazard Area and the regulatory floodway (defined by FEMA as the channel of a river or other watercourse and the adjacent land areas that must be reserved in order to discharge the base flood without cumulatively increasing the water surface elevation more than a designated height (FEMA (Federal Emergency Management Agency), 2020). This is in part because in the US, developments in high hazard zones are discouraged, but not prohibited—even in the regulatory floodway. As described above, in the US the reluctance of the residents to relocate from high-hazard areas and the “regulatory chill” created from the “takings doctrine” discourage floodplain managers to enforce stronger land use regulations in high hazard zones (Klein, 2019). After the 2018 debris flows the planning department facilitated reconstruction in areas that have been repetitively impacted by destructive debris flows.
As pointed out by some emergency managers during the workshop, although some local emergency responders were not familiar with the term “debris flow” before the run-up to the 2018 event, the county staff quickly compiled relevant information and began planning for a potential evacuation from the area downstream of the Thomas Fire burn two weeks before the storm was forecast, as recommended by the USGS and the California Geological Survey. Emergency managers developed an evacuation map that recognized the debris flows hazard, and in fact would have evacuated houses in the path of debris flows. However, other public officials with key roles in deciding how to evacuate chose to use the same evacuation map used during the Thomas fire out of familiarity, instead of the map proposed by the emergency managers, evidently because of a lack of understanding of the nature of debris flows risk. In her notes from an emergency management meeting held shortly before the anticipated 9 January 2018 atmospheric river storm, a county official wrote that post-fire debris flows had not occurred in Montecito before: “No analogous experience in this area as no fires right in this area.” This ahistoricism contributed to missteps in the evacuation (Hayden, 2018).
Some land use planners did not understand the risk posed by debris flows, as reflected in the continued use of a flood hazard overlay to inform land use planning decisions, which is still now only based on models for riverine clear water flooding, not alluvial fan flooding.
3.2 What actions will increase or reduce vulnerability to the next big flood?
3.2.1 How is climate change influencing the likelihood of floods after fires?
Atmospheric models predict that future climate will bring more atmospheric rivers in California (Dettinger et al., 2011; Swain et al., 2018; Huang et al., 2020; Huang and Swain, 2022; Touma et al., 2022), and as a consequence, more intense short duration rains. Recent changes in climate trends have already exacerbated droughts and wildfires in California. Observations show that the precipitation season is progressively delayed, and is becoming shorter and sharper, resulting in more intense short duration rain (Luković et al., 2021). Furthermore, California’s climate undergoes a transition from record multi-year dryness to extreme wetness, indicating not merely an increase in frequency and intensity of these extremes but also in the speed of alternations between extreme dry and extreme wet weather, what is sometimes called “whiplash” (Swain et al., 2018; Guirguis et al., 2023). These trends, more intense short duration rains in combination dry periods leading to more extensive wildfires, will likely result in more post-fire debris flows (Touma et al., 2022), which will add complexity to post-fire hydrologic hazard planning (Oakley, 2018 and, 2021, Baecher, and Galloway, 2021; Lancaster et al., 2015; Alluvial Fan Task Force, 2010).
Alessio et al. (2021) document that large quantities of sediment were flushed from sediment storage reaches in the channels (of Montecito and San Ysidro Creeks) (Alessio et al., 2021; Morell et al., 2021). Some have interpreted this as implying that a large debris flows is not possible now for some decades while more debris accumulates. However, large volumes of debris remain exposed to high runoff, so debris flows remain a real possibility despite the 2018 event, and we know that the average interval between large debris flows and debris laden floods was less than 50 years over the past two centuries.
3.2.2 Is exposure going to increase in high hazard areas?
Although Santa Barbara County doesn’t envision a big increase of population in Montecito, the reconstruction of areas that have been repeatedly impacted by destructive debris flows is underway (Santa Barbara County, 2018). Some lands were bought soon after the disaster (when prices dropped) by speculators who then rebuilt houses for resale, transferring the risk. Others houses were rebuilt by the same property owners. One of the houses destroyed in 2018 had been built on a lot purchased (at a discount) after the 1964 storm destroyed a house on the lot. The owner of the place, who inherited the house, rented it. Fortunately in this case, the renter had been evacuated prior to the 2018 debris flows. However, he lost all his belongings in the house. These examples of risk transfer have been common in Montecito’s history. Under the NFIP, there is no disclosure required at a federal level upon the sale of a house that has experienced repetitive losses from floods. In some states, such as California, although this loss disclosure is not required, state law requires that a hazard disclosure statement be included within the title for the property. In most cases, this hazard disclosure statement is provided at the closing of a property transfer. The State also has online maps illustrating various hazard zones. However, future property owners still do not have access to the specific loss history of the property they are purchasing. Requiring the provision of such information -history of repetitive losses and a map with the location of the house relative to the hazard- could help property buyers and renters to have a more risk-informed decision.
4 Discussion and recommendations
4.1 Key findings
By using the History Informed Hazard Planning Approach, in this research we have analyzed scientific data and historical records to better understand how the community of Montecito came to be vulnerable to floods and how the residents’ current actions will reduce or increase their vulnerability to the next big flood.
We can summarize the results in four main findings:
1. Exposure in high hazard zones has increased substantially in the last 50 years despite policies discouraging developments. Of the many reasons why developments have increased in high hazard zones, we highlight two: First is the use of conventional Flood Insurance Rate Maps (FIRMs) to manage land use in alluvial fan areas such as Montecito. These maps are based on assumptions of clear water floods, without accounting for the high sediment loads in streams flowing from steep mountains across alluvial fans. In effect, the hazard areas delineated on FIRMs can be considered as setting a minimum standard, and floodplain managers may lack incentives to go beyond the minimum. The FEMA map used to guide Montecito’s recovery after the 2018 debris flows went beyond what is done in many other communities but it was based on modifications to existing clear water models. With improvements in methods, it is now possible to develop hazard maps for alluvial fan flooding (including debris flows), drawing both on sediment transport models and historical maps of areas affected by flash floods and debris flows, as illustrated by the map produced by the California Geological Survey after the 9 January 2018 debris flows showing post-fire debris flows hazard areas in Montecito (California Geological Survey, 2018). Alluvial fan flooding/debris flows maps are not yet available for all of California, because they are not required under FEMA minimum standards. However, such alluvial fan flooding/debris flows maps should arguably be standard practice in areas potentially subject to such flash floods. The second reason is related to property rights. In the US, the threat of “takings” litigation deters planners from enacting land-use restrictions that go beyond the FEMA minimum standards, and thus urbanization is commonly allowed on lands at risk of flooding. Ironically, allowing new development can increase flood elevations, velocities, and expose pre-existing properties to debris flows, especially when deflecting walls are built to protect one property (because these walls can redirect flood and debris flows to neighboring properties). Some law experts have argued that this risk transfer violates the property rights of the pre-existing properties (Kusler and Thomas, 2007; Thomas and Medlock, 2008). This is based on a legal principle that dates back to ancient Justinian (Roman) law: “Sic utere tuo ut alienum non-laedas”, or “use your own property that you do not injure others” (Lulloff, 2013).
2. Floods after fires are common in Montecito. However, the vulnerability of many Montecito residents to flood hazard has increased due to the lack of understanding of the context where they live, ahistoricism, and a barrier in local government information transfer. While many floodplain and emergency managers understood the risk of floods after fires, some high-ranking administrators and many members of the public did not. As reflected in the county official notes from the pre-flood emergency operations meeting indicating no prior debris flows, the history of repeated debris flows was not understood, or at least not acted upon, by some officials. In a later interview the county official said, “For those of us who are not in the business, who are not weather or fire experts, it was difficult to understand the danger. We don’t have a history of this” (Hayden, 2018). In the US, local hazard mitigation plans should include previous hazard events to help local governments estimate the likelihood of future events and predict potential impacts. However, historical information is not systematically compiled in these reports and this historical information is rarely used to inform land use decisions.
3. The risk from relatively frequent, low to medium magnitude debris flows might have been reduced in some areas of Montecito due to the construction of debris basins, but catastrophic risk has increased due to the “levee effect”. In Montecito debris basins have been built as a post-disaster response, but they have been sized to contain small or medium size debris flows, and their dimensions reflect limited land availability, lack of suitable sites, and community opposition to massive concrete structures. This has prevented construction of debris basins sized to contain large debris flows. Just as residents don’t understand the residual risk behind levees in other settings (Ludy, 2009; Ludy and Kondolf, 2012), they do not understand the limitations of existing debris basins to protect them against the kind of catastrophic debris flows that have occurred repeatedly in Montecito, as illustrated in comments of residents in recent press accounts (Burns, 2019 and, 2021, Yamamura, 2020; Cowan and Knoll, 2023). The existence of the debris basins has engendered a false sense of security and encouraged further development in areas “protected” by these infrastructures. Moreover, debris basin structures have cut off migration routes for steelhead trout (Oncorhynchus mykiss) and affected aquatic habitats up and downstream of the debris basins.
4. The risk of floods after fire is increasing in Montecito. This is due to both climate-change-induced increased frequency and magnitude of extreme events, and to (re)building in high hazards zones despite their history of repetitive impacts from destructive debris flows. California is vulnerable to wildfires due to its seasonally dry Mediterranean climate and highly flammable vegetation communities. It is also exposed to intense rainfall from atmospheric rivers, which on intensely burned slopes can produce violent flash floods and debris flows. Furthermore, projected future whiplash (frequency of rapid transitions between dry and wet conditions) will also increase with climate change (Swain et al., 2018). High debris-flow hazard zones in Montecito are densely populated, making this community very exposed to the impacts of flash floods and debris flows. By building in high hazard zones, we have turned what was formerly a natural cycle of wildfire leading to debris flows (Doehring, 1968) into a disaster cycle (Figure 9).
4.2 Novelty of this approach
In disaster risk reduction theory, the social aspects of the “process-based approach” have been coined through the “pressure-and-release” (PAR) vulnerability model (Wisner et al., 2004) and it is now used in United Nations disaster risk reduction and climate adaptation reports (IPCC, 2007, 2014, 2022; UNISDR, 2015). This paper complements this approach by explicitly approaching risk as a process, not only understanding the root causes of human vulnerability but also the natural and physical processes that generate flood risk. While the concept that risk is a process and not a phenomenon isolated in time and space is not new (White 1945; Hewitt, 1997), this concept has not guided planning practice. Risk is most often conceived in terms of a form-based static map showing zones of higher hazard or risk, an overlay layer in a GIS analysis that has been imposed by nature. But risk results from a complex interplay of natural processes and human actions, and is better understood as a process, in which decisions taken today (e.g., whether to rebuild in the same sites in the same way) will largely determine the future risk profile.
To understand the current risks, we must understand how past actions have led to the current situation (root causes of vulnerability and exposure processes). Just applying existing policy (FEMA minimum standards) is not enough. “Rules don’t tell the story; you have to use common sense” (personal communication, Gerry Galloway, University of Maryland, September 2022). In current US practice, even when historical information is available (e.g., in Local Hazard Mitigation Plans), it may not be taken into account in land use planning. A historical perspective is essential to understand how a community came to be vulnerable to floods and what actions are being taken now that will increase or reduce vulnerability to the next big flood. If this framework were applied to land-use planning in Santa Barbara County, perhaps future 2018-style tragedies could be largely avoided. This would require reforms in how flood hazard areas are mapped in the US (accounting for alluvial-fan style flooding and debris flows in addition to conventional riverine floods) and it would imply less reliance on conventional step-backwater hydraulic models for mapping flood risk and a greater embrace of geomorphological information and the history of past events. This approach would require that we should start mapping the evolution of exposure in hazard zones over time. Most challenging, this approach would imply systematically compiling information related to historical floods and apply lessons learned. That would mean that areas repeatedly destroyed by debris flows over the past 200 years be zoned as high hazard areas in flood maps. Ideally, the most important step would be to do as done in some European countries, where high hazard lands are rezoned as “open space”, not as “residential”, in the General Plan. The case of Montecito is particularly challenging since the financial implications to the property owners and to the County is substantial, because of the extremely high property values in this area. Compensating property owners for loss of unrestricted use of their private lands becomes expensive quickly. However, on the other hand, the County and tax payers at the state and federal level are now assuming an enormous financial burden in attempting to partially protect such vulnerable properties from damage and in attempting to evacuate residents in advance of likely debris flows events.
5 Conclusion
A doctor cannot diagnose a patient’s illness without taking the patient’s history (when did the cough start? How long have you been smoking?) Likewise, we cannot understand what happened after a disaster without knowing the history of the actions leading up to the disaster. As noted by Galloway (2015, Plenary Session Presentation to the US Association of State Floodplain Managers (ASFPM) Conference), “We have communities working on resilience and yet they don’t know the fundamentals of their risk.” We cannot understand the fundamentals of our risk if we neglect history. Flood risk in not a map. Flood risk is a “process” that includes natural/physical processes and social processes. In this paper we propose an approach to inform land use planning decisions based on science and history. Our research demonstrates that debris flows and debris laden floods after fires have occurred repeatedly in Montecito over the past two centuries (Gurrola and Rogers, 2022b). These events have caused significant repetitive property damages and loss of life. By systematically combining historical records and maps of both past natural hazards and also the patterns of increased residential development, we can characterize risk as a dynamic process.
Our research shows that despite policies discouraging developments in hazard zones, exposure has increased significantly since Santa Barbara County joined the National Flood Insurance Program (NFIP) in 1979, consistent with trends observed elsewhere in the US. The evolution of the FIRMs in Montecito shows the limitations of using clear water maps to describe much more complex processes involved in the dynamics of debris flows. The debris flows hazard is likely to become more severe with climate change (Huang and Swain, 2022; Touma et al., 2022), and current urbanization trends in flood hazard areas are increasing exposure, resulting in greatly increased risk.
Finally, our results highlight the importance of contextualizing risk as a process and not as a phenomenon isolated in time and space (White 1945; Hewitt, 1997). This approach to analyze how and why exposure and the information about flood hazard (e.g., flood hazard maps) have evolved over time can be applied elsewhere in the US and other countries to help other communities in flood hazard zones to better understand, in words of Gilbert F. White, “the key decisions that resulted in public exposure to flood loss” and “what kinds of decisions may either reduce or enlarge the human consequences of the next large flood” (White, 1994).
Data availability statement
The datasets presented in this study can be found in online repositories. The names of the repository/repositories and accession number(s) can be found here: https://www.tprcsb.org/risk.
Author contributions
AS-L, JR, and GK contributed to conception and design of the study and wrote the first draft of the manuscript. AS-L, JR, GK, LG, JDR, SL, and JD contributed to develop the case study. All authors contributed to the article and approved the submitted version.
Funding
This study is part of two larger projects (“From epic wildfires to epic flash-floods: Rethinking flood risk management in an era of extremes”) financed by the 2019 France-Berkeley Fund Award and the RREFlood Project (“The Residual Risk of Extreme Floods: a challenge for achieving sustainable development goals”), financed by the Belmont Forum Collaborative Research–US National Science Foundation Grant (Grant Number 2135879); Publication made possible in part by support from the Berkeley Research Impact Initiative (BRII) sponsored by the UC Berkeley Library.
Acknowledgments
We want to thank the Institute of European Studies at the University of California Berkeley for their support. We also want to thank floodplain managers, emergency managers and land use planners in Montecito for their willingness to share their insights and their openness to accepting new perspectives. Jon Frye (retired) and Matt Griffin Santa Barbara County Flood Control and Planning Department, Nicole Lieu and Whitney Wilkinson Santa Barbara County Planning and Development, Robert Lewin (retired) Santa Barbara County Office of Emergency Management, Yonni Schwartz Forest Service, Los Padres National Forest, and Jeremy Lancaster California Geological Survey. Ed Keller and his team in Santa Barbara and Mark Capelli, NOAA. We also thank Hattie Beresford for reviewing the history of Montecito and markedly improving the accuracy of and Trish Davis of the Montecito Association History Committee information. Finally, we want to thank Emeritus Professor Rob Olshansky, University of Illinois, for his insights and the graduate students of Department of Landscape Architecture and Environmental Planning at the University of California Berkeley for contributing to the production of the maps: Ying Chik (Vanessa) Lee, Alev Bilginsoy, Yiwen Chen, Dana Clark, Adam Dickenson, Kendal Harris, Xiaoyue Wang, Shauna Wright. The paper benefited greatly from the comments from two reviewers.
Conflict of interest
The authors declare that the research was conducted in the absence of any commercial or financial relationships that could be construed as a potential conflict of interest.
Publisher’s note
All claims expressed in this article are solely those of the authors and do not necessarily represent those of their affiliated organizations, or those of the publisher, the editors and the reviewers. Any product that may be evaluated in this article, or claim that may be made by its manufacturer, is not guaranteed or endorsed by the publisher.
References
Adger, W. N. (1996). “Approaches to vulnerability to climate change,”. GEC 96-05 (London, UK, CSERGE GEC).
Alessio, P., Dunne, T., and Morell, K. (2021). Post-wildfire generation of debris-flow slurry by rill erosion on colluvial hillslopes. J. Geophys. Res. Earth Surf. 1. doi:10.1029/2021JF006108
Alluvial Fan Task Force, (2010). The integrated approach: For sustainable development on alluvial fans. San Bernardino, CA, USA: Water Resources Institute, California State University, 183.
Baecher, G. B., and Galloway, G. E. (2021). US Flood risk management in changing times. Water Policy 23 (S1), 202–215. doi:10.2166/wp.2021.269
Burns, M. (2019). Making Montecito safer: Part One. Santa Barbara independent. https://www.independent.com/2019/11/07/making-montecito-safer-part-one/.
Burns, M. (2021). “We pulled off a Miracle with Randall road”: $18 million Debris Basin project set to begin. https://www.montecitojournal.net/2021/04/29/we-pulled-off-a-miracle-with-randall-road-18-million-debris-basin-project-set-to-begin/.
Cal Fire (California Department of Forestry and Fire Protection), (2018). CA-VNC-103156. Santa Barbara, California, United States: County of Santa Barbara Fire Department.Thomas fire 845 watershed emergency response team
California Department of Parks and Recreation, (2020). California admission day. https://www.parks.ca.gov/?page_id=23856.
California Department of Water Resources, (2013). California’s flood future, recommendations for managing the state’s flood risk; statewide flood management planning program, attachment C: California flood history. https://cawaterlibrary.net/wp-content/uploads/2017/05/California_Flood_Future.pdf.
California Geological Survey- Us Geological Survey, (2018). Post event debris flow assessment. Montecito- January 24, 2018.
California Missions Foundation, (2020). California missions foundation. https://californiamissionsfoundation.org/ranchos.
Cho, S. Y., and Chang, H. (2017). Recent research approaches to urban flood vulnerability, 2006–2016. Nat. Hazards 88, 633–649. doi:10.1007/s11069-017-2869-4
Church, M., and Jakob, M. (2020). What is a debris flood? Water Resour. Res. 56 (8). doi:10.1029/2020WR027144
City of Santa Barbara, (2011). City of Santa Barbara general plan. https://www.santabarbaraca.gov/services/planning/plan.asp.
City of Santa Barbara, (2018). History of Santa Barbara. https://www.santabarbaraca.gov/services/community/historic/historysb/timeline.asp#Founding.
City of Santa Barbara Planning Division, (1999). “Greetings from the Santa Barbara waterfront, prepared by cole, A.C,” in Preservation planning associates for the historic architectural survey training class (Santa Barbara, California, United States: City of Santa Barbara Community Development Department).
Cladpw-Lacfcd (County of Los Angeles Department of Public Works - Los Angeles County Flood Control District), (2013). Sediment management strategic plan 2012-2032. Available at:https://dpw.lacounty.gov/lacfcd/sediment/files/FullDoc.pdf.
Cowan, J., and Knoll, C. (2023). Montecito, the million-dollar views still come with mudslide risks. https://www.nytimes.com/2023/01/17/us/montecito-mudslide-2018-california-storms.html.
Cutter, S. L. (1996). Vulnerability to environmental hazards. Prog. Hum. Geogr. 20 (4), 529–539. doi:10.1177/030913259602000407
Department of Housing and Urban Development - Federal Insurance Administration (Dhud-Fia), (1978). Flood insurance study. Santa Barbara, California, United States: Unincorporated Areas.
Dettinger, M. D., Ralph, F. M., Das, T., Neiman, P. J., and Cayan, D. R. (2011). Atmospheric rivers, floods and the water resources of California. Water 3 (2), 445–478. doi:10.3390/w3020445
Diskin, M. (2020). Edison to pay insurance companies $1.16B in Thomas fire, Montecito mudslide lawsuits Ventura county star. Online at:https://www.vcstar.com/story/news/local/communities/ventura/2020/09/23/edison-pay-insurance-companies-1-16-b-thomas-fire-mudslide-suits/3509976001/(Accessed November 15, 2020).
Doehring, D. O. (1968). The effect of fire on geomorphic processes in the San Gabriel Mountains, California. Rocky Mt. Geol. 7 (1), 43–65.
Dowling, C. A., and Santi, P. M. (2014). Debris flows and their toll on human life: A global analysis of debris-flow fatalities from 1950 to 2011. Nat. Hazards 71, 203–227. doi:10.1007/s11069-013-0907-4
FEMA (Federal Emergency Management Agency) (1996). Flood insurance study. Santa Barbara, California, United States: Unincorporated Areas.
FEMA (Federal Emergency Management Agency) (1999). Flood insurance study. Santa Barbara, California, United States: Unincorporated Areas.
FEMA (Federal Emergency Management Agency) (2004). Flood insurance study. Santa Barbara, California, United States: Unincorporated Areas.
FEMA (Federal Emergency Management Agency) (2005). Flood insurance study. Santa Barbara, California, United States: Unincorporated Areas.
FEMA (Federal Emergency Management Agency) (2012). Flood insurance study. Santa Barbara, California, United States: Unincorporated Areas.
FEMA (Federal Emergency Management Agency) (2015). Flood insurance study. Santa Barbara, California, United States: Unincorporated Areas.
FEMA (Federal Emergency Management Agency) (2018). Flood insurance study. Santa Barbara, California, United States: Unincorporated Areas.
FEMA (Federal Emergency Management Agency) (2020). Floodway. Available online at: https://www.fema.gov/glossary/floodway.
FEMA (Federal Emergency Management Agency) (2022). Flood insurance study. https://www.fema.gov/flood-maps/change-your-flood-zone/status/flood-insurance-study (Accessed Sep 15, 2022).
Ferreira, G., and Holden, L. (2018). Highway 101 reopens through Montecito – A day ahead of schedule, san Luis Obispo Tribune. https://www.sanluisobispo.com/news/local/article195864849.html.
Geiger, M. O. F. M. (1965). Mission Santa Barbara 1782-1965 by maynard O.F.M. Berkeley, California, United States: University of California Press, 39.
Goodridge, J. (1996). Data on California’s Extreme Rainfall from 1862–1995, 1996 California Weather Symposium. Rocklin, California, United States: Sierra College Science Center.
Goto, E. A., Gray, S., Keller, E., and Clarke, K. (2021). Evacuation choice before and after major debris flows: The case of Montecito, CA. Int. J. Disaster Risk Reduct. 62, 102400. doi:10.1016/j.ijdrr.2021.102400
Grabowski, R. C., and Gurnell, A. M. (2016). “Using historical data in fluvial geomorphology,” in Tools in fluvial geomorphology. Editors G. M. Kondolf, and H. Piegay 2nd edition (Chichester, UK: John Wiley & Sons), 56–75.
Guirguis, K., Gershunov, A., Hatchett, B., Shulgina, T., DeFlorio, M. J., Subramanian, A. C., et al. (2023). Winter wet–dry weather patterns driving atmospheric rivers and Santa Ana winds provide evidence for increasing wildfire hazard in California. Clim. Dyn. 60 (5–6), 1729–1749. doi:10.1007/s00382-022-06361-7
Gurrola, L. D., and Rogers, J. D. (2022c). Bedrock landslides and historic outbreak flood events. Santa Barbara, California, United States: Assoc. of Env. and Eng. Geol.
Gurrola, L. D., and Rogers, J. D. (2022b). Debris flow history of the Montecito watersheds. Santa Barbara, California, United States: Assoc. of Env. and Eng. Geol.
Gurrola, L. D., and Rogers, J. D. (2022a). Fire, flood, and landslide dam history: Community of Montecito and vicinity. The project for resilient communities. https://www.tprcsb.org/_files/ugd/056f9d_0230d73eec4b41829cfc6368e3dadda0.pdf.
Gurrola, L. D., and Rogers, J. D. (2020a). Flood history and landslide dam hazards of the Montecito watersheds. Santa Barbara, California, United States: Assoc. Env. and Eng. Geol.
Gurrola, L. D., and Rogers, J. D. (2020b). Geologic hazards due to landslide dams in the Cold Springs and Hot Springs watersheds. Santa Barbara, California, United States: Geol. Soc. America.
Haas, J. E., and White, G. F. (1975). Assessment of research on natural hazards. Cambridge, Massachusetts, United States: MIT Press.
Hayden, T. (2018). Internal records reveal mixed messages, missed opportunities before 1/9 debris flow. https://www.independent.com/2018/05/24/internal-records-reveal-mixed-messages-missed-opportunities-before-1-9-debris-flow/.
Hewitt, K. (1983). Interpretations of calamity from the viewpoint of human ecology. Geogr. Rev. 74, 226.
Hewitt, K. (1997). Regions of risk: A geographical introduction to disasters. Harlow, Essex, UK: Longman.
Huang, X., and Swain, D. L. (2022). Climate change is increasing the risk of a California megaflood. Sci. Adv. 8 (32), eabq0995. doi:10.1126/sciadv.abq0995
Huang, X., Swain, D. L., and Hall, A. D. (2020). Future precipitation increase from very high resolution ensemble downscaling of extreme atmospheric river storms in California. Sci. Adv. 6, eaba1323. doi:10.1126/sciadv.aba1323
Hutton, N. S., Tobin, G. A., and Montz, B. E. (2019). The levee effect revisited: Processes and policies enabling development in Yuba County, California. J. Flood Risk Manag. 12, e12469. doi:10.1111/jfr3.12469
Ipcc, (2007). AR4 climate change 2007. WGII: Impacts, adaptation, and vulnerability. Cambridge, United Kingdom: Cambridge University Press.
Ipcc, (2014). AR5 climate change 2014. WGII: Impacts, adaptation, and vulnerability. Full report Part A: Global and sectoral aspects. Cambridge, United Kingdom: Cambridge University Press.
Ipcc, (2022). AR6 full report. Climate change 2022. Impacts, vulnerability, and adaptation. https://report.ipcc.ch/ar6wg2/pdf/IPCC_AR6_WGII_FinalDraft_FullReport.pdf.
Jakob, M. (2005). A size classification for debris flows. Eng. Geol. 79, 151–161. doi:10.1016/j.enggeo.2005.01.006
Jakob, M., and Hungr, O. (2005). Debris-flows hazards and related phenomena. Berlin, Germany: Springer, 739.
Kean, J. W., Staley, D. M., Lancaster, J. T., Rengers, F. K., Swanson, B. J., Coe, J. A., et al. (2019). Inundation, flow dynamics, and damage in the 9 January 2018 Montecito debris-flow event, California, USA: Opportunities and challenges for post-wildfire risk assessment. Geosphere 15 (4), 1140–1163. doi:10.1130/GES02048.1
Keaton, J. “Review of contemporary terminology for damaging surficial processes – stream flow, hyperconcentrated sediment flow, debris flow, mud flow, mud flood, mudslide,” in Proceedings of the 7th International Conference on Debris-Flow Hazards Mitigation, Los Angeles, LA, USA, 2019. doi:10.1130/GES02048.110.25676/11124/173147
Keller, E., Adamaitis, C., Alessio, P., Anderson, S., Goto, E., Gray, S., et al. (2020a). Applications in geomorphology. Geomorphology 366, 106729. doi:10.1016/j.geomorph.2019.04.001
Keller, E., Adamaitis, C., Alessio, P., Goto, E., and Gray, S. (2020b). “Montecito debris flows of 9 January 2018: Physical processes and social implications,” in From the Islands to the mountains: A 2020 view of geologic excursions in southern California. Editors R. V. Heermance, and J. J. Schwartz, 95–114. doi:10.1130/GES02048.1.10.1130/2020.0059
Keller, E., and Capelli, M. H. (1992). Ventura River flood of february 1992: A lesson ignored? J. Am. Water Resour. Assoc. 28 (5), 813–832. doi:10.1111/j.1752-1688.1992.tb03184.x
Klein, C. A. (2019). The national flood insurance program at fifty: How the fifth amendment takings doctrine skews federal flood policy. Geo. Envtl. L. Rev. 31, 285.
Kusler, J., and Thomas, E. (2007). No adverse impact and the courts: Protecting the property rights of all. Report available at:https://s3-us-west-2.amazonaws.com/asfpm-library/Legal/ASFPM_NAI_Courts_Protecting_Property_Rights_All.pdf.
Lancaster, J. T., Spittler, T. E., and Short, W. R. (2015). Alluvial fan flooding hazards: An engineering geologival approach to preliminary assessment. Sacramento, California, United States: California Department of Conservation.
Lancaster, J. T., Swanson, B. J., Lukashov, S. G., Oakely, N. S., Lee, J. B., Spangler, E. R., et al. (2021). Observations and analyses of the 9 january 2018 debris-flow disaster, Santa Barbara county, California. Environ. Eng. Geosci. 27 (1), 3–27. doi:10.2113/EEG-D-20-00015
Lancaster, S. T., and Grant, G. E. (2006). Debris dams and the relief of headwater streams. Sci. Geomorphol. 82 (1-2), 84–97. doi:10.1016/j.geomorph.2005.08.020
Ludy, J. J. (2009). [Master Thesis] Master of Landscape Architecture. Berkeley, CA, USA: University of California at Berkeley.Before the flood: Misperception of flood risk in the sacramento-san joaquin delta
Ludy, J., and Kondolf, G. M. (2012). Flood risk perception in lands “protected” by 100-year Levees. Nat. Hazards 61, 829–842. doi:10.1007/s11069-011-0072-6
Lukashov, S. G., Lancaster, J. T., Oakley, N. S., and Swanson, B. J. (2019). “Post fire debris flows of 9 January 2018, Thomas Fire, southern California: Initiation areas, precipitation and impacts,” in Debris-flow hazards mitigation: Mechanics, monitoring, modeling, and assessment. Editors J. W. Kean, J. A. Coe, P. M. Santi, and B. K. Guillen (Golden, CO, USA: Association of Environmental and Engineering Geologists), 774–781.
Luković, J., Chiang, J. C. H., Blagojević, D., and Sekulić, A. (2021). A later onset of the rainy season in California. Geophys. Res. Lett. 48, e2020GL090350. doi:10.1029/2020GL090350
Lulloff, A. (2013). The floodway encroachment standard: Minimizing cumulative adverse impacts. Association of State Floodplain Managers (ASFPM). Report available at:https://s3-us-west-2.amazonaws.com/asfpm-library/FSC/General/ASFPM_The_Floodway_Encroachment_Standard_Minimizing_Cumulative_Adverse_Impacts_Lulloff_2013.pdf.
Madley, B. (2016). Understanding genocide in California under United States rule, 1846–1873. West. Hist. Q. 47 (4), 449–461. doi:10.1093/whq/whw176
Montecito Association History Committee, (2020). About Montecito and local history. https://www.montecitoassociation.org/about-montecito.
Morell, K. D., Alessio, P., Dunne, T., and Keller, E. (2021). Sediment recruitment and redistribution in mountain channel networks by post-wildfire debris flows. Geophys. Res. Lett. 48 (24). doi:10.1029/2021GL095549
Myrick, D. F. (1987). Montecito and Santa Barbara. Glendale, California, United States: Trans-Anglo Books.
National Marine Fisheries Service (Nmfs), (2014). Biological opinion for flood control operations including annual stream maintenance, Debris Basin maintenance, goleta slough dredging and long-term atascadero creek channel maintenance permitted by the U.S. Army Corps of engineers, and implemented by the Santa Barbara county flood control District in designated waters occurring within Santa Barbara county. Silver Spring, Maryland, US: National Marine Fisheries Service.
Noaa (National Oceanic and Atmospheric Administration), (1994). Climate of Santa Barbara. California, United States: U. S. Department of Commerce.
Nrc (National Research Council), (2004). Partnerships for reducing landslide risk: Assessment of the national landslide hazards mitigation strategy. Washington, D.C., United States: National Academies Press.
Oakley, N. S. (2021). A warming climate adds complexity to post-fire hydrologic hazard planning. Earth'sFuture 9, e2021EF002149. doi:10.1029/2021EF002149
Oakley, N. S., Lancaster, J. T., Hatchett, B. J., Stock, J., Ralph, F. M., Roj, S., et al. (2018). A 22-year climatology of cool-season hourly precipitation thresholds conducive to shallow landslides in California. Earth Interact. 22, 1–35. doi:10.1175/EI-D-17-0029.1
O’Keefe, P., Westgate, K., and Wisner, B. (1976). Taking the naturalness out of natural disasters. Nature 260, 566–567. doi:10.1038/260566a0
Patton, P. C., Baker, V. R., and Kochel, R. C. (2020). “Slack-water deposits: A geomorphic technique for the interpretation of fluvial paleohydrology,” in Adjustments of the fluvial system. Editors D. D. Rhodes, and P. W. G. P. Williams (London: Routledge), 225–253. doi:10.4324/9781003026709
Pelling, M. (2001). “Natural disasters?,” in Social nature: Theory, practice, and politics. Editors N. Castree, and B. Braun (Malden, Massachusetts, United States: Blackwell Publishers), 170–188.
Rivera, D. Z., Jenkins, B., and Randolph, R. (2021). Procedural vulnerability and its effects on equitable post-disaster recovery in low-income communities. J. Am. Plann. Assoc. 88, 220–231. doi:10.1080/01944363.2021.1929417
Rufat, S., Tate, E., Burton, C. G., and Maroof, A. S. (2015). Social vulnerability to floods: Review of case studies and implications for measurement. Int. J. Disaster Risk Reduct. 14, 470–486. doi:10.1016/j.ijdrr.2015.09.013
Sanborn Map Company, (1918). Insurance maps of Montecito. Santa Barbara California, United States: Sanborn Map Company.
Sanborn Map Company, (1940). Insurance maps of Montecito. Santa Barbara California, United States: Sanborn Map Company.
Sanborn Map Company, (1942). Insurance maps of Montecito. Santa Barbara California, United States: Sanborn Map Company.
Sanders, B. F., and Grant, S. B. (2020). Re-envisioning stormwater infrastructure for ultrahazardous flooding. WIREs Water 7 (2). doi:10.1002/wat2.1414
Santa Barbara Board of Realtors, (1980). Montecito history on terry ryken’s. https://terryryken.com/santa-barbara-area-information/montecito-history.
Santa Barbara County Flood Control and Water Conservation District, (1995). Floods. https://www.countyofsb.org/2155/Flood-Control.
Santa Barbara County Flood Control District, (1974). Flood plain information, Montecito streams, vicinity of Montecito. Available online at:https://usace.contentdm.oclc.org/digital/collection/p266001coll1/id/9686/.
Santa Barbara County Flood Control District, (1969). Floods: Electronic document. available at https://www.countyofsb.org/pwd/waterdownloads.sbc revised by James Stubchaer.
Santa Barbara County, (2018). Thomas fire and 1/9 debris flow recovery strategic plan. Retrieved from https://archive.senate.ca.gov/sites/archive.senate.ca.gov/files/committees/2017-18/emergencymanagement.senate.ca.gov/sites/emergencymanagement.senate.ca.gov/files/santa_barbara_county_recovery_strategic_plan.pdf.
Santa Ynez Band of Chumash Indians, (2020). Our history. https://www.santaynezchumash.org/chumash-History.
Serra-Llobet, A., Tourment, R., Montané, A., and Buffin-Belanger, T. (2022). Managing residual flood risk behind levees: Comparing USA, France, and quebec (Canada). J. Flood Risk Manage. 15, e12785. doi:10.1111/jfr3.12785
Stubchaer, J. M. (1972). Planning considerations and flood problems in the Montecito Area. dated June 28, 1972.
Swain, D. L., Langenbrunner, B., Neelin, J. D., and Hall, A. (2018). Increasing precipitation volatility in twenty-first-century California. Nat. Clim. Change 8, 427–433. doi:10.1038/s41558-018-0140-y
Thomas, E., and Medlock, S. (2008). Mitigating misery: Land use and protection of property rights before the next big flood. Vt. J. Environ. Law 9, 155.doi:10.2307/vermjenvilaw.9.2.155
Tierney, K. J. (2014). The social roots of risk: Producing disasters, promoting resilience. Redwood City, California, United States: Stanford University Press, 31–49.
Touma, D., Stevenson, S., Swain, D. L., Singh, D., Kalashnikov, D. A., and Huang, X. (2022). Climate change increases risk of extreme rainfall following wildfire in the Western United States. Sci. Adv. 8 (13), eabm0320. doi:10.1126/sciadv.abm0320
Unisdr, “Sendai framework for disaster risk reduction 2015—2030,” in Proceedings of the 3rd UN Conference on Disaster Risk Reduction, Sendai, Japan, March 2015.
United States Census, (2010). Montecito CDP, California. https://www.census.gov/quickfacts/montecitocdpcalifornia.
United States Geological Survey, (2022). What is a debris flow? https://www.usgs.gov/faqs/what-debris-flow#:∼:text=Debris%20flows%20are%20a%20type,Debris%2DFlow%20Forecasts%20Before%20Wildfires.
U.S. Army Corps of Engineers - Los Angeles District (Usace), (1974). Flood Plain information, Montecito streams, vicinity of Montecito. Washington, D.C. United States: USACE, Department of the Army.
U.S. Army Corps of Engineers - Los Angeles District (Usace), (1965). Report on coyote fire and resulting floods. Montecito, California, United States: Montecito Association History Committee archives.
U.S. Army Corps of Engineers Los Angeles District (Usace), (2018a). Channel clearing. https://www.spl.usace.army.mil/Portals/17/docs/Emergency%20Management/SB_CHANNELS_11518pao.pdf.
U.S. Army Corps of Engineers Los Angeles District (Usace), (2018b). Debris basins clearing. Alexandria, Virginia, United States: Society of American military engineers.
Verkaik, I., Rieradevall, M., Cooper, S. D., Melack, J. M., Dudley, T. L., and Prat, N. (2013). Fire as a disturbance in Mediterranean climate streams. Hydrobiologia 719, 353–382. doi:10.1007/s10750-013-1463-3
Ward, B., Toews, D., and Fayram, T. (2018). Santa Monica debris basin prevented major damages from occurring after heavy rains in wild fire burned areas in California, National Watershed Coalition. Available online at:https://watershedcoalition.org/wp-content/uploads/2021/11/Santa-Monica-Debris-Basin-6-2018.pdf.
White, G. F. (1994). Boulder creek flood Notebook. Online at:https://hazards.colorado.edu/archive/bcfn/(Accessed February 10, 2023).
White, G. F. (1945). Human adjustment to floods. Department of Geography, University of Chicago, Research Paper 29, 225.
White, G. F., Kates, R. W., and Burton, I. (2001). Knowing better and losing even more: The use of knowledge in hazards management. Glob. Environ. Change B Environ. Hazards. 3 (3-4), 81–92. doi:10.1016/S1464-2867(01)00021-3
Wisner, B., Blaikie, P., Cannon, T., and Davis, I. (2004). At Risk: Natural hazards, people’s vulnerability, and disasters. 2nd ed. Abingdon, UK: Routledge.
Wisner, B., Gaillard, J. C., and Kelman, I. (2012). The routledge handbook of hazards and disaster risk reduction. Abingdon, UK: Routledge.
World Population Review, (2020). Montecito, California population. https://worldpopulationreview.com/us-cities/montecito-ca-population.
Yamamura, J. (2020). Holy Grail of flood control to Be built in Montecito. https://www.independent.com/2020/08/21/the-holy-grail-of-flood-control-to-be-built-in-montecito/.
Keywords: risk as a process, floods after fires, debris flows, Thomas fire, Montecito, California, hazard planning, exposure evolution
Citation: Serra-Llobet A, Radke J, Kondolf GM, Gurrola L, Rogers JD, Lindbergh S and Douvinet J (2023) Risk as a process: a history informed hazard planning approach applied to the 2018 post-fire debris flows, Montecito, California. Front. Environ. Sci. 11:1183324. doi: 10.3389/fenvs.2023.1183324
Received: 09 March 2023; Accepted: 15 May 2023;
Published: 31 July 2023.
Edited by:
Salvador García-Ayllón Veintimilla, Technical University of Cartagena, SpainReviewed by:
Sarah Praskievicz, University of North Carolina at Greensboro, United StatesValentin Golosov, Lomonosov Moscow State University, Russia
Copyright © 2023 Serra-Llobet, Radke, Kondolf, Gurrola, Rogers, Lindbergh and Douvinet. This is an open-access article distributed under the terms of the Creative Commons Attribution License (CC BY). The use, distribution or reproduction in other forums is permitted, provided the original author(s) and the copyright owner(s) are credited and that the original publication in this journal is cited, in accordance with accepted academic practice. No use, distribution or reproduction is permitted which does not comply with these terms.
*Correspondence: Anna Serra-Llobet, YW5uYXNlcnJhbGxvYmV0QGJlcmtlbGV5LmVkdQ==
†ORCID: Anna Serra-Llobet, orcid.org/0000-0002-1520-1927