 M. Mardani Najafabadi
 F. Rastegaripour
 F. Yavari4
- 1Department of Agricultural Economics, Faculty of Agricultural Engineering and Rural Development, Agricultural Sciences and Natural Resources University of Khuzestan, Mollasani, Iran
- 2Department of Agricultural Economics, University of Torbat Heydarieh, Torbat Heydarieh, Iran
- 3Saffron Institute, University of Torbat Heydarieh, Torbat Heydarieh, Iran
- 4Department of Agricultural Economics, Sari Agricultural Sciences and Natural Resources University, Sari, Iran
- 5Department of Agricultural Economics, University of Zabol, Zabol, Iran
Introduction: During the last decades, environmental pollution has been considered one of the challenges of the agricultural sector, which has affected the relationship between the ecological and economic performance of agricultural products.
Methods: In this study, the DEA-MBP approach based on the SBM model has been used to investigate the eco-efficiency of saffron farms in Iran. The main purpose of this approach is to decrease GHG emissions by mitigating the use of highly polluting production inputs.
Results: The results showed that the average eco-efficiency is estimated at 74% and is 12% lower than technical efficiency without considering environmental issues. Therefore, saffron producers are 26% far from full efficiency, and they must change their consumption of inputs and production of inputs according to environmental issues in order to achieve it. Excessive use of diesel fuel and fungicides is cause of GHG emissions in these farms.
Discussion: The use of sustainable and ecological cultivation methods in farms in order to reduce the consumption of chemical fertilizers and fungicides should be considered. Replacing old machinery and repairing them can also considerably reduce fuel consumption and GHG emissions.
1 Introduction
One of the important and complex problems in agriculture is considering the mutual relationship between economic development and the environment. Although agricultural activities are essential to human society and have some advantages such as food supply, income for farmers, and the growth and development of rural areas, these activities have caused the 26% of GHG emissions and climate change at the international level from 2006 to 2016 (FAO (2018). Maintaining environmental quality and balance between human activities to pursue the objectives of economic development and the capacity of natural regenerative resources is one of the global challenges. For this purpose, several international organizations such as the UN and the UNFCCC have pushed for the realization of the sustainable development paradigm. However, the prevalence of unsustainable agriculture in most countries has raised widespread concerns in the international arena. It has turned the need to consider the increasing economic gains given the importance of sustainable development as one of the challenges for researchers and policymakers (Martinsson & Hansson, 2021).
Estimating ecological and economic efficiency (EEE) or eco-efficiency in different sectors of agriculture has received much attention from researchers on how to increase sustainability in agriculture. Eco-efficiency was introduced as an operational concept to assess sustainability in 1990 (Schaltegger, 1996), and it was revised by the World Trade Council for Sustainable Development to encourage producers to compete and be more environmentally friendly in 1992 and 2000 (Schmidheiny, 1992; WBCSD, 2000). In fact, by estimating EEE, it is determined to what extent environmental damage can be reduced and, by minimizing damage to the environment, sustainable development can be improved in economic enterprises (Pang et al., 2016; Güngör et al., 2022).
Eco-efficiency can be used at both macro and micro levels. At the macro level, the concept of EEE reminds us that GDP growth should not be related to negative effects on the environment as much as possible. Besides being satisfied with the increase in consumption of goods, society should benefit from a good quality environment (Zhong et al., 2022). At the micro level, EEE means that greater economic value can be achieved with less environmental damage. It should be mentioned that since this measure is relative, its improvement does not necessarily guarantee the production’s sustainability, and to ensure sustainability, definite amounts of pressure imposed on the environment should be considered (Huppes & Ishikawa, 2005). However, despite the limitations of EEE, this measure is very important and popularity. One of the advantages of EEE is the identification of actionable policy goals rather than mandatory activities such as limiting the level of economic activity. Improving EEE includes units that often do not produce at the economic efficiency Frontier; Therefore, in addition to reducing environmental effects, there is an opportunity to save production costs (Ekins, 2005).
Saffron planting is considered a strategic and vital component of the national economy of Iran due to its unique position in job creation in the agricultural sector and the creation of significant foreign exchange income for this country. Some of the particular advantages of saffron are low irrigation, high product durability, exploitation for 5–7 years in one planting period, ease of transportation, productive employment, and significant currency enhancement, which has led to the development of its cultivated area in Iran, especially in areas without agricultural potential (Saeidi et al., 2022). The product’s compatibility has made Iran the largest producer of saffron in the world, producing 430 tons of saffron in 2019, more than 90% of global production and 3.5% of global market share (Statista, 2020). Given the benefits of saffron cultivation, increasing the production and yield of this product also has caused many environmental problems. The negative consequences of saffron cultivation have been estimated as GHG emissions and nitrogen and phosphorus flow of 18.54, 8.18, and 5.18 million tons per year, respectively, in Khorasan Razavi province, Iran (Bakhtiari et al., 2015). Thus, considering the environmental pollution in calculating the efficiency of saffron-producing units can identify the units that have been active in economic saffron production and have caused the least damage to the environment, and introduce them as a suitable model for others. In this regard, the present study examined this criterion at the level of saffron farms and identified the inputs that had the most significant impact on eco-inefficiency by determining the factors related to eco-inefficiency.
1.1 Review of literature
To estimate efficiency, there are two main approaches, parametric and non-parametric. Parametric approaches are specified by a functional form, while non-parametric approaches do not require an specific functional form (Mardani Najafabadi et al., 2023). Currently, one of the most widely used methods of evaluating efficiency in agricultural production is data envelopment analysis (DEA), which is known as a non-parametric approach. The main advantage of this method is the ability to use multiple inputs and outputs to measure the relative efficiency of a set of homogeneous decision-making units or DMUs (Sabouhi & Mardani, 2017). On the other hand, one of the topics that have been the focus of researchers in the field of efficiency evaluation with regard to environmental issues is the Material Balance Principle (MBP). The law of conservation of matter/energy is a basic biophysical condition that states that the flow leaving or entering the environment is equal or balanced. However, Lauwers (2009) stated that MBP had been neglected in most studies conducted in this field. One of the most common models in the field of introducing undesirable data into efficiency measurement models is the Directional Distance Functions (DDF) introduced by Chung et al. (1997). However, despite the popularity of this model and many models of EEE estimation, Coelli et al. (2007) raised many criticisms that these models are not compatible with MBP.
Many studies have been conducted in examining EEE and various efficiency indicators have been used for this purpose. The first studies in this field have generally attentive to the effect of pollution control on economic growth at the macro level (Christainsen & Haveman, 1981; Gollop & Roberts, 1983; Färe et al., 1989). Using this method, several limited studies have been performed at the micro level, including the study of Pashigian (1984) and Pittman (1981). Later, Pittman (1983) calculated the EEE of Wisconsin paper factories by incorporating environmental variables into common productivity indicators. In this method, pollution is considered a cost variable. The important point about adjusted productivity indicators is that, unlike conventional inputs and outputs (IOs), the price of undesirable variables such as pollution is not known, and some proxies (observed indicators such as pollution taxes) should be used for the price of these variables (Coelli et al., 2007). The first studies that included environmental variables were also evaluated on the assumption that reducing pollution is a costly activity.
In general, environmental efficiency studies can be classified into two important categories by considering environmental pressure variables as undesirable inputs or outputs (Long, 2021). A large part of the first studies in this field have incorporated environmental pressures such as pollution or waste increase as undesirable inputs or outputs into efficiency measurement models (Tyteca, 1997), and the other part focused on the explanation of EEE as the economic value ratio and environmental damage (Kuosmanen & Kortelainen, 2005), much attention was paid to ecological characteristics, and unlike the first category models in which physical IOs entered the model directly, only economic value added and environmental variables were included in the model (Kuosmanen & Kortelainen, 2005; Picazo-Tadeo et al., 2011; Martinsson & Hansson, 2021).
Many studies in the first category have used Frontier models to measure the EEE introduced by Tyteca (1997). These models are placed in two categories of parametric and nonparametric Frontier approaches. Lauwers (2009) in his study showed that most studies on efficiency measurement models, including nonparametric Frontier models, have not considered the MBP. Coelli et al. (2007) also examined some studies in EEE with DEA models (Färe et al., 1989; Färe et al., 1996; Reinhard et al., 2000) and showed that these studies are only compatible with MBP requirements in certain conditions and do not comply with this principle in general. In this regard, Coelli et al. (2007) criticized the DEA models used in these papers, including the DDF model that is matchable with MBP requirements. In another study, the network DDF model combined with the MBP was used to estimate the EEE of coal-fired power plants in the US (Färe et al., 2013).
Among the drawbacks of the DEA-MBP model presented by Coelli et al. (2007) model is that, first, it does not consider the actual amount of pollution that is difficult to find in agriculture. Also, this model cannot show the difficulty of the production and disposal of pollutants. Finally, when the number of inputs is too large, the validity of the results is severely influenced (Arabi et al., 2017). Overall, a more inclusive and MBP-compliant model is needed to measure EEE. Later, Arabi et al. (2017) provided a complete model, including input-orientation and easy application of others, and the inability of distance models and Slacks-Based models (SBM) introduced by Färe et al. (2013) in determining the optimal composition of fuels.
According to review studies done by Zhou et al. (2018) and Emrouznejad and Yang (2018), the agriculture sector had the highest focus of studies during 2015–2016. Many studies have also applied the DEA approach in this area, including Grassauer et al. (2021) who used a combination of DEA and LCA approaches to estimate the EEE of Austrian farmers with different types of agricultural activities.
Martinsson and Hansson (2021) examined the EEE of the dairy farmers in Austria and used zero net emissions by 2045 to determine a specific emissions threshold. Some research shows that most industrialized countries such as China have low EEF (Yao et al. (2018); Pang et al. (2016) examined the EEE of the agricultural sector in China. For this purpose, he used the DEA technique and the Theil index. In this study, non-radial SBM models have been used, and several undesirable outputs of total nitrogen, total phosphorus and agricultural plastic waste have been considered; Gómez-Limón et al. (2012) calculated the EEE of olive farms using the DDF and distinguished in Andalusia (Spain). Picazo-Tadeo et al. (2011) examined the EEE of drip-irrigation farms in Castilla y León (Spain). The study of several environmental indicators and the calculation of deficiency and excess of these indicators for production units were among the innovations of his study.
Selecting environmental-economic variables based on type of activity is one of the important issues in the study of EEE. In some studies, various variables have been used as environmental pressure indicators. Nemecek et al. (2011) divided environmental indicators into three main groups: resource, nutrient, and pollution indicators. Each category considers different aspects of the environment and different management options. For example, Martinsson and Hansson (2021) considered the cost of fuel, heating equipment, and the cost of fertilizers as indicators of environmental pressure. Grassauer et al. (2021) used cumulative energy demand, normalized eutrophication potential, and global warming potential. Urdiales et al. (2016) used carbon dioxide emission data. Arabi et al. (2017) applied sulfate gas produced in a power plant over a 1-year period as an indicator. Mulwa et al. (2012) selected excess nitrogen and phosphate fertilizers as the environmental pressure indicators.
After thorough research on different past studies and environmental data, we applied excess carbon dioxide equivalent as an environmental pressure indicator in the present study. It is worth mentioning that no study has been done so far to calculate the EEE of saffron, and only in some, environmental issues of cultivation of this crop have been investigated. For example, in the study of Bakhtiari et al. (2015), the emission rate equivalent to carbon dioxide in the saffron production cycle during 5 years was calculated using conversion coefficients of inputs. Feizi et al. (2015) investigated the energy efficiency of saffron in Khorasan Razavi province. According to their study, saffron farms had an stable and efficient system (economically) in the Khorasan Razavi province.
Thus, this study aimed to investigate the EEE of saffron producers using the DEA-MBP model. In addition, examining the difference between the optimal consumption of inputs in the two cases, with and without considering the environmental pressure is another goal. In general, this study has contributed to the literature in two aspects. First, the DEA-MBP method has not been used in agriculture so far. Second, the calculating method of the environmental pollutant variable has been introduced for the first time; thus, the interaction of the environmental and economic variables is better indicated. In addition, this type of calculation is consistent with the limitations of the lack of proportionate GHG emission data from agricultural activities and provides valuable information to the researcher.
1.2 Case study
Saffron is widely cultivated in Iran due to its high added value. The main centers of saffron production in this country are the Khorasan Razavi and South Khorasan provinces and 76% of Iranian saffron is produced in these two provinces (Statista, 2020). South Khorasan province ranks second in saffron cultivation with 17,000 ha of cultivated area and production of 66 tons of this product. Meanwhile, Ghaen County is considered the saffron capital of Iran and with an global brand in saffron production in terms of the quality of this product (Bazrafshan et al., 2019). This County is located in the east of Iran and the north of South Khorasan province at latitude: 15.33 and longitude: 34 and 38.58–56.60 (Figure 1). The climate of this County is highly influenced by the heights of the mountains are stretched in the vicinity of that. Ghaen County is located such that at the beginning of the cold season, it is announced as the coldest point in Iran (Khanali et al., 2017). The average annual rainfall in this County is 180 mm, and it is recognized as the rainiest County in the province. The fluctuations and changes in temperature are high in Qaen both temporally and spatially. The range of average monthly temperature changes during the year is 23.5°C. The absolute maximum and minimum are 41ºC and 28°C, respectively. Due to the geographical and climatic location of this County, the cultivation capability of strategic crops such as saffron is of great importance (Statistical Center of Iran, 2020).
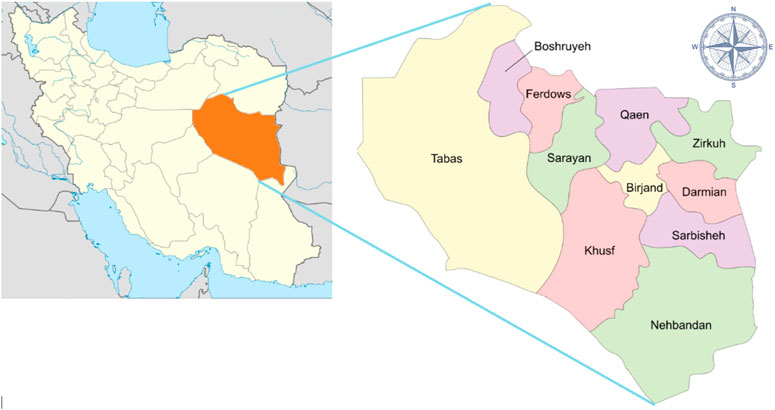
FIGURE 1. Geographical location of Ghaen County.
2 Materials and methods
In this study, to calculate the EEE at the farm level, the DEA-MBP model developed by Arabi et al. (2017) was selected and adjusted based on the IOs of saffron production and the appropriate environmental pressure index. In this section, first, the DEA model and the MBP were explained, and the integration of MBP requirements in DEA models was also discussed. Then, a comprehensive model of EEE, considering the inputs in three categories of high and low pollutants and independent variables are presented. Finally, the IOs used in the research and how to estimate them are explained. The conceptual framework of the steps to determine the EEE of saffron is shown in Figure 2. The following presents the additional explanations of this Figure.
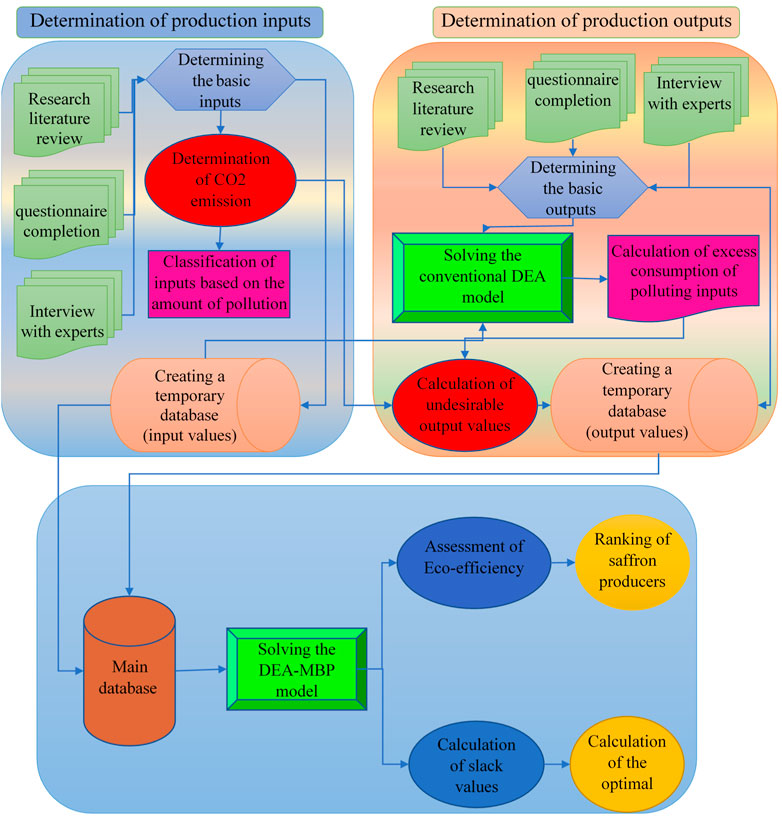
FIGURE 2. Conceptual framework to determine the EEE of saffron.
2.1 Data envelopment analysis (DEA)
DEA is a non-parametric method that determine the efficiency of those DMUs that have similar IOs using the linear programming and does consider the basic assumption of a consequential relationship between IOs (Mardani Najafabadi & Taki, 2020). As this approach encompasses all numbers and information, it is known as comprehensive data analysis. This method is used in the study of Charnes et al. (1978) based on Farrell’s approach. Then, efficiency calculations in different conditions were invented and introduced by different DEA models (Emrouznejad & Yang, 2018).
2.1.1 The conditions of DEA-MBP models
In the following, first the conditions of material balance and incompatibility of DDF model with these conditions are expressed. To use MBP Equations, if α and b are defined as the non-negative coefficients, the amount of pollution can be calculated as:
Where X, y and Z are inputs, outputs and pollution rate per unit of production, respectively.
The DDF model is that the model seeks the maximum amount of
For efficient units, if
The Coelli et al. (2007) model can be represented as model (2) by considering N DMUs:
where o represents the DMU under study,
2.1.2 Modified DEA-MBP model
There are several models that comply with the MBP requirements. Here is an SBM model for calculating inefficiency as model (3) (Färe & Grosskopf, 2010):
Finally, in order to model EEE in a wider way and to solve the defects of model 3, the inputs are classified into two categories of high and low pollutants. Based on this, the EEE model is presented as an alternative to model (4):
The definition of symbols in this model is as follows:
Obviously, we should have
2.2 Statistical sampling
The statistical population of this research is saffron producers in Ghaen County in South Khorasan province in Iran. The data used for the DEA-MBP model (Eq. 4) is cross-sectional. Therefore, the information needed to calculate the EEE was collected by completing 237 questionnaires by saffron growers in the region in 2020 using random sampling.
2.3 Input and output (IO) data
The input and output data used in Model (4) are explained below. In past studies in the field of investigating the efficiency of saffron farms, these variables have been used as the main inputs and outputs (Bakhtiari et al., 2015; Feizi et al., 2015). In this model, the inputs used were classified into three groups of inputs with high pollution, low pollution, and independent variables. Thus, to achieve greater EEE, we can replace low-emission inputs with high-emission inputs. Also, the environmental pressure variable enters the model as an undesirable output, to increase the desired output (economic variable) and minimize environmental pollution. In the present study, the equivalent carbon dioxide excess is considered as a variable of environmental pressure (Nemecek et al., 2011; Picazo-Tadeo et al., 2011; Urdiales et al., 2016; Grassauer et al., 2021; Martinsson & Hansson, 2021). In order to calculate this variable, the conventional DEA model was first estimated and the input consumption excess was calculated. Finally, using the GHG conversion coefficients, the CO2 equivalent of pollutant inputs was calculated and its sum as the undesirable output entered the model (Figure 2). Also, based on the EEE model, the inputs used were divided into three categories of inputs with high pollution, low pollution and independent variables. The classification of these inputs was performed according to the conversion coefficients of GHG. Thus, the inputs with a conversion coefficient higher than 1, was assigned to highly-pollutant inputs and inputs with a coefficient of less than 1 were dedicated to the low-pollutant inputs (Guo et al., 2022). Also, two inputs of water and seed are independent inputs in this study.
2.3.1 Production inputs
1- Seed: Saffron cormis the main factor in the growth of saffron flowers and choosing a good daughter corms from mother corms is one of the most significant factors affecting the quality of saffron. This corm is usually oval-shaped and contains brown straws that protect it from dryness and soil heat by absorbing moisture.
2- Water: Suitable water supply in terms of quantity, quality and irrigation schedule is a key strategy in achieving appropriate saffron yield. Saffron has high irrigation efficiency and drought tolerance, and although it needs irrigation in arid regions such as Iran, it has less irrigation requirement than other conventional agricultural products. Experts believe that plants that have more main root length, number of lateral roots, root length density and root-to-shoot ratio are more resistant to drought tolerance (Farooq et al., 2009).
3- Chemical fertilizers: Phosphate, nitrogen, and phosphorus fertilizers are the most widely used chemical fertilizers in saffron cultivation. The determination of the amount of use of these fertilizers, according to the amount of these elements in the farm soil and also their timely use, in addition to affecting the amount and quality of saffron, it is effective on the amount of GHG emissions and pollution of water resources.
4- Animal manure: Animal manure is used to provide the organic matter needed by the saffron plant. The replacement rate of this fertilizer with chemical fertilizers and determining the appropriate time of its use affects the quality and quantity of saffron products.
5- Fungicides: The color, smell and taste of saffron are attractive to many rodents, birds, insects, etc. One of the methods to fight against pests and diseases of saffron is to disinfect the bulbs with fungicides and acaricides before planting. Also, the fungicides are useful to prevent or minimize the attacks of fungi as Fusarium oxysporum and Rhizoctonia violacea.
6- Manpower: This variable is the number of hours of manpower use per hectare during the production period of saffron. In Iran, for saffron cultivation, high manpower is used compared to conventional crops such as wheat. However, according to some studies, the number of manpower decreases with increasing land size, which indicates an increase in dependence on machinery with increasing land size.
7- Machinery: In different stages of planting, growing and harvesting saffron products, different machines are used along with manpower and as a substitute for manpower. The total hours of use of these machines per hectare has been used as a machineries variable in estimating the efficiency of saffron.
8- Diesel fuel: The use of agricultural machinery from fossil fuels is one of the main causes of GHG emissions. The amount of diesel fuel used per hectare has been used as one of the input variables in calculating efficiency. The use of old and disproportionate machines with agricultural operations and farm area is one of the factors of high fuel consumption in saffron fields.
2.3.2 Production outputs
As mentioned before, in this study, saffron stigma is considered as a desirable output and the equivalent carbon dioxide excess GHG as an undesirable output.
1- Saffron stigma: Saffron stigma is the most important part of saffron that is used as coloring and flavoring agent. Therefore, the yield of stigmas harvested per hectare is considered as the desirable output.
2- The carbon dioxide equivalent excess of inputs: Due to the lack of comprehensive information on the net emission of GHG from saffron farms, the total carbon dioxide equivalent of GHG from the consumption of inputs was applied according to previous studies (Nemecek et al., 2011; Urdiales et al., 2016; Grassauer et al., 2021; Martinsson & Hansson, 2021). Since some of these inputs are absorbed by the plant, in this paper, only the excess consumption of polluting inputs is considered as undesirable output for each farm. Thus, this variable, instead of measuring the pollution potential of inputs, has been calculated according to the f excess farm consumption of these inputs. This indicates the effect of technical inefficiency of farms on the level of environmental pressure and the relationship between economic and environmental issues is emphasized.
2.4 Data processing
In order to calculate the undesirable output mentioned in the above paragraph, first, the envelopment analysis model of conventional output-oriented data was estimated and based on that, the excess consumption of inputs was calculated using the output and inputs referred in the research. Then, the excess carbon dioxide equivalent consumption of GHG emission inputs was calculated using the GHG conversion coefficients of each input and their sum was entered into the model as undesirable output. The GHG conversion ratio of the inputs used in this research is shown in Table 1.
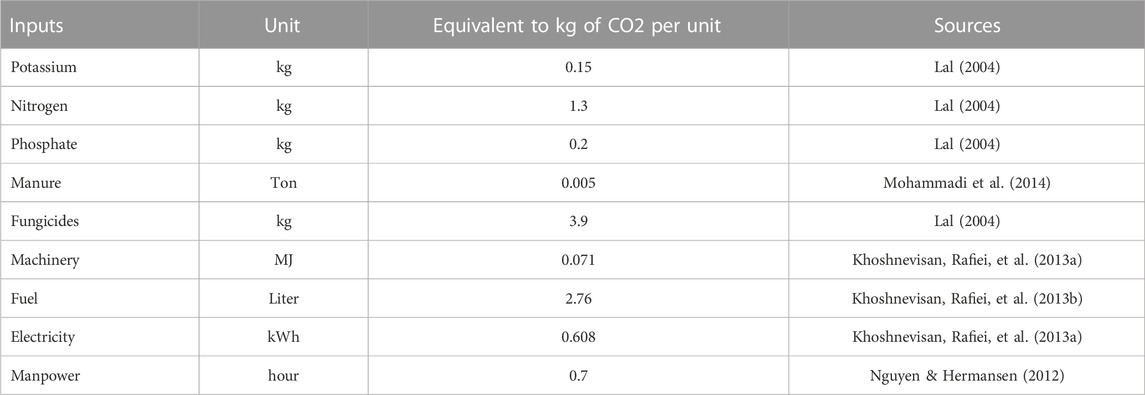
TABLE 1. GHG conversion coefficients of saffron production inputs.
A statistical description of the IOs defined above is given in Table 2. As mentioned earlier, the inputs used are divided into three categories of high-pollution, low-pollution and independent inputs, which are categorized according to the size of the GHG conversion coefficients of each input (Table 1). Thus, the inputs with a conversion coefficient greater than 1 kg/unit are selected as high pollutant inputs and inputs with a conversion coefficient of less than 1 are low pollutant inputs. This classification enables the model to replace high-polluting with low-polluting inputs, in addition to minimizing the consumption of inputs (product maximization).
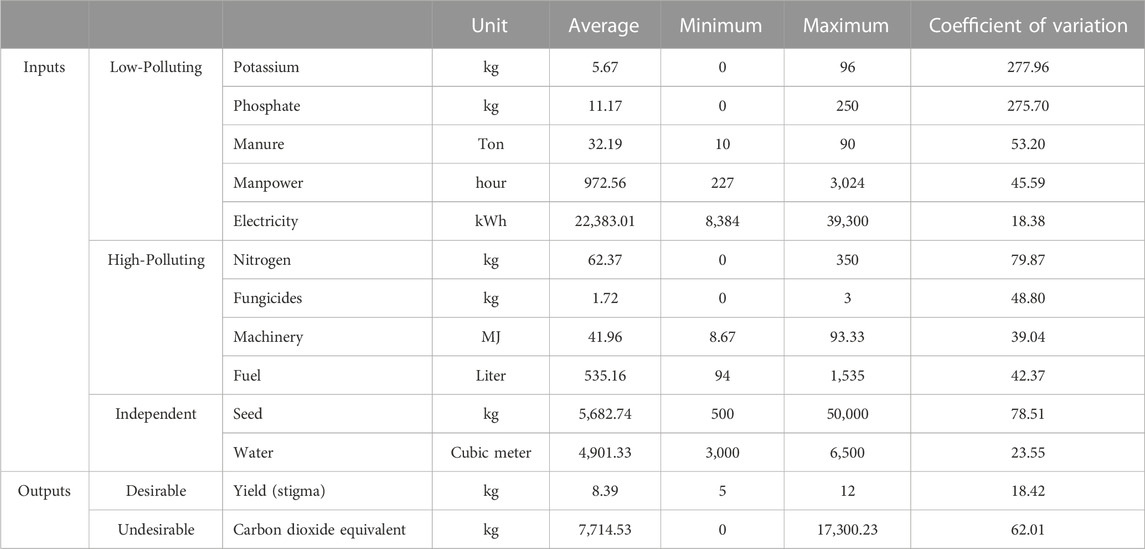
TABLE 2. Statistical description of IOs used in saffron cultivation in Ghaen County per hectare.
According to Table 2, among the inputs, the highest coefficient of variation is assigned to chemical fertilizers of potassium (277.96), phosphate (275.70) and nitrogen (79.78), and after seed input, animal manure has the highest variation coefficient. This can be due to the replacement of chemical fertilizers with each other and with animal manure in different farms. It is worth to mention that the carbon dioxide equivalent, which is considered as the potential of each unit in environmental pollution, also has a high coefficient of variation, which indicates the difference between the use of units of different inputs and with different polluting percentage. Therefore, it can be concluded that modifying the method by which units use different inputs and considering environmental factors, can have a significant effect on reducing environmental pollution.
3 Results
In this section, the results of estimating the EEE based on the model of Arabi et al. (2017) and also, the results of technical efficiency (TE) by non-radial SBM method are depicted in Table 3. According to the results, the average TE of saffron growers in Ghaen is equal to 86%, but by considering environmental pollution, their TE is reduced to 74%. In other words, neglecting environmental issues causes the efficiency of saffron producers to be calculated 12% higher than its actual value. The number of efficient units in the estimation of EEE and TE are 97 and 51 units, respectively. The efficiency of 46 additional units (97–51 = 46) in EEE shows that although these producers are inefficient considering only technical efficiency factors, when environmental issues are also considered, these units are efficient in terms of EEE. This means that even though these units have lower output production or higher input consumption, they have lower GHG emissions than the other units. In other words, the reduction in environmental pressure has compensated for the lack of product production or excess consumption of inputs. However, the average value of TE is higher than EEE, and the reason is that the number of units with an efficiency score below 50% is 0 and 49 units for TE and EEE, respectively. In other words, about 22% of the units have an efficiency score of less than 50% in EEE, which has caused a sharp decrease in this type of efficiency.
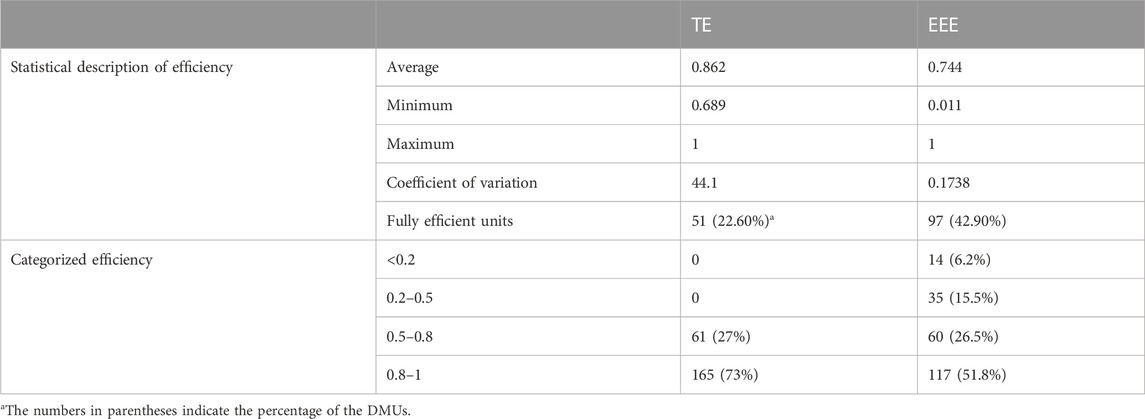
TABLE 3. Results of TE and EEE of saffron producers in Ghaen County.
Then, the average of the actual and desired amount of consumption IOs produced was calculated using the deficits and excesses extracted from the models and the results are presented in Table 4. The percentage change of the average optimal consumption compared to the actual consumption of low-polluting inputs in the EEE model is positive. In other words, inefficient units should increase the consumption of these inputs in order to achieve efficiency. As expected, the percentage change in polluting inputs is negative and consumption of these inputs in inefficient units should be decreased. Among polluting inputs, nitrogen fertilizer has the highest change percentage, and inefficient units should reduce their nitrate fertilizer consumption by about 42% to achieve EEE.
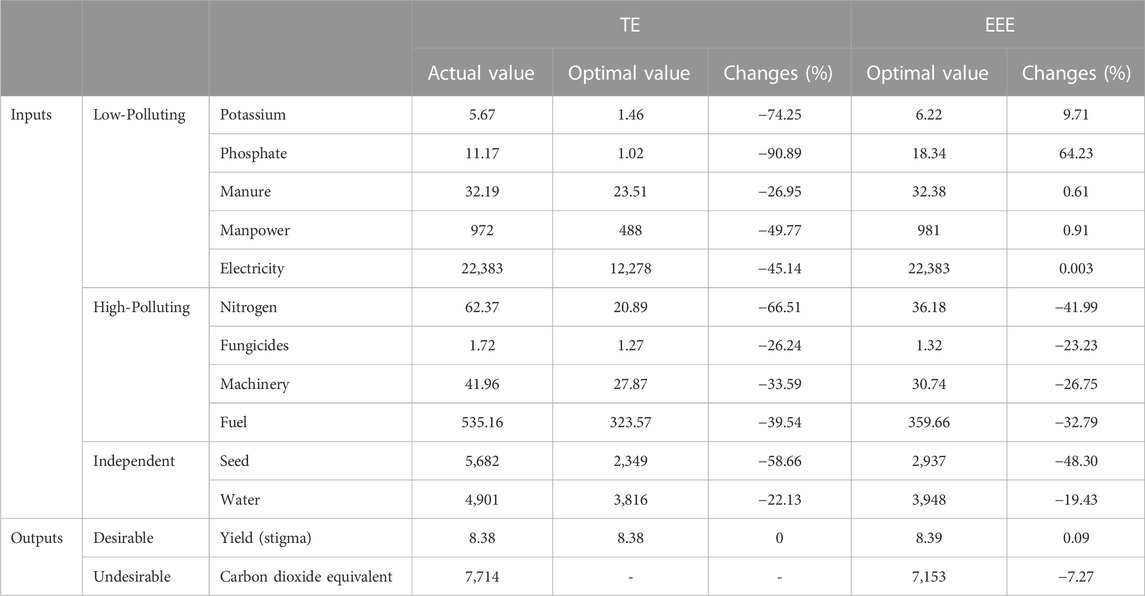
TABLE 4. The average optimal consumption of inputs and the percentage of their changes to the actual consumption.
Given that the slack-based models are not radial and calculate efficiency from both the maximization of outputs and the minimization of inputs, the excess or deficient amount of outputs can also be observed. In the SBM model, inefficient producers have the maximum production of saffron due to the consumption of inputs and the percentage of changes in the optimal production of saffron output is zero compared to the current production of producers. In the EEE model, the percentage of changes in saffron output is very small and indicates that the production of saffron is optimal, but in order to achieve this efficiency, Ghaen saffron growers should reconsider the consumption of input and, on average, reduce their carbon dioxide emissions by 7.27 percent. The percentage of changes in the consumption of inputs compared to the actual value obtained from the TE model indicates that the highest percentage of changes is assigned to the three inputs of phosphate, potassium, and nitrogen. The percentage change of the average optimal consumption was −91, −74 and −67 percent, respectively, in relation to their value for these three inputs. Therefore, without considering the amount of environmental pollution, farmers can greatly increase their TE by reducing the consumption of these three inputs. The lowest percentage of changes is assigned to three inputs of water (−22), fungicide (−26) and animal manure (−27).
According to the results in Table 4, the highest percentage of changes in the average optimal consumption compared to the actual value was obtained from the EEE model regarding phosphate input. However, it should be mentioned that the average optimal amount of phosphate consumption in this model is higher than the average actual value. Thus, in order to increase their EEE, farmers should increase their consumption of the low-polluting input by 64%. However, for nitrogen fertilizer, which is a highly polluting input, farmers should reduce their consumption by 42% to achieve full efficiency. The third eco-inefficiency factor of input is seed, and farmers should reduce seed consumption by 48% to achieve efficiency. The optimal consumption of this input in the TE model was on average 58% lower than the average actual consumption. Also, the lowest percentage of changes was related to electricity, animal manure and labor inputs, and farmers had to increase the amount of these inputs as small 0.003, 0.61, and 0.91, respectively.
For better indication of the eco-inefficiency factors of inefficient units, the percentage change of pollutant inputs and undesirable output is shown in Figure 3. According to this figure, the most important factor of inefficiency of saffron producers in Ghaen Country is the shortage of phosphate fertilizer consumption and then the excess consumption of nitrogen fertilizer, diesel fuel and machinery. Also, on average, inefficient producers should reduce their carbon dioxide equivalent output by 7.27 percent. Among these inputs, electricity with a percentage change of 0.003%, manure (0.61), and labor (0.91), had the least effect on inefficiency of producers and should slightly increase the consumption of these inputs.
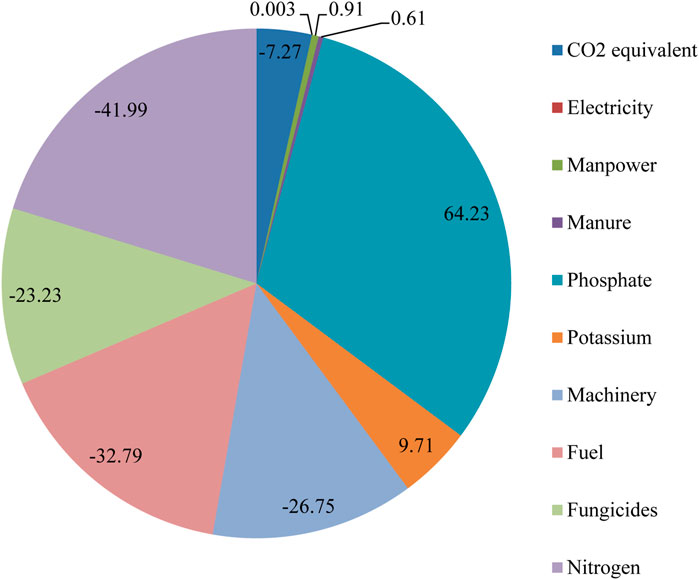
FIGURE 3. Percentage of changes in the optimal average of IOs relative to their actual value.
4 Discussion
In this study, the EEE was evaluated according to the GHG emission from agricultural activities in saffron cultivation. In this section, the results obtained from this model are investigated and compared with the results of studies performed in this field. According to the results, the resulting EEE is 12% lower than the TE of saffron growers and its average has reduced from 86% to 74%. In other words, without considering the environmental issues and GHG emissions associated with crop production, TE is estimated to be 12% higher than actual value. In addition, the minimum efficiency obtained in the TE model is 68% and is 1% in the EEE model, and even 22% of the units in this model have an efficiency of less than 50%. Also, the difference in indicating the number of units with the efficiency higher than 80% is 22%. This means that 48 units represent efficiencies above 80% by mistake, regardless of environmental pressure. Absolute attention to producing the maximum possible output using the minimum input may lead to maximum technical efficiency for DMUs, but this action may increase the amount of environmental pressure and lead to low EEE. Therefore, in estimating EEE, inputs with less pollution are replaced by inputs with high pollution.
According to the results of calculating the deficiency and excess consumption of inputs and production of outputs from the SBM-based models, in both models of TE and EEE, chemical fertilizers were the most important factors of unit inefficiency. However, in the first model, phosphate and potassium fertilizers should be reduced and in the second model, they are increased. This is logical as phosphate and potassium fertilizers produce less GHG than highly polluting inputs such as nitrogen. In other words, these inputs replace high-polluting inputs to reduce the damage to the environment (undesirable output) by keeping or increasing the economic value of the activity (desirable output). In a study done by Picazo-Tadeo et al. (2011), Nitrogen has been one of the most important causes of eco-inefficiency of the studied farmers. It is worth to mention that considering different indicators for measuring environmental pressure also leads to different EEE outcomes (Grassauer et al., 2021). For example, the present study emphasizes on reducing nitrogen input and increasing the input of phosphate fertilizers in order to reduce GHG emissions, but if the phenomenon of Eutrophication is considered as an indicator of environmental pressure, as phosphate fertilizers are effective on this index (Khoshnevisan, Rafiee, et al., 2013b), different results may be obtained. However, the amount of phosphate fertilizer in the studied saffron farms (average, 11.7 kg/ha) is less than this amount in studies on other areas (Feizi et al., 2015).
In the EEE model used in this study, it is attempted to change the way of using inputs and replace high-polluting inputs with low-polluting inputs, while maintaining the desirable output as possible, the GHG emissions can be reduced. As shown in Table 4, the average optimal amount of production by considering the environmental pressure, has been approximately equal to this rate in the conventional efficiency model. However, to achieve optimal efficiency, inefficient units should, on average, reduce the carbon dioxide equivalent produced from their GHG as 560.81 kg (27.7%). This change is achieved by replacing high-polluting inputs with low-polluting inputs. Therefore, in the conventional TE model, the percentage change of the optimal average consumption value is lower than the actual consumption value of all inputs, while in the EEE model, this value is increasing for low-polluting inputs and decreasing for high-polluting inputs. Therefore, in order to achieve full efficiency, inefficient farmers should reduce their consumption of polluting inputs such as nitrogen, diesel fuel machines and fungicides, and instead increase the use of electricity, manpower, animal manure, phosphate and potassium inputs.
The relationship between TE and EEE is depicted in Figure 4. According to this figure, the correlation between TE and EEE has been positive. Also, among the rankings obtained from the two calculated efficiency criteria, Spearman coefficient was equal to 0.775 and significant at the level of 1%. Therefore, as mentioned before, EEE only calculates and analyzes the relative pressure on the environment, and the amount of reduction in polluting inputs should be higher than the amount calculated. Indeed, this criterion by considering economic issues along with environmental issues, is an easier and more appropriate approach to be used by policy makers. This is especially evident in third world countries with lower levels of economic prosperity.
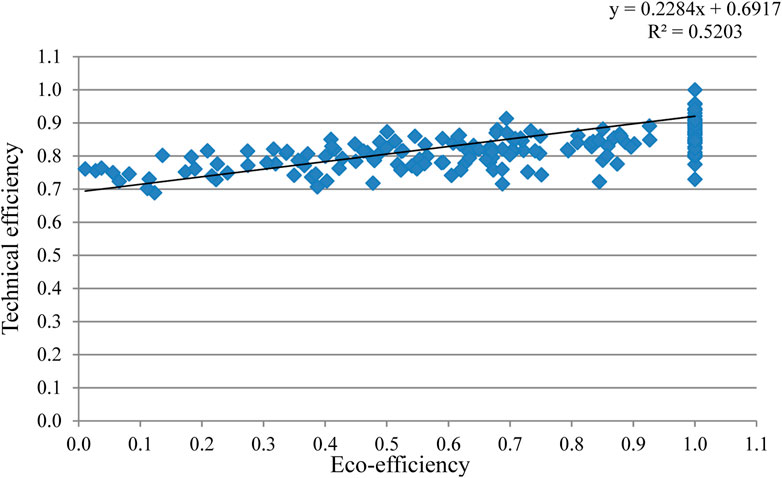
FIGURE 4. Relationship between TE and EEE.
5 Conclusion
Considering the importance of the environmental sustainability conservation, this study aimed to calculate the EEE of saffron growers in Ghaen County in Iran. Given the importance of compliance with the requirements of the MBP in estimating the EEE, the efficiency model consistent with the MBP of Arabi et al. (2017) was used and the amount of GHG emissions (carbon dioxide equivalent) was used as an undesirable output in this model. Unlike the conventional DEA model, in these models, farm efficiency is also affected by environmental variables, besides the economic variables, and the units have EEE that in addition to maximum production, and using the minimum input, can create the least environmental pollution. Comparing the results of the mentioned model with the conventional SBM model showed that there is a difference of 12% between the average EEE and TE. Therefore, not considering the environmental issues in estimating efficiency presents incorrect results and leads to the continuation of inefficient and unorganized use of inputs. Another result of this study is that the inconsistent use of chemical fertilizers of phosphate and nitrogen with the environment has been one of the most important eco-inefficiencies of saffron growers in the study area. This indicates the importance of using fertilizers correctly and replacing them with manure. In addition, high diesel fuel consumption is the second cause of eco-inefficiency. The main reason for this is the use of old machines, disproportionate to the cultivation level in saffron farms in Iran, and in order to achieve sustainable cultivation of this crop, we should modify the equipment used in the cultivation of this product. Field, 1994.
Data availability statement
The raw data supporting the conclusion of this article will be made available by the authors, without undue reservation.
Author contributions
All authors contributed to the study conception and design. Material preparation and analysis were performed by, MM and FR. The first draft of the manuscript and data collection were written by FY and EA and all authors commented on previous versions of the manuscript. All authors contributed to the article and approved the submitted version.
Funding
This research has been financially supported by the Saffron Institute, University of Torbat Heydarieh, Iran. The grant number was 128280.
Acknowledgments
The authors express their gratitude to the Research and Technology Deputy of Agricultural Sciences and Natural Resources University of Khuzestan for their spiritual support.
Conflict of interest
The authors declare that the research was conducted in the absence of any commercial or financial relationships that could be construed as a potential conflict of interest.
Publisher’s note
All claims expressed in this article are solely those of the authors and do not necessarily represent those of their affiliated organizations, or those of the publisher, the editors and the reviewers. Any product that may be evaluated in this article, or claim that may be made by its manufacturer, is not guaranteed or endorsed by the publisher.
References
Arabi, B., Doraisamy, S. M., Emrouznejad, A., and Khoshroo, A. (2017). Eco-efficiency measurement and material balance principle: An application in power plants malmquist luenberger index. Ann. operations Res. 255 (1), 221–239. doi:10.1007/s10479-015-1970-x
Bakhtiari, A. A., Hematian, A., and Sharifi, A. (2015). Energy analyses and greenhouse gas emissions assessment for saffron production cycle. Environ. Sci. Pollut. Res. 22 (20), 16184–16201. doi:10.1007/s11356-015-4843-6
Bazrafshan, O., Ramezani Etedali, H., Gerkani Nezhad Moshizi, Z., and Shamili, M. (2019). Virtual water trade and water footprint accounting of Saffron production in Iran. Agric. Water Manag. 213, 368–374. doi:10.1016/j.agwat.2018.10.034
Charnes, A., Cooper, W. W., and Rhodes, E. (1978). Measuring the efficiency of decision making units. Eur. J. Operational Res. 2 (6), 429–444. doi:10.1016/0377-2217(78)90138-8
Christainsen, G. B., and Haveman, R. H. (1981). The contribution of environmental regulations to the slowdown in productivity growth. J. Environ. Econ. Manag. 8 (4), 381–390. doi:10.1016/0095-0696(81)90048-6
Chung, Y. H., Färe, R., and Grosskopf, S. (1997). Productivity and undesirable outputs: A directional distance function approach. J. Environ. Manag. 51 (3), 229–240. doi:10.1006/jema.1997.0146
Coelli, T., Lauwers, L., and Van Huylenbroeck, G. (2007). Environmental efficiency measurement and the materials balance condition. J. Prod. analysis 28 (1), 3–12. doi:10.1007/s11123-007-0052-8
Ekins, P. (2005). Eco-efficiency: Motives, drivers and economic implications. J. Industrial Econ. 9 (4), 12–14. doi:10.1162/108819805775247981
Emrouznejad, A., and Yang, G.-l. (2018). A survey and analysis of the first 40 years of scholarly literature in DEA: 1978–2016. Socio-economic Plan. Sci. 61, 4–8. doi:10.1016/j.seps.2017.01.008
Fao, (2018). FAO’s work on climate change(United nations climate change conference). http://www.fao.org/3/CA2607EN/ca2607en.pdf.
Färe, R., Grosskopf, S., and Carl, P. (2013). Joint production of good and bad outputs with a network application. Encycl. Energy, Nat. Resour. Environ. Econ., 109–118. doi:10.1016/B978-0-12-375067-9.00134-0
Färe, R., and Grosskopf, S. (2010). Directional distance functions and slacks-based measures of efficiency. Eur. J. Operational Res. 200 (1), 320–322. doi:10.1016/j.ejor.2009.01.031
Färe, R., Grosskopf, S., Lovell, C. K., and Pasurka, C. (1989). Multilateral productivity comparisons when some outputs are undesirable: A nonparametric approach. Rev. Econ. statistics, 90–98. doi:10.2307/1928055
Färe, R., Grosskopf, S., and Tyteca, D. (1996). An activity analysis model of the environmental performance of firms—Application to fossil-fuel-fired electric utilities. Ecol. Econ. 18 (2), 161–175. doi:10.1016/0921-8009(96)00019-5
Farooq, M., Wahid, A., Kobayashi, N., Fujita, D., and Basra, S. (2009). Plant drought stress: Effects, mechanisms and management. Sustain. Agric. 29, 185–212. doi:10.1051/agro:2008021
Feizi, H., Sahabi, H., and Karbasi, A. (2015). Saffron: An efficient crop production system in energy use in Iran. J. Adv. Agric. Technol. 2. doi:10.12720/joaat.2.1.38-41
Field, B. (1994). Environmental economics. An introduction. Economics series. New York, Ny, USA: Mc Graw Hill.
Gollop, F. M., and Roberts, M. J. (1983). Environmental regulations and productivity growth: The case of fossil-fueled electric power generation. J. political Econ. 91 (4), 654–674. doi:10.1086/261170
Gómez-Limón, J. A., Picazo-Tadeo, A. J., and Reig-Martínez, E. (2012). Eco-efficiency assessment of olive farms in Andalusia. Land Use Policy 29 (2), 395–406. doi:10.1016/j.landusepol.2011.08.004
Grassauer, F., Herndl, M., Nemecek, T., Guggenberger, T., Fritz, C., Steinwidder, A., et al. (2021). Eco-efficiency of farms considering multiple functions of agriculture: Concept and results from Austrian farms. J. Clean. Prod. 297, 126662. doi:10.1016/j.jclepro.2021.126662
Güngör, B., Felekoğlu, B., and Taşan, A. S. (2022). Eco-efficiency maturity model: A practical assessment tool for managers. Environ. Dev. Sustain. 25, 5087–5121. doi:10.1007/s10668-022-02257-y
Guo, Y., Tong, L., and Mei, L. (2022). Spatiotemporal characteristics and influencing factors of agricultural eco-efficiency in Jilin agricultural production zone from a low carbon perspective. Environ. Sci. Pollut. Res. 29 (20), 29854–29869. doi:10.1007/s11356-021-16463-0
Huppes, G., and Ishikawa, M. (2005). A framework for quantified eco-efficiency analysis. J. industrial Ecol. 9 (4), 25–41. doi:10.1162/108819805775247882
Khanali, M., Shahvarooghi Farahani, S., Shojaei, H., and Elhami, B. (2017). Life cycle environmental impacts of saffron production in Iran. Environ. Sci. Pollut. Res. 24 (5), 4812–4821. doi:10.1007/s11356-016-8228-2
Khoshnevisan, B., Rafiee, S., Omid, M., and Mousazadeh, H. (2013a). Applying data envelopment analysis approach to improve energy efficiency and reduce GHG (greenhouse gas) emission of wheat production. Energy 58, 588–593. doi:10.1016/j.energy.2013.06.030
Khoshnevisan, B., Rafiei, S., Omid, M., Keyhani, A., and Movahedi, M. (2013b). Assessing of energy indices and environmental impacts of potato production (Case study: Fereydoonshahr region, Isfahan province). Iran. J. Biosyst. Eng. 44 (1), 57–66. doi:10.22059/IJBSE.2013.36164
Kuosmanen, T., and Kortelainen, M. (2005). Measuring eco-efficiency of production with data envelopment analysis. J. industrial Ecol. 9 (4), 59–72. doi:10.1162/108819805775247846
Lal, R. (2004). Carbon emission from farm operations. Environ. Int. 30 (7), 981–990. doi:10.1016/j.envint.2004.03.005
Lauwers, L. (2009). Justifying the incorporation of the materials balance principle into frontier-based eco-efficiency models. Ecol. Econ. 68 (6), 1605–1614. doi:10.1016/j.ecolecon.2008.08.022
Long, L.-j. (2021). Eco-efficiency and effectiveness evaluation toward sustainable urban development in China: A super-efficiency SBM–DEA with undesirable outputs. Environ. Dev. Sustain. 23 (10), 14982–14997. doi:10.1007/s10668-021-01282-7
Mardani Najafabadi, M., Kazmi, H., Shirzadi Laskookalayeh, S., and Abdeshahi, A. (2023). Investigating the ability of fuzzy and robust DEA models to apply uncertainty conditions: An application for date palm producers. OPSEARCH 60, 776–801. doi:10.1007/s12597-023-00631-6
Mardani Najafabadi, M., and Taki, M. (2020). Robust data envelopment analysis with Monte Carlo simulation model for optimization the energy consumption in agriculture. Energy Sources, Part A Recovery, Util. Environ. Eff., 1–15. doi:10.1080/15567036.2020.1777221
Martinsson, E., and Hansson, H. (2021). Adjusting eco-efficiency to greenhouse gas emissions targets at farm level–The case of Swedish dairy farms. J. Environ. Manag. 287, 112313. doi:10.1016/j.jenvman.2021.112313
Mohammadi, A., Rafiee, S., Jafari, A., Keyhani, A., Mousavi-Avval, S. H., and Nonhebel, S. (2014). Energy use efficiency and greenhouse gas emissions of farming systems in north Iran. Renew. Sustain. Energy Rev. 30, 724–733. doi:10.1016/j.rser.2013.11.012
Mulwa, R., Emrouznejad, A., and Nuppenau, E.-A. (2012). An overview of total factor productivity estimations adjusted for pollutant outputs: An application to sugarcane farming. Int. J. Environ. Technol. Manag. 15 (1), 1–15. doi:10.1504/IJETM.2012.045143
Nemecek, T., Dubois, D., Huguenin-Elie, O., and Gaillard, G. (2011). Life cycle assessment of Swiss farming systems: I. Integrated and organic farming. Agric. Syst. 104 (3), 217–232. doi:10.1016/j.agsy.2010.10.002
Nguyen, T. L. T., and Hermansen, J. E. (2012). System expansion for handling co-products in LCA of sugar cane bio-energy systems: GHG consequences of using molasses for ethanol production. Appl. energy 89 (1), 254–261. doi:10.1016/j.apenergy.2011.07.023
Pang, J., Chen, X., Zhang, Z., and Li, H. (2016). Measuring eco-efficiency of agriculture in China. Sustainability 8 (4), 398. doi:10.3390/su8040398
Pashigian, B. P. (1984). The effect of environmental regulation on optimal plant size and factor shares. J. Law Econ. 27 (1), 1–28. doi:10.1086/467056
Picazo-Tadeo, A. J., Gómez-Limón, J. A., and Reig-Martínez, E. (2011). Assessing farming eco-efficiency: A data envelopment analysis approach. J. Environ. Manag. 92 (4), 1154–1164. doi:10.1016/j.jenvman.2010.11.025
Pittman, R. W. (1981). Issue in pollution control: Interplant cost differences and economies of scale. Land Econ. 57 (1), 1–17. doi:10.2307/3145748
Pittman, R. W. (1983). Multilateral productivity comparisons with undesirable outputs. Econ. J. 93 (372), 883–891. doi:10.2307/2232753
Reinhard, S., Lovell, C. K., and Thijssen, G. J. (2000). Environmental efficiency with multiple environmentally detrimental variables; estimated with SFA and DEA. Eur. J. Operational Res. 121 (2), 287–303. doi:10.1016/S0377-2217(99)00218-0
Sabouhi, M., and Mardani, M. (2017). Linear robust data envelopment analysis: CCR model with uncertain data. Int. J. Prod. Qual. Manag. 22 (2), 262–280. doi:10.1504/ijpqm.2017.10007224
Saeidi, E., Dehkordi, A. L., and Nabavi-Pelesaraei, A. (2022). Potential for optimization of energy consumption and costs in saffron production in central Iran through data envelopment analysis and multi-objective genetic algorithm. Environ. Prog. Sustain. Energy 41. doi:10.1002/ep.13857
Schaltegger, S. (1996). Corporate environmental accounting. Chichester, England: John Wiley and Sons Ltd. doi:10.1016/0361-3682(76)90008-8
Schmidheiny, S. (1992). Changing course: A global business perspective on development and the environment. Geneva, Switzerland: with the Business Council for Sustainable Development. doi:10.1002/bse.3280020108
Statista, (2020). Saffron production worldwide in 2019. https://www.statista.com/statistics/1135621/leading-saffron-producers-worldwide/.
Statistical Center of Iran, (2020). Statistical center of Iran. https://www.amar.org.ir/english.
Tyteca, D. (1997). Linear programming models for the measurement of environmental performance of firms—Concepts and empirical results. J. Prod. analysis 8 (2), 183–197. doi:10.1023/A:1013296909029
Urdiales, M. P., Lansink, A. O., and Wall, A. (2016). Eco-efficiency among dairy farmers: The importance of socio-economic characteristics and farmer attitudes. Environ. Resour. Econ. 64 (4), 559–574. doi:10.1007/s10640-015-9885-1
Wbcsd, (2000). Measuring ecoefficiency, A guide to reporting company performance. Geneva, Switzerland: World Business Council for Sustainable Development.
Yao, X., Feng, W., Zhang, X., Wang, W., Zhang, C., and You, S. (2018). Measurement and decomposition of industrial green total factor water efficiency in China. J. Clean. Prod. 198, 1144–1156. doi:10.1016/j.jclepro.2018.07.138
Zhong, S., Li, A., and Wu, J. (2022). Eco-efficiency of freshwater aquaculture in China: An assessment considering the undesirable output of pollutant emissions. Environ. Dev. Sustain. 25, 3555–3576. doi:10.1007/s10668-022-02189-7
Keywords: data envelopment analysis, undesirable output, chemical fertilizer, excess carbon dioxide, Ghayenat County
Citation: Mardani Najafabadi M, Rastegaripour F, Yavari F and Ahani E (2023) Material balance principle to estimate eco-efficiency of saffron-producers aiming reduction in greenhouse gas emissions in Iran. Front. Environ. Sci. 11:1184458. doi: 10.3389/fenvs.2023.1184458
Received: 11 March 2023; Accepted: 22 June 2023;
Published: 29 June 2023.
Edited by:
Reshmi Sarkar, Private and Indirectly Affiliated with Texas A&M AgriLife Research, United StatesReviewed by:
Ying Zhu, Xi’an University of Architecture and Technology, ChinaLoriana Cardone, University of Basilicata, Italy
M. Mizanur Rahman, Islamic University, Bangladesh
Copyright © 2023 Mardani Najafabadi, Rastegaripour, Yavari and Ahani. This is an open-access article distributed under the terms of the Creative Commons Attribution License (CC BY). The use, distribution or reproduction in other forums is permitted, provided the original author(s) and the copyright owner(s) are credited and that the original publication in this journal is cited, in accordance with accepted academic practice. No use, distribution or reproduction is permitted which does not comply with these terms.
*Correspondence: M. Mardani Najafabadi, bW9zdGFmYS5rb3JnQHlhaG9vLmNvbQ==, bS5tYXJkYW5pQGFzbnJ1a2guYWMuaXI=