 Siqi Yi
 Yong Zhou1,2*
- 1Key Laboratory for Geographical Process Analysis and Simulation of Hubei Province, Central China Normal University, Wuhan, China
- 2College of Urban Environmental Sciences, Central China Normal University, Wuhan, China
- 3Cultivated Land Quality Monitoring and Protection and Rural Affairs, PRC, Beijing, China
- 4College of Geography and Environmental Science, Henan University, Kaifeng, China
Recent urbanization and growing food consumption have had a severely detrimental effect on the ecological environment of the Jianghan Plain. The ecological fragility of the Jianghan Plain must be continually monitored for environmental conservation and sustainable development. This study utilized principal component analysis (PCA) to quantitatively assess the ecological vulnerability of the Jianghan Plain based on the remote sensing ecological index (RSEI) and analyzed the space-time changes and drivers in the Jianghan Plain from 2000 to 2020 using the Google Earth Engine Platform (GEE). The findings of this research indicated that the ecological vulnerability of the Jianghan Plain from 2000 to 2020 was predominantly Moderate or Strong level. But still, the EVI displayed a changing decreasing trend, revealing a small development towards a healthier ecological environment. The most significant ecological vulnerability deterioration occurred between 2005 and 2010, accounting for roughly 44.90 percent, whereas the highest improvement occurred between 2000 and 2005, occupying approximately 37.52% of the area. Moran’s I of EVI was greater than 0 in Jianghan Plain and displayed a growing and subsequently a falling trend, representing that the spatial distribution of regional ecological vulnerability was strongly correlated and aggregated and that the degree of aggregation has declined. The effects of heat, greenness, wetness, and dryness on the ecological vulnerability of Jianghan Plain were all significant, with greenness and wetness being the primary determinants of the change in Jianghan Plain’s ecological vulnerability. The results of this study can offer a theoretical and scientific foundation for ecological protection and restoration in the Jianghan Plain. Meanwhile, this study also provides a practical and rapid method for monitoring regional ecological vulnerability using RSEI, GEE, and PCA, which can be applied elsewhere for ecological vulnerability evaluation.
1 Introduction
With the continuous population growth and rapid economic development, the regional natural environment’s carrying capacity and buffer capacity are facing a serve test due to unreasonable resource utilization (Wei and Ye, 2014; Zhang et al., 2022). The contradiction between humans and the environment has become increasingly prominent (Zheng et al., 2021). Ecological degradation has occurred in many regions of the world, and ecological fragility problems are becoming increasingly severe, for example, biodiversity reduction, land desertification, and soil pollution. Therefore, when researching global environmental change and sustainable development, ecological vulnerability has garnered much attention from academics and has emerged as one of the most critical topics to consider (Nguyen et al., 2016; Xu et al., 2018). Conducting ecological vulnerability research is vital for environmental protection and has crucial guiding significance for the efficient management of land resources and long-term growth. (He et al., 2018; Thiault et al., 2018).
With the strengthening of investigations into the consequences of global environmental change, especially for the in-depth exploration of the human-nature relationship, the study of ecological vulnerability has yielded fruitful results in terms of theory and empirical evidence (Beroya-Eitner, 2016; Weißhuhn et al., 2018; Chen et al., 2022). Numerous scholars have used a variety of assessment approaches to perform numerous investigations into various regions. For instance, Cao et al. (2022) constructed the ecological vulnerability index of Shenlongjia thoroughly and quantitatively using the vulnerability scoring diagram (VSD) model during a 22-year period. Hou et al. (2020) combined GIS data with a fuzzy analytic hierarchy method to study hierarchical variations of regional ecological vulnerability. And Boori et al. (2022) proposed a driver-pressure-state-impact-response (DPSIR) framework based on 3S technology and analytical hierarchy process (AHP) to compute the ecological vulnerability index (EVI). However, most assessment systems in previous research are influenced by subjective factors and weighting decisions. The assessment model incorporates all chosen indicators, disregarding the indicators’ independence (Zhang et al., 2017; Guo et al., 2019). It increases calculations or inaccurate results (Cai et al., 2021). In recent years, some researchers have increasingly used remote sensing data to construct ecological vulnerability indicators due to their accessibility, objectivity, and accuracy (Liou et al., 2017; Xu et al., 2017). Bai and Ma (2010) established an assessment method of ecological vulnerability using eight indicators extracted from remote sensing data in Qinghai Lake. And Chen et al. (2019) examined ecological vulnerability and discussed its change pattern from 1990 to 2015 in the Amu Darya river basin using image elements as the evaluation object based on multi-source remote sensing data. Therefore, we used a comprehensive index built from Greenness, Wetness, Dryness, and Heat based on the remote sensing ecological index (RSEI). RSEI, as a quantitative measure of regional ecological quality, can not only effectively avoid the subjective influence of human beings in ecological vulnerability studies but also improve the efficiency of evaluation (Hang et al., 2020; Jing et al., 2020; Jiang et al., 2023). RSEI can also be visualized and compared at various spatial and temporal dimensions. Additionally, prior studies have confirmed the validity and credibility of this indicator used in ecological research (Zhu Z. et al., 2015; Kasimu et al., 2019).
As an open-access platform, Google Earth Engine (GEE) significantly simplifies the use of remote sensing data in various research, particularly in large-scale study areas (Gorelick et al., 2017). GEE collects many datasets, such as Landsat, MODIS, ASTER, etc. And GEE allows users to develop interactively and test algorithms and acquire and process shared data in an online or offline programmatic manner, which is advantageous for using remote sensing data in long-term and large-scale studies and dramatically improves the effectiveness of processing remote sensing images (Parastatidis et al., 2017; Ye et al., 2021). Compared to traditional tools, the GEE platform offers significant advantages in the efficiency and accuracy of calculations in research (Kumar and Mutanga, 2018; Xu et al., 2022).
The Jianghan Plain in Hubei Province is a central part of the Yangtze River Plain’s middle and lower reaches (Li X. et al., 2022). Due to its unique geographical location and social functions, the Jianghan Plain is one of the prominent carriers of human production and life and assumes essential ecosystem service functions (Jiang et al., 2022). However, as the Jianghan Plain’s population and economic development have grown, the dual pressures of increased food production and rapid urbanization have resulted in increasingly serious ecological problems. How to accomplish a win-win goal for socioeconomic growth and environmental protection has come to be a major concern for the region. Thus, long-term monitoring of changes in the Jianghan Plain’s ecological vulnerability is required to provide a scientific rationale for future sustainable development decisions. Considering the above facts, we first effectively constructed the EVI using Landsat data on the GEE platform. After that, we visualized the spatial and temporal variation of ecological vulnerability in Jianghan Plain and analyzed the leading impact indicators of changes to reveal the evolution patterns of ecological vulnerability in the region. (Figure 1). The aim is to provide full theoretical support and a scientific foundation for local government to make decisions regarding sustainable development and ecological management in the Jianghan Plain, as well as to offer a workable and efficient method for assessing the regional ecological vulnerability using GEE.
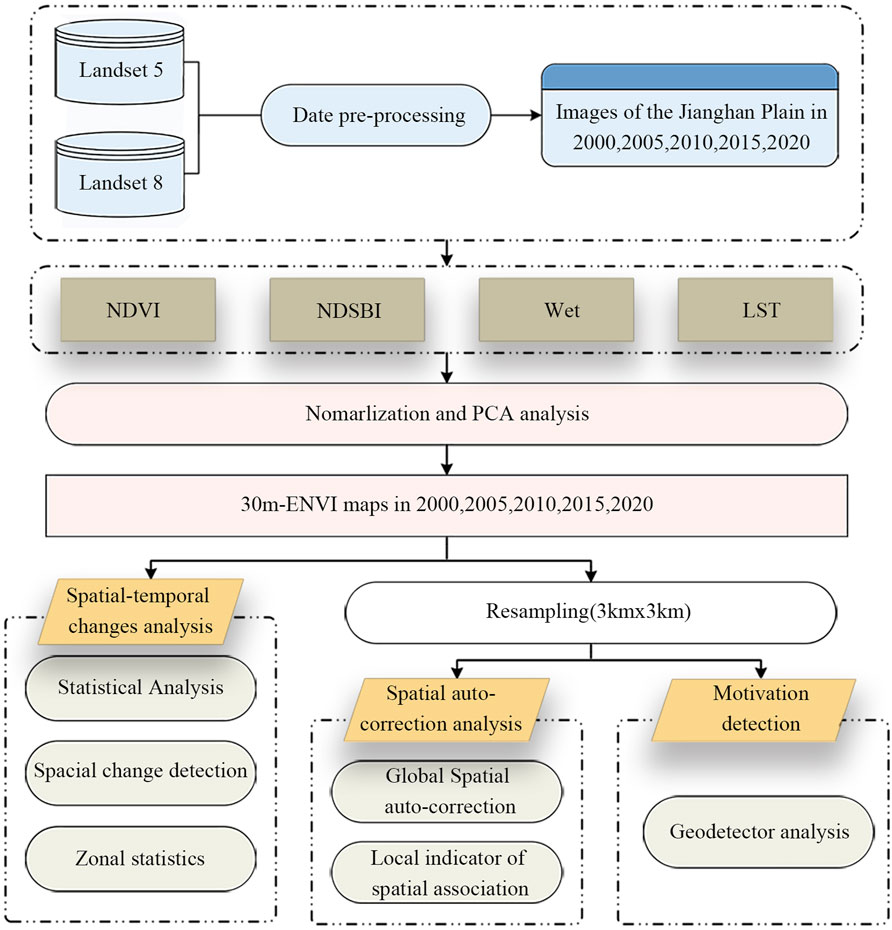
FIGURE 1. Workflow.
2 Materials and methods
2.1 Study area
The Jianghan Plain is situated in Hubei Province’s southernmost region (29°26′-31°37′N, 111°14′-114°36′E). It forms a significant portion of the middle and lower reaches of the Yangtze River Plain, with Jingmen to the north, the Dongting Lake Plain to the south, Wuhan to the east, and Yichang to the west (Figure 2). The overall area is around 29,000 square kilometers and is primarily comprised of 14 counties and cities: Danyang, Zhijiang, Songzi, Jingzhou, Jiangling, Gongan, Shishou, Qianjiang, Jili, Tianmen, Xiantao, Honghu, Yunmeng, Yingcheng, and Hanchuan (Huang et al., 2020). The altitude decreases from the northwest to the southeast. Also, there is predominantly flat, with numerous lakes and rivers. With average annual temperatures between 14 and 18°C and yearly precipitation between 1,100 and 1,300 mm, it has a typical subtropical monsoon climate. Rainfall and high temperatures coincide, and 240 to 260 frost-free days per year are optimal for growing food crops. (Wang et al., 2011). The Jianghan Plain is a critical commodity food base for China because of its advantageous position and food production. And China’s food security is also influenced by the state of its ecological ecosystem, which can have both good and adverse effects on the quality of its agricultural output.
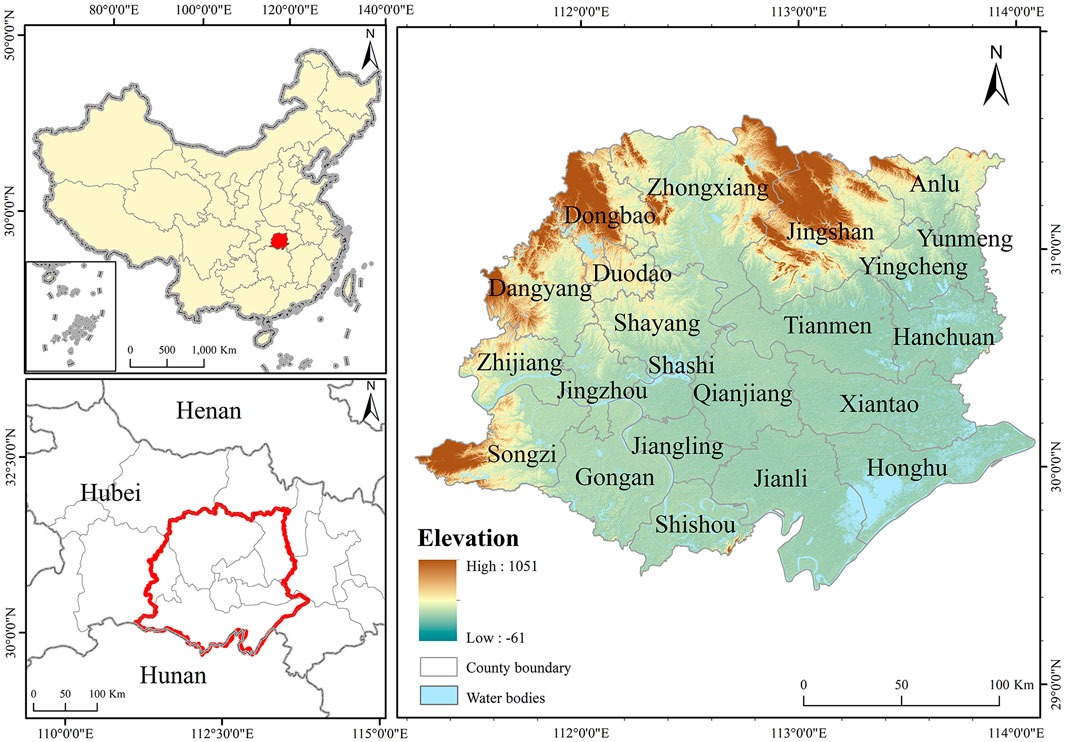
FIGURE 2. The location of the Jianghan Plain.
2.2 Data and processing
In this study, we employed data from Landsat 5 TM (2000, 2005, 2010) and Landsat 8 OLI/TIRS (2015 and 2020) provided by Google Earth Engine (GEE) to map the spatial and temporal distribution of EVI changes from 2000 to 2020 (Xiao et al., 2019). Because these data have been pre-processed with atmospheric correction, radiometric calibration, and geometric correction, they are immediately usable on the GEE platform (Kumar and Mutanga, 2018; Zhao et al., 2021). To eliminate the effect of clouds, we mean-synthesized the images of the target year and its preceding and following years and applied the corresponding de-clouding algorithm to obtain the required images (Tang et al., 2023). Then, the Normalized Difference Soil Index (NDBSI), the Land Surface Temperature (LST), the Normalized Difference Vegetation Index (NDVI), and Wetness (WET) are calculated based on the de-clouded images, and the specific formulas are shown in Table 2. The processes mentioned above are executed on the GEE platform, and Table 1 displays the image data utilized for this study.
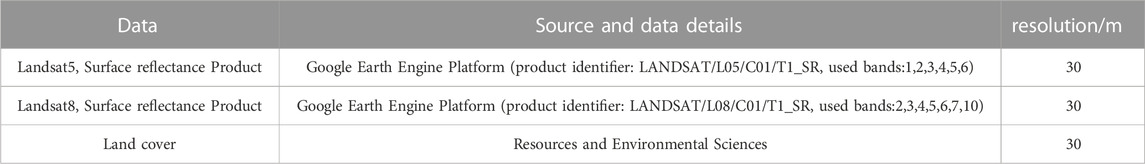
TABLE 1. Data source.
2.3 Methodology
2.3.1 Construction of ecological vulnerability Index (EVI)
Since Xu Qiuhan proposed a comprehensive evaluation of regional ecological quality, researchers have regularly used the four indicators of greenness, moisture, heat, and dryness in regional ecological studies (Xu, 2013a; 2013b). For this reason, we chose four indicators to build the ecological vulnerability index (EVI), and these four indicators are obtained through the standardization of NDVI, Wet, NDBSI, and LST. We also used the modified normalized difference water index (mNDWI) to remove bodies of water from the research region, which further improved the accuracy of the Wet calculation (Xu, 2005). Table 2 lists the relevant calculation equations.
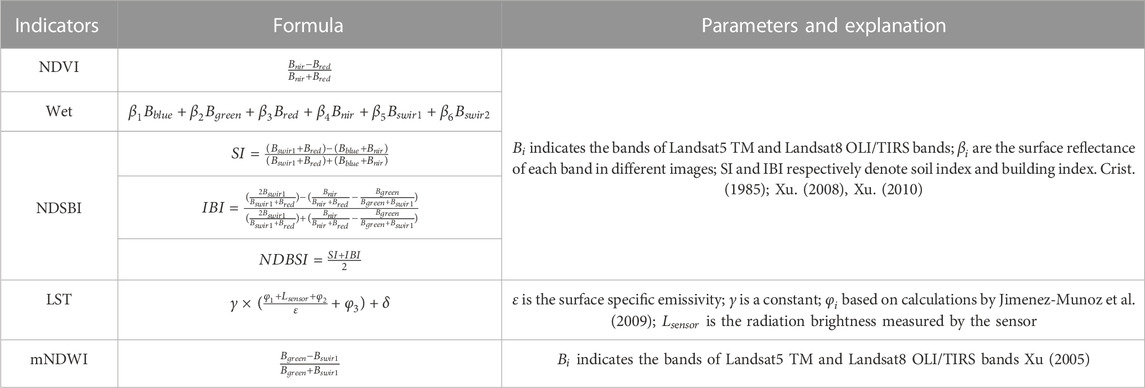
TABLE 2. Calculation methods of indicators.
The EVI was constructed using the first, second, and third principal components (PC1, PC2, and PC3) obtained from the principal component analysis (PCA) of four indicators. This is because the combined participation rates of PCs 1, 2, and 3 are higher than 99%. Before using PCA analysis, indicators’ values must be normalized because they have various numerical ranges and units. Positive and negative indicators can be distinguished among ecological vulnerability indicators. According to relevant studies (Yao et al., 2016; Wang and Su, 2018), dryness and heat have a detrimental effect on the ecological environment, so they are normalized using Eq. 2. In contrast, greenness and wetness have a beneficial effect, so they are normalized using Eq. 1.
Where
Where EVI represents the status and characteristics of the ecological vulnerability;
2.3.2 Geodetector
Geodetector is a quantitative approach to identifying spatial heterogeneity and illuminating the main drivers behind the phenomenon (Zhou X. et al., 2021; Guo et al., 2022). Since Jinfeng Wang and others proposed geodetector in 2004, it has been extensively employed in various fields, including land use, ecology, soil, and regional economy, due to its superiority in being able to be used for both numerical and typological data and immune to covariance (Wang and Xu, 2017; Zhou et al., 2020; Zhou et al., 2021 X.). In this study, using the factor detector, we explored the influence of four indicators (Wet, LST, NDSBI, and NDVI) on EVI.
Where i = 1,2⋯l represents the classification or strata of the factor;
2.3.3 Spatial auto-correlation
Spatial auto-correlation reflects the degree of correlation between a phenomenon in a region and the same phenomenon in neighboring regional units, including global auto-correlation and local auto-correlation (Fan and Cowley, 1985; Martin, 1996). It is a vital index to test whether an element’s ecological vulnerability is correlated with its adjacent space’s ecological vulnerability (Jing et al., 2020). For spatial analysis, the main methods applied in numerous studies are the local indicator of spatial association (Local Moran’s I) and the global spatial auto-correlation (Global Moran’s I).
The Global Moran’s I can disclose the regional clustering of the spatial layout of ecological environment vulnerability. Its value is between plus and minus 1. A value above zero denotes a positive spatial correlation, a zero value denotes no spatial correlation at all, and a value below zero denotes one negative (Wan et al., 2011). The following is the calculation formula:
Where N is the total of elements;
Local Moran’s I, also known as LISA (Local Indicators of Spatial Association, is a valuable indicator of the geographic correlation of each unit’s ecological vulnerability (Anselin, 2010). When the global auto-correlation exits, LISA is able to analyze further whether there is spatial heterogeneity. Therefore, it is necessary to calculate Local Moran’s I. The calculation formula is shown in Eq. 8, and the parameters in the formula are consistent with Eq. 7 (Lei et al., 2019; Xiong et al., 2021).
The LISA has five types of spatial aggregation, High-High (HH), High-Low (HL), Low-High (LH), Low-Low (LL), and Not significant (Jing et al., 2020). The HH represents that a region with a high value is accompanied by other areas with a high value. In contrast, the LL means that an area with a low value is accompanied by other sites with a low value. LH denotes that the chosen area’s value is low while the surrounding area’s value is high. HL denotes that while the value of the selected location is high, the value of the nearby area is low. HH and LL show high positive spatial correlations and regional clustering and similarity.
2.3.4 Coupling coordinative degree model
The coupling coordination degree describes the degree of interaction and coordination among systems or elements, reflecting the strength of each system’s interconnectedness and the good or bad coordination between systems. In recent years, the coupling coordination degree model has been widely used to describe the nonlinear interaction between multiple systems in many disciplines, such as biology, geography, ecology, and urbanization (Li et al., 2013; Liu et al., 2022). The coordination coupling degree model (CCDM) is used to evaluate the degree of coordination development between two or more subsystems, and its calculation formula is shown as follows:
Where C denotes the coupling degree between systems, T represents the coordination degree between systems, D denotes the coordination coupling degree between systems,
3 Results
3.1 Overall characteristic of ecological vulnerability
As demonstrated in Table 3, the sum contribution rates of the first, second, and third principal components (PC1, PC2, PC3) were higher than 99%, with 99.13% in 2000, 99.47% in 2005, 99.80% in 2010, 99.73% in 2015, 99.77% in 2020, respectively. It indicated that PC1, PC2, and PC3 concentrated the majority of traits of the four indicators.
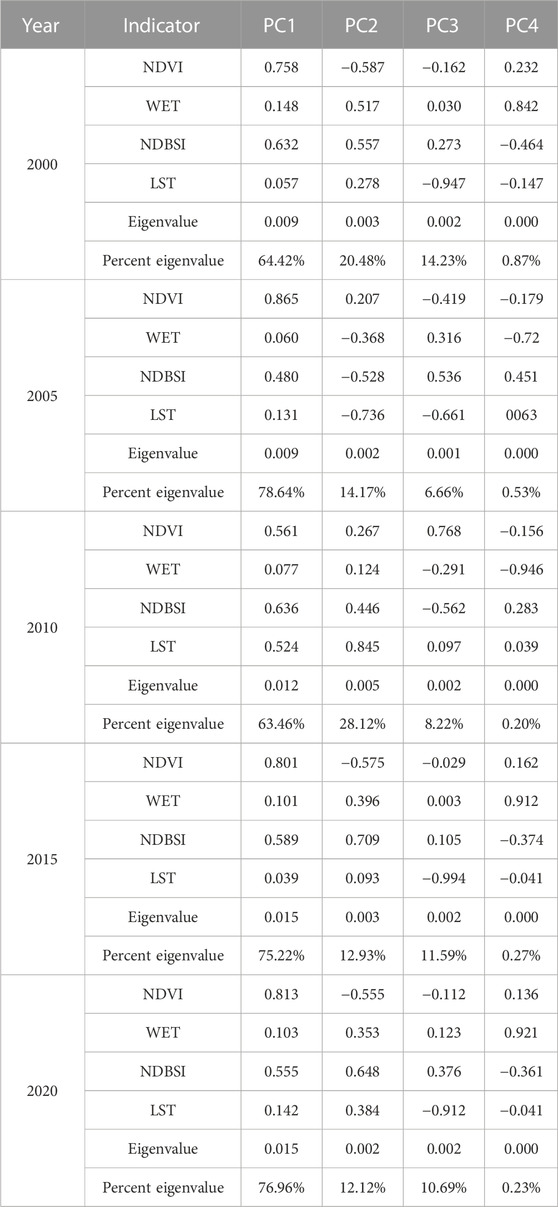
TABLE 3. PCA results in 2000,2005,2010,2015 and 2020.
Table 4 displays the results of descriptive statistics for the EVI and all data variables used in this study. During the past 2 decades, NDVI and Wet values in the Jianghan Plain have fluctuated upwards. Their mean values increased from −0.096 and 0.445 in 2000 to −0.033 and 0.476 in 2020, with increases of 65.62% and 6.97%. It indicated that water conservation capacity in the Jianghan Plain had improved, and the vegetation cover had shown an increasing trend. The NDBSI had decreased by 20.32 percent, with the average value falling from −0.123 in 2000 to −0.148 in 2020, meaning a reduction in the Jianghan Plain’s surface exposure. While the surface temperature, which is strongly tied to water and plant, increased annually, with the average value increasing from 21.226 in 2000 to 22.452 in 2020, a 5.75% increase. It meant that the water-heat balance difference in the Jianghan Plain had increased, which had a substantial impact on the regional ecological vulnerability. Regarding the Minimum, four indicators showed a decreasing and then increasing trend. The turning year of NDVI and WET occurred in 2010, while the turning year of LST and NDBSI was in 2010. And the maximum of NDVI, LST, WET, and NDBSI peaked in 2020. The standard deviations of all four indicators except LST were less than 0.2, indicating that all variables used in this study were discrete to a small extent in 2000,2005, 2010, 2015, and 2020. From 2000 to 2020, the average EVI values in the Jianghan Plain were between 0.5 and 0.7. The ecological vulnerability level of most areas in Jianghan Plain was mainly at Moderate or Extreme levels. During 20 years, the mean EVI value showed a trend of “down—up—down,” demonstrating that the ecological vulnerability of Jianghan Plain fluctuated downward. Indirectly, it also side reflected the movement toward enhancing the environmental quality of Jianghan Plain. Moreover, the turning years of the trends of the other three indicators are consistent with the EVI except for LST.
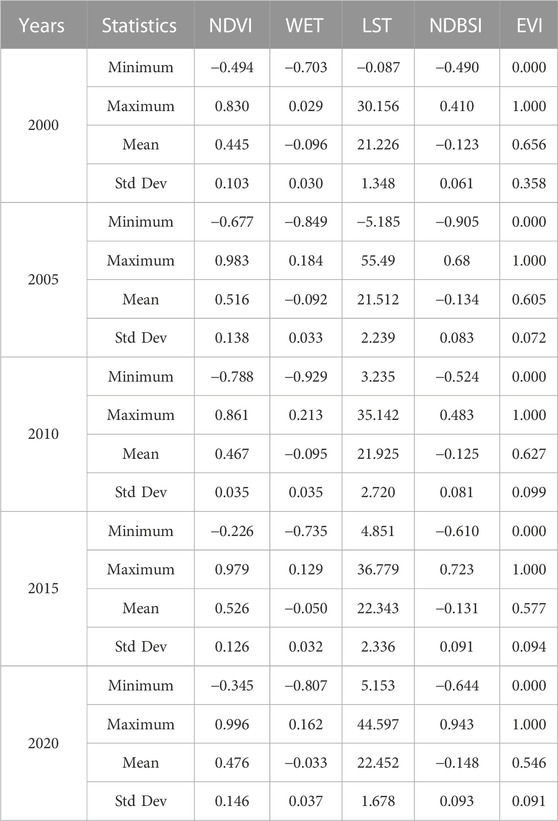
TABLE 4. Statistics of four indicators and EVI.
Figure 3 illustrates the proportional change in each ecological vulnerability level. From 2000 to 2020, the majority of ecological vulnerability level was either Moderate or Strong. The proportion of Slight and Light levels increased, whereas the percentage of the Slight level was the lowest each year. Over 20 years, the proportion of Moderate level fluctuating grew, with the highest rate occurring in 2020. The change in the Extreme level was the opposite of the Moderate level, and it showed a fluctuating decrease, with the lowest percentage of 29.06% in 2020. The rate of Extreme level was the largest in 2010 with 9.29%, and only 0.86%, 0.02%, 0.34%, and 0.13% in 2000, 2005, 2015, and 2020, respectively. The temporal changes of the extreme level were generally consistent with the EVI trend in study time.
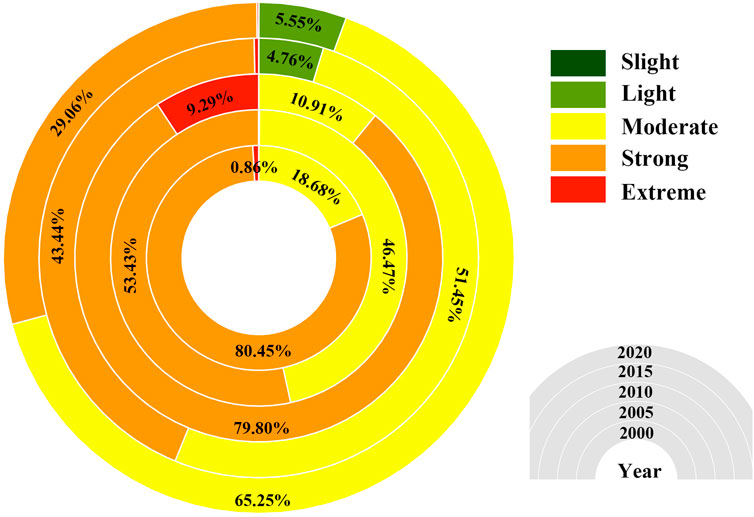
FIGURE 3. The proportion of ecological vulnerability index (EVI) in Jianghan Plain from 2000 to 2020.
Dark green, light green, yellow, orange, and brown represent Mild, Light, Moderate, Strong, and Extreme ecological vulnerability, respectively, in Figure 4. From 2000 to 2020, the spatial and temporal patterns of ecological vulnerability in the Jianghan Plain were highly variable and strongly tied to human agricultural production, urban expansion, and some government policies over 20 years. The temporal and spatial patterns of ecological vulnerability in the Jianghan Plain were highly variable from 2000 to 2020 and were deeply associated with human agricultural activities, urbanization, and specific government policies. Ecological vulnerability decreased from south to northwest in the Jianghan Plain in 2000. The region with the lowest ecological vulnerability was Zhongxiang, while Hanchuan was the most vulnerable. In 2005, 2010, 2015, and 2020, the ecological vulnerability decreased from west to east in the Jianghan Plain. In 2010, the area of Extreme level in the Jianghan Plain increased significantly and was mainly distributed in Dongbao, Dangyang, Songzi, Gongan, Shihou, and Jiangling. In 2015 and 2020, Anlu, Yunmeng, Hanchuan, Xiantao, and Honghu in the eastern proportion of the Jianghan Plain and Zhongxiang in the northern part of the Jianghan Plain had low ecological vulnerability levels, while the regions with comparatively high ecological vulnerability levels were primarily situated in the central and northeastern proportion in the Jianghan Plain.
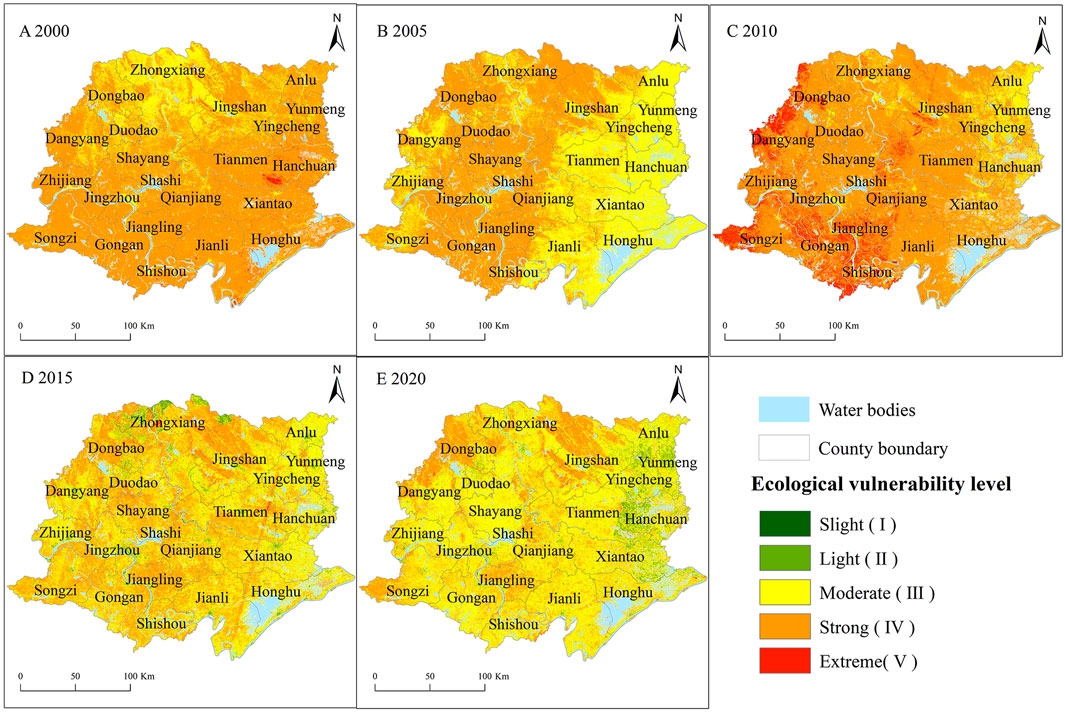
FIGURE 4. Spatial distribution of ecological vulnerability index (EVI) in Jianghan Plain from 2000 to 2020.
In terms of city scale, from 2000 to 2020, the EVI value of Jingmen was low, which represented the ecological environment was relatively good and the possibility of ecological degradation was relatively low (Figure 5). The relatively high EVI values in Xiaogan indicated high ecological vulnerability. Nonetheless, it displayed a significant downward trend, meaning that the ecological environment in Xiaogan has considerably improved from 2000 to 2020. Jingzhou and Yichang have higher EVI values, and in 2010 the EVI of these two cities was the highest of all cities studied. It suggested that the two cities were more vulnerable to environmental threats. However, after 2010, the EVI values of the two cities also decreased significantly, reflecting that the two cities’ ecological environment had become better and was trending in a positive direction.
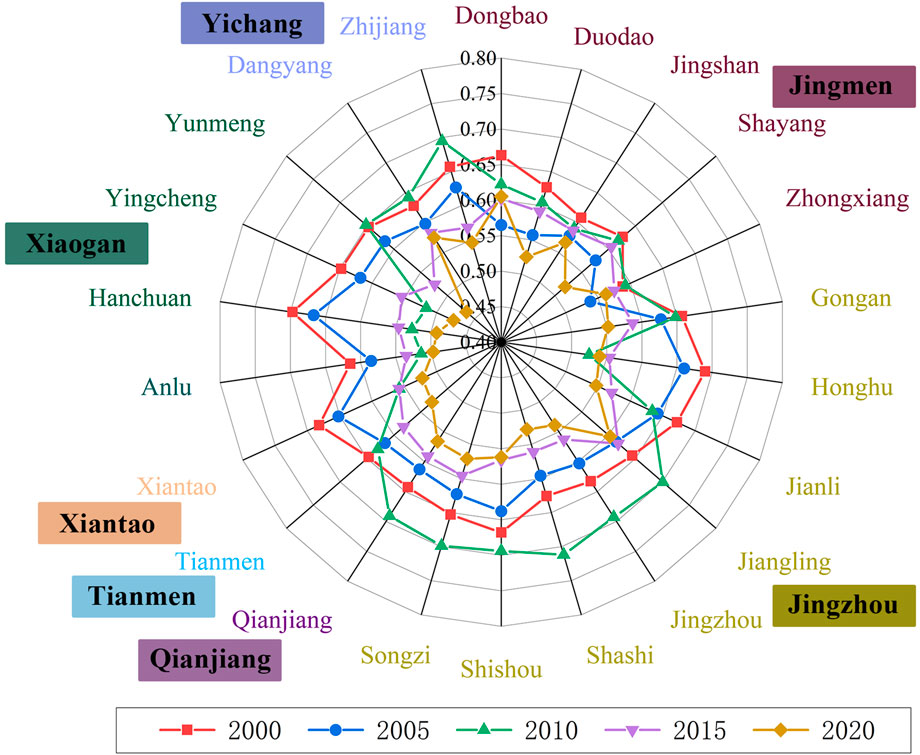
FIGURE 5. The mean ecological vulnerability index (EVI) of each county in Jianghan Plain from 2000 to 2020.
Regarding the district and county scales, the EVI values of each district and county showed fluctuations and decreases. And in 2010, all other Counties or Districts showed an increasing trend except Honghu, Dongdao, Jingshan, Duodao, Shayang, Yingcheng, Hanchuan, and Anlu. Most Counties or Districts had their maximum values of EVI in 2010, while all Counties or Districts had the lowest EVI values in 2020, which denoted that all counties or districts had improved their ecological environment quality with proper environmental protection measures in 2000–2020.
3.2 Dynamic changes in EVI
Based on the EVI level classification findings in 2000, 2005, 2010, 2015, and 2020, the spatial distributions were mapped in Figure 6, and the area changes were listed in Table 5 to investigate further shifts of ecological vulnerability in the Jianghan Plain over 20 years. We determined the area changes for each EVI level and categorized the results into four categories based on four time periods (2000–2005, 2005–2010, 2010–2015, and 2015–2020). They were, respectively, Obvious Improvement (OI), Slight Improvement (SI), Invariability (IN), Slight Deterioration (SD), and Obvious Deterioration (OD). The analysis revealed that ecological vulnerability remained stable in the majority of the Jianghan Plain, with IN accounting for the largest proportion in each period, at 52.04 percent, 53.65 percent, 55.44 percent, and 60.12 percent, respectively. It showed that the construction of ecological civilization in the Jianghan Plain had achieved remarkable achievements, the regional ecological environment had been improving, and the ecological carrying capacity and buffering capacity also had been increasing. The ratio of OI and OD change was less than 0.1%, showing that from 2000 to 2020, there were fewer regions with significant ecological vulnerability changes in the study area. Except for 2005–2010, the proportion of SI was second only to IN, with 37.52%, 1.46%, 29.02%, and 27.53% in the four periods, and the largest proportion in 2010–2015. And the proportion of SD increased and then decreased between 2000 and 2020, with ratios of 10.44%, 44.90%, 14.62%, and 12.34%. Above, it was demonstrated that the degree of ecological vulnerability fluctuated downward in the Jianghan Plain.
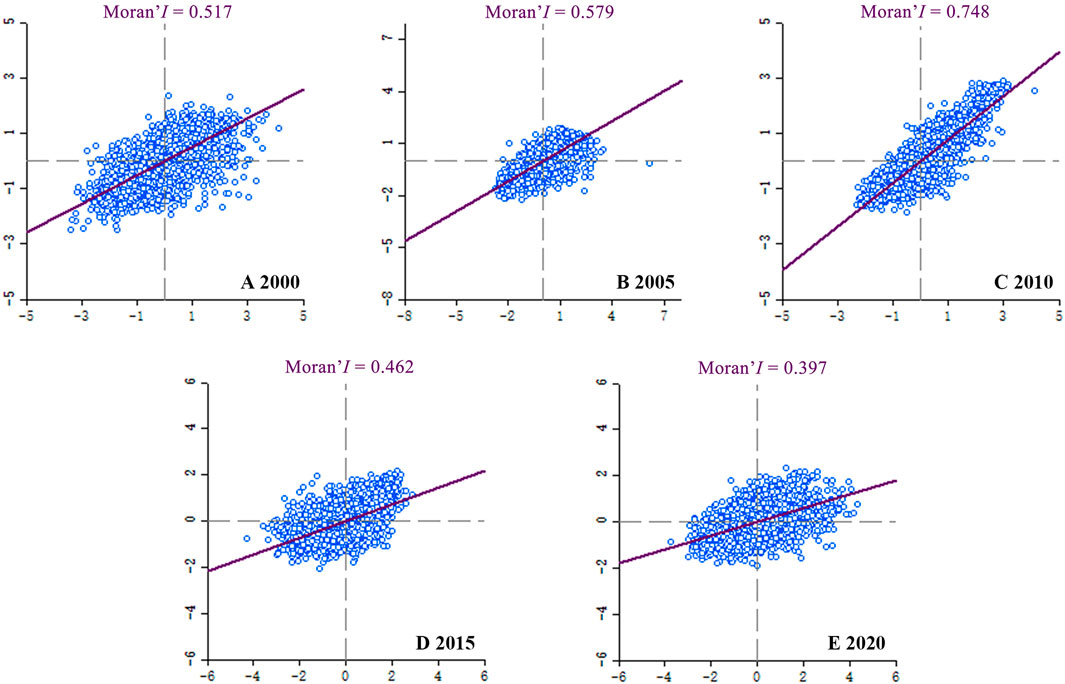
FIGURE 6. Scatter plots of the ecological vulnerability index (EVI) in Jianghan Plain from 2000 to 2020.
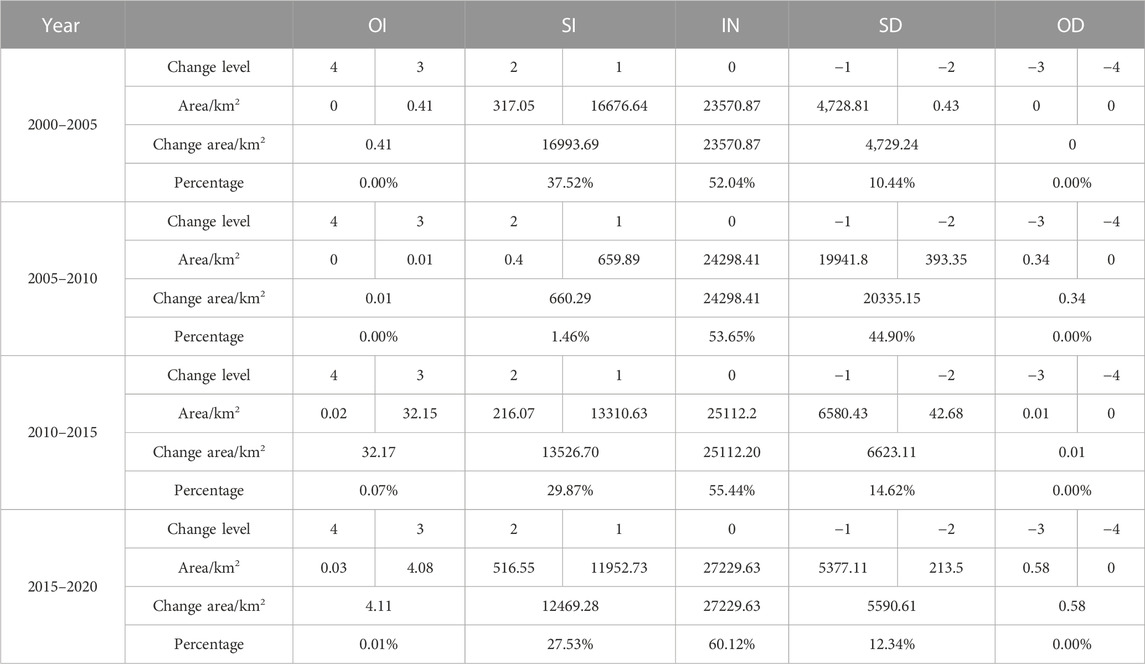
TABLE 5. Changes in EVI level from 2000 to 2020.
Figure 7 illustrates the complex spatial variations in ecological vulnerability levels between 2000 and 2020. From 2000 to 2010, the ecological vulnerability of the Jianghan Plain mainly shifted from levels III and IV to other levels. The areas where the classes remained unchanged were all in the central regions of the Jianghan Plain. From 2000 to 2005, the ecological vulnerability in the northern part of the Jianghan Plain changed mainly from the level III to the level IV and V, indicating a decrease in ecological vulnerability. The north part of the Jianghan Plain is relatively high in elevation, and forests dominate the land use. And China implemented the policy of returning farmland to forest in 1999. The protection of forests increased its area, which influenced the change in regional ecological vulnerability from 2000 to 2005. In the southern portion of the Jianghan Plain, ecological vulnerability decreased from level IV to other levels, whereas ecological vulnerability decreased from level IV to level III in the southeast and southwest, indicating an improvement in ecological fragility. From 2005 to 2010, the ecological vulnerability of the southwest and northwest portions of the Jianghan Plain deteriorated, manifesting a change from level III or IV to level V. However, these deteriorated areas showed an improving trend during 2010–2015, with a shift from the Ⅴ level to other levels. Most regions’ ecological vulnerability levels remain unchanged from 2015 to 2020. Some areas in the north mainly changed from Ⅱ to Ⅲ level. The central part of Jianghan Palin showed areas where the Ⅲ level became Ⅱ level or Ⅳ level, changed to Ⅲ level, which indicated a decrease in ecological vulnerability level and an improvement in the ecological environment.
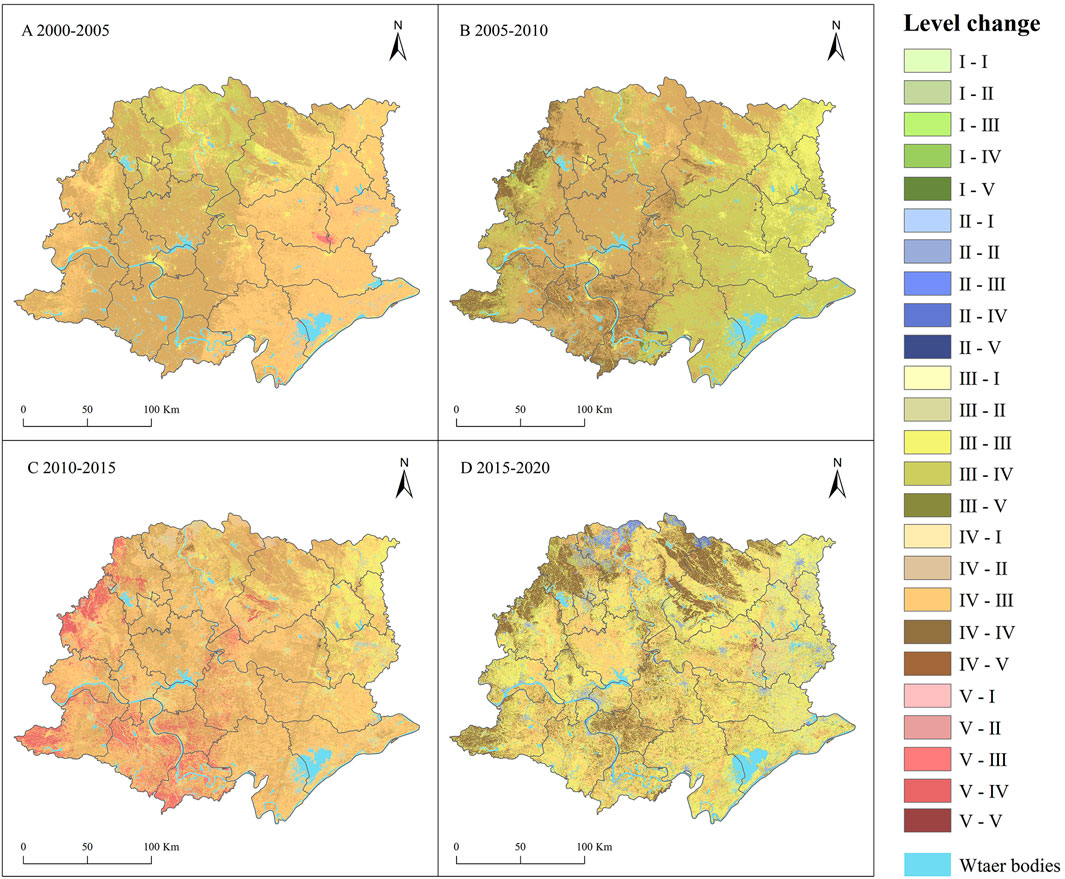
FIGURE 7. Spatial and temporal pattern of ecological vulnerability index (EVI) in Jianghan Plain in four period (A2000-2005, B2005-2010, C2010-2015, D2015-2020).
4 Discussion
4.1 Spatial auto-correlation analysis of EVI
Considering the actual situation of Jianghan Plain, a 3 km × 3 km grid was established to extract the image information in order to ensure the completeness of the details within the scale and the precision of calculation. In this study, we extracted 4,319, 4,337, 4,304, 4,323, and 4,261 sample points from the images of 2000, 2005, 2010, 2015, and 2020 due to the varying extent of water bodies in each year. Moran’s I index and LISA were used to conduct a spatial autocorrelation analysis of EVI in the Jianghan Plain using the previously mentioned sample points. Figure 8 depicts the scatter plot of Moran’s I for Jianghan Plain’s EVI. From 2000 to 2020, the scatter points were primarily dispersed in the first and third quadrants, indicating that the ecological vulnerability in Jianghan Plain had a positive spatial correlation and a clustered instead of random distribution. And the value of Moran’s I increased and decreased over the past 2 decades, with values of 0.517, 0.579, 0.748, 0.462, and 0.397, respectively. In 2010, Moran’s I had its highest value, implying a significantly positive spatial correlation. With a value of only 0.397, the ecological vulnerability of Jianghan Plain was the weakest spatial correlation in 2020.

FIGURE 8. Jianghan Plain ecological vulnerability index (EVI) cluster map from 2000 to 2020.
By analyzing the local spatial correlation pattern based on the LISA cluster map, we could determine the spatial distribution of 5 cluster types (No Significant, H-H, H-L, L-L, L-H) each year. As depicted in Figure 8, the No Significance was most prevalent in relatively low-elevation regions, including Qianjiang, Jianli, Shishou, and Xiantao. From 2000 to 2020, L-L and H-H were more concentrated and prominent, while HH and LH were more dispersed and fewer. And the spatial spread of L-H and H-L was more variable. In 2000, the H-H dominated the eastern and western parts of the Jianghan Plain, whereas the L-L dominated these regions in 2005 and 2010. In addition, the area of L-L decreased continuously from 2010 to 2020, indicating that the environment quality had enhanced and the degree of ecological vulnerability had declined as a result of the promotion of the development of ecological civilization (Zhu et al., 2022). In conjunction with the preceding, the temporal tendencies of L-L and HH are consistent with the EVI’s movements in the Jianghan Plain.
4.2 Driving forces analysis
The ecological vulnerability manifests in the degree of structural and functional integrity of ecosystems. Natural attributes and human activities influence regional ecological vulnerability and lead to spatial and temporal changes (Abd El-Hamid et al., 2020). Natural factors are the material basis for the existence and continued positive role of regional ecosystems, and changes in the natural environment usually affect the structure and function of regional ecosystems, which in turn leads to the emergence of ecological vulnerability problems. However, in contrast to the long-term slow evolution of natural factors, the dramatic disturbance of human activities is more likely to cause sudden changes in the regional ecological environment and create ecological vulnerability problems. It has been proved that ecological vulnerability is directly related to the natural conditions of the regional ecological background. Still, the natural conditions only determine the potential existence of environmental vulnerability. The main factors that cause the further transformation of potential environmental vulnerability to actual ecological vulnerability are the excessive production and living activities of human beings, such as rapid urbanization, irrational exploitation of resources, environmental pollution, and so on (Hou et al., 2016).
The four indicators of Heat, Greenness, Wetness, and Dryness did not simply represent the natural environment but also reflected the impact of human activities on the natural environment from the side. Therefore, we quantified the explanatory power of the indicators in the Geodetector to investigate the major driving forces of the four indicators of changes in ecological vulnerability in the Jianghan Plain. A 3 km × 3 km grid was created using ArcGIS for sampling, and the values of the four indicators and EVI from 2000 to 2020 at the sample sites were extracted and imported into the detector for calculation. As can be seen in Figure 9, the outcomes of the factor detector for four indicators over 20 years demonstrated that p = 0, suggesting that each indicator notably affected the change in ecological vulnerability in Jianghan Plain. Every year, NDVI had the highest q value and had the most effect on how ecologically vulnerable the Jianghan Plain was. It was followed by NDBSI, which also had a q value over 0.5. With the accelerating urbanization process, especially from 2005 to 2010, the construction land in Jianghan Plain increased by 18.30%, and the ecological land area decreased sharply, resulting in a decreasing trend of EVI. As confirmed by many studies, urban expansion and over-exploitation of arable land have seriously affected the regional ecological environment (Xie et al., 2013; Liou et al., 2017; Jiang et al., 2022). The q values of Wet changed less over 20 years, remaining between 0.1 and 0.3, indicating that the effect of wetness on the variation in ecological vulnerability in Jianghan Plain was more consistent. From 2000 to 2020, LST q values were lower, exhibiting a first ascending and then descending trend. The effect of human activities, such as environmental pollution and land use change, was still the main driver of regional ecological vulnerability. In response, the local government should improve the policy system, implement the responsibilities of all parties, coordinate the balance between ecological vulnerability management and economic development of residents, and take correct and appropriate measures to halt the deterioration of ecological vulnerability. These were crucial for accelerating the ecological management of the Jianghan Plain, consolidating the achievements of ecological management and construction, and finally achieving the win-win goal of enhancing the region’s ecological and economic environments. It is somewhat related to the slight variation in temperature and humidity in the Jianghan Plain over the past 20 years.
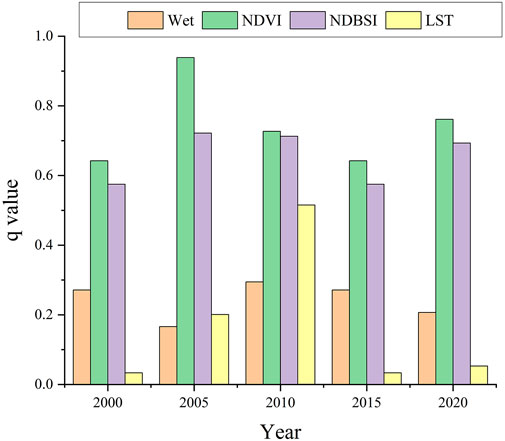
FIGURE 9. The results of the Factor Detector.
In addition, changes in ecological vulnerability are closely related to government policies. Ecological vulnerability in the Jianghan Plain became better from 2000 to 2005, deteriorated from 2005 to 2010, and improved significantly after 2010. In Hubei Province, implementing the policy of returning farmland to the forest in 2000 achieved great ecological benefits, which directly or indirectly caused the improvement of regional ecological vulnerability (Zhao et al., 2023). However, with the rapid development of urbanization, the ecological environment became increasingly fragile from 2005 to 2010. In 2012, with the implementation of the ecological civilization construction strategy and various ecological protection policies, the regional ecological environment was improved again. Therefore, governments at all levels of the Jianghan Plain should give full play to their roles to promote the improvement of the regional ecological environment and the management of ecological problems and ultimately achieve the win-win goal of enhancing the regional ecological and economic environment.
4.2.1 Sustainable development and local government suggestions
The 2030 Agenda for Sustainable Development sets out 17 goals and 169 sub-goals comprising the Sustainable Development Goals (United Nations, 2015). The development of these goals has placed greater emphasis on integrating the intrinsic linkages between social development, economic development, and environmental protection, changing the previous failure to pay sufficient attention to the ecological field and addressing the persistent problems and emerging challenges facing humanity and the planet. China has also been working toward sustainable development goals. With the rapid urbanization of the Jianghan Plain, the urban heat island is profoundly affecting the natural environmental processes on the surface and the sustainable development of human society. Clarifying the relationship between carbon emissions and urban heat islands can inform how to achieve low-carbon and decarbonized sustainable development goals. (Wise et al., 2009). We divided the Jianghan Plain into 4,903 cells using a 3 km × 3 km grid and determined the urban heat island (UHI) area in 2000 and 2020 based on LST > LSTave+0.5 × δ (LSTave denotes the mean value of LST in the Jianghan Plain, and δ denotes the standard deviation of LST in the Jianghan Plain) (Shahfahad et al., 2021). We determined carbon emission coefficients for each land use type in the Jianghan Plain based on the IPCC framework and some studies on carbon emission coefficients (IPCC, 2007; Zhu Q. et al., 2015; Zhou S. et al., 2021). Then, we used the coupling and coordination degree model (CCDM) to measure the relationship between urban heat island density (UHII) and carbon emissions after standardized data (Naikoo et al., 2023). As shown in Figure 10, the UHI area of the Jianghan Plain was mainly located in the central region in 2000 and shifted to the west in 2020, and the urban heat island effect in the eastern part was mitigated. Based on the results of CCDM, the spatial distribution patterns of the coupling and coordination degrees of carbon emissions and urban heat island density in the Jianghan Plain in 2000 and 2020 were generally consistent. The region’s area with high coupling and coordination in 2020 increased significantly compared to 2000. In fact, the urban heat island effect and carbon emissions showed high coupling and high coordination in the central urban areas of each city, as has been demonstrated by some scholars (Sharifi et al., 2020; Dewa and Buchori, 2023). Extreme incoordination occurred mainly in the northern part of the Jianghan Plain, which was at a higher elevation and had a less significant urban heat island. The emergence of the urban heat island phenomenon not only has specific effects on human health but also has adverse effects on vegetation growth and climate change. (Heaviside et al., 2017; Shahfahad et al., 2022). Therefore, promoting the implementation of low-carbon emission reduction is conducive to mitigating the negative impacts of the urban heat island effect and reducing the fragility of the regional ecology (Imam and Banerjee, 2016; Chen and You, 2020). This is also the way to improve the ecological environment of Jianghan Plain and achieve sustainable development.
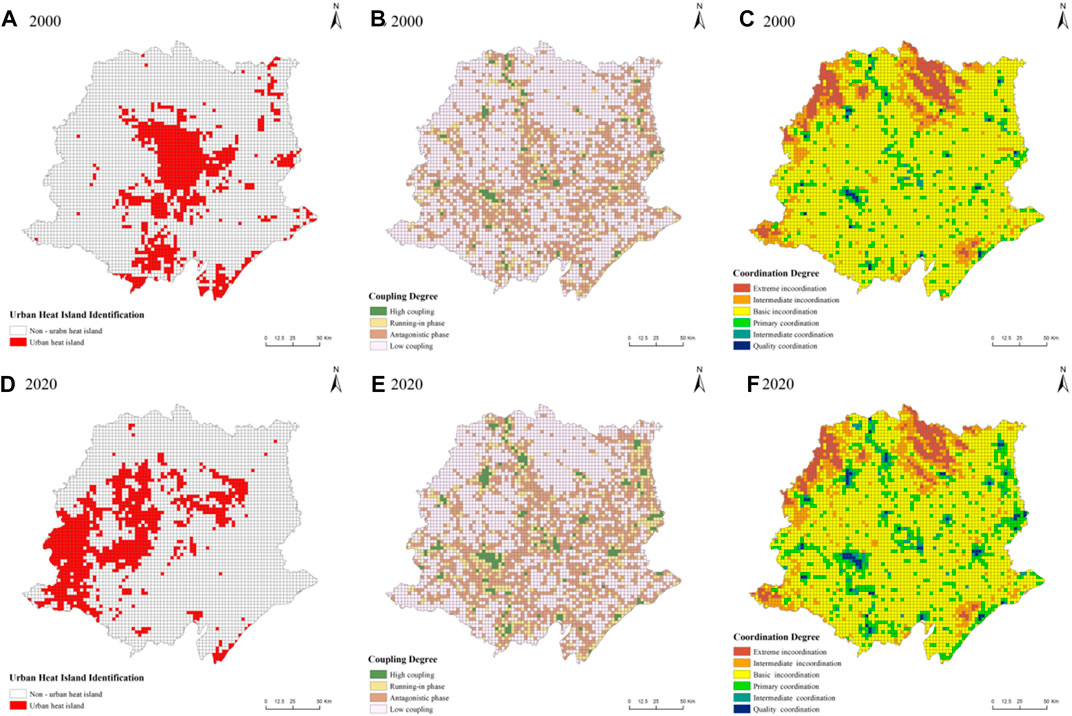
FIGURE 10. (A) Urban heat island in 2000; (B) coupling degree in 2000; (C) Coordination degree in 2000; (D) Urban heat island in 2020; (E) coupling degree in 2020; (F) Coordination degree in 2020.
Ecological vulnerability monitoring and driving force analysis provide decision-makers with suggestions for environmental improvement to achieve sustainable development (Li F. et al., 2022). In this study, we promoted the following suggestions further to improve the sustainable development of the Jianghan Plain and achieve the win-win goals of economy and ecology.
First, gradually change the urban development model to ensure ecological land use. The rapid expansion of urban land in the Jianghan Plain has led to increasing fragmentation of habitats. Local governments should do reasonable urban planning, especially in Yichang and Jingzhou, to ensure the regional ecological environment is not degraded. They should effectively reduce the inefficient use of urban land, promote urbanization from incremental expansion to stock renewal, improve internal urban greening, and ensure the quality and quantity of regional ecological land. In addition, the governments should promote low-carbon production and living, improve regional carbon emission efficiency, and reduce regional carbon emission levels to enhance environmental quality.
Second, protect arable land and vigorously develop green agriculture. As the Jianghan Plain is a substantial food production base in China, protecting the quality and quantity of basic farmland is a must to protect the regional ecological environment and an inevitable choice to ensure national food security. From the factor results, vegetation cover is the main factor affecting the ecological vulnerability of the Jianghan Plain, so the local government should develop green agriculture and eco-agricultural tourism, ensure the planting of crops and various trees, prevent the emergence of “non-farming” and “non-grain,” and improve regional vegetation cover (Zhang et al., 2019). In addition, the government should strictly regulate the use of fertilizers, designate an ecological compensation system to prevent soil pollution, protect the region’s natural background from deterioration, and improve the ecological environment’s carrying capacity and buffering ability to cope with artificial disturbances.
Third, develop resources rationally and improve their utilization rate. The government should scientifically formulate resource development plans for the Jianghan Plain, improve resource utilization rates, eliminate resource waste, and maximize the value of local ecological resources to achieve sustainable economic development.
Fourth, improve the policy system and play a macro-control role. The relevant departments need to provide reasonable policies to guide local companies, groups, and individuals to participate in ecological protection, such as strengthening supervision and establishing a sound regulatory mechanism. They also need to implement the responsibilities of all parties, coordinate the balance between ecological vulnerability management and residents’ economic development, take correct and appropriate measures to stop the deterioration of ecological vulnerability, and play a macro-regulatory role in the rational use of resources and ecological protection.
4.2.2 Strength and limitation
Considering the ecological vulnerability assessment’s complexity and ambiguity, the current methods could not achieve a scientific, objective, and comprehensive evaluation. Combined with previous studies, to avoid subjective consciousness seriously affecting the research results (Li et al., 2012), Due to the complexity and ambiguity of ecological vulnerability assessment, the current methodologies are incapable of producing an exhaustive, scientific, and objective evaluation. This study chose the index system of the RSEI established by Xu Hanqiu in combination with earlier research in order to prevent subjective consciousness from significantly influencing the research findings (Xu, 2013a; Wang et al., 2016). Although there was no further apparent correlation between the indices, this system could correctly represent soil moisture, surface temperature, vegetation, and exposed surface conditions of the study region. We used 2020 as an example to determine the covariance of each indicator in order to confirm the correlation of the indicators further. There are two leading commonly used covariance diagnostic indicators, the variance inflation factor (VIF) and the tolerance level (TOL) (Yao et al., 2016). When VIF>10 (i.e., TOL0.1), the multicollinearity of the chosen index was more severe. A 3 km × 3 km grid was used to encompass the entire image in ArcGIS 10.8, and 4,261 sample points were obtained by excluding the sampling points from the water bodies. Then, the values of the EVI and four indicators were extracted, and SPSS 25.0 was utilized to get the VIF and TOL of each indicator (Table 6). The results of the calculations revealed that the VIF of each indicator was less than 10, and the TOL was greater than 0.1, demonstrating there was not any correlation among the indicators. Therefore, selecting greenness, wetness, dryness and heat as the assessment index system in this study was desirable. In addition, we processed and employed the remote sensing data to construct EVI using the Google Earth Engine. It has certain advantages of multiple data sources, online processing, and fast speed compared with traditional local computer download processing, dramatically improving the efficiency and accuracy of data processing in this study.
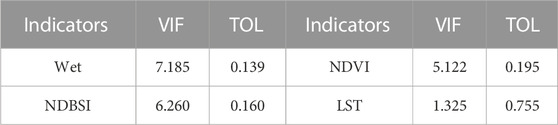
TABLE 6. Results of multicollinearity diagnostics.
However, there were still some shortcomings in this study. This study’s primary purpose was to explore a regional ecological vulnerability assessment method using objective models through the idea of a remote sensing index. Firstly, there was still a need for further exploration of the intrinsic mechanisms driving ecological vulnerability changes. Second, multiple natural and human activities influenced regional ecological vulnerability changes, and it was not easy to fully characterize them with a few indicators. This study selected only four indicators to measure regional ecological vulnerability. Simultaneously, the arable land in the Jianghan Plain was widely distributed, and the regional environment affected various human activities. Therefore, further exploration and research were needed to reflect the spatial and temporal changes of ecological vulnerability in the Jianghan Plain more scientifically and comprehensively.
5 Conclusion
This study considered greenness, wetness, dryness, and heat to build an ecological vulnerability assessment index system and then used the GEE platform and principal component analysis to make a macro, objective, and rapid evaluation of the ecological vulnerability in the Jianghan Plain, thereby revealing the evolutionary dynamics of its ecological vulnerability. It provided some reference value for the ecological vulnerability management and food security of the Jianghan Plain and some ideas for researching regional ecological vulnerability. The following are this study’s main conclusions.
1) The EVI of the Jianghan Plain showed a fluctuating decline from 2000 to 2020, with an overall improvement in ecological vulnerability and local degradation, especially after 2010, when the ecological vulnerability improved significantly.
2) The average value of EVI in the 20 years was between 0.5 and 0.7, and most areas of the Jianghan Plain were mainly at Moderately level or Strong level. Also, Jingmen City had a more light ecological vulnerability, but the ecological vulnerability of Xiaogan City needed improvement.
3) Most of the areas in Jianghan Plain had the same ecological vulnerability level in each period, accounting for 52.04%, 53.65%, 55.44%, and 60.12%, respectively. The most serious period of degradation was 2005–2010, with about 44.90% of the areas showing degradation, and the period with the highest percentage of improvement was 2000–2005, with approximately 37.52% of the areas showing an improvement.
4) From 2000 to 2020, Moran’s I in Jianghan Plain increased and then decreased, with values of 0.517, 0.579, 0.748, 0.462, and 0.397 in 2000, 2005, 2020, 2015, and 2020, respectively. The spatial distribution of ecological vulnerability showed a positive correlation and aggregated distribution rather than random distribution.
5) Regarding the evolutionary drivers, all four indicators significantly affected ecological vulnerability in Jianghan Plain, and greenness and wetness were the greatest driving force for changes in Jianghan Plain.
Data availability statement
The original contributions presented in the study are included in the article/supplementary material, further inquiries can be directed to the corresponding author.
Author contributions
SY: Conceptualization, methodology, software, writing-original draft, writing-review and editing. YZ: supervision, funding acquisition, project administration. JZ: formal analysis, writing-review and editing. QL: software, supervision. YL: resources preparation, writing-review and editing. YG: data analysis. YC: writing-original draft. All authors contributed to the article and approved the submitted version.
Funding
This research was funded by the National Natural Science Foundation of China (NO. 42171061) and the Special Foundation for National Science and Technology Basic Research Program of China (NO. 2021FY100505).
Acknowledgments
We acknowledge all people who contributed to the data collection and processing, as well as the constructive and insightful comments by the editor and reviewers.
Conflict of interest
The authors declare that the research was conducted in the absence of any commercial or financial relationships that could be construed as a potential conflict of interest.
Publisher’s note
All claims expressed in this article are solely those of the authors and do not necessarily represent those of their affiliated organizations, or those of the publisher, the editors and the reviewers. Any product that may be evaluated in this article, or claim that may be made by its manufacturer, is not guaranteed or endorsed by the publisher.
References
Abd El-Hamid, H. T., Caiyong, W., Hafiz, M. A., and Mustafa, E. K. (2020). Effects of land use/land cover and climatic change on the ecosystem of North Ningxia, China. Arab. J. Geosci. 13, 1099. doi:10.1007/s12517-020-06047-6
Anselin, L. (2010). Local indicators of spatial association-LISA. Geogr. Anal. 27, 93–115. doi:10.1111/j.1538-4632.1995.tb00338.x
Bai, Y., and Ma, H. (2010). Eco-environmental vlunerability analysis around Qinghai lake based on RS and GIS technology. Remote Sens. Technol. Apl. 24, 635–641. doi:10.11873/j.issn.1004-0323.2009.5.635
Beroya-Eitner, M. A. (2016). Ecological vulnerability indicators. Ecol. Indic. 60, 329–334. doi:10.1016/j.ecolind.2015.07.001
Boori, M. S., Choudhary, K., Paringer, R., and Kupriyanov, A. (2022). Using RS/GIS for spatiotemporal ecological vulnerability analysis based on DPSIR framework in the Republic of Tatarstan, Russia. Ecol. Inf. 67, 101490. doi:10.1016/j.ecoinf.2021.101490
Cai, X., Li, Z., and Liang, Y. (2021). Tempo-spatial changes of ecological vulnerability in the arid area based on ordered weighted average model. Ecol. Indic. 133, 108398. doi:10.1016/j.ecolind.2021.108398
Cao, J., Yang, Y., Deng, Z., and Hu, Y. (2022). Spatial and temporal evolution of ecological vulnerability based on vulnerability scoring diagram model in Shennongjia, China. Sci. Rep. 12, 5168. doi:10.1038/s41598-022-09205-w
Chen, R., and You, X. (2020). Reduction of urban heat island and associated greenhouse gas emissions. Mitig. Adapt Strateg. Glob. Change 25, 689–711. doi:10.1007/s11027-019-09886-1
Chen, T., Bao, A., Guo, H., Zheng, G., Yuan, Y., and Yu, T. (2019). Ecological vulnerability assessment for a transboundary basin in Central Asia and its spatiotemporal characteristic analysis:Taking Amu Darya River Basin as an example. J. Nat. Resour. 34, 2643–2657.
Chen, Y., Li, H., Karimian, H., Li, M., Fan, Q., and Xu, Z. (2022). Spatio-temporal variation of ozone pollution risk and its influencing factors in China based on Geodetector and Geospatial models. Chemosphere 302, 134843. doi:10.1016/j.chemosphere.2022.134843
Crist, E. P. (1985). A TM Tasseled Cap equivalent transformation for reflectance factor data. Remote Sens. Environ. 17, 301–306. doi:10.1016/0034-4257(85)90102-6
Dewa, D. D., and Buchori, I. (2023). Impacts of rapid urbanization on spatial dynamics of land use–based carbon emission and surface temperature changes in the Semarang Metropolitan Region, Indonesia. Environ. Monit. Assess. 195, 259. doi:10.1007/s10661-022-10839-6
Fan, G. Y., and Cowley, J. M. (1985). Auto-correlation analysis of high resolution electron micrographs of near-amorphous thin films. Ultramicroscopy 17, 345–355. doi:10.1016/0304-3991(85)90201-3
Gorelick, N., Hancher, M., Dixon, M., Ilyushchenko, S., Thau, D., and Moore, R. (2017). Google earth engine: Planetary-scale geospatial analysis for everyone. Remote Sens. Environ. 202, 18–27. doi:10.1016/j.rse.2017.06.031
Guo, B., Wei, C., Yu, Y., Liu, Y., Li, J., Meng, C., et al. (2022). The dominant influencing factors of desertification changes in the source region of Yellow River: Climate change or human activity? Sci. Total Environ. 813, 152512. doi:10.1016/j.scitotenv.2021.152512
Guo, Z., Wei, W., Pang, S., Li, Z., Zhou, J., and Xie, B. (2019). Spatio-temporal evolution and motivation analysis of ecological vulnerability in arid inland river basin based on spca and remote sensing index: A case study on the shiyang river basin. Acta Ecol. Sin. 39, 2558–2572.
Hang, X., Luo, X.-C., Cao, Y., and Li, Y.-C. (2020). Ecological quality assessment and the impact of urbanization based on RSEI model for Nanjing, Jiangsu Province, China. Ying yong sheng tai xue bao = J. Appl. Ecol. 31, 219–229. doi:10.13287/j.1001-9332.202001.030
He, L., Shen, J., and Zhang, Y. (2018). Ecological vulnerability assessment for ecological conservation and environmental management. J. Environ. Manag. 206, 1115–1125. doi:10.1016/j.jenvman.2017.11.059
Heaviside, C., Macintyre, H., and Vardoulakis, S. (2017). The urban heat island: Implications for health in a changing environment. Curr. Envir Health Rpt 4, 296–305. doi:10.1007/s40572-017-0150-3
Hou, K., Li, X., Wang, J., and Zhang, J. (2016). An analysis of the impact on land use and ecological vulnerability of the policy of returning farmland to forest in Yan’an, China. Environ. Sci. Pollut. Res. 23, 4670–4680. doi:10.1007/s11356-015-5679-9
Hou, K., Tao, W., Wang, L., and Li, X. (2020). Study on hierarchical transformation mechanisms of regional ecological vulnerability and its applicability. Ecol. Indic. 114, 106343. doi:10.1016/j.ecolind.2020.106343
Huang, D., Yan, H., Chi, H., Geng, X., and Shao, Q. (2020). Research on spatiotemporal characteristic of farmland ecosystem NPP in Jianghan Plian from 2000 to 2015. J. Nat. Resour. 35, 845–856.
Imam, A. U. K., and Banerjee, U. K. (2016). Urbanisation and greening of Indian cities: Problems, practices, and policies. Ambio 45, 442–457. doi:10.1007/s13280-015-0763-4
IPCC (2007). Summary for policymakers of the synthesis report of the IPCC fourth assessment Report. Cambridge: Cambridge University Press.
Jiang, X., Guo, X., Wu, Y., Xu, D., Liu, Y., Yang, Y., et al. (2023). Ecological vulnerability assessment based on remote sensing ecological index (RSEI): A case of zhongxian county, chongqing. Front. Environ. Sci. 10. Available at: https://www.frontiersin.org/articles/10.3389/fenvs.2022.1074376 (Accessed March 22, 2023).
Jiang, Z., Wu, H., Lin, A., Shariff, A. R. M., Hu, Q., Song, D., et al. (2022). Optimizing the spatial pattern of land use in a prominent grain-producing area: A sustainable development perspective. Sci. Total Environ. 843, 156971. doi:10.1016/j.scitotenv.2022.156971
Jimenez-Munoz, J. C., Cristobal, J., Sobrino, J. A., Soria, G., Ninyerola, M., Pons, X., et al. (2009). Revision of the single-channel algorithm for land surface temperature retrieval from Landsat thermal-infrared data. IEEE Trans. Geoscience Remote Sens. 47, 339–349. doi:10.1109/TGRS.2008.2007125
Jing, Y., Zhang, F., He, Y., Kung, H., Johnson, V. C., and Arikena, M. (2020). Assessment of spatial and temporal variation of ecological environment quality in ebinur lake wetland national nature reserve, xinjiang, China. Ecol. Indic. 110, 105874. doi:10.1016/j.ecolind.2019.105874
Kasimu, Y., Simayi, Z., Wang, L., and Bayi, X. (2019). Response of ecological environment change to urban construction land expansion in Bole City of Xinjiang. Nongye Gongcheng Xuebao/Transactions Chin. Soc. Agric. Eng. 35, 252–259. doi:10.11975/j.issn.1002-6819.2019.01.031
Kumar, L., and Mutanga, O. (2018). Google earth engine applications since inception: Usage, trends, and potential. Remote Sens. 10, 1509. doi:10.3390/rs10101509
Lei, J., Chen, Z., Wu, T., Li, Y., Yang, Q., and Chen, X. (2019). Spatial autocorrelation pattern analysis of land use and the value of ecosystem services in northeast Hainan island. Acta Ecol. Sin. 39, 2366–2377.
Li, F., Zhou, W., Shao, Z., and Zhou, X. (2022a). Effects of ecological projects on vegetation in the three gorges area of chongqing, China. J. Mt. Sci. 19, 121–135. doi:10.1007/s11629-021-6768-5
Li, S., Ge, J., Liang, Y., Liu, Y., Sun, H., Su, W., et al. (2013). An infectious full-length cDNA clone of duck Tembusu virus, a newly emerging flavivirus causing duck egg drop syndrome in China. Res. Soil Water Conservation 20, 238–241. doi:10.1016/j.virusres.2012.10.019
Li, X., Xiao, P., Zhou, Y., Xu, J., and Wu, Q. (2022b). The spatiotemporal evolution characteristics of cultivated land multifunction and its trade-off/synergy relationship in the two lake plains. Int. J. Environ. Res. Public Health 19, 15040. doi:10.3390/ijerph192215040
Li, Y., Li, Y., Zhou, Y., Shi, Y., and Zhu, X. (2012). Investigation of a coupling model of coordination between urbanization and the environment. J. Environ. Manag. 8, 127–133. doi:10.1016/j.jenvman.2011.12.025
Liou, Y.-A., Nguyen, A. K., and Li, M.-H. (2017). Assessing spatiotemporal eco-environmental vulnerability by Landsat data. Ecol. Indic. 80, 52–65. doi:10.1016/j.ecolind.2017.04.055
Liu, C., Sun, W., and Li, P. (2022). Characteristics of spatiotemporal variations in coupling coordination between integrated carbon emission and sequestration index: A case study of the Yangtze River delta, China. Ecol. Indic. 135, 108520. doi:10.1016/j.ecolind.2021.108520
Martin, D. (1996). An assessment of surface and zonal models of population. Int. J. Geogr. Inf. Syst. 10, 973–989. doi:10.1080/02693799608902120
Naikoo, M. W., ShahfahadTalukdar, S., Ishtiaq, M., and Rahman, A. (2023). Modelling built-up land expansion probability using the integrated fuzzy logic and coupling coordination degree model. J. Environ. Manag. 325, 116441. doi:10.1016/j.jenvman.2022.116441
Nguyen, A. K., Liou, Y.-A., Li, M.-H., and Tran, T. A. (2016). Zoning eco-environmental vulnerability for environmental management and protection. Ecol. Indic. 69, 100–117. doi:10.1016/j.ecolind.2016.03.026
Parastatidis, D., Mitraka, Z., Chrysoulakis, N., and Abrams, M. (2017). Online global land surface temperature estimation from Landsat. Remote Sens. 9, 1208. doi:10.3390/rs9121208
Shahfahad, , Naikoo, M. W., Towfiqul Islam, A. R. Md., Mallick, J., and Rahman, A. (2022). Land use/land cover change and its impact on surface urban heat island and urban thermal comfort in a metropolitan city. Urban Clim. 41, 101052. doi:10.1016/j.uclim.2021.101052
Shahfahad, , Rihan, M., Naikoo, M. W., Ali, M. A., Usmani, T. M., and Rahman, A. (2021). Urban heat island dynamics in response to land-use/land-cover change in the coastal city of Mumbai. J. Indian Soc. Remote Sens. 49, 2227–2247. doi:10.1007/s12524-021-01394-7
Sharifi, E., Larbi, M., Omrany, H., and Boland, J. (2020). Climate change adaptation and carbon emissions in green urban spaces: Case study of Adelaide. J. Clean. Prod. 254, 120035. doi:10.1016/j.jclepro.2020.120035
Tang, L., Kasimu, A., Ma, H., and Eziz, M. (2023). Monitoring multi-scale ecological change and its potential drivers in the economic zone of the tianshan mountains’ northern slopes, xinjiang, China. Int. J. Environ. Res. Public Health 20, 2844. doi:10.3390/ijerph20042844
Thiault, L., Marshall, P., Gelcich, S., Collin, A., Chlous, F., and Claudet, J. (2018). Space and time matter in social-ecological vulnerability assessments. Mar. Policy 88, 213–221. doi:10.1016/j.marpol.2017.11.027
United Nations (2015). Transforming our world: The 2030 Agenda for sustainable development. Department of Economic and Social Affairs. New York: United Nations Available at: https://sdgs.un.org/2030agenda (Accessed May 5, 2023).
Wan, L., Wang, S., and Chen, X. (2011). GeoDA-based spatial correlation analysis of GDP in Hadaqi industrial corridor. Geogr. Res. 30, 977–984.
Wang, H., Song, M., Li, R., and Yu, G. (2011). Study on spatial-temporal pattern and driving forces of construction land expansion in jianghan plian from 1996 to 2005. Resour. Environ. Yangtze Basin 20, 416–421.
Wang, J., and Xu, C. (2017). Instrumental networking and social network building: How horizontal networking and upward networking create social capital. Acta Geogr. Sin. 72, 116–134. doi:10.3724/sp.j.1041.2017.00116
Wang, S., Zhang, X., Zhu, T., Yang, W., and Zhao, J. (2016). Assessment of ecological environment quality in the Changbai Mountain Nature Reserve based on remote sensing technology. Prog. Geogr. 35, 1269–1278.
Wang, Z., and Su, Y. (2018). Analysis of Eco-environmental vulnerability characteristics of Hanzhong City, near the water source midway along the route of the south-to-north water transfer project, China. J. Ecol. 38, 432–442. doi:10.5846/stxb201609261944
Wei, Y. D., and Ye, X. (2014). Urbanization, urban land expansion and environmental change in China. Stoch. Environ. Res. Risk Assess. 28, 757–765. doi:10.1007/s00477-013-0840-9
Weißhuhn, P., Müller, F., and Wiggering, H. (2018). Ecosystem vulnerability review: Proposal of an interdisciplinary ecosystem assessment approach. Environ. Manag. 61, 904–915. doi:10.1007/s00267-018-1023-8
Wise, M., Calvin, K., Thomson, A., Clarke, L., Bond-Lamberty, B., Sands, R., et al. (2009). Implications of limiting CO2 concentrations for land use and energy. Science 324, 1183–1186. doi:10.1126/science.1168475
Xiao, C., Li, P., and Feng, Z. (2019). Monitoring annual dynamics of mature rubber plantations in xishuangbanna during 1987-2018 using Landsat time series data: A multiple normalization approach. Int. J. Appl. Earth Observation Geoinformation 77, 30–41. doi:10.1016/j.jag.2018.12.006
Xie, H., Wang, P., and Huang, H. (2013). Ecological risk assessment of land use change in the poyang lake eco-economic zone, China. Int. J. Environ. Res. Public Health 10, 328–346. doi:10.3390/ijerph10010328
Xiong, Y., Xu, W., Lu, N., Huang, S., Wu, C., Wang, L., et al. (2021). Assessment of spatial–temporal changes of ecological environment quality based on RSEI and GEE: A case study in erhai lake basin, yunnan province, China. Ecol. Indic. 125, 107518. doi:10.1016/j.ecolind.2021.107518
Xu, H. (2008). A new index for delineating built-up land features in satellite imagery. Int. J. Remote Sens. 29, 4269–4276. doi:10.1080/01431160802039957
Xu, H. (2013a). A remote sensing index for assessment of region ecological changes. China Environ. Sci. 33, 889–897.
Xu, H. (2013b). A remote sensing urban ecological index and its application. Acta Ecol. Sin. 33, 7853–7862.
Xu, H. (2005). A study on information extraction of water body with the modified normalized difference water index (MNDWI). J. Remote Sens. 9, 589–595.
Xu, H. (2010). Analysis of impervious surface and its impact on urban heat environment using the normalized difference impervious surface index (NDISI). Photogrammetric Eng. Remote Sens. 76, 557–565. doi:10.14358/PERS.76.5.557
Xu, H., Li, C., and Shi, T. (2022). Is the z-score standardized RSEI suitable for time-series ecological change detection? Comment on zheng et al. (2022). Sci. Total Environ. 853, 158582. doi:10.1016/j.scitotenv.2022.158582
Xu, H., Wang, M., Shi, T., Guan, H., Fang, C., and Lin, Z. (2018). Prediction of ecological effects of potential population and impervious surface increases using a remote sensing based ecological index (RSEI). Ecol. Indic. 93, 730–740. doi:10.1016/j.ecolind.2018.05.055
Xu, W., Binbin, H., Aike, K., Cirenluobu, , and Xiao, Y. (2017). The study of quantitative assessment of regional eco-environmental vulnerability based on multi-source remote sensing. IOP Conf. Ser. Earth Environ. Sci. 94, 012141. doi:10.1088/1755-1315/94/1/012141
Yao, X., Yu, K., Liu, J., Yang, S., He, P., Deng, Y., et al. (2016). Spatial and temporal changes of the ecological vulnerability in a serious soil erosion area,Southern China. Chin. J. Appl. Ecol. 27, 735–745. doi:10.13287/j.1001-9332.201603.022
Ye, J., Hu, Y., Zhen, L., Wang, H., and Zhang, Y. (2021). Analysis on land-use change and its driving mechanism in xilingol, China, during 2000–2020 using the google earth engine. Remote Sens. 13, 5134. doi:10.3390/rs13245134
Zhang, B., Li, P., Xu, Y., and Yue, X. (2019). What affects farmers’ ecocompensation expectations? An empirical study of returning farmland to forest in China. Trop. Conservation Sci. 12, 194008291985719. doi:10.1177/1940082919857190
Zhang, F., Liu, X., Zhang, J., Wu, R., Ma, Q., and Chen, Y. (2017). Ecological vulnerability assessment based on multi-sources data and SD model in Yinma River Basin, China. Ecol. Model. 349, 41–50. doi:10.1016/j.ecolmodel.2017.01.016
Zhang, X., Liu, K., Wang, S., Wu, T., Li, X., Wang, J., et al. (2022). Spatiotemporal evolution of ecological vulnerability in the Yellow River Basin under ecological restoration initiatives. Ecol. Indic. 135, 108586. doi:10.1016/j.ecolind.2022.108586
Zhao, Q., Yu, L., Li, X., Peng, D., Zhang, Y., and Gong, P. (2021). Progress and trends in the application of google earth and google earth engine. Remote Sens. 13, 3778. doi:10.3390/rs13183778
Zhao, Y., Wang, M., Lan, T., Xu, Z., Wu, J., Liu, Q., et al. (2023). Distinguishing the effects of land use policies on ecosystem services and their trade-offs based on multi-scenario simulations. Appl. Geogr. 151, 102864. doi:10.1016/j.apgeog.2022.102864
Zheng, C., Wen, Z., Liu, Y., Guo, Q., Jiang, Y., Ren, H., et al. (2021). Integrating habitat suitability and the near-nature restoration priorities into revegetation plans based on potential vegetation distribution. Forests 12, 218. doi:10.3390/f12020218
Zhou, S., Xi, F., Yin, Y., Bing, L., Wang, J., Ma, M., et al. (2021a). Accounting and drivers of carbon emission from cultivated land utilization in Northeast China. Chin. J. Appl. Ecol. 32, 3865–3871. doi:10.13287/j.1001-9332.202111.003
Zhou, X., Wen, H., Zhang, Y., Xu, J., and Zhang, W. (2021b). Landslide susceptibility mapping using hybrid random forest with GeoDetector and RFE for factor optimization. Geosci. Front. 12, 101211. doi:10.1016/j.gsf.2021.101211
Zhou, Y., Li, X., and Liu, Y. (2020). Land use change and driving factors in rural China during the period 1995-2015. Land Use Policy 99, 105048. doi:10.1016/j.landusepol.2020.105048
Zhu, Q., Mei, J., Chen, Y., and Han, X. (2015a). Regional differentiation characteristics and optimization of the structural efficincy of land use in Hubei province based on the carbon emissions. Econ. Geogr. 35, 176–184. doi:10.15957/j.cnki.jjdl.2015.12.025
Zhu, Y., Zhang, R., Gu, J., and Gao, Z. (2022). Spatiotemporal evolution and driving mechanism of ecological well-being performance in the urban agglomeration of the middle reaches of the Yangtze River under the carbon peaking and carbon neutrality goals. Prog. Geogr. 41, 2231–2243. doi:10.18306/dlkxjz.2022.12.004
Keywords: ecological vulnerability, remote sensing ecological index, principal component analysis, Google Earth engine, Geodetector
Citation: Yi S, Zhou Y, Zhang J, Li Q, Liu Y, Guo Y and Chen Y (2023) Spatial-temporal evolution and motivation of ecological vulnerability based on RSEI and GEE in the Jianghan Plain from 2000 to 2020. Front. Environ. Sci. 11:1191532. doi: 10.3389/fenvs.2023.1191532
Received: 22 March 2023; Accepted: 05 June 2023;
Published: 15 June 2023.
Edited by:
Yonghao Xu, Institute of Advanced Research in Artificial Intelligence (IARAI), AustriaReviewed by:
Anlu Zhang, Huazhong Agricultural University, ChinaRina Kumari, Central University of Gujarat, India
Copyright © 2023 Yi, Zhou, Zhang, Li, Liu, Guo and Chen. This is an open-access article distributed under the terms of the Creative Commons Attribution License (CC BY). The use, distribution or reproduction in other forums is permitted, provided the original author(s) and the copyright owner(s) are credited and that the original publication in this journal is cited, in accordance with accepted academic practice. No use, distribution or reproduction is permitted which does not comply with these terms.
*Correspondence: Yong Zhou, eXpob3VAY2NudS5lZHUuY24=