 Loreto Urbina
 Claude Fischer1
 Nicolas Ray
 Anthony Lehmann
- 1Nature Management School of HEPIA, University of Applied Sciences and Arts of Western Switzerland, Geneva, Switzerland
- 2Institute for Environmental Sciences, University of Geneva, Geneva, Switzerland
- 3GeoHealth group, Institute of Global Health, Faculty of Medicine, University of Geneva, Geneva, Switzerland
- 4Department F.-A. Forel of Environmental and Aquatic Sciences, Faculty of Science, University of Geneva, Geneva, Switzerland
Ecological connectivity is a key attribute of landscapes and indicates how landscapes facilitate or impede movement. It is an essential criterion to consider in the design of green infrastructures (GIs) when landscape planners and managers deal with population viability, which in part depends on the movement capacities of organisms. Our goal is to inform about the conservation value of land parcels to maintain or enhance connectivity. For this, we developed a red deer functional connectivity model at a regional scale. We focused our study on this large mammal species inhabiting the Greater Geneva agglomeration between Switzerland and France. Our study site is dominated by forested mountains and lowlands, which are highly fragmented by human infrastructures and agricultural lands. We used GPS location data from 15 red deer to parameterize the habitat resistances with a multivariate analysis. To predict connectivity at the regional scale, we used local expert knowledge to design a graph-based landscape. Then, we used electric circuit theory with Circuitscape software to detect pinch points and map corridors, using the set of resistances parameterized with experimental data and the putative core areas and links identified with the help of expert knowledge. We obtained a map that highlights suitable regional habitat patches and corridors or connectivity pinch points potentially used by red deer between the mountains and the lowlands, ratifying the importance of the transfrontier collaboration while implementing the GI. The obtained results are used to assist landscape managers and planners in their effort to include functional connectivity in the prioritization of the GI across the region.
1 Introduction
Habitat destruction and resulting fragmentation, as well as landscape homogenization, are the main causes affecting biodiversity at a global level (Tscharntke et al., 2012). While habitat destruction has a greater deleterious impact than habitat fragmentation, the latter process can exacerbate the risk of species extinction (Fahrig, 2003; Haddad et al., 2015; Hadley and Betts, 2016). Scientists and managers have long recognized ecological connectivity as a biodiversity conservation criterion to reverse the negative effect of these changes in landscape.
Connectivity is a crucial characteristic of landscapes and indicates how landscapes facilitate or impede the movement of organisms (Taylor et al., 1993). The term “connectivity” traditionally includes two complementary elements: 1) structural connectivity that is determined by the spatial arrangement of landscape elements and 2) functional connectivity that reflects the behavioral response of organisms to landscape structures (Tischendorf and Fahrig, 2000). The response of animals to landscape structure is studied for target species, as connectivity is species-specific (Tischendorf and Fahrig, 2000; Betts et al., 2014). When a multi-species connectivity model is evaluated, it is commonly studied first for a single species separately and then for a combination of species, ecologically similar and sensitive in an analogous way to landscape structure disturbances (Brodie et al., 2015; Mimet et al., 2016).
The study of functional connectivity then involves the quantification of the movement of organisms and the use of robust statistical approaches to obtain reliable model parameters. The empirical estimation of population connectivity by measuring the movement of individuals uses techniques such as VHF radio tracking and GPS telemetry (Tischendorf and Fahrig, 2000; Kool et al., 2013). In addition, molecular techniques such as genetic markers help to estimate the level of genetic connectivity between populations and the relationship between landscape characteristics and evolutionary processes such as gene flow and local adaptation (Ray, 2005; Manel and Holderegger, 2013; Holderegger et al., 2020).
The most used approaches to model functional connectivity from empirical data on movement are the least cost path method, circuit theory, and graph theory. The first two methods have been used to simulate corridors (usually in terms of energy expenditure or visibility to predators) taken by individuals between habitat patches. These methods use costs of movement of different landscape elements, reflecting their permeability to movement for a particular organism (Adriaensen et al., 2003; Spear et al., 2010). Models based on circuit theory use concepts related to current flowing through an electrical circuit of resistances (McRae et al., 2008). The estimated electric density current is associated with the observed movement of individuals traversing the matrix between habitat patches (McRae et al., 2008). This approach can be viewed as an extension of the least cost path method, with the notable difference that circuit theory identifies multiple routes between habitat patches instead single ones, as in the case of the least cost path method (Braaker et al., 2014). The graph theory is complementary and helps to represent suitable habitat patches as nodes and corridors as links to elaborate a landscape model (Urban and Keitt, 2001; Urban et al., 2009). Multiple graph metrics have been developed to identify key elements in the landscape networks (Saura and Rubio, 2010; Kool et al., 2013).
When movement data are absent or only available for small areas, and management decisions must be made, expert knowledge can be considered to parameterize models at large scales (Cook et al., 2010; Martin et al., 2012; Drescher and Edwards, 2019). This kind of data can be used to estimate resistance to movement, but the results are less reliable than the results obtained with empirical data (LaPoint et al., 2013; Zeller et al., 2018). Alternatively, studies that have shown the utility of expert knowledge have concluded that the opinions from local experts (Doswald et al., 2007) or a combination of expert opinions with literature review of empirical studies (Keeley et al., 2016) offer an opportunity to obtain model parameters about habitat suitability.
In Switzerland, the Swiss Plateau and the Jura Mountains are considered the most fragmented bioregions in the country (Jaeger et al., 2008). Efforts have been made to restore the national wildlife corridor system (Jaeger, 2012) through the identification of continuum of areas that are favorable to animal movement (Holzgang et al., 2001; Berthoud et al., 2004). More recently, the Swiss Biodiversity Strategy has set the goal of establishing a green infrastructure (GI) of protected areas and ecological networks by 2040 (Federal Office for the Environment, 2017). In this context, the Canton of Geneva has lined up its biodiversity strategy and action plan to define and model its green infrastructure (GI) by integrating species diversity, ecological connectivity, and ecosystem services, in a spatial conservation prioritization scheme (Honeck et al., 2020a). Indeed, the development of functional connectivity models was proposed as a tool to elaborate an additional spatial layer to inform landscape managers and planners about the conservation value of lands to connect wildlife habitats (Honeck et al., 2020b).
Our aim was to create a regional map of functional connectivity for red deer (Cervus elaphus) in the Greater Geneva region to assist landscape planners and managers in their effort to include functional connectivity in the definition of the GI. In our case, building landscape functional connectivity models to inform decision making required the use of both movement data and expert knowledge. This policy need provided us with an opportunity to fill the gap between an analytical and scientific framework using quantitative analysis and expert opinions. Scientists and conservation practitioners can mutually benefit from this process to better help planners in the allocation of resources for conservation action (Lehtomäki and Moilanen, 2013; Honeck et al., 2020a; Kareksela et al., 2020). In this study, we followed a data-driven approach to parameterize a habitat resistance model and then an expert-based approach to predict functional connectivity at a regional scale. We applied our framework to a human-dominated landscape using GPS tracking data on red deer available for a small area in the Geneva region of Switzerland. Moreover, we benefited from the knowledge of local experts on habitat requirements and movement behaviors because this species is well known by biologists and gamekeepers in the region.
2 Materials and methods
We applied the following four general steps to develop a functional connectivity map at regional scale by combining expert knowledge and data on red deer movement (Figure 1): 1) habitat mapping, 2) habitat resistance parameterization from experimental data, 3) data collection from expert knowledge, and 4) functional connectivity modeling at the regional scale).
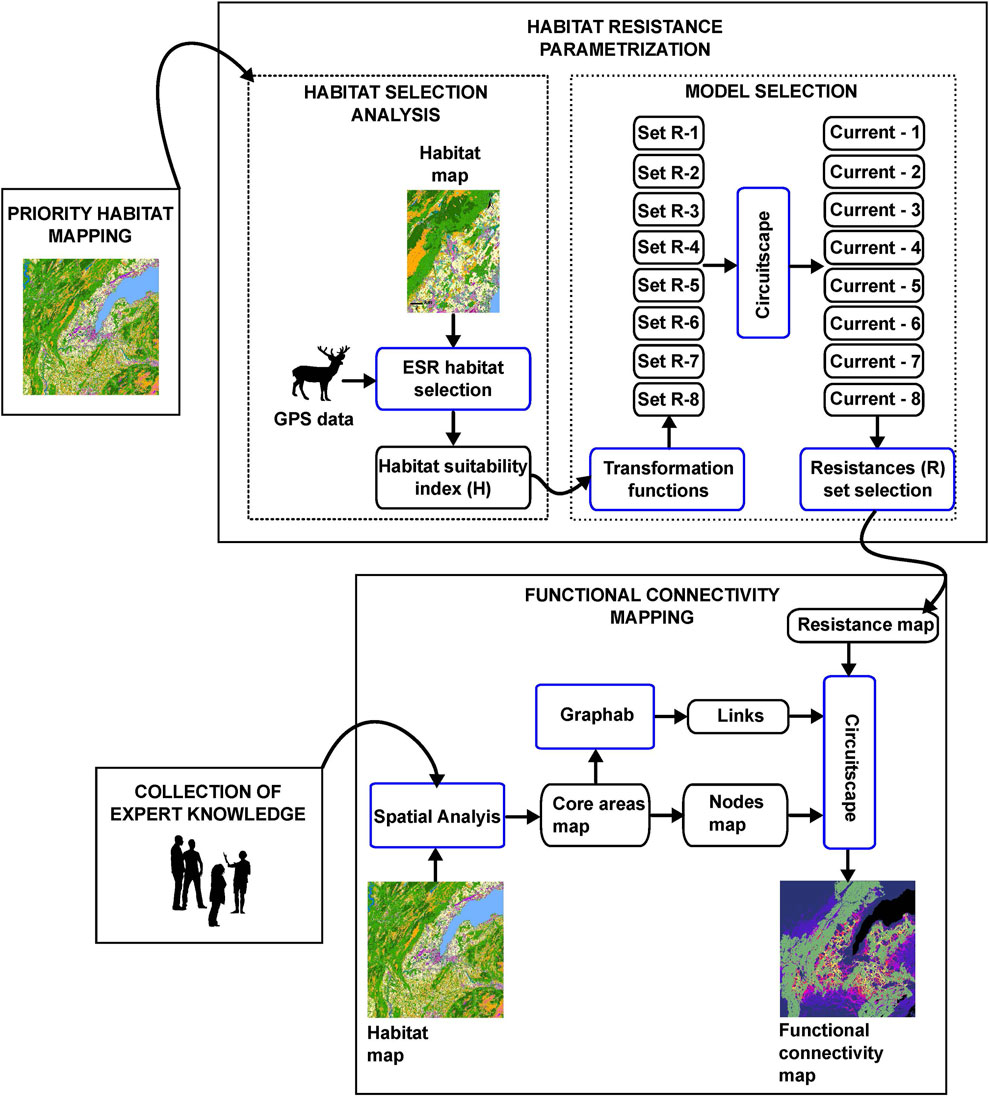
FIGURE 1. Workflow for obtaining landscape functional connectivity maps by combining experimental data with expert knowledge.
2.1 Study area and habitat mapping
Our study area corresponds to the Greater Geneva agglomeration that is formed by 222 communes of two French departments (Ain and Haute–Savoie) and two Swiss cantons (Geneva and Vaud). The Canton of Geneva is located in the bioregion of the Plateau and is bordered by a series of forested mountains that are located in France and in the Swiss Canton of Vaud (Figure 1). At this scale, the landscape structure of the Plateau corresponds to a mosaic of urban areas, croplands, and fragmented forest patches (Fattebert et al., 2017). Specifically, the Canton of Geneva consists approximately of 12.3% forested areas and 37.7% agricultural areas, with the rest being urbanized (Federal Office of Statistics, 2021).
The land cover map of this study site was obtained from the territorial information system of Geneva (SITG) (GE21, 2022) and transformed into a habitat map by aggregating existing classes into categories of relevant habitats for the red deer (Figure 2). We constructed the habitat map in ArcMap 10.8.1 (ESRI, 2019) at 5 m resolution, which allows better delineation of transport infrastructures affecting animal movement in the region. The total area size of the analyzed region was almost 6000 km2 which represented over 240 million cells at 5 m pixel resolution.

FIGURE 2. Study area and habitat map.
2.2 Focal species
Red deer is one of the most abundant ungulate species in Europe. It has been influenced by human disturbances over centuries (Hartl et al., 2003). The principal threat on red deer gene pools is habitat fragmentation in human landscapes, which causes a reduction of genetic variability in the isolated populations throughout Europe (Zachos and Hartl, 2011). In Switzerland, this species was considered early as a focal species for the definition of the national level ecological network because red deer is a long-distance migrant animal and the corridors used during these movements are relatively well known in the country (Holzgang et al., 2001; Berthoud et al., 2004). Moreover, in our study area, the regularity and magnitude of these movements make this species sensitive to landscape fragmentation (Fischer and Ranzoni, 2017).
In the Greater Geneva agglomeration, red deer are present in the Jura and in the Voirons mountains (Figure 2). Seasonal migrations are observed for males during the end of winter and during the breeding season only between the Jura Mountains and some fragmented forest patches located in the lowlands of the regions of Versoix and L’Etournel 2 (Morisot et al., 2016). According to Martin et al. (2018), the Jura population is a partial mixed migrant population and its altitudinal range is near to 1000 m. Annual home ranges for females and males inhabiting the Jura Mountains are similar (1758 ha and 1773 ha, respectively), but they are larger than home ranges of females inhabiting the Versoix lowlands (902 ha) (Morisot et al., 2016; Fischer and Ranzoni, 2017).
Forested habitats used by red deer in the Greater Geneva region are favorable not only for the red deer but also to a number of other species such as roe deer (Capreolus capreolus), wild boar (Sus scrofa), and the European hedgehog (Erinaceus europaeus) (Fischer and Ranzoni, 2017). Corridors used by the red deer are also likely to be favorable for the Eurasian lynx (Lynx lynx). Indeed, the conservation and management of the Eurasian lynx in Switzerland depends on the promotion of the connectivity from the Jura Mountains with adjacent mountain ranges in France and Germany (Breitenmoser et al., 2007; Gimenez et al., 2019).
2.3 Movement data
We used GPS data from 15 red deer (eight females, seven males) inhabiting in the Versoix region, in the northeast part of the Greater Geneva agglomeration (Figure 2). Animals were captured with a hypodermic gun and fitted with GPS–GSM collars and ear tags (Fischer and Ranzoni, 2017). GPS locations were recorded every half hour during the night and every 6 h during the day. A total of 85′621 fixes of 15 individuals were obtained between 2009 and 2016.
The red deer GPS locations were divided into two datasets: one for the habitat resistance parameterization and one for model selection. The parameterization dataset was used to estimate an index of habitat suitability during animal movement. Because animals are principally active during the night, only GPS locations between sunset and sunrise were subsequently used for habitat selection analysis. For the parameterization dataset, we used the data of 13 tracked individuals, totaling 57′686 fixes during night time. For the model selection dataset, we used the nighttime fixes of the two remaining individuals that were the most mobile female and male deer, accounting for 7′757 fixes. We controlled that all GPS fixes had a GPS dilution of precision (DOP) of less than 5 m.
2.4 Habitat resistance parameterization
As is showed in Figure 1, habitat resistance parameterization consisted in the estimation of habitat resistance from GPS data. Typically, resistance is estimated from an inverse function of habitat suitability, assuming that areas of high suitability have the ability to offer low resistance to movement (Keeley et al., 2016; Zeller et al., 2018). Different options of transformation are used to transform habitat suitability into resistances with the aim of obtaining a set of resistances that better highlight corridors (Beier et al., 2008). The methodological approach proposed by Braaker et al. (2014) was used as a reference to parameterize a habitat resistance model, i.e., to assign a resistance value to each habitat type. This method minimizes the subjectivity of connectivity assessment by using empirical data in the analysis of habitat suitability and various mathematical functions to transform habitat suitability into resistance.
The habitat selection analysis was used to estimate habitat suitability and was performed with an eigenvalue analysis of habitat selection ratios (ESR) of Manly (2002) (Calenge and Dufour, 2006), using the AdehabitatHS R-package (Calenge, 2006). Available and used habitats were then determined from the home range of each individual (third-order level of Johnson (1980)). Home ranges were estimated with the AdehabitatHR R-package by constructing the 95% minimum convex polygon (MCP) (Mohr, 1947). In a second step, a measure of the habitat selection for the whole population was performed using the method proposed by Braaker et al. (2014). We estimate then an index of habitat suitability for movement between 0 (low) and 1 (high) that was transformed into habitat resistance using a transformation function (Keeley et al., 2016, Eq. 3). Finally, eight transformation equations were tested by varying the shape of the curves as in the work of Keeley et al. (2016), which resulted in eight habitat resistance sets (see Supplementary Table S2).
To select the best habitat resistance set among the eight estimated ones, it was assumed that the best habitat resistance model should allow us to obtain the highest current density values at the nightly locations of the two individuals used for model selection. We extracted the current density values at the nightly locations from the eight current density maps, which were elaborated from each of the eight resistance maps produced. We modeled the current density with the help of Circuitscape 5 (Anantharaman et al., 2020), in the area encompassing all home ranges plus a 20% buffer zone. We then estimated the current density between core areas used in the Plateau, defined as the 50% fixed kernel polygon around the daily locations of the 15 individuals because red deer mainly rest during daytime in this population (Supplementary Material S2; Supplementary Figure S5). We used the kernel density tool of ArcMap 10.8.1 (Silverman, 1986; ESRI, 2019). In the case of the Jura Mountains, core areas were not identified by the kernel density tool as red deer can move across all this extended forested area without hindrance. Because in this area seasonal migrations are observed between the Jura Mountains and some fragmented forest patches located in the Plateau (Fischer and Ranzoni, 2017), we also placed one focal node in the forested slope of the Jura Mountains and one in the neighboring Mont Mussy (Supplementary Material S2; Supplementary Figure S5). Current density maps were then inferred using all possible pairs between core areas (on the Plateau) and nodes (in the extended forests of the mountains). We then tested our hypothesis by comparing the medians of the density current values using the Kruskal–Wallis test with the post hoc Dunn test for multiple comparisons and conducting this analysis in R software (R Core Team, 2022). The habitat resistance model that gives the highest current densities around the median was then selected.
2.5 Data collected from expert knowledge
As telemetry data were only available for the north-eastern part of the Greater Geneva area, data collected from expert knowledge were used to identify putative core areas at the regional scale and the potential links between them. We contacted eight experts of red deer ecology to get information about habitat requirements and movements capacities. These data were collected with an online survey that was elaborated with the help of the LimeSurvey tool (LimeSurvey GmbH, 2012) and available online for 2 months. Experts were asked to select which one was to be considered essential for the species ecology from a list of relevant habitats, as well as their minimal patch size as a measure of habitat quality. They also provided the estimate of the distance traveled by a red deer for three different types of movement: foraging, seasonal migration, and dispersion. The composition of the areas was estimated according to the frequency of votes for the habitats identified as essential for this species. The minimal patch sizes of suitable habitats and the dispersal movement distances between core areas were obtained from the median of values provided by experts.
2.6 Functional connectivity modeling at the regional scale
We obtained a functional connectivity model highlighting corridors or connectivity pinch points in the Greater Geneva agglomeration. For this, we combined the graph method and electrical circuit theory. We first constructed a planar graph using the software Graphab 2.8 (Foltête et al., 2021) using the map of putative core areas and the dispersal distance inferred from expert knowledge. Thanks to this procedure, it was possible to reduce the number of pairs of core areas to be connected and, consequently, the calculation time. Then, the localization of corridors was estimated with the help of Circuitscape 5 (Anantharaman et al., 2020) between graph nodes (centroids of core areas) and links and using the selected habitat resistance. The total area size of the analyzed region at the landscape level was almost 6,000 km2 which represented over 240 million cells at 5 m pixel resolution.
2.6.1 Core area delineation
Core area detection consisted in the delimitation of potentially favorable areas to represent sources and destinations of biological populations. Between them, organisms would be motivated to cross the landscape matrix. For a target species, core areas may consist of different habitat types. In addition, habitat patch size can be used as an indicator of the patch habitat quality. By combining these two criteria acquired from experts’ replies, we were able to identify several areas at the regional scale that might constitute the nodes of the ecological networks. We followed a two-step sequence of spatial analyses in order to construct the core area map: 1) delimitation of suitable patches by the type of habitat and minimal patch size separately and 2) delimitation of core areas by aggregating neighboring suitable patches using a priority rule. This rule consisted of defining a focal habitat from among all the priority habitats, around which the others were then aggregated. This spatial analysis was implemented using the Python 3 programming language and the ArcMap 10.8.1 ModelBuilder tool (ESRI, 2019).
2.6.2 Estimation of links
We estimated links between core areas by constructing a planar graph between them. We used the dispersal distance of red deer obtained from the expert knowledge and the core areas map to parameterize Graphab 2.8 software (Foltête et al., 2021). In this way, we drew all possible non-crossing links between core areas located at a distance less than the dispersal distance.
2.6.3 Corridors or connectivity pinch point map
The resistance map of the Greater Geneva agglomeration was obtained by reclassifying the available habitat map in habitat resistance values ranging from 1 to 100, according to the resistance values obtained from the selected model. Highways and buildings are impassable barriers, and therefore, we gave them an infinite value of resistance (no data value). These spatial analyses were conducted using the ModelBuilder tool in Arcmap 10.8.1. (ESRI, 2019).
We parameterized Circuitscape 5 (Anantharaman et al., 2020) to obtain a map of electrical current density. Three input data in ASCII format were used to parameterize this software: 1) the resistance map of the Greater Geneva agglomeration at a pixel size of 5 m; 2) a node map consisting of the centroid of each core area; and 3) a list of connections between nodes as indicated by the constructed planar graph. The electric current density symbolizes the probability of net movement between two habitat patches (McRae et al., 2008). Thus, corridors or pinch points of current density correspond to regions where there is an estimated high probability of movement due to the scarcity of alternative passages and that these are, thus, very vulnerable. The classes of the current density image correspond to the deciles of the result between 0: low current density (first decile) and 1: high current density (last decile).
3 Results
3.1 Habitat resistance model
3.1.1 Habitat selection
The analysis of the habitat selection shows that about 48.62% and 33.65% of the variability is summarized in the first two main factorial axes. As shown in Figure 3, the classes that are most selected by the 13 tracked individuals are croplands, coniferous forests, hardwood forests, and moorlands. Transport infrastructures, buildings, and other paved surfaces are avoided (Figure 3). Habitat selection among the different individuals showed three patterns of preferences: 1) six individuals (five females and one male) preferentially selected croplands; 2) four individuals (one female and three males) preferentially selected crops, coniferous forests, and hardwood forests; and 3) three individuals (one female and two males) preferentially selected coniferous forests, hardwood forests, and moorlands (Figure 3). These preferences are confirmed by Manly’s habitat selection ratios obtained (Supplementary Table S1). The resultant vector of the average of habitat selection shown in Figure 4 indicates that on average, the maximum value of suitability 1 is given to croplands and the minimum 0 to highways. Consequently, all other classes were attributed values between 0 and 1 according to their relative distance from the most selected class (croplands) (Supplementary Table S2).
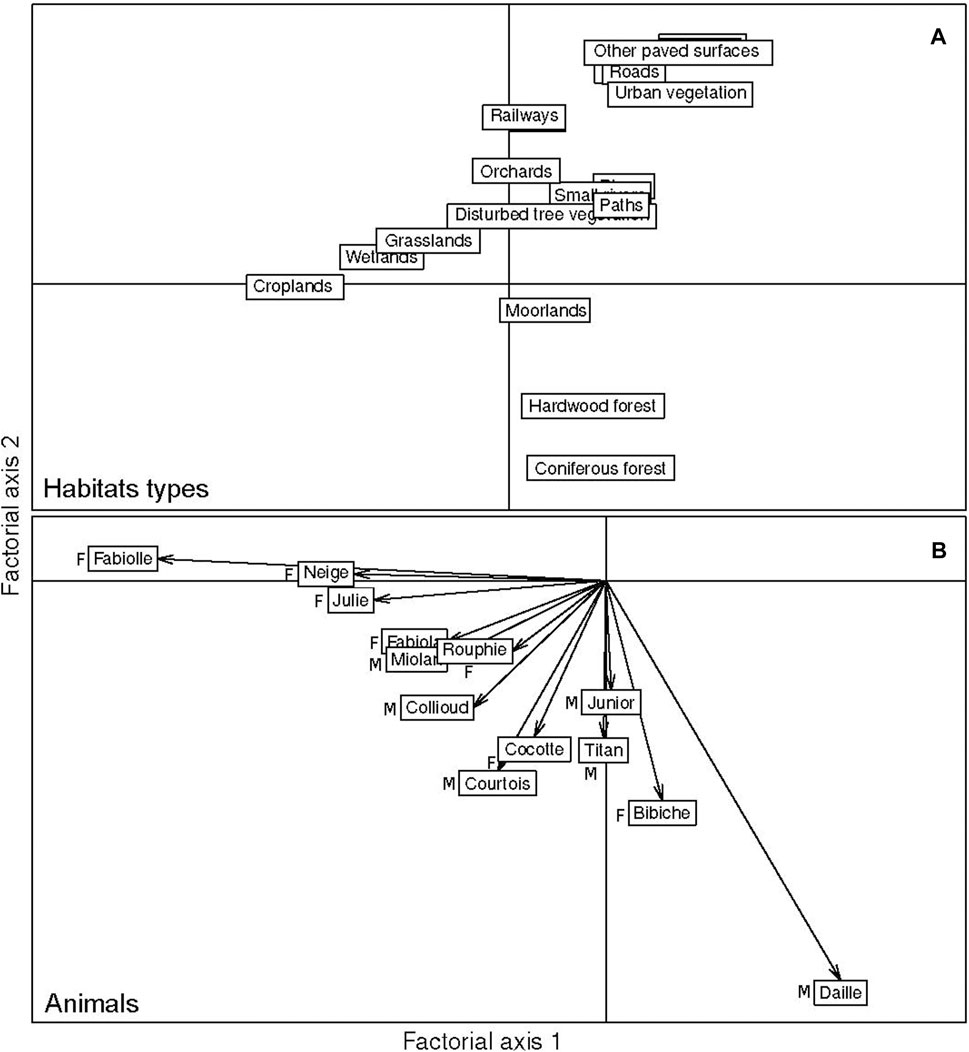
FIGURE 3. Habitat selection at night by 13 individuals using the ESR methods. (A) Position of the habitat classes in the first two principal factorial axes. (B) Position of the individuals in the first two principal axes of the ESR analysis (F: female; M: Male).
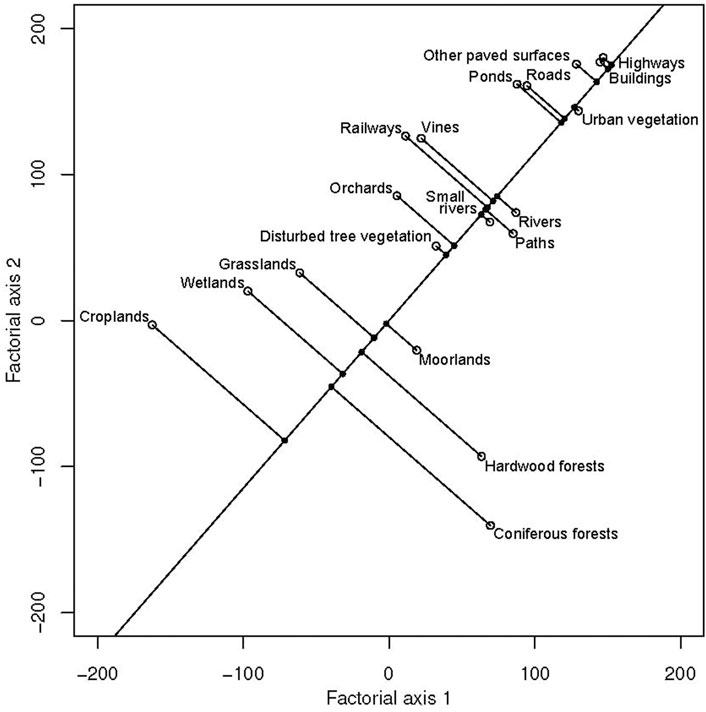
FIGURE 4. Average axis of habitat selection derived from the ESR analysis.
3.1.2 Habitat resistance model choice
Among the eight resistance maps inferred from the habitat suitability index (Supplementary Figure S2), the highest median current density value comes from the exponential transformation equation of coefficient c = 8 (model R6) (Figure 5). The results of the Kruskal–Wallis test (H = 946.1 df = 7, p < 0.05, η2 [H] = 0.0151) with the post hoc Dunn test for multiple comparisons of models indicate significant differences between model R6 and all the other models except R5 (p-adjust
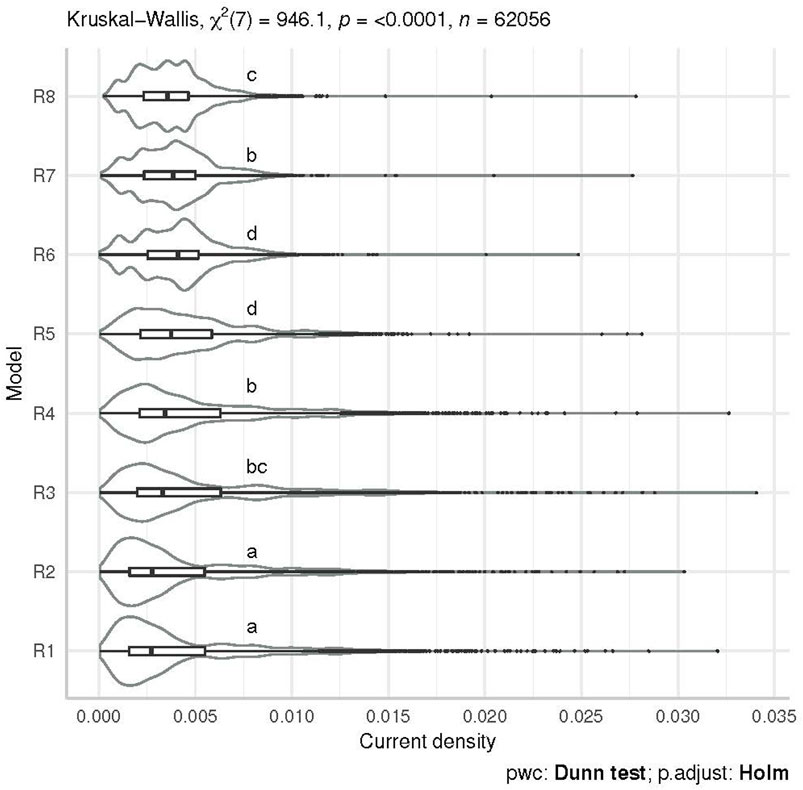
FIGURE 5. Violin plots of current density obtained from eight different resistance models at the nocturnal location level of the two animals used as control. Distributions sharing a letter are not significantly different (p-adjust =0.05 Dunn-adjusted).
3.2 Landscape graph
We identified 172 core areas and 424 links (Figure 6) in the region of Greater Geneva. According to the experts, core areas are principally composed by forests of a minimal patch size of 30 ha. Other habitat patches around suitable forest patches compose these core areas, such as forest edges (minimal patch size = 4 ha), moorlands (minimal patch size = 15 ha), shrublands (minimal patch size = 4 ha), grasslands (minimal patch size = 1 ha), croplands (minimal patch size = 5 ha), and orchards (minimal patch size = 5 ha). The dispersal distance of red deer used to construct the minimal graph between putative core areas was equal to 30 km. For details about the responses of experts, check Supplementary Figures S1–S3.
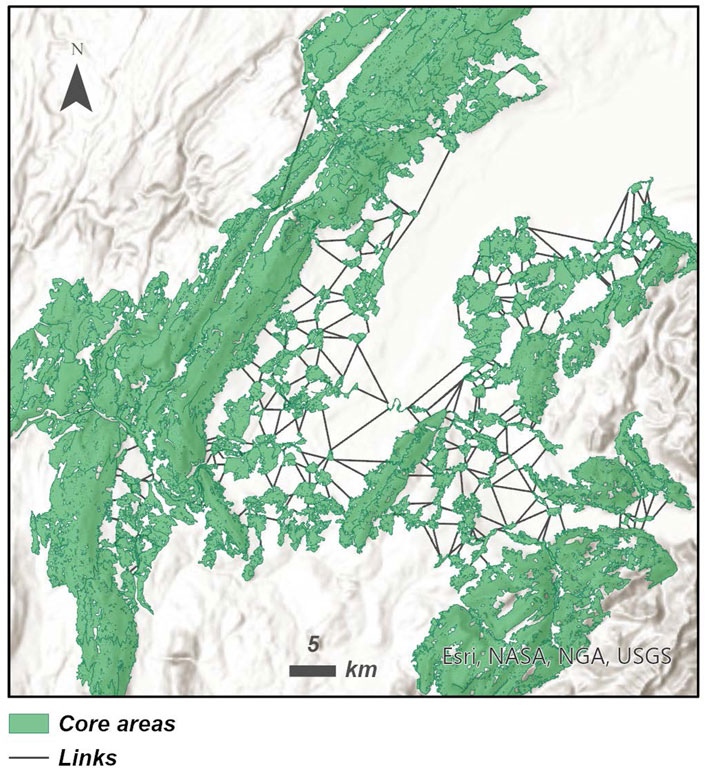
FIGURE 6. Map of the graph-based landscape in the region of Greater Geneva.
3.3 Functional connectivity map for red deer at the regional scale
The regional map of core areas and corridors or pinch points of connectivity are shown in Figure 7. Priority areas (last decile of current density) appear principally in the base of the mountains, in regions connecting them to core areas located in the French part of the Plateau. It can also be observed that the principal barriers to movement are Lake Geneva, the city of Geneva, and highways.
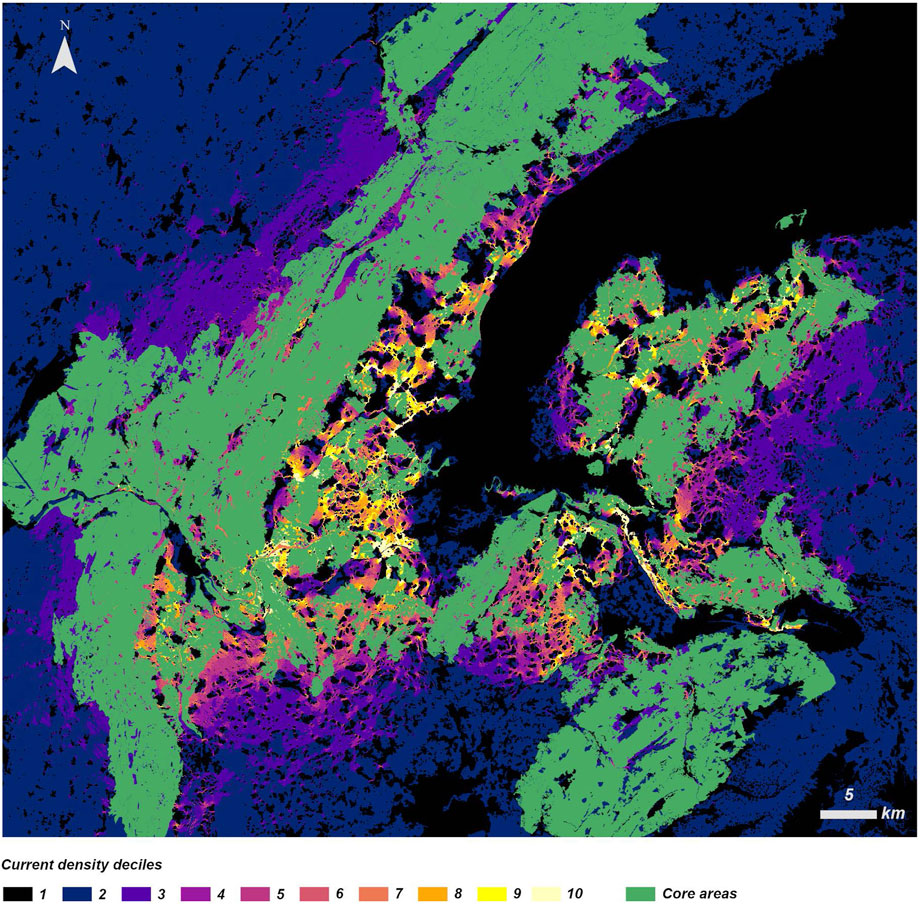
FIGURE 7. Map of core areas and corridors or pinch points of connectivity for red deer in the region of Greater Geneva. Current density is represented in deciles from 1 (low current density or impassable) to 10 (high current density or high probability of passage).
Figure 8A shows the north-eastern part of the Canton of Geneva. This area is connected by passages of high current density (last decile) delineated between the Versoix region (core areas 113, 114, 115, 133, and 168) and the Jura Mountains (core areas 162, 169, and 170), as it was proven for animals tracked in this region (Supplementary Figure S5).
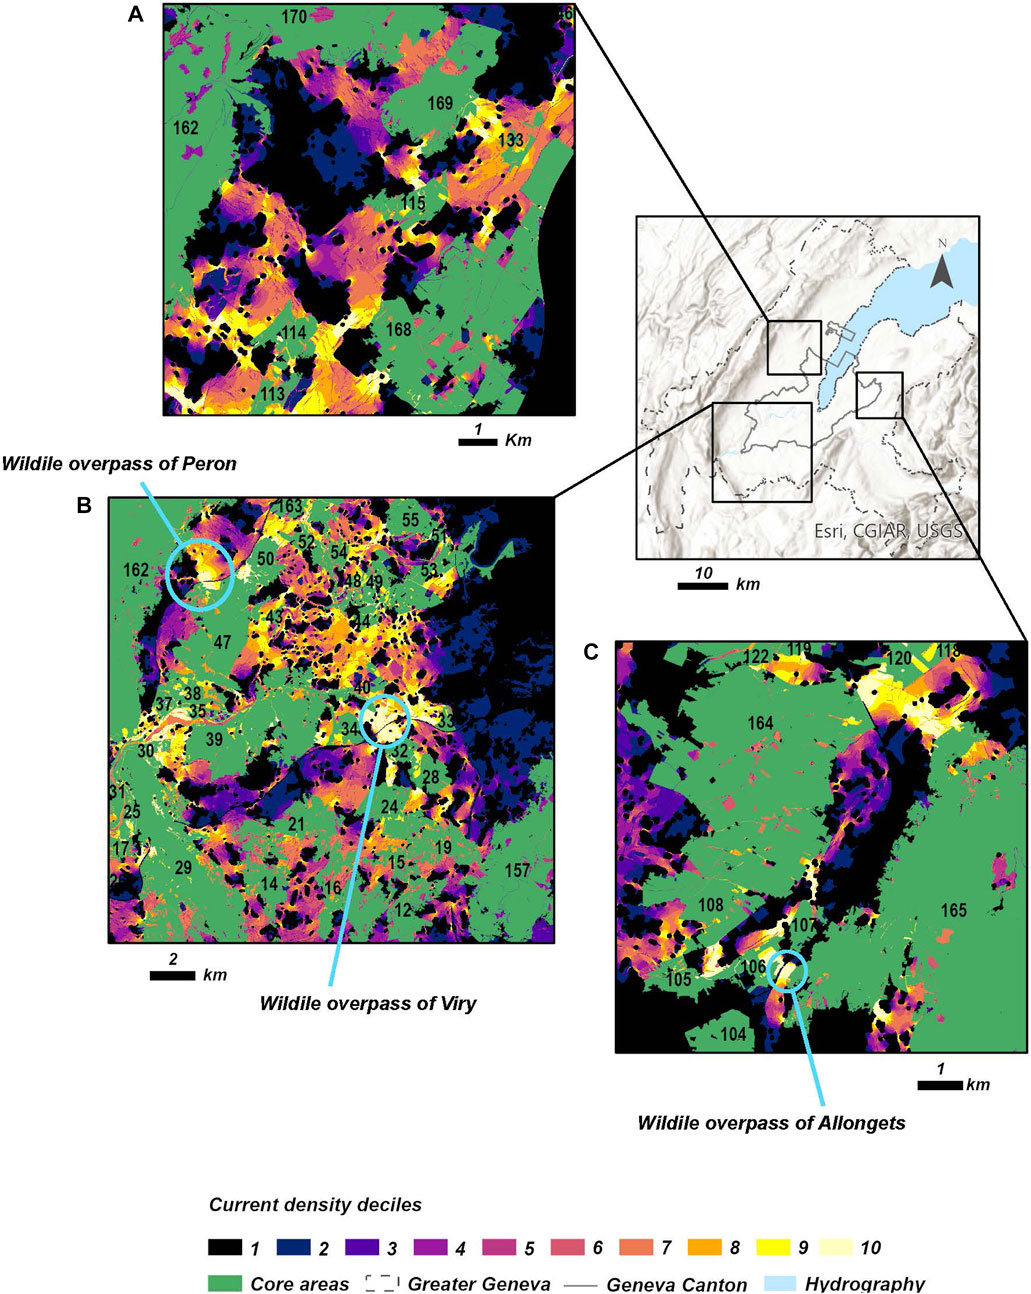
FIGURE 8. Details on principal corridors or pinch points of connectivity connecting the Canton of Geneva with the rest of the Greater Geneva region. (A) Northern corridors or pinch points connecting the Jura Mountains (core areas 162, 169 and 170) with the lowlands of the Versoix region (core areas 114, 133, and 168). (B) Southwestern corridors or pinch points and the influence of the recent wildlife overpass of Viry and Peron in the promotion of red deer connectivity. (C) Eastern corridors or pinch points connecting the Voirons Mountains (core area 165) with the Jussy forest in the Plateau (core areas 108 and 164).
The agricultural area of the southwestern part of the Canton of Geneva is shown in Figure 8B. In this region, the major corridors or pinch points of connectivity (last decile of current density) are located in the area connecting L’Etournel (core areas 35, 37, and 38) with Chancy (core area 39). It is also possible to observe high values of current density around the recent two wildlife overpasses located in this part of the study area (current density = last decile). The wildlife overpass constructed in the locality of Viry acts as a link between Mont Salève (core area 157) with the southern Jura Mountains (core area 162). It facilitates the current flow between the southern areas connected with Mont Salève (core areas 24, 28, 32, and 34), passing through Chancy and L’Etournel, to finally reach the Jura Mountains. The other core areas located in the Canton of Geneva are not connected with the mountains because highways and urban settlements impede the current flow. In addition, they are inter-connected by open lands, though these passages exhibit lower values of current density (eight to nine deciles).
Finally, in Figure 8C, it can be seen that only few passages are delineated in the east of the Canton of Geneva. The major core areas in the lowlands are located in the Jussy forest (core areas 108 and 164) and are linked with the Voirons Mountains, principally by a corridor or pinch point to the north (last decile of current density). It is also possible to observe the importance of the Allongets wildlife overpass to connect those large core areas by a southern corridor (last decile of current density) and passing through smaller core areas at the same time (core areas 105, 106, and 107).
4 Discussion
Our model is being used to incorporate the conservation value of lands connecting habitat patches for red deer, a well-known focal species, into the planning of Geneva’s GI (Honeck et al., 2020a). We were able to point out the potential corridors that could be used at the regional level and the principal barriers to movement. The promotion of connectivity for a species like red deer calls for a transfrontier collaboration because potential core areas and corridors are placed on both sides of the frontiers.
Using expert knowledge is less accurate than telemetry data, but the latter are often not available at larger spatial extents or for small species. Expert knowledge is then the best alternative to inform about connectivity and should be used in areas with limited availability of empirical data (Petsas et al., 2020). To cope with this issue, we informed in a transparent way about expert choices, which is essential for a process of spatial conservation prioritization (Kareksela et al., 2020). In addition, we provided a structured and parsimonious way to identify putative core areas and dispersal links to biologists and practitioners. Experts actually have a better insight of habitat selection than of landscape use during prospecting and dispersal movements (Keeley et al., 2016). In accordance with this assumption, we only used a few parameters about habitat structure to facilitate the construction of graph nodes and links at a regional scale, on the advice of experts familiarized with the study area and red deer monitoring. Additionally, our graph-landscape model was able to identify the main core areas with the observed red deer population as the Jura and Voirons mountains and the core areas of the lowlands, in Versoix and in L’Etournel.
At the same time, we proposed a method to obtain a useful prediction of potential corridors or pinch points of connectivity by taking advantage of GPS data for red deer. Our results show that a non-linear, negative exponential relationship between habitat suitability and resistance leads to a better resistance model for the red deer. Consistent with our study, Keeley et al. (2016) found that the Canadian red deer (Cervus canadensis) also chose to move through open areas, avoiding developed areas of medium to high density during long-distance movements, with a negative exponential relationship found to be the best choice for modeling. For purposes of the GI mapping, we chose to use the resistance set allowing highlighting the major corridors or pinch points of connectivity used by all individuals tracked. We chose one of two different yet valid equations to transform the habitat suitability index into resistance, each of which could lead to a different value, therefore creating some uncertainty. We observed an intra-specific variability in habitat selection of the tracked individuals, but we did not take this into consideration because our model intended to serve as a baseline for landscape planners and managers to target field research on the areas of interest. In the future, more complex models should be elaborated to account for this variation (Baguette and Van Dyck, 2007). We could, for instance, consider the elevation habitat use of ungulates driven by sex-dependent movement behavior, as described by Ruckstuhl and Neuhaus (2006). It will also probably be necessary to use more complex methods such as individual-based models (Unnithan Kumar et al., 2022).
We predicted that at the regional scale, the principal corridors or pinch points of connectivity are located in areas connecting the largest forested mountains with the largest and closest forested areas in the lowlands. The estimated corridor located between the Jura Mountains and the lowlands of the Versoix region is used by males during seasonal migration between summer and autumn ranges, as was noted by previous research in this region (Martin et al., 2012; Morisot et al., 2016). The former authors also noted that this area is used by males during the breeding season. According to Jarnemo (2011), this kind of movement is likely to be linked to intra-sexual competition in males to improve the opportunities of reproductive success. This represents an important link between the populations of the Jura Mountains and the lowlands regarding gene flow. A combination of least cost models and circuit theory might give better results in identifying these corridors, as it was established that for migratory routes of ungulates, least cost path models out-perform circuit theory (McClure et al., 2016; Dickson et al., 2019). To perform this kind of analysis, it will be necessary to expand our understanding of red deer movement behavior by identifying, for example, long-distance migration steps as proposed by McClure et al. (2016), with the aim of better informing about corridors used during this kind of movement. This additional understanding will also be useful in determining how smaller forest patches could be viewed as stepping stones, when they act as daytime cover areas during seasonal migration. Along with corridors, smaller forest patches are essential elements to protect regarding their potential role in connecting the mountains with the largest core areas of the lowlands, as we noted for the population inhabiting in the Versoix region.
Additionally, we predicted that corridors or pinch points of connectivity between scattered core areas in the lowlands are located principally in the French side. On the other hand, core areas located in the Canton of Geneva are less connected to population hot-spots of the largest forest extents of the Jura and Voirons mountains, in accordance to the high fragmentation level of the Swiss Plateau (Jaeger et al., 2008). Indeed, we showed how urban areas and highways impede red deer connectivity between the Swiss Plateau and the potential of overpasses to reconnect these lowlands with the largest forest extents of the Jura and Voirons mountains. Animals using the patchy core areas in the Versoix region followed alternative paths that were detected by our model, showing the utility of circuit theory to identify alternative corridors in fragmented landscapes. This was already shown in previous studies for other species (Braaker et al., 2014; Rödder et al., 2016; Grafius et al., 2017). These kinds of short-range movements are likely linked to the patchy distribution of forested habitats, causing resources to be scattered in the landscape. In other human-dominated landscapes within Northern Europe, more extended nighttime displacements have also been observed during feeding between forested daytime resting areas for females (Allen et al., 2014). This allows us to presume that this kind of movement explains the presence of corridors or pinch points of connectivity in the lowlands of the Versoix region. Females are also reported to perform long-distance movements between harems during the rut (Stopher et al., 2011). Even if this behavior cannot be excluded, we never did observe it in the females we fitted with GPS-collars in our study area (Fischer and Ranzoni, 2017).
Maintaining the existing corridors of regional importance and enhancing them by building wildlife overpasses above barriers such as highways should allow for the preservation or increase of connectivity for red deer and other species using similar habitats. In addition, by estimating current density corridors or pinch points, the circuit theory allows us to identify particularly vulnerable corridors or corridor stretches and can, thus, be used as a prioritization tool for planners to invest resources in the most critical areas. Assessing connectivity is a difficult task that demands a significant effort from both scientists and managers to obtain acceptable ecological models (Lehtomäki and Moilanen, 2013) based on in-depth knowledge of the target species’ ecology. For this, theoretical corridors or pinch points of connectivity obtained with modeling should be validated in the field or with tracking data. As it is not possible to validate all theoretical corridors, the resulting corridors or pinch points of connectivity provided by the circuit theory allow the prioritization of this field work. Moreover, to ensure their true functionality, it is necessary to propose an action plan on the ground, with the aim of maintaining the long-term viability of animal populations (Brodie et al., 2016; Daigle et al., 2020). In our study area, for example, field surveys have shown the presence of fences acting as barriers to movement. The different kinds of fences increase the level of fragmentation and are additional barriers to animal movement (Jakes et al., 2018; Kauffman et al., 2021). As a consequence, these kinds of landscape features should be considered in the elaboration of a connectivity plan. It is also expected that large-scale environmental conditions also drive the seasonality of movement behaviors of migrants and residents in this area (Martin et al., 2018). Variables influencing the altitudinal range shift as plant phenology (Aikens et al., 2020; Sigrist et al., 2022) should, thus, affect the utilization of predicted corridors or pinch points of connectivity. On a regional scale, the use of arable lands by red deer could also be influenced by the type of crop and their distance to cover, as was observed, for example, by Månsson et al. (2021), in landscapes with different mixtures of forest and arable lands in Sweden.
Finally, we plan to expand our work to other focal species with the goal of identifying habitat networks and corridors that promote the persistence of several species in a landscape (Wood et al., 2022). We will be able to propose functional connectivity maps for other species benefiting from both local expert knowledge and empirical studies (Parrott et al., 2019; Petsas et al., 2020), thanks to the established process of spatial conservation prioritization driven by the Canton of Geneva and the Greater Geneva agglomeration.
Data availability statement
The datasets presented in this article are not readily available because GPS raw data and metadata are not publicly available, but can be obtained from Eurodeer www.eurodeer.org once a contact and a registration procedure (Terms of use) is completed. Please contact CF at Y2xhdWRlLmZpc2NoZXJAaGVzZ2UuY2g= to request the data. The land cover data (GE21, 2022) are already published and publicly available from SITG at https://ge.ch/sitg/fiche/8185. Derived GIS layers are not yet provided because they are still under final review by the Canton of Geneva. These data will be archived and freely available on The Ecological Infrastructure Greater Geneva platform at https://yareta.unige.ch/home/detail/444c8e03-ff09-4726-a491-224fa39881cd. Requests to access the datasets should be directed to CF at Y2xhdWRlLmZpc2NoZXJAaGVzZ2UuY2g=, land cover data at https://ge.ch/sitg/fiche/8185, and derived GIS layers at https://yareta.unige.ch/home/detail/444c8e03-ff09-4726-a491-224fa39881cd.
Ethics statement
Ethical review and approval were not required for the animal study because the authorities of the cantonal administration “The Office Cantonal de l’Agriculture et de la Nature (OCAN)” were given authorizations.
Author contributions
LU, CF, NR, and AL conceived the ideas. LU led the redaction of the manuscript: all authors contributed to the redaction of the manuscript. CF collected red deer GPS data. LU carried out the data analysis and modeling. CF, NR, and AL supervized the analysis and modeling. All authors contributed to the article and approved the submitted version.
Funding
This work was financed by the Office Cantonal de l’Agriculture et de la Nature (OCAN) and the Federal Office for the Environment (FOEN) by the RPT3 grant. Open-access funding was provided by the University of Geneva.
Acknowledgments
LU would like to make the following acknowledgments. She thanks her family for their love; CF, AL, NR, Nicolas Wyler, and Benjamin Guinaudeau who supported her during the realization of this work; her colleagues Lucas Villard and Juan Antezana for their help in data analysis and programming; and all the experts who kindly responded to her survey.
Conflict of interest
The authors declare that the research was conducted in the absence of any commercial or financial relationships that could be construed as a potential conflict of interest.
Publisher’s note
All claims expressed in this article are solely those of the authors and do not necessarily represent those of their affiliated organizations, or those of the publisher, the editors, and the reviewers. Any product that may be evaluated in this article, or claim that may be made by its manufacturer, is not guaranteed or endorsed by the publisher.
Supplementary material
The Supplementary Material for this article can be found online at: https://www.frontiersin.org/articles/10.3389/fenvs.2023.1198168/full#supplementary-material
References
Adriaensen, F., Chardon, J. P., De Blust, G., Swinnen, E., Villalba, S., Gulinck, H., et al. (2003). The application of ‘least-cost’ modelling as a functional landscape model. Landsc. Urban Plan. 64, 233–247. doi:10.1016/S0169-2046(02)00242-6
Aikens, E. O., Mysterud, A., Merkle, J. A., Cagnacci, F., Rivrud, I. M., Hebblewhite, M., et al. (2020). Wave-like patterns of plant phenology determine ungulate movement tactics. Curr. Biol. 30, 3444–3449.e4. doi:10.1016/j.cub.2020.06.032
Allen, A. M., Månsson, J., Jarnemo, A., and Bunnefeld, N. (2014). The impacts of landscape structure on the winter movements and habitat selection of female red deer. Eur. J. Wildl. Res. 60, 411–421. doi:10.1007/s10344-014-0797-0
Anantharaman, R., Hall, K., Shah, V. B., and Edelman, A. (2020). Circuitscape in julia: High performance connectivity modelling to support conservation decisions. Proc. JuliaCon Conf. 1, 58. doi:10.21105/jcon.00058
Baguette, M., and Van Dyck, H. (2007). Landscape connectivity and animal behavior: Functional grain as a key determinant for dispersal. Landsc. Ecol. 22, 1117–1129. doi:10.1007/s10980-007-9108-4
Beier, P., Majka, D. R., and Spencer, W. D. (2008). Forks in the road: Choices in procedures for designing wildland linkages. Conserv. Biol. 22, 836–851. doi:10.1111/j.1523-1739.2008.00942.x
Berthoud, G., Lebeau, R. P., and Righetti, A. (2004). Réseau écologique national REN. Rapport final. Cahier de l’environnement 373. Office fédéral de l’environnement, des forêts et du paysage (OFEFP).
Betts, M. G., Fahrig, L., Hadley, A. S., Halstead, K. E., Bowman, J., Robinson, W. D., et al. (2014). A species-centered approach for uncovering generalities in organism responses to habitat loss and fragmentation. Ecography 37, 517–527. doi:10.1111/ecog.00740
Braaker, S., Moretti, M., Boesch, R., Ghazoul, J., Obrist, M. K., and Bontadina, F. (2014). Assessing habitat connectivity for ground-dwelling animals in an urban environment. Ecol. Appl. 24, 1583–1595. doi:10.1890/13-1088.1
Breitenmoser, U., Breitenmoser-Würsten, C., Capt, S., Molinari-Jobin, A., Molinari, P., and Zimmermann, F. (2007). Conservation of the lynx Lynx lynx in the Swiss Jura Mountains. Wildl. Biol. 13 (4), 340–355. doi:10.2981/0909-6396(2007)13[340:COTLLL]2.0.CO;2
Brodie, J. F., Giordano, A. J., Dickson, B., Hebblewhite, M., Bernard, H., Mohd-Azlan, J., et al. (2015). Evaluating multispecies landscape connectivity in a threatened tropical mammal community. Conserv. Biol. 29, 122–132. doi:10.1111/cobi.12337
Brodie, J. F., Paxton, M., Nagulendran, K., Balamurugan, G., Clements, G. R., Reynolds, G., et al. (2016). Connecting science, policy, and implementation for landscape-scale habitat connectivity: Corridor Science and Policy. Conserv. Biol. 30, 950–961. doi:10.1111/cobi.12667
Calenge, C., and Dufour, A. B. (2006). Eigenanalysis of selection ratios from animal radio-tracking data. Ecology 87, 2349–2355. doi:10.1890/0012-9658(2006)87[2349:EOSRFA]2.0.CO;2
Calenge, C. (2006). The package “adehabitat” for the R software: A tool for the analysis of space and habitat use by animals. Ecol. Model. 197, 516–519. doi:10.1016/j.ecolmodel.2006.03.017
Cook, C. N., Hockings, M., and Carter, R. B. (2010). Conservation in the dark? The information used to support management decisions. Front. Ecol. Environ. 8, 181–186. doi:10.1890/090020
Daigle, R. M., Metaxas, A., Balbar, A. C., McGowan, J., Treml, E. A., Kuempel, C. D., et al. (2020). Operationalizing ecological connectivity in spatial conservation planning with marxan connect. Methods Ecol. Evol. 11, 570–579. doi:10.1111/2041-210X.13349
Dickson, B. G., Albano, C. M., Anantharaman, R., Beier, P., Fargione, J., Graves, T. A., et al. (2019). Circuit-theory applications to connectivity science and conservation. Conserv. Biol. 33, 239–249. doi:10.1111/cobi.13230
Doswald, N., Zimmermann, F., and Breitenmoser, U. (2007). Testing expert groups for a habitat suitability model for the lynx lynx lynx in the Swiss alps. Wildl. Biol. 13, 430–446. doi:10.2981/0909-6396(2007)13[430:TEGFAH]2.0.CO;2
Drescher, M., and Edwards, R. C. (2019). A systematic review of transparency in the methods of expert knowledge use. J. Appl. Ecol. 56, 436–449. doi:10.1111/1365-2664.13275
ESRI (2019). Arcgis desktop: Release 10.8.1. Redlands, CA: Environmental systems research institute.
Fahrig, L. (2003). Effects of habitat fragmentation on biodiversity. Annu. Rev. Ecol. Evol. Syst. 34, 487–515. doi:10.1146/annurev.ecolsys.34.011802.132419
Fattebert, J., Baubet, E., Slotow, R., and Fischer, C. (2017). Landscape effects on wild boar home range size under contrasting harvest regimes in a human-dominated agro-ecosystem. Eur. J. Wildl. Res. 63, 32–39. doi:10.1007/s10344-017-1090-9
Federal Office for the Environment (2017). Action plan for the swiss biodiversity strategy. Switzerland: Confédération Suisse. Bern.
Federal Office of Statistics (2021). Statistique suisse de la superficie. Available at:https://www.bfs.admin.ch/bfs/fr/home/statistiques/espace-environnement/utilisation-couverture-sol.assetdetail.19964677.html (Accessed June 20, 2023).
Fischer, C., and Ranzoni, J. (2017). Evaluation de la fonctionnalité des corridors de déplacement du cerf dans le bassin genevois. Schweiz. Z. für Forstwes. 168, 299–304. doi:10.3188/szf.2017.0299
Foltête, J.-C., Vuidel, G., Savary, P., Clauzel, C., Sahraoui, Y., Girardet, X., et al. (2021). Graphab: An application for modeling and managing ecological habitat networks. Softw. Impacts 8, 100065. doi:10.1016/j.simpa.2021.100065
Gimenez, O., Gatti, S., Duchamp, C., Germain, E., Laurent, A., Zimmermann, F., et al. (2019). Spatial density estimates of Eurasian lynx (Lynx lynx) in the French Jura and Vosges Mountains. Ecol. Evol. 9 (20), 11707–11715. doi:10.1002/ece3.5668
Grafius, D. R., Corstanje, R., Siriwardena, G. M., Plummer, K. E., and Harris, J. A. (2017). A bird’s eye view: Using circuit theory to study urban landscape connectivity for birds. Landsc. Ecol. 32, 1771–1787. doi:10.1007/s10980-017-0548-1
Haddad, N. M., Brudvig, L. A., Clobert, J., Davies, K. F., Gonzalez, A., Holt, R. D., et al. (2015). Habitat fragmentation and its lasting impact on Earth’s ecosystems. Sci. Adv. 1, e1500052. doi:10.1126/sciadv.1500052
Hadley, A. S., and Betts, M. G. (2016). Refocusing habitat fragmentation research using lessons from the last decade. Curr. Landsc. Ecol. Rep. 1, 55–66. doi:10.1007/s40823-016-0007-8
Hartl, G. B., Zachos, F., and Nadlinger, K. (2003). Genetic diversity in European red deer (cervus elaphus l): Anthropogenic influences on natural populations. Comptes Rendus Biol. 326, 37–42. doi:10.1016/S1631-0691(03)00025-8
Holderegger, R., Schmidt, B. R., Grünig, C., Meier, R., Csencsics, D., Gassner, M., et al. (2020). Ready-to-use workflows for the implementation of genetic tools in conservation management. Conserv. Genet. Resour. 12, 691–700. doi:10.1007/s12686-020-01165-5
Holzgang, O., Pfister, H., Heynen, D., Blant, M., Righetti, A., Berthoud, G., et al. (2001). Les corridors faunistiques en Suisse. Cahier de l’environnement 326. Office fédéral de l’environnement, des forêts et du paysage (OFEFP), Société suisse de Biologie de la Faune (SSBF) and Station ornithologique suisse de Sempach.
Honeck, E., Moilanen, A., Guinaudeau, B., Wyler, N., Schlaepfer, M., Martin, P., et al. (2020a). Implementing green infrastructure for the spatial planning of peri-urban areas in Geneva, Switzerland. Sustainability 12, 1387. doi:10.3390/su12041387
Honeck, E., Sanguet, A., Schlaepfer, M. A., Wyler, N., and Lehmann, A. (2020b). Methods for identifying green infrastructure. SN Appl. Sci. 2, 1916. doi:10.1007/s42452-020-03575-4
Jaeger, J. A. G., Bertiller, R., Schwick, C., Müller, K., Steinmeier, C., Ewald, K. C., et al. (2008). Implementing landscape fragmentation as an indicator in the Swiss monitoring system of sustainable development (monet). J. Environ. Manag. 88, 737–751. doi:10.1016/j.jenvman.2007.03.043
Jaeger, J. A. G. (2012). L’impact des constructions routières sur la fragmentation du territoire en suisse (1885-2002): Quelles leçons retenir. Le. Nat. Can. 136, 83–88. doi:10.7202/1009112ar
Jakes, A. F., Jones, P. F., Paige, L. C., Seidler, R. G., and Huijser, M. P. (2018). A fence runs through it: A call for greater attention to the influence of fences on wildlife and ecosystems. Biol. Conserv. 227, 310–318. doi:10.1016/j.biocon.2018.09.026
Jarnemo, A. (2011). Male red deer (cervus elaphus) dispersal during the breeding season. J. Ethol. 29, 329–336. doi:10.1007/s10164-010-0262-9
Johnson, D. H. (1980). The comparison of usage and availability measurements for evaluating resource preference. Ecology 61, 65–71. doi:10.2307/1937156
Kareksela, S., Aapala, K., Alanen, A., Haapalehto, T., Kotiaho, J., Lehtomäki, J., et al. (2020). Combining spatial prioritization and expert knowledge facilitates effectiveness of large-scale mire protection process in Finland. Biol. Conserv. 241, 108324. doi:10.1016/j.biocon.2019.108324
Kauffman, M. J., Cagnacci, F., Chamaillé-Jammes, S., Hebblewhite, M., Hopcraft, J. G. C., Merkle, J. A., et al. (2021). Mapping out a future for ungulate migrations. Science 372, 566–569. doi:10.1126/science.abf0998
Keeley, A. T. H., Beier, P., and Gagnon, J. W. (2016). Estimating landscape resistance from habitat suitability: Effects of data source and nonlinearities. Landsc. Ecol. 31, 2151–2162. doi:10.1007/s10980-016-0387-5
Kool, J. T., Moilanen, A., and Treml, E. A. (2013). Population connectivity: Recent advances and new perspectives. Landsc. Ecol. 28, 165–185. doi:10.1007/s10980-012-9819-z
LaPoint, S., Gallery, P., Wikelski, M., and Kays, R. (2013). Animal behavior, cost-based corridor models, and real corridors. Landsc. Ecol. 28, 1615–1630. doi:10.1007/s10980-013-9910-0
Lehtomäki, J., and Moilanen, A. (2013). Methods and workflow for spatial conservation prioritization using zonation. Environ. Model. Softw. 47, 128–137. doi:10.1016/j.envsoft.2013.05.001
Manel, S., and Holderegger, R. (2013). Ten years of landscape genetics. Trends Ecol. Evol. 28, 614–621. doi:10.1016/j.tree.2013.05.012
Manly, B. (2002). “Resource selection by animals,” in Statistical design and analysis (Dordrecht: Springer).
Månsson, J., Nilsson, L., Felton, A. M., and Jarnemo, A. (2021). Habitat and crop selection by red deer in two different landscape types. Agric. Ecosyst. Environ. 318, 107483. doi:10.1016/j.agee.2021.107483
Martin, J., Tolon, V., Morellet, N., Santin-Janin, H., Licoppe, A., Fischer, C., et al. (2018). Common drivers of seasonal movements on the migration – residency behavior continuum in a large herbivore. Sci. Rep. 8, 7631. doi:10.1038/s41598-018-25777-y
Martin, T. G., Burgman, M. A., Fidler, F., Kuhnert, P. M., Low-Choy, S., Mcbride, M., et al. (2012). Eliciting expert knowledge in conservation science. Conserv. Biol. 26, 29–38. doi:10.1111/j.1523-1739.2011.01806.x
McClure, M. L., Hansen, A. J., and Inman, R. M. (2016). Connecting models to movements: Testing connectivity model predictions against empirical migration and dispersal data. Landsc. Ecol. 31, 1419–1432. doi:10.1007/s10980-016-0347-0
McRae, B. H., Dickson, B. G., Keitt, T. H., and Shah, V. B. (2008). Using circuit theory to model connectivity in ecology, evolution, and conservation. Ecology 89, 2712–2724. doi:10.1890/07-1861.1
Mimet, A., Clauzel, C., and Foltête, J.-C. (2016). Locating wildlife crossings for multispecies connectivity across linear infrastructures. Landsc. Ecol. 31, 1955–1973. doi:10.1007/s10980-016-0373-y
Mohr, C. O. (1947). Table of equivalent populations of north American small mammals. Am. Midl. Nat. 37, 223–249. doi:10.2307/2421652
Morisot, A., Chenesseau, D., Bombois Jérôme, G. P., Tolon, V., Fischer, C., and Said, S. (2016). Déplacements des populations de cerfs du massif jurassien: Influences climatiques et humaines. Faune Sauvage, 24–29. doi:10.3188/szf.2017.0299
Parrott, L., Kyle, C., Hayot-Sasson, V., Bouchard, C., and Cardille, J. A. (2019). Planning for ecological connectivity across scales of governance in a multifunctional regional landscape. Ecosyst. People 15, 204–213. doi:10.1080/26395916.2019.1649726
Petsas, P., Tsavdaridou, A. I., and Mazaris, A. D. (2020). A multispecies approach for assessing landscape connectivity in data-poor regions. Landsc. Ecol. 35, 561–576. doi:10.1007/s10980-020-00981-2
R Core Team (2022). R: A language and environment for statistical computing. Vienna, Austria: R Foundation for Statistical Computing.
Ray, N. (2005). Pathmatrix: A geographical information system tool to compute effective distances among samples. Mol. Ecol. Notes 5, 177–180. doi:10.1111/j.1471-8286.2004.00843.x
Rödder, D., Nekum, S., Cord, A. F., and Engler, J. O. (2016). Coupling satellite data with species distribution and connectivity models as a tool for environmental management and planning in matrix-sensitive species. Environ. Manag. 58, 130–143. doi:10.1007/s00267-016-0698-y
Ruckstuhl, K., and Neuhaus, P. (2006). Sexual segregation in vertebrates. Cambridge: Cambridge University Press.
Saura, S., and Rubio, L. (2010). A common currency for the different ways in which patches and links can contribute to habitat availability and connectivity in the landscape. Ecography 33, 523–537. doi:10.1111/j.1600-0587.2009.05760.x
Sigrist, B., Signer, C., Wellig, S. D., Ozgul, A., Filli, F., Jenny, H., et al. (2022). Green-up selection by red deer in heterogeneous, human-dominated landscapes of central Europe. Ecol. Evol. 12, e9048. doi:10.1002/ece3.9048
Silverman, B. W. (1986). Density estimation for Statistics and data analysis. London: Chapman and Hall.
Spear, S. F., Balkenhol, N., Fortin, M.-J., Mcrae, B. H., and Scribner, K. (2010). Use of resistance surfaces for landscape genetic studies: Considerations for parameterization and analysis. Mol. Ecol. 19, 3576–3591. doi:10.1111/j.1365-294X.2010.04657.x
Stopher, K. V., Nussey, D. H., Clutton-Brock, T. H., Guinness, F., Morris, A., and Pemberton, J. M. (2011). The red deer rut revisited: Female excursions but no evidence females move to mate with preferred males. Behav. Ecol. 22, 808–818. doi:10.1093/beheco/arr052
Taylor, P. D., Fahrig, L., Henein, K., and Merriam, G. (1993). Connectivity is a vital element of landscape structure. Oikos 68, 571. doi:10.2307/3544927
Tischendorf, L., and Fahrig, L. (2000). On the usage and measurement of landscape connectivity. Oikos 90, 7–19. doi:10.1034/j.1600-0706.2000.900102.x
Tscharntke, T., Tylianakis, J. M., Rand, T. A., Didham, R. K., Fahrig, L., Batáry, P., et al. (2012). Landscape moderation of biodiversity patterns and processes - eight hypotheses. Biol. Rev. 87, 661–685. doi:10.1111/j.1469-185X.2011.00216.x
Unnithan Kumar, S., Turnbull, J., Hartman Davies, O., Hartman Davies, O., Hodgetts, T., and Cushman, S. A. (2022). Moving beyond landscape resistance: Considerations for the future of connectivity modelling and conservation science. Landsc. Ecol. 37, 2465–2480. doi:10.1007/s10980-022-01504-x
Urban, D., and Keitt, T. (2001). Landscape connectivity: A graph-theoretic perspective. Ecology 82, 1205–1218. doi:10.1890/0012-9658(2001)082[1205:lcagtp]2.0.co;2
Urban, D. L., Minor, E. S., Treml, E. A., and Schick, R. S. (2009). Graph models of habitat mosaics. Ecol. Lett. 12, 260–273. doi:10.1111/j.1461-0248.2008.01271.x
Wood, S. L. R., Martins, K. T., Dumais-Lalonde, V., Tanguy, O., Maure, F., St-Denis, A., et al. (2022). Missing interactions: The current state of multispecies connectivity analysis. Front. Ecol. Evol. 10. doi:10.3389/fevo.2022.830822
Zachos, F. E., and Hartl, G. B. (2011). Phylogeography, population genetics and conservation of the European red deer cervus elaphus. Mammal. Rev. 41, 138–150. doi:10.1111/j.1365-2907.2010.00177.x
Keywords: Switzerland, green infrastructure, spatial conservation prioritization, functional connectivity, circuit theory, graph theory, red deer Cervus elaphus
Citation: Urbina L, Fischer C, Ray N and Lehmann A (2023) Modeling red deer functional connectivity at a regional scale in a human-dominated landscape. Front. Environ. Sci. 11:1198168. doi: 10.3389/fenvs.2023.1198168
Received: 31 March 2023; Accepted: 13 July 2023;
Published: 26 July 2023.
Edited by:
Ângela Cristina Lomba, Centro de Investigacao em Biodiversidade e Recursos Geneticos (CIBIO-InBIO), PortugalReviewed by:
Maarten Jan Van Strien, ETH Zürich, SwitzerlandAnders Jarnemo, Halmstad University, Sweden
Copyright © 2023 Urbina, Fischer, Ray and Lehmann. This is an open-access article distributed under the terms of the Creative Commons Attribution License (CC BY). The use, distribution or reproduction in other forums is permitted, provided the original author(s) and the copyright owner(s) are credited and that the original publication in this journal is cited, in accordance with accepted academic practice. No use, distribution or reproduction is permitted which does not comply with these terms.
*Correspondence: Loreto Urbina, bG9yZXRvLnVyYmluYUBoZXNnZS5jaA==