 Yizhong Ye1,2
 Qunshan Tao1,2*
- 1School of Hospital Economics and Management, Anhui University of Chinese Medicine, Hefei, China
- 2Key Laboratory of Data Science and Innovative Development of Chinese Medicine in Anhui Province Philosophy and Social, Hefei, China
China’s economy has grown rapidly in response to the adoption of a high-energy, high-emissions development model, which has led to varying degrees of air pollution; moreover, the corresponding health damage has become a major concern for the public. Studies of the interrelationships between the economy, air pollution, and health often use empirical methods such as regression analysis, to explore the impacts of economic growth and air pollution, human health or air pollution on human health in isolation, and they rarely explore the interactions between the economy, air pollution, and health in terms of efficiency (i.e., the maximum output per unit of input resources that can be produced). Thus, this study constructed a Dynamic Network SBM efficiency model that unifies the production of economic development, air pollution, and health into a single framework. The article reports the findings of a comprehensive study of economic development, air pollution, and health management data for 30 Chinese provinces from 2015 to 2020. The results show that: 1) the overall efficiency (0.693) of China’s two stages from economic production input to healthy output from 2015 to 2020 is low, and there is much room for improvement; 2) the efficiency of economic development (0.729) is higher than the efficiency of health production (0.657), indicating that the health production stage needs to be strengthened; 3) during the study period, China’s PM2.5, SO2, and NOx control efficiency was low, at 0.786, 0.710, and 0.718, respectively, indicating that more effective measures are needed to improve environmental efficiency; and 4) there are significant differences in economic, environmental, and health efficiency across regions. China’s developed eastern provinces are more efficient in terms of economic development, health production, and air pollution control. In contrast, the central and western provinces, which are relatively backward in their economic development, are less efficient. This means that each province should implement sound policies based on its own assessment to promote sustainable economic development while enhancing air pollution mitigation and health promotion.
1 Introduction
After China’s reform and opening up in 1978, its economy grew rapidly and became the world’s second-largest economy in 2010. Although China has experienced rapid economic development, this progress has mainly been at the expense of excessive energy consumption, which has caused many environmental pollution issues (Xiong and Xu, 2021). Especially, air pollution has become one of the most serious environmental problems in China, which has created inevitable health losses and huge economic costs (Liu and Dong, 2021a). As a result, this work aims to investigate how to ensure minimal air pollution while maximising economic and health benefits.
Studies of the relationship between air pollution and health have focused on environmental health epidemiology and environmental toxicology (Brunekreef and Holgate, 2002; Lee et al., 2014; Kelly and Fussell, 2015; Ghorani-Azam et al., 2016; Dhital and Rupakheti, 2019; Dominski et al., 2021). However, these studies did not construct empirical health economics models to explore the socioeconomic factors involved in environmental health problems. In addition, other scholars have begun to examine the intersections among economic development, air pollution, and public health (Wang, 2010; Drabo, 2011; Sueyoshi and Yuan, 2015; Li et al., 2016; Chen et al., 2019; Feng et al., 2019; Gong et al., 2019; Kubatko and Kubatko, 2019; Fu et al., 2020; Mujtaba and Shahzad, 2021; Hussain et al., 2022; Zhang et al., 2023). Still, research on the economy–environment connection is usually conducted separately from health studies, and few approaches have combined economy, the environment, and health and analyzed their relationship in depth. The few studies on economic-environmental health usually use empirical methods such as regression analysis, but these methods do not adequately consider the efficiency issues between resource inputs and output. Therefore, it is necessary to adopt efficiency analysis methods to better reveal the efficiency relationships between the economy, environment, and health, consequently providing a more reliable basis for achieving sustainable development.
Based on the above considerations, this paper constructs a Dynamic Network SBM (DNSBM) efficiency model that unifies economic development, air pollution, and health into a single framework. It comprehensively evaluates the efficiency of economic development, air pollution control, and health production in 30 Chinese provinces from 2015 to 2020, which provides a policy rationale for balancing the relationship between economic growth, air pollution, and health promotion.
2 Literature review
Consulting the relevant literature, we found that most scholarly studies of economic development, air pollution, and human health are conducted from one of four angles.
2.1 Economic development and air pollution
Economic activity closely correlates with air pollution, particularly in developing nations. In 1955, Kuznets put forth the Environmental Kuznets Curve (EKC) theory, which states that it is possible that there exists an inverted U-shaped relationship between air pollution and economic growth. At the start of economic development, environmental quality declines continuously as per capita income rises, but once income reaches a tipping point, increased revenues promote environmental improvement (Kuznets, 1955). Based on this, most scholars in China and abroad have experimentally tested the EKC hypothesis to investigate the link between economic growth and environmental deterioration. Omri et al. (2015) indicated a bidirectional causal relationship between carbon emissions and economic development and identified the existence of an EKC for carbon emissions. Hanif (2018) confirmed the EKC theory for low- and middle-income sub-Saharan African countries. Halliru et al. (2020) reviewed the EKC hypothesis for ECOWAS. In China, researchers have primarily studied the inverted U-shaped curve and the link between economic growth and certain pollutants (SO2, NOx, wastewater emissions) and greenhouse gases (CO2; Liu et al., 2015; Kang et al., 2016; Wang et al., 2016; Wang et al., 2017; Diao et al., 2018).
Meanwhile, environmental quality has an influence on economic development, in addition to economic development having an impact on environmental quality. For example, Khoshnevis, Yazdi, and Khanalizadeh (2017) demonstrated that air pollution adversely affects labor productivity and reduces industrial production and output, thus affecting economic growth. In addition, studies have fully confirmed that technological innovation in the process of economic development is a force that cannot be ignored in mitigating environmental pollution. Antweiler et al. (2001) point out that economic growth brought about by capital accumulation increases environmental pollution, while economic growth achieved by technological progress reduces environmental pollution. Erdoğan (2019) offers a similar idea: that economic growth without technological innovation may lead to an increase in national carbon emissions. Fernández Fernández et al. (2018) further emphasized technological innovation as a driver of sustainable economic development that allows economic growth to be reconciled with reduced environmental degradation. Similarly, Zhao et al. (2021) argue that technological innovation indirectly curbs CO2 emissions by regulating the relationship between financial risk and CO2 emissions. It is worth noting that innovation can also be influenced by economic factors. Zakaria and Bibi (2019) emphasized that financial growth can help increase the level of technological innovation and improve the efficiency of energy use, thereby improving environmental quality. Finally, Zhou and Du (2021) confirmed that the development of green finance under strict environmental regulatory policies acts as an incentive for technological innovation.
2.2 Economic development and human health
Many studies have proven a clear correlation between economic growth and improved human health. Preston (1985) determined that the correlation between per capita income and longevity is cross-sectional; he showed that increases in national income led to significant increases in life expectancy in developing countries. Asiedu et al. (2015) noted that increases in per capita income improved health outcomes, and the effect was stronger at higher income levels. Well (2007) confirmed that economic growth could improve health outcomes by boosting a society’s standard of living, modifying the public health environment, or promoting medical technology improvements. Using data from 1991 to 2015, Bul and Moracha (2020) demonstrated that economic growth can significantly improve health in sub-Saharan Africa. Akintunde et al. (2019) analyzed the socioeconomic determinants of health in Nigeria, the largest economy in West Africa, and found that shocks to per capita income had a positive effect on life expectancy. Cole (2019) explored the influence of economic growth on health using data from 134 developing nations between 1970 and 2015, and found that economic growth effectively improves health outcomes. Better health, in turn, enhances the accumulation of human capital, labor productivity, and, as a result, economic outcomes (Mayer, 2001; Alderman and Behrman, 2006; Akram et al., 2008; Mary, 2018).
2.3 Air pollution and human health
Air pollution has long been studied and shown to threaten human health severely. Dominici et al. (2002) showed that air pollution significantly increased mortality among the population. In particular, Anderson (2020) explored the relationship between the duration of pollution exposure and mortality in different age groups. He found that when the time of pollution exposure doubled among people over the age of 75 years, their mortality increased by 3.6%–6.8%. Brook et al. (2010) further demonstrated that the risk of non-accidental mortality rises with chronic PM2.5 exposure. At the same time, maternity and infants are more vulnerable to air pollution compared to other age groups (Hackley et al., 2007; Thornburg et al., 2022; Wang et al., 2023). Owili et al. (2017) made a similar observation regarding the significant influence of PM2.5 on maternal mortality. Emetere and Oladimeji (2022) further demonstrated that in Nigeria that maternal deaths are mainly caused by air pollution. Burnett et al. (2018) confirmed that the degree of harm to infant survival from air pollution may vary at different levels. Other studies have concluded that air pollution may be linked to other diseases and symptoms; for example, Cao et al. (2011) found that air pollution levels were significantly correlated with cardiopulmonary disease and lung cancer mortality. Chen et al. (2012) discovered that there was a 0.75% and 0.83% increase in overall cardiovascular and respiratory mortality for every 10 g/m3 rise in the 2-day moving average of SO2. Vlaanderen et al. (2017) discovered that prehypertension was linked to brief airborne pollution exposure. Finally, considering the severe impact of air pollution on public health, growing public attitudes toward the environment have prompted governments to consider whether they are willing to pay for air quality improvements (Yu et al., 2015).
2.4 Economic development, air pollution, and human health
In recent years, some researchers have begun investigating the intersections among economic development, air pollution, and human health. For instance, based on the correlations among personal income, air pollution, and life expectancy, Pope et al. (2015) proposed that clean air should be considered an “economic benefit” to national health. Siddique and Kiani (2020) discovered that air pollution reduces life expectancy and increases infant mortality in middle-income countries using panel data from 1990 to 2016. This shows that low- and middle-income countries are more vulnerable to the hazards of air pollution than are middle- and high-income countries. Wang et al. (2022) used panel data for 2012 to 2016 and multivariate ordered logit models to show that increasing economic levels make public health more vulnerable to air pollution, and that economic growth is becoming less effective at minimizing the adverse effects of air pollution on public health. Katrakilidis et al. (2016) explored panel data from 1960 to 2012 using Kuznets-type models and verified that economic development, environmental quality, and public health are mutually influential and interrelated. Urhie et al. (2020) employed data from Nigeria between 1980 and 2017 and a moderated mediation model to demonstrate that economic growth affects public health through air pollution.
Although there is a growing corpus of literature on economic development, air pollution, and human health, most of these studies have concentrated on the link between two variables, rather than all three. Moreover, the dynamic research on these three variables from an efficiency standpoint needs to be enhanced. The few studies examining the links among the economy, air pollution, and health have used empirical methods, such as regression analysis, and the analytic results do not adequately account for the decision unit’s internal structure and the dynamic impacts between periods. To address the gap in this research, this paper constructs a DNSBM to comprehensively assess the efficiency of economic development, health production, and air pollution control within the same framework, and proposes improvement strategies.
3 Materials and methods
3.1 DNSBM model introduction
Two major methodological difficulties emerge for the simultaneous assessment of economic, environmental and health efficiency. The first is the need for a method that can integrate the interrelationship between economic development, environmental protection and health promotion into a unified framework. The second difficulty is that the method must be able to analyse and manage any undesirable outputs that occur in different phases. Several previous studies have attempted to address these difficulties.
First of all, to solve the problem of efficiency assessment, Charnes et al. (1978) developed the first DEA model (CCR), which has been widely used. It is a nonparametric method that constructs optimal production bounds for a decision unit by solving a linear programming problem for all decision units. In so doing, the production efficiency of each decision unit is obtained by comparing the distance from each decision unit to the optimal production boundary.
Second, one major drawback of the DEA model is that it cannot handle the presence of undesirable outputs. Consequently, researchers have developed expanded DEA models to convert inputs into desirable and undesirable outputs for superior efficiency assessment (Zhou et al., 2006; Zhou et al., 2007). In these models, economic achievements can be measured by reducing inputs or increasing desirable outputs, and reductions in environmental pollution can be reflected by reducing undesirable outputs. Previous studies using these DEA models have successfully integrated economic growth and environmental protection into a unified framework but were unable to include analyses of the internal structure of the production system and generally neglected health promotion.
Third, Network Data Envelopment Analysis (NDEA), which was proposed by Färe et al. (2010), has achieved better results in capturing the internal structure of production systems. Specifically, NDEA model state that the production process is made up of many sub-production technologies, referred to as sub-decision units (Sub-DMU). These production techniques are used to discuss the effects of inputs and outputs on the production process, and the “black box” is eventually opened by traditional DEA or SBM models to find the optimal solution. Following in the footsteps of Färe et al. (2010), Tone and Tsutsui (2009) further proposed a weighted slack-based measures NDEA model. In other words, the NDEA model is analyzed using the connection between the various departments of the decision-making unit. To find the best solution using the SBM model, each department is treated as a Sub-DMU. The NDEA model corrects the traditional DEA’s failure to analyze the efficiency of each phase, but does not take intertemporal continuation into account. The activity’s effect is insufficient for determining long-term efficiency. Thus, to simultaneously assess the efficiency of various phases and periods, Färe et al. (2007) used the carryover to put connected variables into a dynamic model.
Finally, Based on previous results, Tone and Tsutsui (2014) proposed a weighted slack-based measures (Dynamic Network SBM) DEA model that considers each department of a decision unit as a sub-decision unit and each carryover activity as a link, as the basis for dynamic DEA model analysis; they then used the SBM model to find the optimal solution. Therefore, the Dynamic Network SBM (DNSBM) model is an appropriate approach for economic, environmental and health efficiency assessments owing to the model’s ability to integrate the three interrelated phases of economic development, environmental protection and health promotion into a unified framework.
3.2 DNSBM model setting
First, the DNSBM model that we use is a method for evaluating relative efficiency. Then, we deal with N
3.2.1 Inputs and outputs
The division k input
3.2.2 Links
The link between
3.2.3 Carry-overs
The carryover of
3.2.4 Objective function
The overall efficiency is evaluated using the following program:
In Formula (1),
The constraints are as follows:
where
3.2.5 Term (period) and divisional efficiencies
The term (period) efficiency is defined by:
In Formula (3),
Divisional efficiency is defined by:
In Formula (4),
Term (period)-divisional efficiency is defined by:
In Formula (5),
Furthermore, we used Hu’s (Hu and Wang, 2006) approach to assess the undesirable output efficiency:
In the above equations, i represents area and t represents time. When the target air pollutant input is equal to the actual input level, air pollutant control efficiency is equal to 1, indicating overall high efficiency; on the other hand, when the target air pollutant input is lower than the actual input level, air pollutant control efficiency is lower than 1, indicating overall inefficiency.
3.3 Data and variables
3.3.1 Data source
This study evaluates 30 provinces in China (including autonomous regions and municipalities directly under the central government), excluding Hong Kong, Macao, Tibet, and Taiwan. These are omitted because the majority of the data is missing. We divide the provinces into regions based on geographical differences: eastern, central, and western (Figure 1). The eastern region includes Beijing, Tianjin, Hebei, Shanghai, Hainan, and other provinces; the central area is composed of Shanxi, Jilin, Heilongjiang, Anhui, Jiangxi, Henan, and other provinces; and the western area is made up of Inner Mongolia, Chongqing, Guangxi, and other provinces. In addition, the “China Population and Employment Statistical Yearbook,” the “China Health and Health Yearbook,” and the “China Statistical Yearbook” provide data on Chinese economic and social development from 2015 to 2020. The “China Environmental Protection Bureau Annual Report” and the “China Environmental Statistics Yearbook” provide data on Chinese air pollutants.
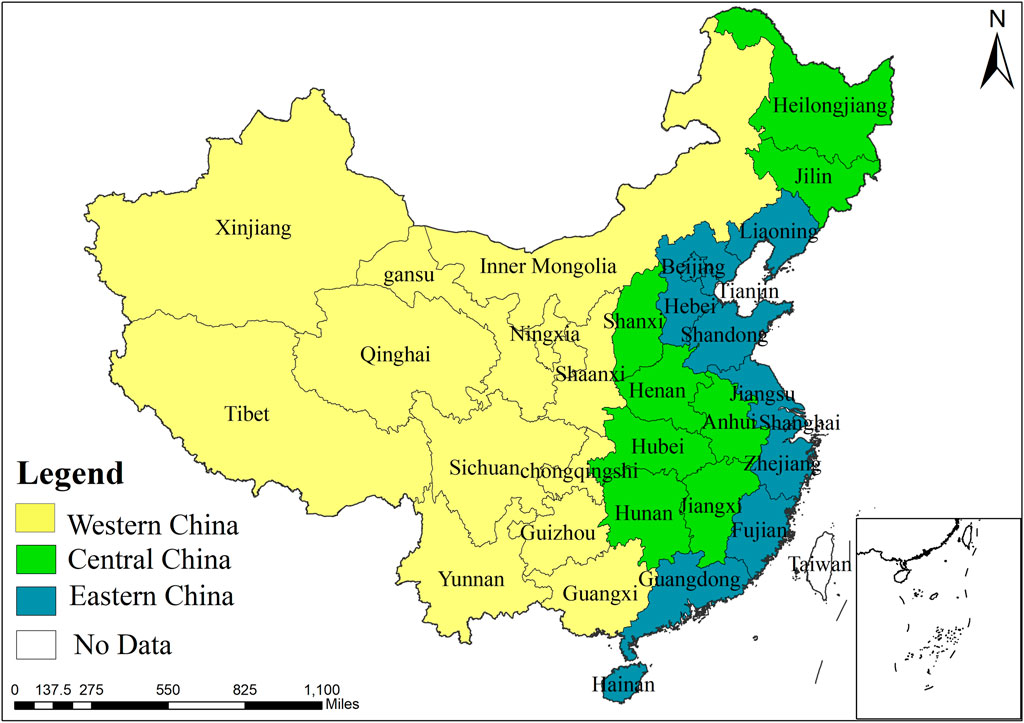
FIGURE 1. Distribution map of western, central, and eastern regions in China.
3.3.2 Variables selection
Economic development stage variables:
Regarding input indicators, with reference to previous studies (Li et al., 2019a; Li et al., 2019b; He et al., 2020; Li et al., 2020), we chose to use labor and energy consumption as input indicators. However, this paper cannot include fixed assets as input indicators due to limitations in data availability. Regarding output indicators, we selected the Gross Domestic Product (GDP) as the output indicator (Sueyoshi et al., 2021).
Link economic development stage and healthy production stage variables:
The links PM2.5, SO2, and NOx are from (Zhang et al., 2018a; Lin et al., 2021). The carry-over variable for multiple periods is government health expenditures, referring to (Zhang et al., 2022).
Health production stage variables:
Regarding input indicators, this paper restricts health inputs to those that act directly on health (i.e., inputs in healthcare). In line with the relevant literature (Kawaguchi et al., 2014; Flokou et al., 2017; Top et al., 2020), we selected the number of health technicians per 1,000 population and the number of beds per 1,000 population as input indicators. Regarding output indicators, it is clear from the literature (Evans et al., 2000; Afonso and Aubyn, 2005; Spinks and Hollingsworth, 2009; Rajaratnam et al., 2010; Rutherford et al., 2010) that the main output indicators of population health status are: average life expectancy, disability-adjusted life expectancy, maternal mortality, and infant mortality, among others. Due to the lag in the release of Chinese health statistics, there are many gaps in current data on average life expectancy and disability-adjusted life expectancy, which do not reflect the sustained level of healthy production. Thus, this paper selects the maternal mortality rate and perinatal mortality rate as output indicators. However, since the levels of maternal mortality and perinatal mortality do not represent whether the trend of health output efficiency is positive or not, this indicator of health output is in inverse form (i.e., a higher value of the indicator represents a lower level of health output; Hadad et al., 2013). Consequently, we borrowed from (Sayem et al., 2019) to take the inverse of the indicator and transform it into maternal survival rate and perinatal survival rate.
Based on the above analysis, Figure 2 depicts the framework of the DNSBM model’s intertemporal efficiency measures and variables.
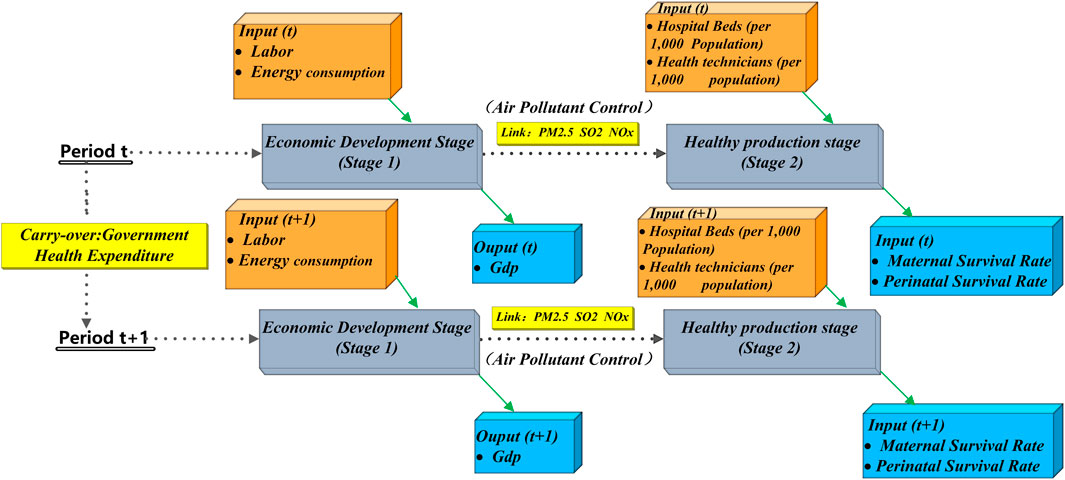
FIGURE 2. Dynamic and network SBM (DNSBM) model.
4 Empirical analysis
4.1 Statistical analysis of relevant variables
Figure 3 shows the statistical analysis of the related variables. Regarding indicators of economic development, labor force input grew significantly from 2015 to 2020; therefore, the 6-year trend is somewhat increasing. Further, average energy consumption did not rise dramatically, and the highest and lowest levels of energy consumption did not vary significantly. The highest GDP has steadily increased since 2015: the highest value climbed by 379.48 billion yuan from 2015 to 2020, while the lowest value increased modestly, from 230.332 billion yuan in 2015 to 262.48 billion yuan in 2020. However, the overall trend is still increasing slowly, from 241.7 billion yuan in 2015 to 300.6 billion yuan in 2020. This demonstrates that China’s production capacity is improving, and the provinces’ economic strength is gradually increasing.
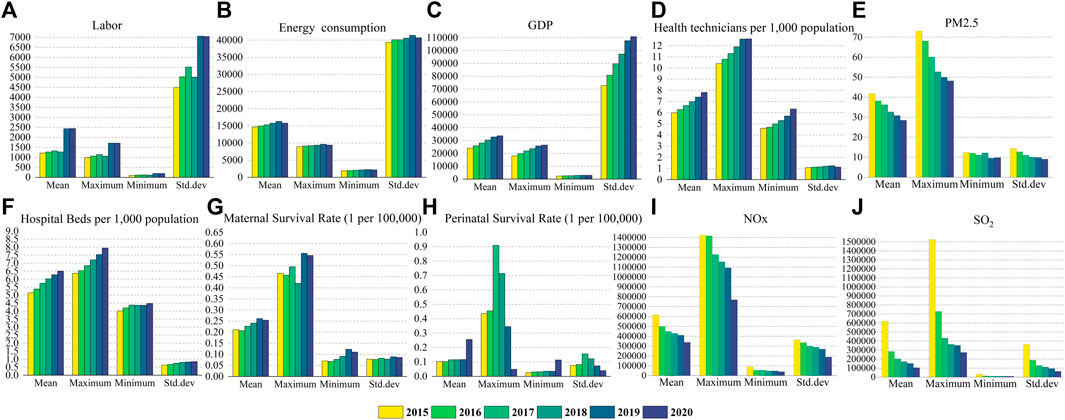
FIGURE 3. Statistical description of variables from 2015 to 2020. (A) Labor, (B) Energy consumption, (C) GDP, (D) Health technicians per 1,000 population, (E) PM2.5, (F) Hospital Beds per 1,000 population, (G) Maternal Survival Rate (1 per 100,000), (H) Perinatal Survival Rate (1 per 100,000), (I) NOx, (J) SO2.
Regarding indicators for health production, the average, highest, and lowest values of health technicians per 1,000 population and beds per 1,000 population exhibit consistent upward trends and significant overall increases. There is a fluctuating upward trend in the average perinatal survival rate, but the maximum value in 2018 was only 0.42, much lower than the other years, and it returned to 0.55 in 2020. The mean maternal survival rate (per 100,000 pregnancies) increased slightly, from 0.211 in 2015 to 0.254 in 2020; the maximum value decreased from 0.465 in 2015 to 0.495 in 2017, and then to 0.05 in 2020. This suggests that, while China’s investment in health resources has increased year after year, it has yet to maximize health outcomes.
Regarding indicators for air pollutants, the average value of PM2.5 concentration decreased from 41.81 ug/m3 in 2015 to 28.53 ug/m3 in 2020. The average value of SO2 emissions decreased from 619,527 tons in 2015 to 105,884 tons in 2020. NOx emissions decreased from 615,250 tons in 2015 to 33,888 tons in 2020. The maximum values of PM2.5 concentration, SO2 emissions, and NOx emissions also show a decreasing trend. It is noteworthy that the difference between the maximum and minimum values of SO2 emissions is the most significant of the pollutants. The above analysis shows that, in recent years, the Chinese government has been emphasizing the importance of air pollution control and investing a tremendous amount of funds in energy conservation and emission reduction, thus effectively mitigating the public health hazards of air quality deterioration.
4.2 Empirical results analysis
4.2.1 Analysis of economic development efficiency
We estimated the economic development efficiency of 30 provinces from 2015 to 2020 using the DNSBM model, including labor and energy consumption as input indicators and GDP as an output indicator. The results (Table 1; Figure 4A) show that Beijing, Shanghai, and Jiangsu had the highest average efficiency of economic development; provinces such as Tianjin, Zhejiang, and Fujian had an average efficiency of economic development of around 0.9, which was significantly higher than that of other provinces. Provinces such as Ningxia, Qinghai, Anhui, and Hubei had an economic development efficiency of 0.4–0.8. Xinjiang had the lowest average economic development efficiency of 0.34, followed by Gansu at 0.391, showing that the region requires further improvement.
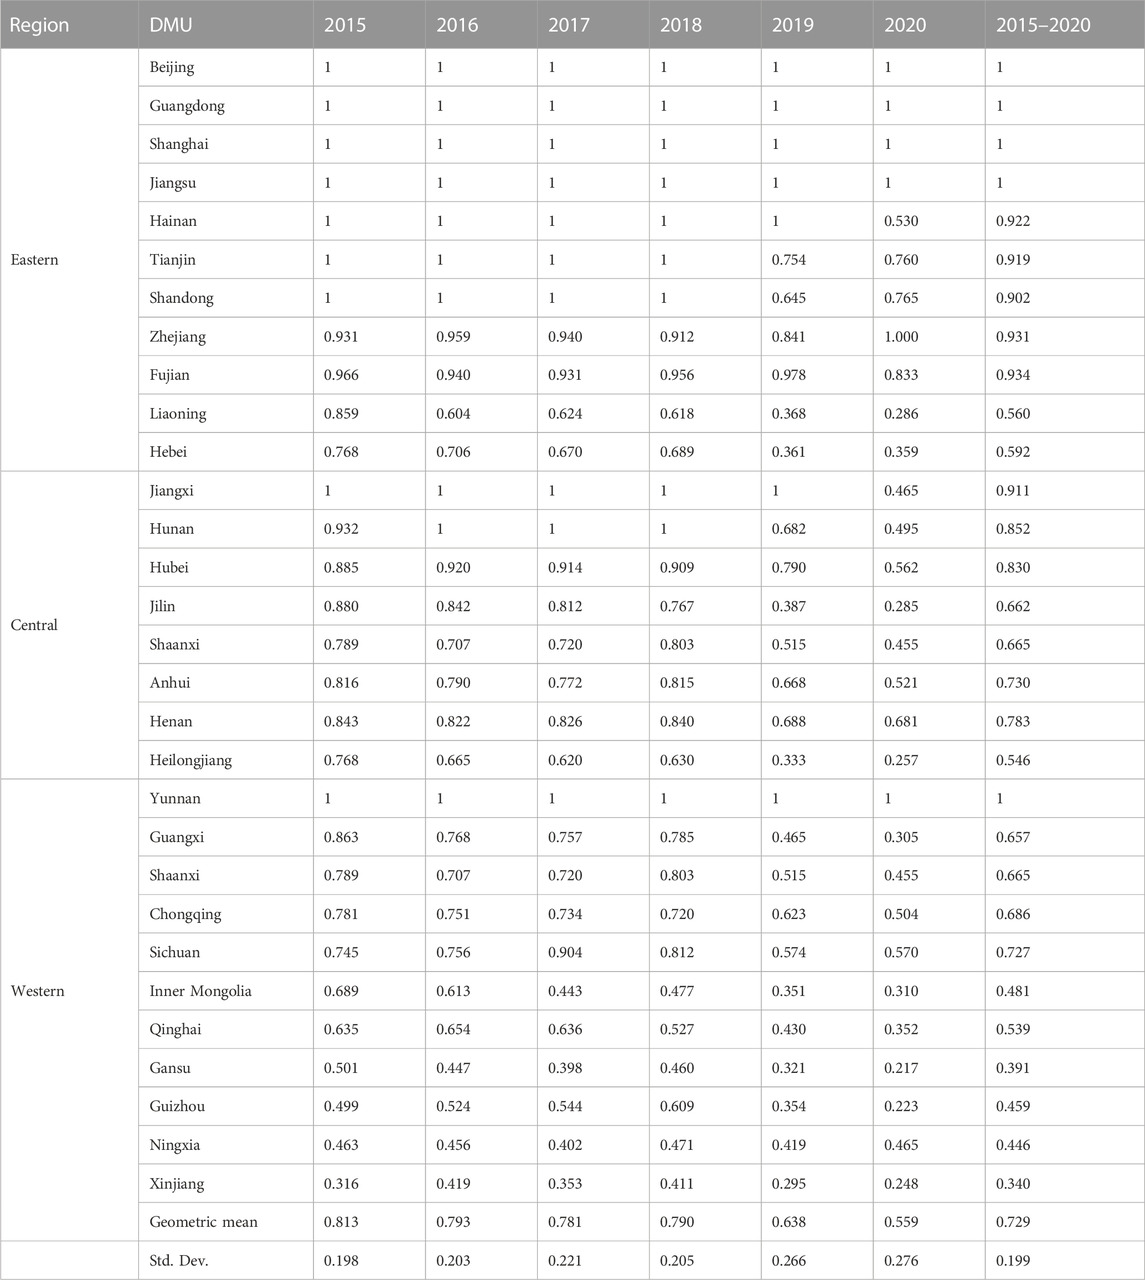
TABLE 1. Economic development efficiency, by province and region, 2015–2020.
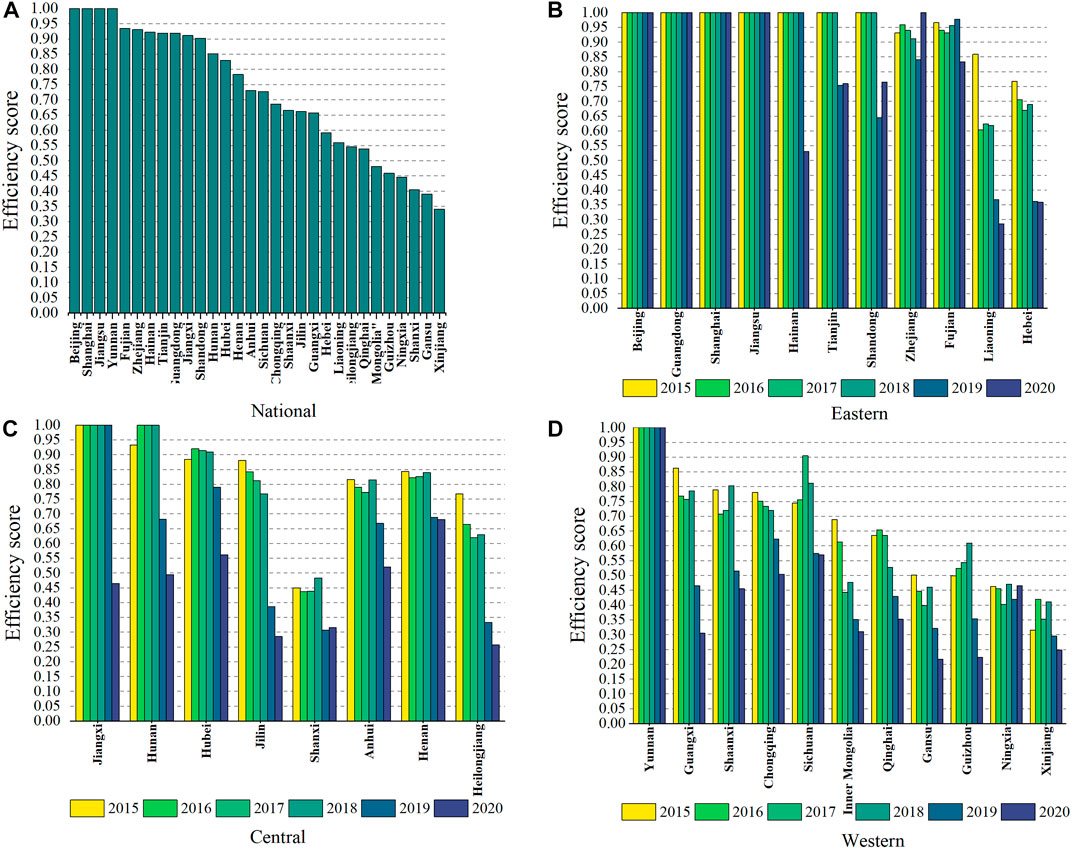
FIGURE 4. Economic development efficiency by province and region from 2015 to 2020. (A) Average economic development efficiency (geometric mean) in 30 provinces of China from 2015 to 2020. (B) Economic development efficiency in 11 provinces of the eastern region from 2015 to 2020. (C) Economic development efficiency in 8 provinces of the central region from 2015 to 2020. (D) Economic development efficiency in 11 provinces of the western region from 2015 to 2020.
There are also important regional differences. In the east (Figure 4B), the efficiency of economic development in Beijing, Shanghai, Jiangsu, and Guangdong was always equal to 1, suggesting that economic resources in these provinces are adequately employed. Hainan’s efficiency was equal to 1 in all previous periods, but declined significantly to around 0.5 in 2020, showing that the high efficiency of economic resource usage in the first 5 years did not continue. Hebei’s trend of changing economic development efficiency is similar to Liaoning’s, where efficiency has declined for 6 years, with Liaoning reaching a low of 0.286 in 2020. Tianjin’s and Shandong’s economic development efficiency values were equal to 1 in 2015–2018 but dropped to around 0.7 in 2019–2020. In the central region (Figure 4C), Jiangxi had the highest economic development efficiency, with a stable efficiency value of 1 in 2015–2019, but it dropped sharply to about 0.4 in 2020. Hunan had the greatest swing, with an economic development efficiency of 1 in 2016–2018 that fell to 0.495 in 2020. Jilin’s and Heilongjiang’s economic development efficiency values steadily declined over the last 6 years and are projected to decrease to around 0.25 by 2020. In the western region (Figure 4D), during the study period, the economic development efficiency of Yunnan reached 1. Except for Guangxi, Chongqing, Sichuan, and Shaanxi, most remaining provinces were below 0.6 in 2015–2020. For example, Xinjiang was below 0.4 in four out of 6 years studied. Gansu’s efficiency was below 0.4 in three of the last 6 years, and it fell to a minimum of 0.217 in 2020.
4.2.2 Analysis of healthy production efficiency
We estimated the health production efficiency of 30 provinces from 2015 to 2020 by applying the DNSBM model, using health technicians per 1,000 population and beds per 1,000 population as input indicators and maternal survival rate and perinatal survival rate as output indicators. The study results (Table 2; Figure 5A) show that only Beijing, Shanghai, Guangdong, and Jiangxi had an average efficiency of 1 in health production. This demonstrates that the healthcare services provided in these places are of outstanding quality and that the health production scale effect may be fulfilled. In contrast, health production efficiency in other provinces is generally poor; in different years, some provinces were severely inefficient, falling below 0.3. This indicates the region’s failure to integrate economic development with healthy production and the need for significant improvements.
TABLE 2. Healthy production efficiency, by province and region, 2015–2020.
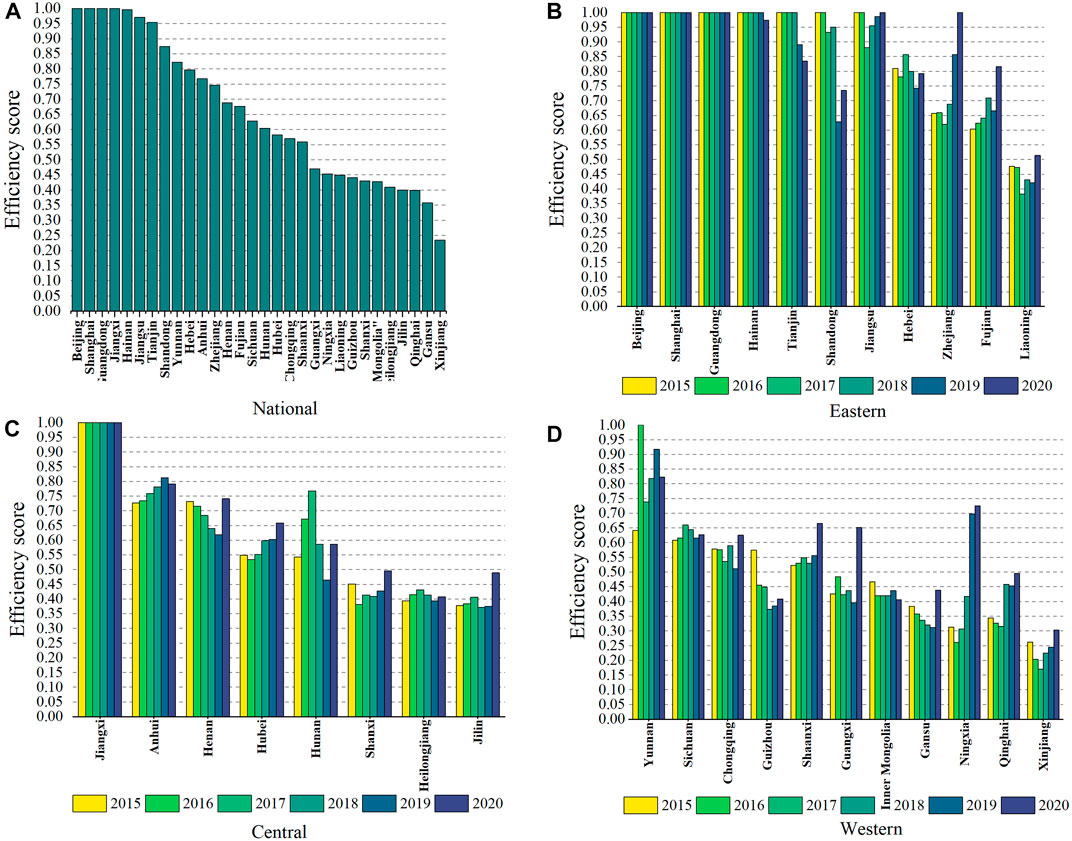
FIGURE 5. Healthy production efficiency by province and region from 2015 to 2020. (A) Average healthy production efficiency (geometric mean) in 30 provinces of China from 2015 to 2020. (B) Healthy production efficiency in 11 provinces of the eastern region from 2015 to 2020. (C) Healthy production efficiency in 8 provinces of the central region from 2015 to 2020. (D) Healthy production efficiency in 11 provinces of the western region from 2015 to 2020.
There are also important regional differences. In the eastern region (Figure 5B), health production efficiency was generally higher in the east than in the midwest. The fact that some provinces’ health production efficiency was comparable to or even lower than that of the midwest should be emphasized. For example, Liaoning’s health production efficiency has been consistent, at roughly 0.4 during the last 6 years. The health production in Hainan and Tianjin remained equal to 1 in the early period, but exhibited a slight fall in 2019–2020. Zhejiang is the most volatile province, with healthy production efficiency remaining around 0.6 in 2015–2016 but rising to 1 in 2020. In the central region (Figure 5C), Jiangxi has the most efficient health production. Shanxi, Heilongjiang, and Jilin have low health production efficiency, which remained between 0.4 and 0.5 for the past 6 years. In Henan, health production efficiency decreased over the first 5 years but peaked at 0.741 in 2020. In the western region (Figure 5D), Yunnan had the highest health production efficiency, reaching over 0.6; Xinjiang had the lowest value of 0.235. The efficiency of the remaining provinces, such as Inner Mongolia, Gansu, and Qinghai, was below 0.4. Ningxia was the most volatile, with healthy production efficiency falling below 0.4 in 2015–2018, but reaching a peak of around 0.7 in 2019–2020.
4.2.3 Analysis of overall efficiency
We additionally estimated the overall efficiency of the 30 provinces for the period 2015–2020 using the DNSBM model. Table 3 and Figure 6 display the calculated outcomes.
TABLE 3. Overall efficiency, by province and region, 2015–2020.
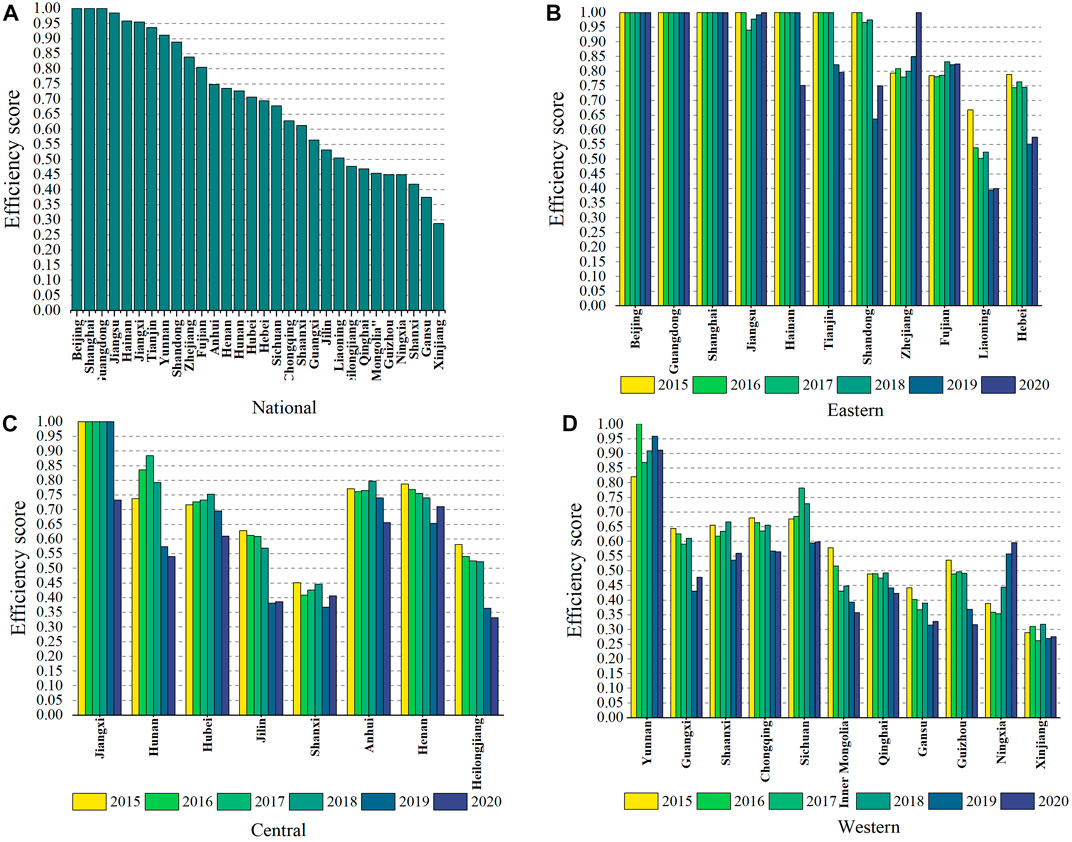
FIGURE 6. Overall efficiency by province and region from 2015 to 2020. (A) Average overall efficiency (geometric mean) in 30 provinces of China from 2015 to 2020. (B) Overall efficiency in 11 provinces of the eastern region from 2015 to 2020. (C) Overall efficiency in 8 provinces of the central region from 2015 to 2020. (D) Overall efficiency in 11 provinces of the western region from 2015 to 2020.
The findings reveal significant variation in the overall efficiency of the provinces. For example, the last 6 years have seen overall efficiency equal to 1 in Beijing, Shanghai, and Guangdong; these provinces have the highest resource utilization efficiency in the study. Zhejiang’s overall efficiency was less than 1 in 2015–2019 but rose to 1 in 2020; Jiangxi’s and Hainan’s overall efficiency values were 1 in 2015–2019 but fell to around 0.74 in 2020. Tianjin, Jiangsu, Yunnan, and Shandong performed well in terms of overall efficiency among the inefficient provinces; with the highest efficiency of less than 0.32 during the past 6 years, Xinjiang has the lowest performance. The efficiency of Liaoning, Jilin, and Guangxi was between 0.5 and 0.7, while that of Shanxi, Heilongjiang, Inner Mongolia, Guizhou, Qinghai, and Ningxia was around 0.4. As a result, these provinces must focus on overall efficiency improvement.
Over time, different trends in overall efficiency emerged among the provinces. For example, the overall efficiency of four provinces—Zhejiang, Fujian, Yunnan, and Ningxia—consistently climbed. Among them, Zhejiang experienced the largest increase, from 0.794 in 2015 to 1 in 2020, followed by Ningxia, from 0.388 in 2015 to 0.595 in 2020. Yet, the overall efficiency of the remaining 26 provinces decreased. Among them, Jiangxi and Liaoning had the largest decline, from 1 to 0.668, respectively, in 2015 to 0.732 and 0.4 in 2020. According to these results, we discovered that there are more provinces with falling efficiency values than with growing efficiency values. This demonstrates that most provinces must perform better in terms of economic development and health production.
4.2.4 Comparative analysis of overall efficiency and two-stage efficiency
As shown in Figure 7A, economic development efficiency is the most crucial component of China’s total efficiency performance, followed by health production efficiency. Figure 7B displays some trends in the data. Over the period 2015–2020, the decline in the efficiency of economic development led to a drop in overall efficiency, while the rise in the efficiency of health production was the main contributor to mitigating the decline in overall efficiency. Specifically, economic development efficiency exhibited negative growth in all years except 2017–2018. In contrast, health productivity efficiency showed positive growth in all years except 2016–2017 and 2018–2019, which showed negative growth.

FIGURE 7. The performance of efficiency in China during the period of 2015–2020. (A) The performance of Overall Efficiency (OE), Economic Development Efficiency (EDE), and Healthy Production Efficiency (HPE) in China during the period of 2015–2020. (B) The performance fluctuation of Economic Development Efficiency (EDE), and Healthy Production Efficiency (HPE) in China during the period of 2015–2010.
The Kruskal–Wallis test was used to analyze the efficiency differences across the eastern, central, and western regions, and the p-values were compared with the confidence level,
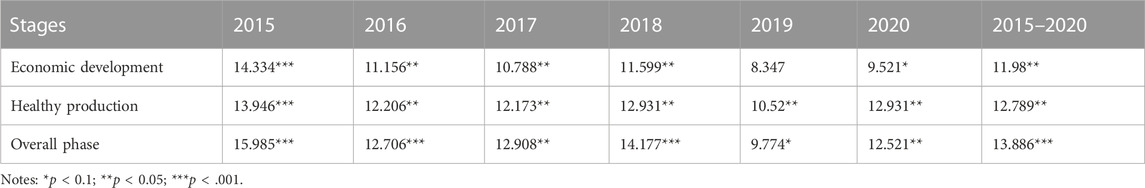
TABLE 4. Kruskal–Wallis test of all-stage efficiencies for the eastern, central, and western regions, 2015–2020.
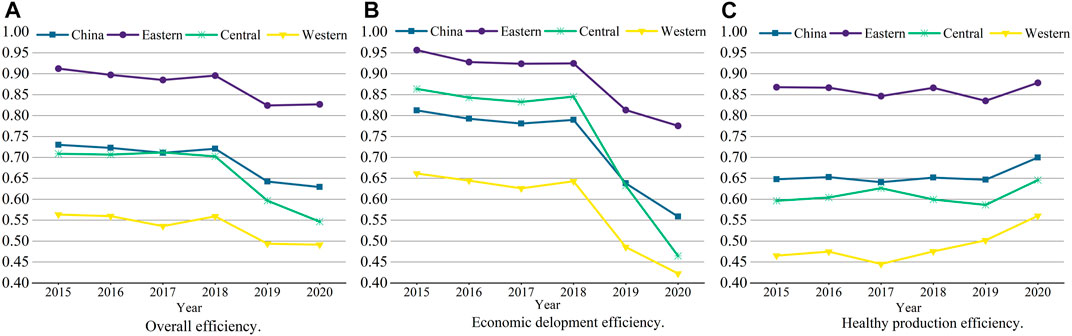
FIGURE 8. Comparison of different stage efficiency in the three regions. (A) Comparison of overall efficiency in China and three regions from 2015 to 2020. (B) Comparison of economic development efficiency in China and the three regions from 2015 to 2020. (C) Comparison of healthy production efficiency in China and the three regions from 2015 to 2020.
4.2.5 Analysis of air pollution control efficiency
This study also evaluated the air pollution control capacity of 30 Chinese provinces using the DNSBM model for 2015–2020. The results reveal that China’s average PM2.5, SO2, and NOx control efficiency are 0.786, 0.710, and 0.718, respectively; these are relatively low and have considerable room for improvement. Specifically, regarding PM2.5 (Figure 9A), 13 provinces have a governance efficiency higher than 0.9, accounting for 43.3% of the total. The provinces with the lowest efficiency are Shanxi, Xinjiang, Gansu, and Ningxia, with governance efficiencies below 0.5. Regarding SO2 (Figure 9B), ten provinces have a governance efficiency higher than 0.9, accounting for 33.3% of the total. The eight provinces with the lowest efficiency are Shanxi, Inner Mongolia, Gansu, Liaoning, Chongqing, Guizhou, Xinjiang, and Ningxia, with governance efficiencies below 0.5. Turning to NOx (Figure 9C), ten provinces have a governance efficiency higher than 0.9, accounting for 33.3% of the total. The eight provinces with the lowest efficiency are Hebei, Shanxi, Inner Mongolia, Heilongjiang, Anhui, Liaoning, Xinjiang, and Ningxia, all with governance efficiencies below 0.5.
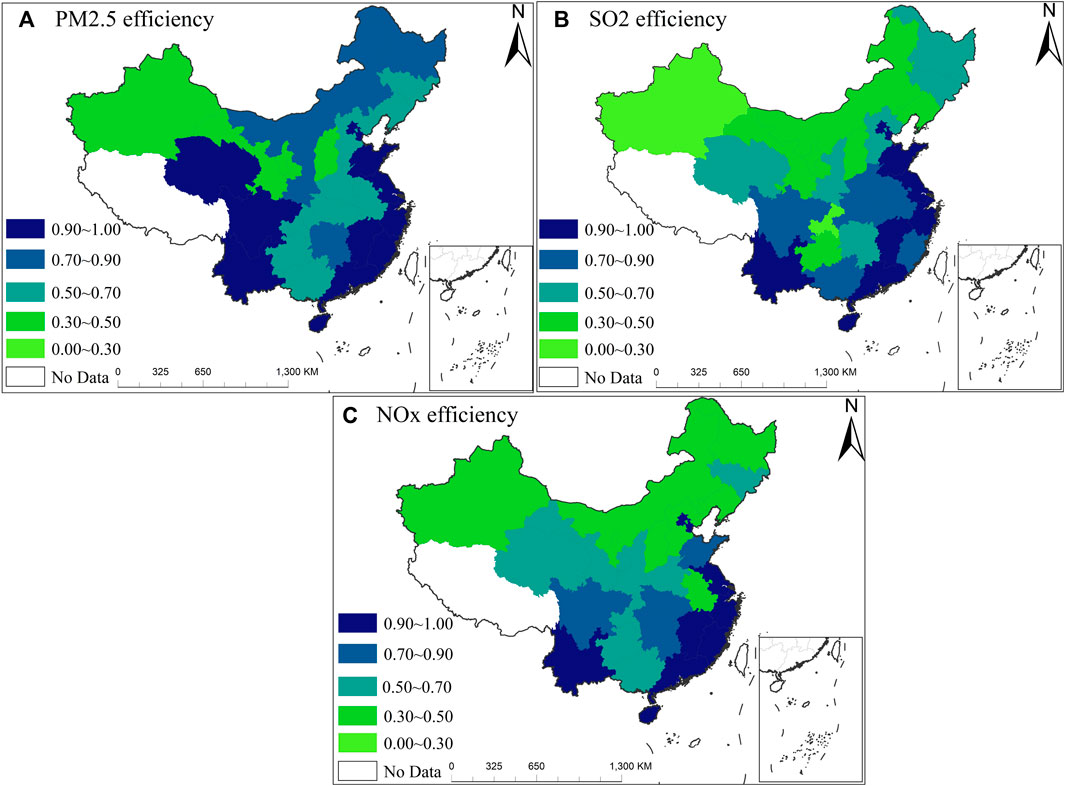
FIGURE 9. Regional disparities of air pollution efficiency in China. (A) Average control efficiency (geometric mean) of PM2.5 in China from 2015 to 2020. (B) Average control efficiency (geometric mean) of SO2 in China from 2015 to 2020. (C) Average control efficiency (geometric mean) of NOx in China from 2015 to 2020.
Considering these dramatic regional differences, China’s potential to reduce air pollution is enormous. If these inefficient provinces are given the management capacity and cutting-edge technology possessed by the more efficient provinces, they should be able to achieve this goal. In addition, as shown in Table 5, most of the p-values for air pollutants from 2015 to 2020 are less than 0.05, and the validation findings are very significant, showing substantial variation in the air pollution control efficiency across the eastern, central, and western provinces. Figure 9 makes it clear that all of the high-efficiency provinces are in the developed eastern region. Five of the eight provinces that are inefficient are located in the west, while three are located in the center of the country. It is evident that regional economic development is positively connected with air pollution control. Thus, economic growth could be essential in improving the effectiveness of regional air pollution control in China.
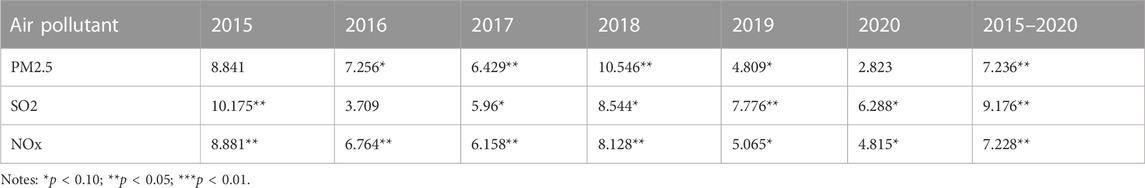
TABLE 5. Kruskal–Wallis test of air pollutant control efficiency for the eastern, central, and western regions, 2015–2020.
Next, we applied the DNSBM model for each inefficient province to capture their air pollution reduction targets. However, when we examined the data we discovered that these provinces are struggling to meet the DNSBM model-calculated targets because of their significant differences from the efficient provinces regarding economic development, management capability, and technological level. As a result, the DNSBM model’s air pollution reduction targets in this study are considered long-term goals, as they are not achievable in the short term for inefficient provinces. To further demonstrate the point, Table 6 shows the actual and target values for each province in China and the improvement in PM2.5 concentrations, SO2 emissions, and NOx emissions.
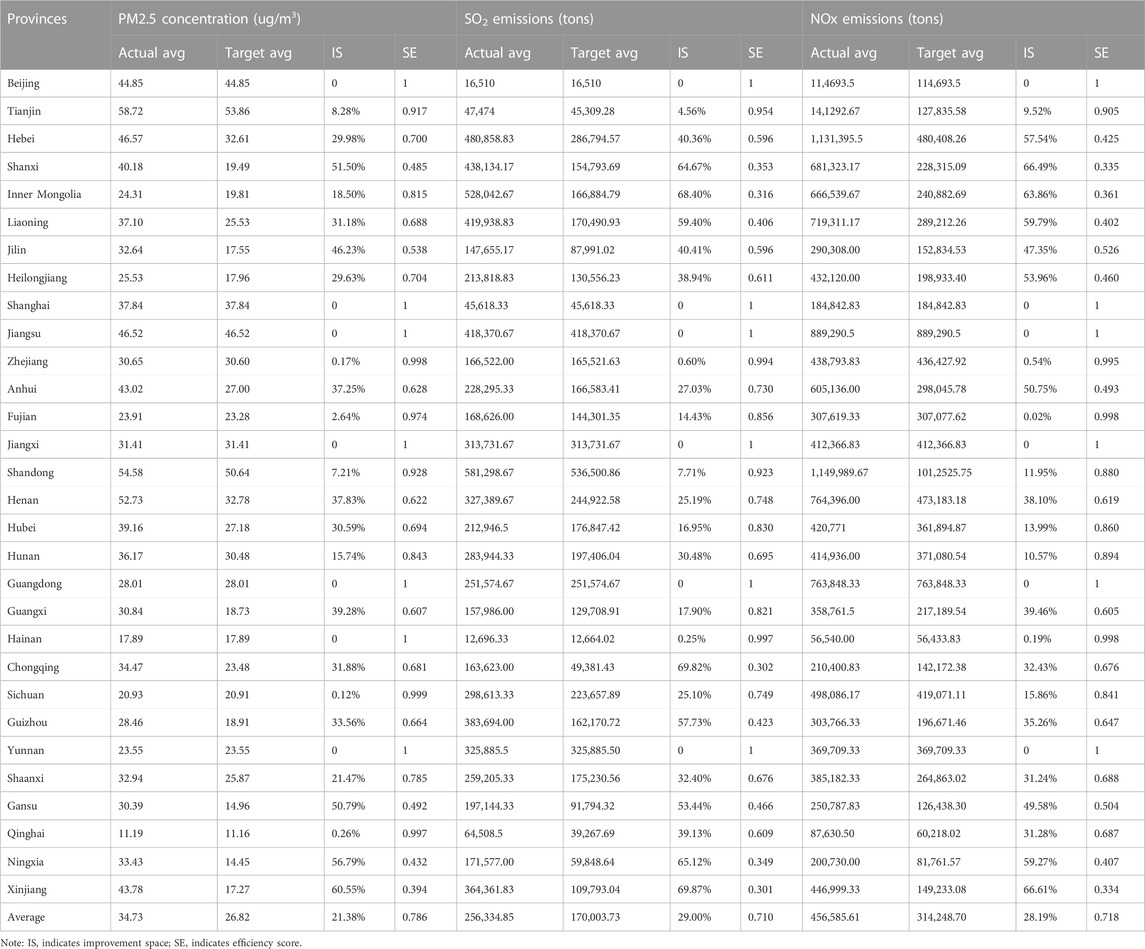
TABLE 6. Long-term air pollution reduction targets for 30 Chinese provinces, 2015–2020.
As seen in Table 6, Beijing, Shanghai, Jiangsu, Jiangxi, Guangdong, and Yunnan have zero air pollution reduction targets and are benchmarks for other inefficient Chinese provinces. For low-efficiency provinces to achieve high efficiency (e.g., Hubei, with PM2.5, SO2, and NOx control efficiencies of 0.694, 0.830, and 0.860, respectively), their PM2.5 concentrations should be reduced from 39.16 ug/m3 to 27.18 ug/m3 (30.59% improvement), SO2 emissions from 212,946.50 tons to 176,847.42 tons (16.95% improvement), and NOx emissions from 420,771.00 tons to 361,894.87 tons (13.99% improvement). Meanwhile, Hunan, with PM2.5, SO2, and NOx control efficiency values of 0.843, 0.695, and 0.894, respectively, should reduce PM2.5 concentrations from 36.17 ug/m3 to 30.48 ug/m3 (15.74% improvement), SO2 emissions from 283,944.33 tons to 197,406.04 tons (30.48% improvement), and NOx emissions from 414,936 tons to 371,080.54 tons (10.57% improvement). For these two higher-ranked provinces, these air pollution reduction goals are immediately realizable. Nevertheless, we also discovered that it is difficult to meet the targets for some less efficient regions in a single step or within a short period of time. For example, Xinjiang’s PM2.5, SO2, and NOx control efficiencies are 0.394, 0.301, and 0.334, respectively, and it must reduce these values by 60.55%, 69.87%, and 66.61%, respectively. Thus, for these inefficient provinces, these goals cannot be achieved overnight or even within a short time, and should be considered long-term goals.
5 Discussion
In recent years, researchers from a variety of disciplines have started investigating the intersections among economic development, air pollution, and human health (Cao and Ramirez, 2020; Zhou and Li, 2021), but few studies have examined the combined effects of these factors from an efficiency standpoint. Thus, this study uses a DNSBM model to assess the efficiency of economic development, health production, and air pollution control in 30 Chinese provinces from 2015 to 2020. This approach avoids the shortcomings of static analysis, includes carryover effects over time, and accounts for regional differences. The study’s findings provide government-targeted recommendations for promoting sustainable economic development while strengthening health promotion and mitigating air pollution. The principal findings are as follows.
First, at the national level, the overall efficiency value of the two stages, from economic production input to health output, in China from 2015 to 2020 is 0.693, suggesting much room for improvement. This result is mainly caused by the failure of coordinated and balanced economic development and healthy production, similar to the conclusions of other studies (Shi et al., 2021). Specifically, the average annual efficiency of economic development (0.729) is significantly higher than the average annual efficiency of health production (0.657). Thus, greater efforts are required to increase the effectiveness of healthcare resource utilization. Going further, the overall efficiency values exhibit a downward trend, which is primarily brought on by the decline in economic development efficiency. In contrast, the rise in the efficiency of health production is the main contributor to mitigating the overall efficiency decline. This indicates that improving the efficiency of health production, rather than the efficiency of economic development, should be the main priority when working to improve overall efficiency, which is similar to the findings of other studies (Wang and Feng, 2015). At the provincial level, the efficiency of economic development in Beijing, Guangdong, and Shanghai is equivalent to the efficiency of healthy production, each with a value of 1. In the other provinces, the efficiency of the economic development phase outweighs the efficiency of the health production phase. One possible reason is that, as China’s economic reforms gained momentum and local governments competed for economic growth while being given more autonomy, the government prioritized economic development over public services such as healthcare (Audibert et al., 2013). Therefore, restricted public funding and rapidly rising healthcare costs have hampered the healthy development of healthcare services (Dong, 2009). On the other hand, due to insufficient medical and healthcare resource management in China, scarce health resources are not being allocated and utilized rationally. In other words, these health resources have yet to be invested to maximize health outcomes, resulting in a decline in health productivity and an increase in the population’s health burden (Zhang et al., 2017). At the same time, people’s bad health can contribute to their already precarious economic circumstances, limiting productivity, pushing them into poverty (Liu and Griffiths, 2011), and eventually hampering the country’s long-term development.
Second, research shows that the regional differentiation of China’s economic development and health production efficiency is apparent, which is the same as the results of Zhang et al. (2018b). Specifically, the eastern regions of China, such as Beijing and Guangdong, have economic development and health production efficiency values higher than 0.9. China’s eastern region is the most developed; greater input and output efficiency in the east is strongly supported by the region’s higher level of economic development and superior endowment of health resources (Yan et al., 2021). Even though these areas still have some air pollution issues that affect residents’ health, the beneficial impacts of higher economic levels and more healthcare resources on population health exceed the negative effects (Lu et al., 2020). As a result, these areas are almost certain to sustain a high degree of economic development and healthy output. The central and western areas’ (e.g., Shanxi, Xinjiang, Gansu, and Ningxia provinces) economic development and health production efficiency are low, with values less than 0.4. On the one hand, the relatively weak industrial base and imperfect industrial structure in these areas means that they lack appropriate conditions for making full use of input variables, such as energy and labor, resulting in lower economic development efficiency in these regions. On the other hand, some of the industrial businesses eliminated from the eastern provinces have shifted to the central and western regions, resulting in increased energy consumption and pollutant emissions that pose major health risks to local populations (Xu and Wang, 2021). Furthermore, there is an unequal distribution of medical resources in China such that high-quality medical resources are increasingly clustered in the east (Zhang et al., 2021). Inadequate investment in high-quality medical equipment and health professionals has occurred in the central and western regions due to a lack of financial resources for health (Jiang et al., 2021), thus limiting the efficiency of health production in this area.
Finally, the study shows that, from 2015 to 2020, China’s average PM2.5, SO2, and NOx control efficiency values are 0.786, 0.710, and 0.718, respectively; these are relatively low and have considerable room for improvement, similar to the conclusions of other studies (Wang et al., 2020). At the same time, the efficiency of air pollution control varies greatly among Chinese regions due to the disparities in economic development levels, which is consistent with the findings of Wang et al. (2019). The provinces with high efficiency (equal to 1) in PM2.5, SO2, and NOx control, such as Beijing, Guangdong, and Jiangsu, are in the economically developed eastern region, and they all achieved a zero air pollution reduction target, which is a benchmark for inefficient Chinese provinces. The provinces with the lowest efficiency (values less than 0.4) include Xinjiang, Gansu, Shanxi, and Ningxia; all are located in the central and western regions with more backward economic development, and all have air pollution reduction targets greater than 50%. This makes it necessary to focus on air pollution in these regions to achieve ideal air quality and a green ecological environment. Furthermore, the data on China’s air pollution control show noticeable regional differences, with the eastern provinces typically having higher air pollution control efficiency than the central and western provinces, which is similar to the findings of Liu and Dong (2021b). It is significant to note that the enormous gap between these less efficient provinces and the more efficient ones in terms of economic development, management capacity, and technical level of air pollution treatment makes it difficult to achieve the air pollution reduction goals calculated with the DNSBM model in the short term. Therefore, the air pollution reduction targets calculated using the DNSBM model for the inefficient provinces mentioned above should instead be viewed as long-term targets.
6 Conclusion
With China’s rapid economic development, the threats to public health from environmental pollution, ecological balance disruption, and air quality degradation have gradually become crucial elements limiting socioeconomic sustainability. However, most previous studies have concentrated on the link between environmental quality and economic growth, or the impact of air pollution on public health; few have engaged in comprehensive research on the links among these three variables. Thus, this study evaluates the dynamic association between economic development, air pollution, and health production from an efficiency perspective using the DNSBM model, and the following conclusions are offered.
First, at the national level, the average overall efficiency value is 0.693, which is low and has much room for improvement. Economic development efficiency (0.729) is higher than health productivity efficiency (0.657), which indicates that China worked effectively on economic development but not as well on health during 2015–2020. In terms of trends in efficiency, growth in health production efficiency has been the main contributor to overall efficiency gains over the study period, while the decline in economic development efficiency has been the main obstacle.
Second, at the provincial level, efficiency varies widely among the 30 provinces, and this difference is statistically significant. Regarding individual differences in economic development and health production efficiency, Beijing, Jiangxi, Shanghai, and Jiangsu have the highest efficiency values, over 0.9. In contrast, Xinjiang, Inner Mongolia, Gansu, and Qinghai have the lowest efficiency, with values less than 0.4. Regarding individual differences in overall efficiency, Beijing, Shanghai, and Guangdong have the highest efficiency, equal to 1, while Xinjiang has the lowest efficiency of less than 0.35. Moreover, the efficiency of the three regions demonstrated distinct spatial differences. The eastern region has the highest efficiency, followed by the central region, and the western region has the lowest.
Finally, in controlling air pollutants, from 2015 to 2020, China’s average PM2.5, SO2, and NOx control efficiency values are 0.786, 0.710, and 0.718, respectively; these results are poor and could be greatly improved. Moreover, the different levels of economic development have led to large differences in the efficiency of air pollution control among regions in China. The air pollution control capacity of the developed eastern provinces (e.g., Beijing, Shanghai, and Guangdong) is generally higher than that of the more economically underdeveloped central and western regions (e.g., Xinjiang, Gansu, Shanxi, and Ningxia). In addition, the air pollution reduction targets achieved by applying the DNSBM model for inefficient provinces should be viewed as long-term rather than short-term targets due to a significant gap between the inefficient and highly efficient provinces regarding economic development, management capability, and pollution technology level.
The following recommendations for policy are based on the findings of this study.
First and foremost, the central government must adhere to the requirements of sustainable development, abandon previous dualistic development thinking, and enhance economic development efficiency while ensuring the excellent effect of healthy output. Second, the state should improve the economic and institutional environments, which influence healthcare system efficiency. Regarding the economic development environment, the scope of public health expenditures should be extended, as should the percentage of government spending and GDP, so that the growth rate keeps pace with, or even exceeds, economic growth. Regarding institutional environment development, the emphasis is on restraining investment preferences in production and boosting the weight of public services, particularly health system quality, in government evaluation. Finally, local governments should focus on improving the management and allocation of health resources, rationally distributing limited medical and health resources, and improving resource utilization rates, thereby improving residents’ health and promoting the coordinated development of the economy and health production.
To address the significant efficiency differences among provinces and regions regarding economic development, the central government should strike a balance between different areas and speed up the execution of three major regional development initiatives. It should narrow the efficiency gap in their economic development by rationally allocating regional resource factors, industrial contacts, and complementary advantages. Regarding health production, the central government should continue to promote the “Rise of Central China” and “Western Development” initiatives and boost policy support and financial investment in the west and central healthcare systems. On the other hand, local governments should build an evaluation mechanism, with efficiency as an indicator, and establish mechanisms to support health resources in backward areas, such as health resource sharing and medical association construction. This would facilitate the distribution of health resources across regions and improve China’s uneven health production development.
Based on the structure of energy consumption, meteorological characteristics, and the level of industrialization in each province, the central government ought to establish targeted policies and measures to mitigate air pollution. Second, local governments should capitalize on their comparative advantages and strengthen regional cooperation. For provinces with a high overall level of air pollutant treatment efficiency, such as Beijing and Shanghai, a “two-point synergistic approach” to treatment should be adopted. On the one hand, it should provide advanced air purification technology and business management experience and generously help reduce air pollution in the central and western provinces. On the other hand, it should coordinate scientific and technological resources, accelerate the development of energy and environmental technology, and play a significant role in improving the current coal-based energy structure. Most regions with low air pollutant management efficiency, such as Xinjiang and Gansu, should optimize and adjust their industrial structure as a core, gradually changing the energy consumption structure of coal, steel, and other high-energy-consumption and high-pollution resources. They should also establish green corridors and clean technology industrial parks in conjunction with China’s “One Belt, One Road” initiative, cultivate and develop new energy and new materials, and eventually realize a circular economy and healthy development model. Finally, considering the wide disparities in efficiency levels between regions, particularly the central and western provinces, selecting the best benchmark province for learning based on each province’s unique characteristics, setting more realistic air pollution reduction goals, and setting short-term and long-term goals separately will be instructive for advancing China’s ongoing work on air pollution mitigation.
In conclusion, there are some limitations to our research. First, the indicators reported in this paper were chosen based on the literature and data availability, which may have introduced bias into the study results. Second, we only considered efficiency evaluations and did not conduct a specific analysis of the influencing factors, nor did we offer a discussion of other influences, such as population mobility and urban development. Thus, the selection of indicators and influencing factors will be studied in depth in the future.
Data availability statement
The raw data supporting the conclusion of this article will be made available by the authors, without undue reservation.
Author contributions
YY wrote the entire article. QT gave review suggestions on the entire writing process and went through all the sections. All authors contributed to the article and approved the submitted version.
Funding
The project is sponsored by the Project on Humanities of the Ministry of Education of the People’s Republic of China, “Research on the construction of hierarchical diagnosis and treatment system of medical and health services based on the perspective of health needs” (Project No: 18YJA630103); 2022 Collaborative Innovation Projects in Anhui Province Universities, “Research on Data Integration and Governance of Anhui Traditional Chinese Medicine” (Project No: GXXT-2022-095); 2022 Excellent Research Innovation Team of Anhui University (Social Science), “Excellent research team of Chinese medicine innovation and development” (Project No: 2022AH010039).
Conflict of interest
The authors declare that the research was conducted in the absence of any commercial or financial relationships that could be construed as a potential conflict of interest.
Publisher’s note
All claims expressed in this article are solely those of the authors and do not necessarily represent those of their affiliated organizations, or those of the publisher, the editors and the reviewers. Any product that may be evaluated in this article, or claim that may be made by its manufacturer, is not guaranteed or endorsed by the publisher.
References
Afonso, A., and Aubyn, M. S. (2005). Non-Parametric approaches to education and health efficiency in OECD countries. J. Appl. Econ. 8 (2), 227–246. doi:10.1080/15140326.2005.12040626
Akintunde, T. S., Oladipo, A. D., and Oyaromade, R. (2019). Socioeconomic determinants of health status in Nigeria (1980-2014). Afr. Rev. Econ. Finance 11 (2), 365–388.
Akram, N., Ihtsham ul Haq, P., and Khan, M. (2008). The long term impact of health on economic growth in Pakistan. Pak. Dev. Rev. 47 (4), 487–500. doi:10.30541/v47i4iipp.487-500
Alderman, H., and Behrman, J. R. (2006). Reducing the incidence of low birth weight in low-income countries has substantial economic benefits. World Bank Res. Observer 21 (1), 25–48. doi:10.1093/wbro/lkj001
Anderson, M. L. (2020). As the wind blows: The effects of long-term exposure to air pollution on mortality. J. Eur. Econ. Assoc. 18 (4), 1886–1927. doi:10.1093/jeea/jvz051
Antweiler, W., Copeland, B. R., and Taylor, M. S. (2001). Is free trade good for the environment? Am. Econ. Rev. 91 (4), 877–908. doi:10.1257/aer.91.4.877
Asiedu, E., Gaekwad, N. B., Nanivazo, M., Nkusu, M., and Jin, Y. (2015). On the impact of income per capita on health outcomes: Is Africa different. J. Econ. Literature 23 (11), 24–33. doi:10.18775/ijied.1849-7551-7020.2015.85.2004
Audibert, M., Mathonnat, J., Pelissier, A., Huang, X. X., and Ma, A. (2013). Health insurance reform and efficiency of township hospitals in rural China: An analysis from survey data. China Econ. Rev. 27, 326–338. doi:10.1016/j.chieco.2013.01.004
Brook, R. D., Rajagopalan, S., Pope, C. A., Brook, J. R., Bhatnagar, A., Diez-Roux, A. V., et al. (2010). Particulate matter air pollution and cardiovascular disease: An update to the scientific statement from the American heart association. Circulation 121 (21), 2331–2378. doi:10.1161/cir.0b013e3181dbece1
Brunekreef, B., and Holgate, S. T. (2002). Air pollution and health. Lancet 360 (9341), 1233–1242. doi:10.1016/S0140-6736(02)11274-8
Bul, A. M., and Moracha, O. R. (2020). Effects of economic growth on health outcomes: A panel data study of sub-saharan Africa. Int. J. Sci. Bus. 4 (4), 35–60. doi:10.5281/zenodo.3736314
Burnett, R., Chen, H., Szyszkowicz, M., Fann, N., Hubbell, B., Pope, C. A., et al. (2018). Global estimates of mortality associated with long-term exposure to outdoor fine particulate matter. Proc. Natl. Acad. Sci. 115 (38), 9592–9597. doi:10.1073/pnas.1803222115
Cao, D., and Ramirez, C. D. (2020). Air pollution, government pollution regulation, and industrial production in China. J. Syst. Sci. Complex. 33 (4), 1064–1079. doi:10.1007/s11424-020-9128-6
Cao, J., Yang, C., Li, J., Chen, R., Chen, B., Gu, D., et al. (2011). Association between long-term exposure to outdoor air pollution and mortality in China: A cohort study. J. Hazard. Mater. 186 (2), 1594–1600. doi:10.1016/j.jhazmat.2010.12.036
Charnes, A., Cooper, W. W., and Rhodes, E. (1978). Measuring the efficiency of decision making units. Eur. J. Operational Res. 2 (6), 429–444. doi:10.1016/0377-2217(78)90138-8
Chen, H., Liu, J., Li, Y., Chiu, Y.-H., and Lin, T.-Y. (2019). A two-stage dynamic undesirable data envelopment analysis model focused on media reports and the impact on energy and health efficiency. Int. J. Environ. Res. Public Health [Online] 16 (9), 1535. doi:10.3390/ijerph16091535
Chen, R., Huang, W., Wong, C.-M., Wang, Z., Quoc Thach, T., Chen, B., et al. (2012). Short-term exposure to sulfur dioxide and daily mortality in 17 Chinese cities: The China air pollution and health effects study (CAPES). Environ. Res. 118, 101–106. doi:10.1016/j.envres.2012.07.003
Cole, W. M. (2019). Wealth and health revisited: Economic growth and wellbeing in developing countries, 1970 to 2015. Soc. Sci. Res. 77, 45–67. doi:10.1016/j.ssresearch.2018.09.003
Dhital, S., and Rupakheti, D. (2019). Bibliometric analysis of global research on air pollution and human health: 1998–2017. Environ. Sci. Pollut. Res. 26 (13), 13103–13114. doi:10.1007/s11356-019-04482-x
Diao, B., Ding, L., Su, P., and Cheng, J. (2018). The spatial-temporal characteristics and influential factors of NOx emissions in China: A spatial econometric analysis. Int. J. Environ. Res. Public Health 15 (7), 1405. doi:10.3390/ijerph15071405
Dominici, F., Daniels, M., Zeger, S. L., and Samet, J. M. (2002). Air pollution and mortality. J. Am. Stat. Assoc. 97 (457), 100–111. doi:10.1198/016214502753479266
Dominski, F. H., Lorenzetti Branco, J. H., Buonanno, G., Stabile, L., Gameiro da Silva, M., and Andrade, A. (2021). Effects of air pollution on health: A mapping review of systematic reviews and meta-analyses. Environ. Res. 201, 111487. doi:10.1016/j.envres.2021.111487
Dong, K. (2009). Medical insurance system evolution in China. China Econ. Rev. 20 (4), 591–597. doi:10.1016/j.chieco.2009.05.011
Drabo, A. (2011). Interrelationships between health, environment quality and economic activity: What consequences for economic convergence. Helsinki, Finland: United Nations University World Institute for Development Economics Research (UNU–WIDER).
Emetere, M. E., and Oladimeji, T. E. (2022). Impact assessment of particulate pollution on maternal mortality in Nigeria. Sci. Rep. 12 (1), 19669. doi:10.1038/s41598-022-19518-5
Erdoğan, S. (2019). Investigation of causality analysis between economic growth and CO2 emissions: The case of BRICS-T countries. Istanbul, Turkey: Econjournals.
Evans, D. B., Tandon, A., Murray, C. J. L., and Lauer, J. A. (2000). The comparative efficiency of national health systems in producing health: An analysis of 191 countries. World Health Organ. 29 (29), 1–36. doi:10.1136/bmj.323.7308.307
Färe, R., Grosskopf, S., and Primont, D. (2010). Aggregation, efficiency, and measurement. Germany: Springer Science and Business Media.
Färe, R., Grosskopf, S., and Whittaker, G. (2007). Network DEA. Modeling data irregularities and structural complexities in data envelopment analysis. Germany: Zhu W. Cook Springer.
Feng, Y., Yu, X., Chiu, Y.-h., and Chang, T.-H. (2019). Dynamic linkages among economic development, energy consumption, environment and health sustainable in EU and non-EU countries. Healthc. [Online] 7 (4), 138. doi:10.3390/healthcare7040138
Fernández Fernández, Y., Fernández López, M. A., and Olmedillas Blanco, B. (2018). Innovation for sustainability: The impact of R&D spending on CO2 emissions. J. Clean. Prod. 172, 3459–3467. doi:10.1016/j.jclepro.2017.11.001
Flokou, A., Aletras, V., and Niakas, D. (2017). Decomposition of potential efficiency gains from hospital mergers in Greece. Health Care Manag. Sci. 20 (4), 467–484. doi:10.1007/s10729-016-9365-3
Fu, X., Li, L., Lei, Y., Wu, S., Yan, D., Luo, X., et al. (2020). The economic loss of health effect damages from PM2.5 pollution in the Central Plains Urban Agglomeration. Environ. Sci. Pollut. Res. 27 (20), 25434–25449. doi:10.1007/s11356-020-08560-3
Ghorani-Azam, A., Riahi-Zanjani, B., and Balali-Mood, M. (2016). Effects of air pollution on human health and practical measures for prevention in Iran. J. Res. Med. Sci. 21, 65. doi:10.4103/1735-1995.189646
Gong, X., Mi, J., Wei, C., and Yang, R. (2019). Measuring environmental and economic performance of air pollution control for province-level areas in China. Int. J. Environ. Res. Public Health [Online] 16 (8), 1378. doi:10.3390/ijerph16081378
Hackley, B., Feinstein, A., and Dixon, J. (2007). Air pollution: Impact on maternal and perinatal health. J. midwifery and women’s health 52 (5), 435–443. doi:10.1016/j.jmwh.2007.03.020
Hadad, S., Hadad, Y., and Simon-Tuval, T. (2013). Determinants of healthcare system’s efficiency in OECD countries. Eur. J. Health Econ. 14 (2), 253–265. doi:10.1007/s10198-011-0366-3
Halliru, A. M., Loganathan, N., Golam Hassan, A. A., Mardani, A., and Kamyab, H. (2020). Re-Examining the environmental kuznets curve hypothesis in the economic community of west african states: A panel quantile regression approach. J. Clean. Prod. 276, 124247. doi:10.1016/j.jclepro.2020.124247
Hanif, I. (2018). Impact of economic growth, nonrenewable and renewable energy consumption, and urbanization on carbon emissions in Sub-Saharan Africa. Environ. Sci. Pollut. Res. 25 (15), 15057–15067. doi:10.1007/s11356-018-1753-4
He, X., Chiu, Y.-h., Chang, T.-H., Lin, T.-Y., and Wang, Z. (2020). The energy efficiency and the impact of air pollution on health in China. Healthc. [Online] 8 (1), 29. doi:10.3390/healthcare8010029
Hu, J.-L., and Wang, S.-C. (2006). Total-factor energy efficiency of regions in China. Energy Policy 34 (17), 3206–3217. doi:10.1016/j.enpol.2005.06.015
Hussain, Z., Miao, C., Zhao, Z., and Wang, Y. (2022). Nexus between economic efficiency, healthcare, and environmental expenditures: A perspective of bri countries. Front. Public Health 10, 842070. doi:10.3389/fpubh.2022.842070
Jiang, Z., Wu, Q., and Wang, T. (2021). Research on the efficiency of local medical and health fiscal expenditure based on Chinese-style decentralization. Sub Natl. Fisc. Res. 10, 42–51.
Kang, Y.-Q., Zhao, T., and Yang, Y.-Y. (2016). Environmental kuznets curve for CO2 emissions in China: A spatial panel data approach. Ecol. Indic. 63, 231–239. doi:10.1016/j.ecolind.2015.12.011
Katrakilidis, C., Kyritsis, I., and Patsika, V. (2016). The dynamic linkages between economic growth, environmental quality and health in Greece. Appl. Econ. Lett. 23 (3), 217–221. doi:10.1080/13504851.2015.1066482
Kawaguchi, H., Tone, K., and Tsutsui, M. (2014). Estimation of the efficiency of Japanese hospitals using a dynamic and network data envelopment analysis model. Health Care Manag. Sci. 17 (2), 101–112. doi:10.1007/s10729-013-9248-9
Kelly, F. J., and Fussell, J. C. (2015). Air pollution and public health: Emerging hazards and improved understanding of risk. Environ. Geochem. Health 37 (4), 631–649. doi:10.1007/s10653-015-9720-1
Khoshnevis Yazdi, S., and Khanalizadeh, B. (2017). Air pollution, economic growth and health care expenditure. Econ. research-Ekonomska istraživanja 30 (1), 1181–1190. doi:10.1080/1331677x.2017.1314823
Kubatko, O., and Kubatko, O. (2019). Economic estimations of air pollution health nexus. Environ. Dev. Sustain. 21 (3), 1507–1517. doi:10.1007/s10668-018-0252-6
Lee, B.-J., Kim, B., and Lee, K. (2014). Air pollution exposure and cardiovascular disease. Toxicol. Res. 30 (2), 71–75. doi:10.5487/TR.2014.30.2.071
Li, L., Lei, Y., Pan, D., Yu, C., and Si, C. (2016). Economic evaluation of the air pollution effect on public health in China’s 74 cities. SpringerPlus 5 (1), 402. doi:10.1186/s40064-016-2024-9
Li, Y., Chiu, Y.-h., and Lin, T.-Y. (2019a). The impact of economic growth and air pollution on public health in 31 Chinese cities. Int. J. Environ. Res. public health 16 (3), 393. doi:10.3390/ijerph16030393
Li, Y., Chiu, Y.-h., Liu, Y., Lin, T.-Y., and Chang, T.-H. (2020). The impact of the media and environmental pollution on the economy and health using a modified meta 2-stage EBM malmquist model. Inq. J. Health Care Organ. Provis. Financing 57, 004695802092107. doi:10.1177/0046958020921070
Li, Y., Chiu, Y.-h., and Lu, L. C. (2019b). Urban energy environment efficiency in China: Based on dynamic meta-frontier slack-based measures. J. Air and Waste Manag. Assoc. 69 (3), 320–332. doi:10.1080/10962247.2018.1537942
Lin, H., Chen, H., Zhang, L., Luo, Y., Shi, Y., and Zou, W. (2021). Energy consumption, air pollution, and public health in China: Based on the two-stage dynamic undesirable DEA model. Air Qual. Atmos. Health 14 (9), 1349–1364. doi:10.1007/s11869-021-01025-7
Liu, S., and Griffiths, S. M. (2011). From economic development to public health improvement: China faces equity challenges. Public Health 125 (10), 669–674. doi:10.1016/j.puhe.2011.08.004
Liu, Y.-R., and Dong, J.-Y. (2021a). Effect of air pollution on emergency room visits for respiratory diseases in lanzhou. Zhongguo yi xue ke xue yuan xue Bao. Acta Acad. Med. Sin. 43 (3), 382–394. doi:10.3881/j.issn.1000-503X.13101
Liu, Y.-R., and Dong, J.-Y. (2021b). Effect of air pollution on emergency room visits for respiratory diseases in lanzhou. Zhongguo yi xue ke xue yuan xue Bao. Acta Acad. Med. Sin. 43 (3), 382–394. doi:10.3881/j.issn.1000-503X.13101
Liu, Y., Zhou, Y., and Wu, W. (2015). Assessing the impact of population, income and technology on energy consumption and industrial pollutant emissions in China. Appl. Energy 155, 904–917. doi:10.1016/j.apenergy.2015.06.051
Lu, P., Wang, S., and Liu, H. (2020). Quantitative analysis of Chinese life expectancy and main factors. Gansu Med. J. v 39, 74–78. doi:10.15975/j.cnki.gsyy.2020.09.025
Mary, S. (2018). How much does economic growth contribute to child stunting reductions? Economies 6 (4), 55. doi:10.3390/economies6040055
Mayer, D. (2001). The long-term impact of health on economic growth in Latin America. World Dev. 29 (6), 1025–1033. doi:10.1016/s0305-750x(01)00026-2
Mujtaba, G., and Shahzad, S. J. H. (2021). Air pollutants, economic growth and public health: Implications for sustainable development in OECD countries. Environ. Sci. Pollut. Res. 28 (10), 12686–12698. doi:10.1007/s11356-020-11212-1
Omri, A., Daly, S., Rault, C., and Chaibi, A. (2015). Financial development, environmental quality, trade and economic growth: What causes what in MENA countries. Energy Econ. 48, 242–252. doi:10.1016/j.eneco.2015.01.008
Owili, P. O., Lien, W.-H., Muga, M. A., and Lin, T.-H. (2017). The associations between types of ambient PM2. 5 and under-five and maternal mortality in Africa. Int. J. Environ. Res. public health 14 (4), 359. doi:10.3390/ijerph14040359
Pope, C. A., Ezzati, M., and Dockery, D. W. (2015). Tradeoffs between income, air pollution and life expectancy: Brief report on the US experience, 591–593. Environ. Res. 142, 591–593. doi:10.1016/j.envres.2015.08.014
Rajaratnam, J. K., Tran, L. N., Lopez, A. D., and Murray, C. J. L. (2010). Measuring under-five mortality: Validation of new low-cost methods. PLoS Med. 7 (4), e1000253. doi:10.1371/journal.pmed.1000253
Rutherford, M. E., Mulholland, K., and Hill, P. C. (2010). How access to health care relates to under-five mortality in sub-saharan Africa: Systematic review. Trop. Med. Int. health 15 (5), 508–519. doi:10.1111/j.1365-3156.2010.02497.x
Sayem, A., Md Zahid, H., Mary, M., Farzana, D., Mohammad Wahid, A., Md Mehedi, H., et al. (2019). Measuring the efficiency of health systems in asia: A data envelopment analysis. BMJ Open 9 (3), e022155. doi:10.1136/bmjopen-2018-022155
Shi, Z., Huang, H., Chiu, Y.-h., Zhang, B., and Zhang, C. (2021). Linkage analysis of water resources, wastewater pollution, and health for regional sustainable development—Using undesirable three-stage dynamic data envelopment analysis. Environ. Sci. Pollut. Res. 28 (15), 19325–19350. doi:10.1007/s11356-020-12067-2
Siddique, H. M. A., and Kiani, A. K. (2020). Industrial pollution and human health: Evidence from middle-income countries. Environ. Sci. Pollut. Res. 27 (11), 12439–12448. doi:10.1007/s11356-020-07657-z
Spinks, J., and Hollingsworth, B. (2009). Cross-country comparisons of technical efficiency of health production: A demonstration of pitfalls. Appl. Econ. 41 (4), 417–427. doi:10.1080/00036840701604354
Sueyoshi, T., and Yuan, Y. (2015). China’s regional sustainability and diversified resource allocation: DEA environmental assessment on economic development and air pollution. Energy Econ. 49, 239–256. doi:10.1016/j.eneco.2015.01.024
Sueyoshi, T., Zhang, R., Qu, J., and Li, A. (2021). New concepts for environment-health measurement by data envelopment analysis and an application in China. J. Clean. Prod. 312, 127468. doi:10.1016/j.jclepro.2021.127468
Thornburg, J., Islam, S., Billah, S. M., Chan, B., McCombs, M., Abbott, M., et al. (2022). Pregnant women’s exposure to household air pollution in rural Bangladesh: A feasibility study for poriborton: The CHANge trial. Int. J. Environ. Res. Public Health 19 (1), 482. doi:10.3390/ijerph19010482
Tone, K., and Tsutsui, M. (2014). Dynamic DEA with network structure: A slacks-based measure approach. Omega 42 (1), 124–131. doi:10.1016/j.omega.2013.04.002
Tone, K., and Tsutsui, M. (2009). Network DEA: A slacks-based measure approach. Eur. J. Operational Res. 197 (1), 243–252. doi:10.1016/j.ejor.2008.05.027
Top, M., Konca, M., and Sapaz, B. (2020). Technical efficiency of healthcare systems in African countries: An application based on data envelopment analysis. Health Policy Technol. 9 (1), 62–68. doi:10.1016/j.hlpt.2019.11.010
Urhie, E., Afolabi, A., Afolabi, A., Matthew, O., Osabohien, R., and Ewetan, O. (2020). Economic growth, air pollution and health outcomes in Nigeria: A moderated mediation model. Cogent Soc. Sci. 6 (1), 1719570. doi:10.1080/23311886.2020.1719570
Vlaanderen, J. J., Janssen, N. A., Hoek, G., Keski-Rahkonen, P., Barupal, D. K., Cassee, F. R., et al. (2017). The impact of ambient air pollution on the human blood metabolome. Environ. Res. 156, 341–348. doi:10.1016/j.envres.2017.03.042
Wang, K.-L., Ding, L.-L., Wang, J.-M., and Yang, M. (2020). Analysis of provincial total-factor air pollution efficiency in China by using context-dependent slacks-based measure considering undesirable outputs. Nat. Hazards 104 (2), 1899–1921. doi:10.1007/s11069-020-04253-9
Wang, K.-L., Miao, Z., Zhao, M.-S., Miao, C.-L., and Wang, Q.-W. (2019). China’s provincial total-factor air pollution emission efficiency evaluation, dynamic evolution and influencing factors. Ecol. Indic. 107, 105578. doi:10.1016/j.ecolind.2019.105578
Wang, L., Shi, T., and Chen, H. (2023). Air pollution and infant mortality: Evidence from China. Econ. Hum. Biol. 49, 101229. doi:10.1016/j.ehb.2023.101229
Wang, Y., Han, R., and Kubota, J. (2016). Is there an environmental kuznets curve for SO2 emissions? A semi-parametric panel data analysis for China. Renew. Sustain. Energy Rev. 54, 1182–1188. doi:10.1016/j.rser.2015.10.143
Wang, Y., Sun, K., Li, L., Lei, Y., Wu, S., Jiang, Y., et al. (2022). The impacts of economic level and air pollution on public health at the micro and macro level. J. Clean. Prod. 366, 132932. doi:10.1016/j.jclepro.2022.132932
Wang, Y. (2010). The analysis of the impacts of energy consumption on environment and public health in China. Energy 35 (11), 4473–4479. doi:10.1016/j.energy.2009.04.014
Wang, Y., Zhang, C., Lu, A., Li, L., He, Y., ToJo, J., et al. (2017). A disaggregated analysis of the environmental Kuznets curve for industrial CO2 emissions in China. Appl. Energy 190, 172–180. doi:10.1016/j.apenergy.2016.12.109
Wang, Z., and Feng, C. (2015). A performance evaluation of the energy, environmental, and economic efficiency and productivity in China: An application of global data envelopment analysis. Appl. Energy 147, 617–626. doi:10.1016/j.apenergy.2015.01.108
Well, D. N. (2007). Accounting for the effect of health on economic growth. Q. J. Econ. 122 (3), 1265–1306. doi:10.1162/qjec.122.3.1265
Xiong, J., and Xu, D. (2021). Relationship between energy consumption, economic growth and environmental pollution in China. Environ. Res. 194, 110718. doi:10.1016/j.envres.2021.110718
Xu, C. z., and Wang, S. (2021). Industrial three-division network system in China: Efficiencies and their impact factors. Environ. Sci. Pollut. Res. 28 (34), 47375–47394. doi:10.1007/s11356-021-13651-w
Yan, D., Wu, S., Zhou, S., Li, F., and Wang, Y. (2021). Healthy city development for Chinese cities under dramatic imbalance: Evidence from 258 cities. Sustain. Cities Soc. 74, 103157. doi:10.1016/j.scs.2021.103157
Yu, K., Chen, Z., Gao, J., Zhang, Y., Wang, S., and Chai, F. (2015). Relationship between objective and subjective atmospheric visibility and its influence on willingness to accept or pay in China. PloS one 10 (10), e0139495. doi:10.1371/journal.pone.0139495
Zakaria, M., and Bibi, S. (2019). Financial development and environment in south asia: The role of institutional quality. Environ. Sci. Pollut. Res. 26 (8), 7926–7937. doi:10.1007/s11356-019-04284-1
Zhang, L., Cheng, G., Song, S., Yuan, B., Zhu, W., He, L., et al. (2017). Efficiency performance of China’s health care delivery system. Int. J. health Plan. Manag. 32 (3), 254–263. doi:10.1002/hpm.2425
Zhang, R., Wei, Q., Li, A., and Chen, S. (2022). A new intermediate network data envelopment analysis model for evaluating China's sustainability. J. Clean. Prod. 356, 131845. doi:10.1016/j.jclepro.2022.131845
Zhang, T., Chiu, Y.-h., Li, Y., and Lin, T.-Y. (2018a). Air pollutant and health-efficiency evaluation based on a dynamic network data envelopment analysis. Envel. Anal. 15 (9), 2046. doi:10.3390/ijerph15092046
Zhang, T., Chiu, Y.-h., Li, Y., and Lin, T.-Y. (2018b). Air pollutant and health-efficiency evaluation based on a dynamic network data envelopment analysis. Int. J. Environ. Res. public health 15 (9), 2046. doi:10.3390/ijerph15092046
Zhang, X., Han, H., Chen, Y., Li, X., and Luo, G. (2021). A Study on the characteristics and influencing factors of hospital spatial distribution in China. J. Zhejiang Univ. Sci. Ed. 48, 84–92. doi:10.3785/j.issn.1008-9497.2021.01.012
Zhang, Y., Wang, M., Shi, T., Huang, H., and Huang, Q. (2023). Health damage of air pollution, governance uncertainty and economic growth. Int. J. Environ. Res. Public Health 20 (4), 3036. doi:10.3390/ijerph20043036
Zhao, J., Shahbaz, M., Dong, X., and Dong, K. (2021). How does financial risk affect global CO2 emissions? The role of technological innovation. Technol. Forecast. Soc. Change 168, 120751. doi:10.1016/j.techfore.2021.120751
Zhou, A., and Li, J. (2021). Air pollution and income distribution: Evidence from Chinese provincial panel data. Environ. Sci. Pollut. Res. 28 (7), 8392–8406. doi:10.1007/s11356-020-11224-x
Zhou, P., Ang, B. W., and Poh, K. L. (2006). Slacks-based efficiency measures for modeling environmental performance. Ecol. Econ. 60 (1), 111–118. doi:10.1016/j.ecolecon.2005.12.001
Zhou, P., Poh, K. L., and Ang, B. W. (2007). A non-radial DEA approach to measuring environmental performance. Eur. J. Operational Res. 178 (1), 1–9. doi:10.1016/j.ejor.2006.04.038
Keywords: economic development, air pollution, healthy production, efficiency analysis, DNSBM model
Citation: Ye Y and Tao Q (2023) The dynamic relationship among economic development, air pollution, and health production in China: the DNSBM efficiency model. Front. Environ. Sci. 11:1205712. doi: 10.3389/fenvs.2023.1205712
Received: 14 April 2023; Accepted: 11 July 2023;
Published: 21 July 2023.
Edited by:
Lara Aleluia Reis, European Institute of Economics and the Environment, ItalyReviewed by:
Yang Wang, Yunnan Normal University, ChinaXin Zhao, Anhui University of Finance and Economics, China
Copyright © 2023 Ye and Tao. This is an open-access article distributed under the terms of the Creative Commons Attribution License (CC BY). The use, distribution or reproduction in other forums is permitted, provided the original author(s) and the copyright owner(s) are credited and that the original publication in this journal is cited, in accordance with accepted academic practice. No use, distribution or reproduction is permitted which does not comply with these terms.
*Correspondence: Qunshan Tao, eXl6QHN0dS5haHRjbS5lZHUuY24=