 Effah Kwabena Antwi1*
 Rob S. Rempel2
 Matthew Carlson3
 John Boakye-Danquah4Richard Winder5Anna Dabros1Wiafe Owusu-Banahene6Eleanor Berryman7Ian Eddy5
- 1Department of Natural Resources Canada, Ottawa, ON, Canada
- 2FERIT Environmental Consulting, Thunder Bay, ON, Canada
- 3ALCES Landscape and Land-Use, Duncan, BC, Canada
- 4Great Lakes Forestry Centre, Natural Resources Canada, Sault Ste. Marie, ON, Canada
- 5Canadian Forest Service-Natural Resources Canada, Victoria, BC, Canada
- 6Department of Computer Engineering, University of Ghana, Accra, Ghana
- 7CanmetMINING, Natural Resources Canada, Ottawa, ON, Canada
Cumulatively, the effects of resource extraction and climate change have the potential to cause an unprecedented change to the ecosystems and livelihoods of Indigenous communities in Canada’s northern regions. Maintaining environmental and community values in the presence of such change will require a comprehensive understanding of potential long-term risks and opportunities to prevent or mitigate risks at the regional level. However, assessing the cumulative impact and benefits of the multiple disturbances at the regional level is complex due to the interaction of numerous drivers, values, actors, assessment scales, planning, and decision-making processes. We develop an integrated risk and cumulative effects (CE) management methodology to inform regional assessment by combining conceptual modelling through bowtie analysis and quantitative scenario analysis using ALCES Online (AO) simulation. We applied the framework using a case example in the Ring of Fire region of northern Ontario, Canada, to assess the CE of climate change, land use change, and wildlife harvest on the moose (Alces alces)-wolf (Canis lupus)-caribou (Rangifer tarandus) prey-predator system. The bowtie risk analysis provided a mechanism to define the management problem by identifying threats that contribute to risk, associated consequences, and specific management strategies that could be pursued under legislative frameworks and changes to maintain the sustainable dynamics of the moose-wolf-caribou system (MWC). The AO simulation of different levels of development and moose harvest, as well a baseline scenario that excluded climate change and development, allowed for a comprehensive examination of the complex processes driving the social-ecological system. The scenario analysis suggests that moose harvest can promote balance in the MWC system but only if applied in a sophisticated manner that limits moose harvest in areas with high road density, increases moose harvest in more remote regions susceptible to moose population expansion with climate change, and prioritizes Indigenous moose harvest to ensure a sustainable supply of moose for subsistence harvest. The case example shows how conceptual and quantitative modelling can provide the strategic perspective required for regional assessment.
1 Introduction
The Government of Canada introduced the Impact Assessment Act (IAA) in 2019, which overhauled federal environmental assessment system (Impact Assessment Agency of Canada, 2021). The IAA commits the federal government to conduct a regional assessment (RA) in areas with existing or proposed resource development to examine all current environmental impacts to better manage the impact of cumulative effects (CE) beyond the scope of a particular project (Impact Assessment Agency of Canada [IAAC], 2021). Agreement is required between the federal government and jurisdictions if RA is not completely on federal land. One such area selected for RA is northern Ontario’s (a.k.a Far North) Ring of Fire. As a result, a methodology for examining the cumulative impact and benefits of the proposed development on Indigenous communities and wildlife and other values under federal jurisdiction is being developed. RAs enhance governments understanding in the context of a particular region and allow more complete analyses to inform current and future impact assessment (IA) decisions (IAAC, 2021), and improve the effectiveness and efficiency of subsequent project-specific IA and other planning procedures to protect Value Ecosystem Components (VECs) while supporting sustainable economic development. VECs are “environmental elements of an ecosystem that is identified as having scientific, ecological, social, cultural, economic, historical, archaeological or aesthetic importance” (Stillwater Canada, 2012). Moreover, RAs are strategic instruments used by project proponents to communicate a desired course of action and favourable conditions for current/future decisions (CCA, 2019; Noble et al., 2019). In practice, RAs provide several functions, such as data to better understand the region’s environmental, social, and cultural context; information on thresholds to support future project decisions; standard mitigation and possibly effects thresholds to guide future planning and project development; and regional development planning to guide assessment of future development scenarios and support identifying regional development objectives (IAAC, 2021).
The outputs of a RA require the integration and application of knowledge to assess the outcomes of management scenarios, which are well-supported by modelling. To demonstrate this in a case example, we combine conceptual modeling using the bowtie risk analysis with quantitative modelling, using the ALCES Online (AO) landscape simulator and population dynamics (PopDyn) simulator. The framework is applied and tested in the Ring of Fire region. The bowtie analysis helps to conceptualize CE issues, identify drivers and impacts, and suggest mitigating policies and procedures. The AO simulation enables scenarios that integrate landscape and population simulators for holistic and spatial representation of drivers and impacts of CE across large spatial and temporal scales. By combining both approaches, our study demonstrates how to develop critical components of a risk-based case example for a robust RA.
1.1 Structured approach for understanding RA processes
Regional assessment is complex due to the numerous drivers, values, actors, and scales relevant to the planning and decision-making process (Weber et al., 2012; Antwi et al., 2022). In Ontario’s far north, multiple forms of natural resource development combine with natural disturbance and climate change to impact a range of environmental and socioeconomic indicators which directly or indirectly affect First Nations communities. In the face of this complexity, effective planning should be aided by structured decision making (SDM), i.e., the organized analysis of problems to address articulated objectives (Martin et al., 2009). The benefits of SDM to natural resource management include the integration of science, efficient decision-making, and transparent communication of options. SDM is particularly suitable for integrating science and policy as is required for RA. The SDM process consists of a core set of elements (management goals, decision alternatives, and likelihoods of decision outcomes) that should be analyzed separately through a comprehensive framework. For example, through SDM, outcomes of various management strategies are compared to identify opportunities that support management objectives (U. S. Geological Survey, 2021).
SDM steps involve problem definition to decision-making, although the steps are typically highly iterative instead of linear. Modelling is an important part of the SDM process due to the need to systematically integrate diverse knowledge to evaluate the outcomes of decision options. Modelling enhances common understanding of management objectives and alternatives and helps assess the consequences of decisions to understand trade-offs. The SDM process facilitates regional assessment through three stages: inclusive definition of the management problem, objectives, and alternatives; assessment of consequences and trade-offs; and adaptive implementation of management action (Council of Canadian Academies, 2019). Modelling contributes to all three stages. For instance, strategic formulation of the management problem can be conceptually modelled through diagrams that articulate causal relationships between drivers and values, thus helping to reduce the analytic distortions resulting from competing perspectives. In SDM modelling, expert knowledge is employed to help the prediction of outcomes, sometimes in combination with stakeholder knowledge (Lienert et al., 2015).
Several frameworks or approaches utilize the SDM framework to inform environmental assessment processes. Examples of such frameworks include the Drivers-Pressure-State-Impacts-Response (DPSIR), the Drivers-Pressures-State-Exposure-Effects and Actions (DPSEEA), the Bowtie Risk Assessment Tool (BRAT), and ALCES Online (Schneider et al., 2003) all of which utilize scenario analysis and embrace and integrate a variety of knowledge through broad stakeholder consultative processes. For instance, the DPSIR framework provides a structured approach to present the indicators needed to enable feedback to policymakers on environmental quality and the resulting impact of the political choices made. As noted by Kristensen (2004, p. 1), the “framework assumes a chain of causal links starting with “driving forces” (e.g., economic sectors, human activities) through “pressures” (e.g., emissions, waste) to “states” (e.g., physical, chemical and biological) and “impacts” on ecosystems, human health and functions, eventually leading to political “responses” (e.g., prioritization, target setting, indicators).” Pirrone et al. (2005) used the DPSIR to develop management strategies for the Po River Catchment and the North Adriatic coastal zone in response to the European Water Policy. The framework enabled the identification of possible strategies for controlling and/or reducing eutrophication. Similarly, Hines et al. (2016) applied the DPSIR through transdisciplinary workshops to explore management scenarios for coastal zone management in the eastern Gulf of Thailand. They emphasized the framework’s flexibility to achieve systematic and critical thinking and identify data gaps and capacity-building needs. On the other hand, the Driving Force-Pressure-State-Exposure-Effect-Action (DPSEEA) framework is an alternative to the DPSIR framework and has been used extensively in international health assessments (Corvalan et al., 1999). Specifically, DPSEEA can be used to achieve sustained health benefits and environmental protection in accordance with the principles of sustainable development, as it enables the identification of environmental risk assessment and management paradigms (Waheed et al., 2009).
The Bowtie Risk Assessment Tool (BRAT) of ISO 31010 is also a risk assessment technique outlined in the ISO 31000 risk management standard (ISO, 2018) as a conceptual model that is particularly effective for environmental assessment purposes (Cormier et al., 2019). The BRAD systematically reviews, selects and ranks potential risks that form the basis for future mitigation efforts (Jones and Israni, 2012). The BRAT is particularly effective at the evaluation of environmental impacts associated with early-phase development activities, such as design phases, project start-up, review of changes, and new events (Jones and Israni, 2012). In contrast, the AO (Schneider et al., 2003) tool supports decision making by integrating landscape and population simulators. It provides a comprehensive representation of various drivers across extensive temporal and spatial scales. The web-based platform facilitates collaboration among researchers and managers and communication of scenario outcomes (Carlson and Stelfox, 2014).
Based on the review above, several complementary environmental assessment frameworks or tools can support regional cumulative effects analysis, although each has a specific advantage. Also, depending on which stage a project is in, one tool can be more effective than the other. To implement a SDM for RA to support early-stage cumulative effect assessment of proposed projects, we define a framework that combines the BRAT and AO modelling, as shown in Figure 1. The BRAT analysis provides one of the best options for conceptually modelling management problems by bounding and distilling them into a clear and concise logic model focusing attention on objectives, threats, and mitigation options. The outcomes of the threats and mitigation strategies identified in the conceptual model can be quantitatively assessed through scenario analysis involving computer modelling (Weber et al., 2012). Scenario analysis provides an assessment and comparison of a range of scenarios to identify the pros and cons of management options (Swart et al., 2004; Gunn and Noble, 2009). The scenario analysis can inform the adaptive implementation of management action by testing options and identifying knowledge gaps that contribute uncertainty to modelling outcomes.
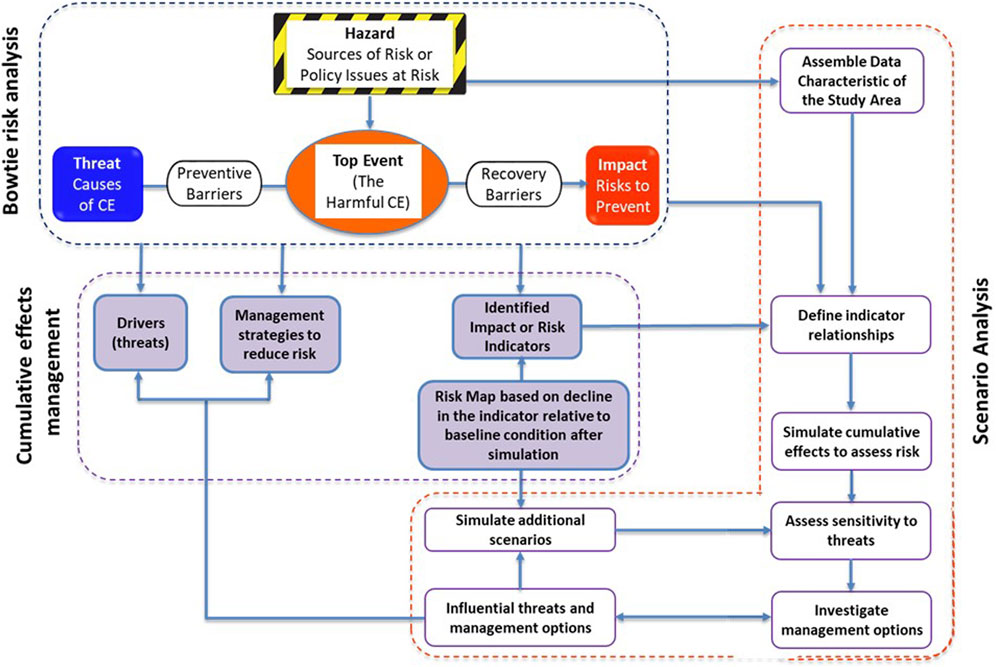
FIGURE 1. Integrated risk and scenario based analysis for cumulative effects assessment.
This research demonstrates how modelling can contribute to RA using a case example from the Ring of Fire. The case example focuses on the CE of land use transformation, climate change, and wildlife harvest on the moose (Alces alces)-wolf (Canis lupus)-caribou (Rangifer tarandus) system. The moose-wolf-caribou (MWC) system is sensitive to numerous drivers that operate over large spatial (i.e., caribou herd ranges) and temporal (i.e., decadal) scales. These include land use, climate change, and wildlife harvest, as well as interactions between the three wildlife species. These interactions can result in opposing responses of species to scenarios, such that conserving caribou while also maintaining opportunities for subsistence harvest requires strategies that strike a balance between different objectives. The complexity of the system and the scale at which it operates is such that project-level planning is likely to be inadequate in scope to identify risks and management needs. The case example illustrates the need for RA and how modelling can provide the requisite strategic perspective to develop critical components of a risk-based approach for a more complete and robust RA.
2 Conceptual framing
If modelling is to inform planning processes such as regional assessments, the scope must address management problems. Hence, the SDM must clearly articulate the management problem by establishing the management objectives and identifying risks to those objectives (Gregory et al., 2013). The scope of the analysis can then be defined by identifying a study area, indicators, and scenarios well-suited for providing insight into management strategies that can reduce risk to management objectives. The identification of suitable indicators and scenarios requires a holistic understanding of the system that is affecting the management objectives. Conceptual models help build this understanding by articulating relationships between system drivers and outcomes. In so doing, conceptual models identify what processes need to be represented in quantitative models during the subsequent scenario analysis. The conceptual model guiding the study combines BRAT and AO simulation into an integrated risk and scenario analysis for cumulative effects assessment (CEA) (Figure 1). We frame the Bowtie Risk Assessment Tool and ALCES as complementary modelling tools that can aid implementation in an SDM framework to mutually address information required for regional assessment (Table 1; Figure 1). The bowtie analysis helps conceptualize the CE issues, identify possible causes and impacts, and indicate policies/procedures needed to mitigate the potential effects. Conversely, the modelling demonstrates the potential of linking the ALCES land use simulation model to integrated population dynamic models to study risks, barriers, and impacts in support of regional assessments. Our conceptual model development also helps to build a common understanding of management issues that require attention.
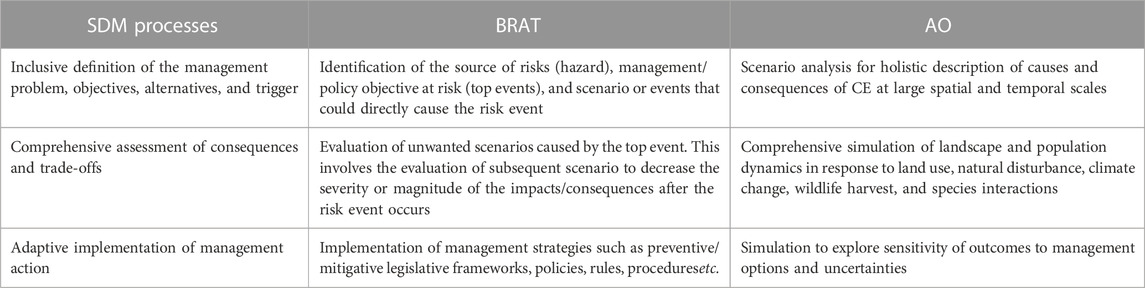
TABLE 1. Complementary and comparative roles of the bowtie risk assessment tool (BRAT) and ALCES simulator in structured decision making (SDM) processes.
2.1 Conceptual modelling: Use of the bowtie risk assessment tool
The bowtie technique is particularly valuable as it encourages interdisciplinary collaboration, allowing stakeholders from different fields of study to brainstorm on previously unexplored issues through multidisciplinary brainstorming sessions or workshops. Despite its origins in industrial risk assessment (de Ruijter and Guldenmund, 2016), BRAT is increasingly used in ecological contexts, including CEA of threats to the self-sustainability of caribou (Winder et al., 2020; Antwi et al., 2023). potential threats to the quality of water (Creed et al., 2016), and pressures on biodiversity and water quality developing from forest management activities (Kishchuk et al., 2018). The bowtie diagram illustrates the relationship between threats, risk events such as ecological tipping points, and negative consequences that contradict management objectives (Figure 2). The analysis identifies management strategies that can function as barriers to risk by preventing threats from triggering risk events or mitigating negative consequences after the event occurs. The strength of the bowtie technique is that it is able to provide a clear and concise result that is easily understood by all without the need for a rather extensive report (ISO, 2018).
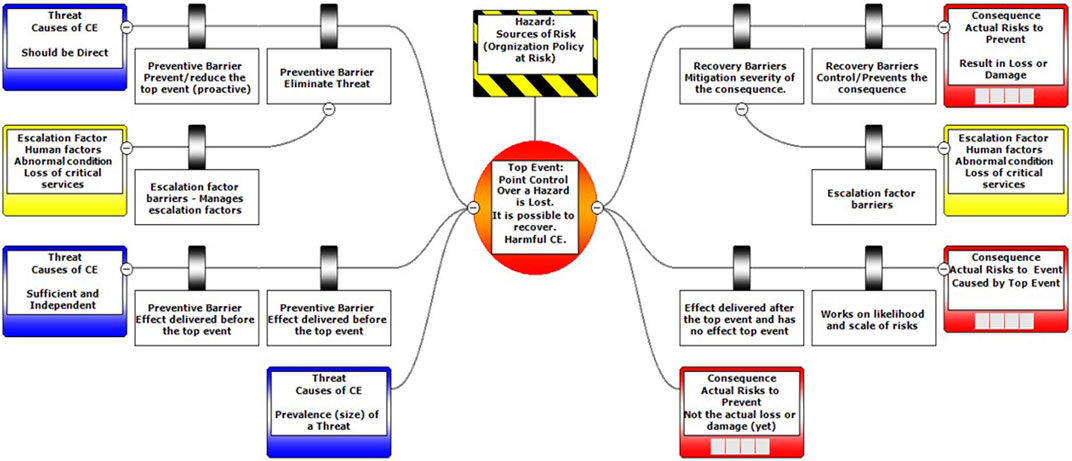
FIGURE 2. The components of a bowtie risk analysis (authors creation).
The bowtie risk diagram consists of various components that aid in understanding policy objectives. These components include the hazard (the policy objective at risk), the risk event that contradict the management objective, the threats that cause the risk event, the consequences of the risk event, the preventative barriers that obstruct threats from activating the risk event, and the mitigative barriers that diminish the adverse effects of the risk event. Figure 2 shows these components, which collectively enable a thorough comprehension of policy objectives.
Some bowtie frameworks use “escalation factors” that simultaneously affect the performance of multiple preventatives or mitigative barriers; these can be viewed as points where the quantification of risks can be altered in various scenarios. The bowtie framework enables numerical quantification of the effectiveness of risk barriers and visualization of the comprehensive range of modern risks (Antwi et al., 2023). It also facilitates the identification and examination of deficiencies in management systems.
This study uses the BRAT to identify and qualify threats and risks. The outcome is then examined in more spatial and quantitative details with computer simulations that are more relevant to SDM.
2.2 Scenario analysis with AO
Scenario analysis builds upon conceptual models such as bowtie risk diagrams by quantitatively projecting the consequences of possible futures to management objectives. Peterson et al. (2003) ascertained that accurately predicting long-range outcomes can be challenging, if not impossible, due to uncertainty and contingency. Thompson et al. (2012), however, suggest that scenario analysis can be a useful tool in comparing the implications of multiple futures as shown in this study, thus enhancing our understanding of the relative significance of threats, the advantages and disadvantages of various management options, and the sensitivity of knowledge gaps. The benefits of scenario analysis are varied and include: identifying and prioritizing risks, demonstrating trade-offs to build shared understanding in the face of competing objectives, identifying cost-effective management strategies by comparing the costs and benefits of options; aiding environmental assessment by comparing the consequences of a project and its alternatives; and prioritizing research and monitoring needs by comparing the sensitivity of outcomes to uncertain parameters (Dammers and Evers, 2008; Dammers et al., 2019).
To assess CE, scenario analysis must consider the enduring impacts of influential drivers at regional scales through expert consultations. This makes scenario analysis for regional assessment a complicated and challenging undertaking due to many interacting variables occurring across large spatial and temporal scales (Weber et al., 2012). Simulation models are helpful in this regard due to their capacity to track numerous interacting variables. Once developed, a simulation model can be efficiently applied to explore the consequences various of scenarios to indicators of interest. To inform regional assessment, a simulation model should be sufficiently comprehensive to assess CE, transparent regarding its underlying assumptions, and accessible to modellers and those involved in decision-making, such as managers and stakeholders (Council of Canadian Academies, 2019).
One such model is ALCES Online (AO), a user-friendly tool designed to support decision-making by integrating landscape and population simulators. The landscape simulator can track the consequences of a variety of drivers, including mining, forestry, hydroelectric development, settlements, hydrocarbon development, agriculture, transportation networks, fire, and insect outbreaks (e.g., Schneider et al., 2010; Carlson et al., 2015; Chetkiwicz et al., 2017; Leston et al., 2020). The cell-based modelling framework is flexible with respect to resolution and study area extent, such that it can be used at a range of spatial scales. However, the tool’s ability to represent multiple drivers and simulate dynamics for extensive areas has seen the tool primarily used for large regions (thousands to hundreds of thousands of km2) to inform land-use planning (Carlson and Stelfox, 2014), conservation planning (Carlson et al., 2019), and cumulative effects assessment (Carlson et al., 2022). While most applications, including those listed above, are from Canadian studies, ALCES landscape simulations have also informed planning processes elsewhere. Examples include assessing the capacity of agricultural strategies to meet ecological and economic objectives at a biosphere reserve in Paraguay (Carlson et al., 2011) and as part of a coupled terrestrial and marine modelling framework to evaluate consequences of terrestrial land use trajectories on marine biodiversity (Boschetti et al., 2020).
AO’s population simulator also cell-based, with the population of a given cell affected by recruitment, mortality, and dispersal on a yearly time step (e.g., Rempel et al., 2021; Pellissey and Routh, 2023). Simulated landscape dynamics influence population dynamics by impacting carrying capacity through changes to habitat or impacting mortality, for example, through changes to roads and therefore hunter access. Multi-species systems can be simulated through interspecies interactions such as predation. The population dynamics component of AO is open source; details are available at popdyn.com.
The role of landscape simulation models such as AO in regional assessment is to apply available knowledge (such as that derived from BRAT) to project the consequences of threats and evaluate the capacity of management strategies (i.e., barriers) to reduce negative consequences (Mahon and Pelech, 2021). The steps required to achieve a structured exploration of threats, consequences, and barriers identified in the bowtie diagram include assembling data, defining indicator relationships, simulating cumulative effects to assess risks, assessing sensitivity to threats, and investigating management options. These are explained in the methods section 3.2.2.
3 Methodology
3.1 Study area
Northern Ontario, one of Canada’s most pristine and remote regions, is an area of global ecological significance, containing one of the largest undisturbed peatland complexes in the world (Far North Science Advisory Panel, 2010). Mining has been the main type of industrial development, and several mines are planned for a region referred to as the Ring of Fire that contains significant chromite deposits (Chetkiewicz et al., 2017). Ontario’s Far North constitutes 42% of Ontario’s land mass. The area has a human population of about 32,560 people, which is 0.2% of Ontario’s population (Chetkiewicz et al., 2017), with predominantly Indigenous communities living there in 31 communities (Far North Science Advisory Panel, 2010). Our study focuses on the Matawa Traditional Territory (Figure 3); portions of four caribou herds: Nipigon, Pagwachuan, Mississa, and Ozhiski; as well as smaller portions of three additional herds: Brightsand, Kinloch, and James Bay. The region, located at 52°58′45″N, 86°26′26″W, spans 150,000 km2 of the ecologically sensitive Hudson Bay Lowlands, which is part of the world’s second-largest contiguous peatland complex (Far North Science Advisory Panel, 2010). Some of the First Nations communities in the area are the Webequie, Nibinamik, Neskantaga, Marten Falls, and Eabametoong First Nations, though other geographically distant First Nation members may consider the region as their traditional territory (Packalen et al., 2014). The area is rich in biodiversity, supporting a diverse array of animal and plant life, including several species at risk, such as polar bears, woodland caribou, wolverine, lake sturgeon, and a variety of birds (Chong, 2014). Sphagnum bogs and fens are the dominant land cover, as well as other forested wetlands comprising stunted stands of black spruce (Picea mariana), white spruce (Picea glauca), tamarack (Larix laricina), and balsam fir (Abies balsamea). The area is in a humid high boreal climatic zone, with a mean annual temperature ranging between −2.6°C and 0°C, a mean growing season lasting between 154 and 173 days, and a mean annual rainfall of 528–833 mm (Crins et al., 2009). The Matawa Traditional Territory is, therefore, an appropriate study area for investigating threats to subsistence harvest and caribou persistence.
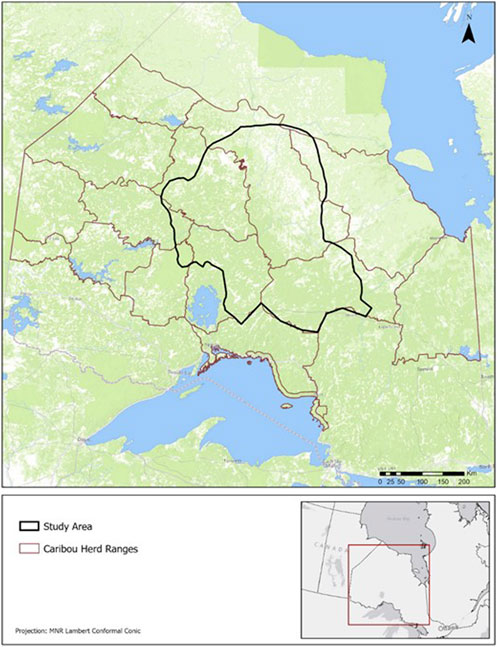
FIGURE 3. The Matawa Traditional Territory used as the study area for the case example.
The region is likely to experience significant threats from mineral extraction and associated developments, thereby requiring a comprehensive assessment of CE (Chetkiewicz and Carlson, 2013). The federal government recently decided to mandate a regional assessment in the Ring of Fire area (ECCC, 2017), with the terms of reference being negotiated with the Ontario government. There are various ongoing or planned land uses in the area, including timber production, a planned access corridor for the Ring of Fire communities, and prospective hydroelectric developments (Chetkiewicz et al., 2017). Furthermore, the large size of the region also makes it suitable for exploring the impact of climate change on wildlife habitats.
3.2 Methodological aspect
3.2.1 Case example: MWC bowtie risk diagram for the Matawa territory
The bowtie risk analysis diagram was developed through an expert workshop and further enhanced through subject matter expert consultation. For our case example, we defined the policy objectives as maintaining the opportunity for wildlife harvest by local Matawa communities while conserving wildlife populations. Wildlife is essential to northern communities’ culture and economic wellbeing. The three species studied in our case example are: moose (Alces alces), which is a vital local community’s source of food; caribou (Rangifer tarandus), a threatened and culturally important species; and wolf (Canus lupus), whose pelts have economic and cultural values (Skinner et al., 2013). Figure 4 shows the bowtie risk analysis diagram for the MWC system in the Matawa Traditional Territory that CFS-NRCAN developed at the expert workshop.
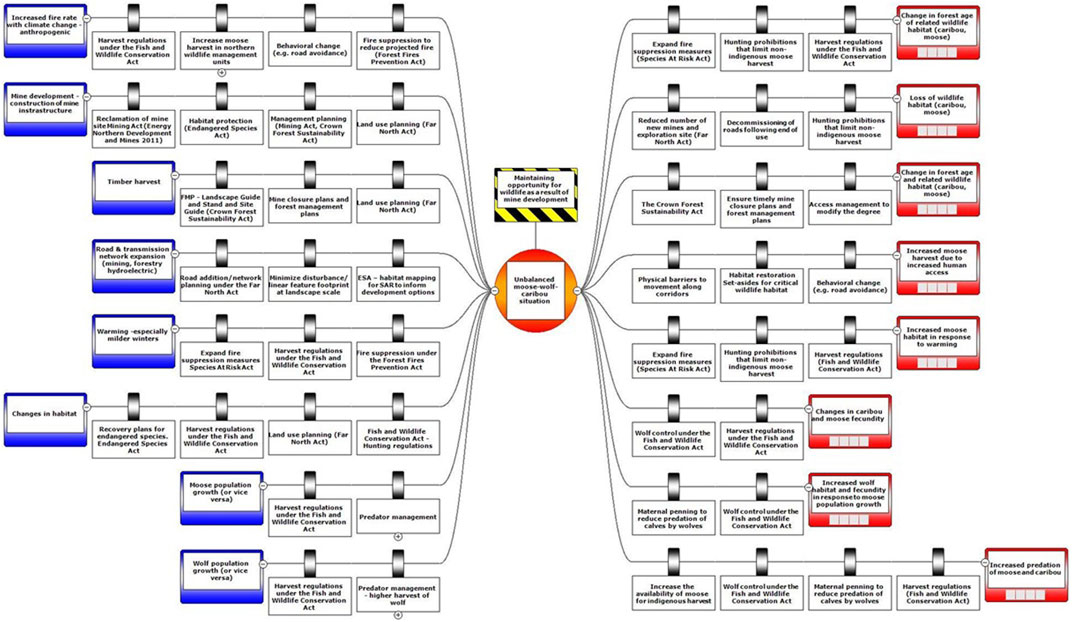
FIGURE 4. A bowtie risk diagram for the MWC system in the Matawa Traditional Territory. The hazard (yellow and black box) represents the policy objective at risk. The red and yellow circle at the centre identifies the risk event, the blue boxes at the left identify threats that contribute to the risk event, and the red boxes at the right identify consequences (impacts) of the risk event. The white boxes at the left are preventive barriers that stop or reduce the risk event. The white boxes at the right are mitigative measures that lower the magnitude/severity of the impact if the risk event occurs. See section 2.1 for more details.
The risk event we selected for the case example is an unsustainable predator-prey system. Moose, caribou, and wolves form an interrelated predator-prey system sensitive to relative abundance changes in the three species. For example, an increase in the moose population will lead to an upsurge in the abundance of wolves because moose are the primary prey of wolves (Messier, 1994; Mech et al., 2018). In turn, the increased density of wolves can cause caribou to decline due to increased wolves’ predation (James et al., 2004; Found et al., 2017). Because of the interrelated interactions of moose, wolves, and caribou, maintaining benefits to communities from the species requires maintaining balance in the predator-prey system.
The threats contributing to an unbalanced MWC system are processes and activities that can alter the habitat availability and/or mortality rate for the three species. These threats (leftmost side of Figure 4) are grouped under three main categories: changes to habitat caused by natural resource development (e.g., construction of mine infrastructure; timber harvest); changes to habitat caused by climate change (e.g., warming, especially mild winters; increased fire rate); and changes to wildlife harvest caused by road and transmission network expansion. Natural resource development in the region, including proposed mining, roads, and forestry, can alter habitat availability by converting natural land cover to industrial footprint and changing stand structures. Climate change can also alter habitat quality and the availability of habitat, both directly through changes in the location of a species’ climate envelope (the climate where a species currently lives) and indirectly through changes in the rate and severity of natural disturbances and associated shifts in forest demography and ecosystem functions. Expansions to the road network, such as those required to access proposed new mines, can increase human disturbance; alter wildlife mortality by increasing or shifting accessibility for hunters, changing animal abundance and behavior; modify natural habitats (Trombulak and Frissell, 2000; Fahrig and Rytwinski, 2009); and affect wildlife dynamics by facilitating predator movement (Demars and Boutin, 2018), e.g., facilitating the movement of wolves using linear features to prey on moose and caribou (e.g., Demars and Boutin, 2018). For example, increased habitat for moose caused by forest disturbance (Rempel et al., 1997) or warmer winters can drive the wolf population, which can cause the caribou population to decline due to elevated predation. Conversely, increased road-based hunting mortality for moose associated with road network expansion can have an adverse consequence on the wolf population and a positive consequence on caribou.
The notable consequences (rightmost side of Figure 4) of an unbalanced MWC system include the loss of wildlife habitat, reduced opportunities for subsistence harvest, and potential extirpation, especially in the case of caribou and increased moose harvest. The moose harvest rate is used as an indicator of subsistence harvest. In contrast, change in the caribou population is used as an indicator of the species’ long-term sustainability.
The preventative barriers are found within legislative framework/acts and natural/behavioural changes (see Table 2) that could be applied to reduce the risk of an unbalanced MWC system (Figure 4).
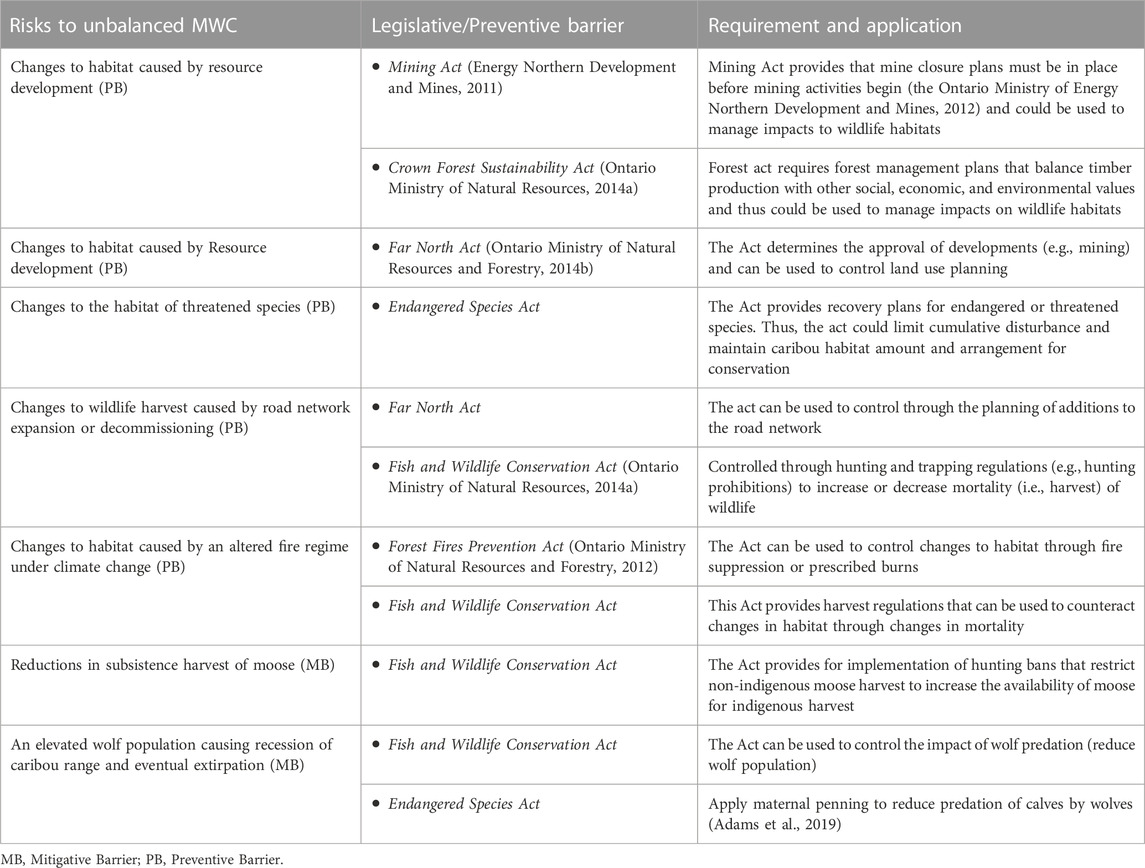
TABLE 2. Sample preventative and mitigative barriers from legislative framework/acts and natural/behavioural changes to reduce the risk of an unbalanced MWC system.
The scenario analysis that is described in the remainder of the case example simulates the impact of resource extraction, wildlife harvest, and climate change on the MWC system to assess the consequences on moose harvest and the status of wildlife populations. By manipulating the location and rate of development and the rate of moose harvest, the scenarios explore the efficacy of barriers, specifically harvest management options, identified in the bowtie risk diagram.
3.2.2 Scenario analysis for cumulative effects assessment on the MWC system in the Matawa territory
The Matawa case example is now used to demonstrate how simulations can build upon a bowtie analysis to inform regional CEA. Key steps in the scenario analysis include assembling data, defining indicator relationships, simulating cumulative effects to assess risk, and assessing sensitivity to threats.
3.2.2.1 Assembling data
Through previous initiatives (Chetkiewicz et al., 2017; Rempel et al., 2021), AO has been prepared with land cover, footprint, and climate data from across Ontario. The capacity to apply core data layers to multiple scenario analyses is a key advantage of a decision support tool such as AO, minimizing the time required to gather and organize data before assessing CE. Preparation of land cover data in particular can be time consuming due to the need to intersect numerous spatial layers. In situations where it is preferable to assemble new data sets, for example, using more recent inventories or for a new region, a script is available to reduce the number of manual steps required to intersect multiple source layers. The data sets used to characterize the Matawa Traditional Territory are summarized below and described in greater detail by Rempel et al. (2021).
• Land cover: a data set that describes present components of the landscape was prepared by intersecting the Ontario province land use database (Spectranalysis, 2004; Ontario GeoHub, 2020) with provincial footprint inventories and additional digitized features to fill in gaps in the footprint data. The anthropogenic footprint was given higher priority during the intersection. For the purpose of modelling, the resulting data set was summarized to a 1 km resolution, with the component of each cell represented by percentage coverage of natural and anthropogenic cover types.
• Forest age: data layers representing forest age and origin (i.e., burn or cut) were prepared using a forest disturbance data set from the Provincial Satellite-Derived Disturbance Mapping (PSDDM) program (Ontario Ministry of Natural Resources, 2012).
• Current and projected future temperature and precipitation were downscaled to 1 km resolution applying techniques described by Wang et al. (2016). The future climate was based on the RCP 8.5 emission scenario projected by the Second-Generation Canadian Earth System Model (Environment and Climate Change Canada, 2017). Initially considered a “worse case” pathway resulting in a predicted temperature increase of about 4.3°C by 2100, it is now considered a plausible outcome under business as usual.
3.2.2.2 Defining indicator relationships
As identified in the bowtie diagram, subsistence harvest and caribou persistence are susceptible to an imbalance in the predator-prey system caused by CE. Changes to habitat caused by various land uses and/or climate change could change the abundance of a prey species such as moose, thereby impacting the abundance of a predator species such as wolves, which can impact the abundance of other prey species such as caribou. In this manner, threats that directly impact one species can have cascading effects. Therefore, assessing the consequences of threats to wildlife requires an integrated assessment of habitat, mortality factors, and interspecies interactions. The population dynamics model in AO (referred to as PopDyn) was applied for this purpose. Population dynamics were simulated at a resolution of 10 km2 as opposed to the 1 km2 used in the landscape simulation. The coarser resolution was adopted due to the low population density of caribou and to achieve reasonable run times. Application of PopDyn to simulate the response of the predator-prey system to CE required identifying habitat relationships, vital rates (fecundity, mortality), dispersal rules, and interspecies relationships for moose, wolf, and caribou. The sources of information for these inputs are summarized here and described in greater detail by Rempel et al. (2021).
Habitat layers in PopDyn dictate the carrying capacity of each cell in the simulation grid, thereby influencing fecundity, density-dependent mortality, and dispersal. Moose habitat was calculated using a bioclimatic model for the region that includes climate (winter temperature, summer temperature, winter precipitation) and land cover (young and mature forest) as covariates (Rempel, 2011). Caribou habitat was modelled using a range-specific resource selection functions (RSFs) from the region that include land cover variables, intensity of linear feature, eskers, and burns as covariates (Hornseth and Rempel, 2016). Two ranges occurred in the study area: the Ozhiski range, which occurs predominantly in the Canadian Shield portion of the study area; and the Missisa range, which occurs predominantly in the Hudson Bay Lowlands portion of the study area. The RSFs were developed using GPS collar data for caribou ranges in northern Ontario that had sufficient data (Hornseth and Rempel, 2016). The Ozhiski range did not have sufficient data, so the seasonal RSFs for the neighbouring Kinloch range on the Shield region were used to represent habitat in Ozhiski, in part because Kinloch had similar landscape features and had linear features such as permanent roads, thereby allowing estimating effects of roads on habitat selection. The Missisa range RSF represented the Lowlands region. Performance (AUC) measures for the four seasonal models ranged from 0.072–0.76 for the Kinloch models, and 0.73–0.84 for the Missisa models. The moose and caribou habitat models were linked to landscape simulations and climate projections, such that habitat changed in response to scenarios. Wolf habitat was modeled as a function of the relative representation (abundance) of moose (Messier, 1994), the main prey for wolves.
Initial (i.e., current) populations for the species were based on winter surveys conducted by the Ontario Ministry of Natural Resources (OMNR, 2014b) between 2008 and 2012 and were interpreted as minimal animal counts. Total numbers were divided into age classes based on the expected stable age structure. The initial populations were distributed spatially based on habitat availability. Fecundity rates were based on parallel studies in the regions (Harrington et al., 1983; Walker et al., 2020), and included a density-dependent component. Random variation was also included when simulating fecundity to represent variability in environmental conditions. Annual dispersal distances were determined based on GPS collar data and research from Ontario. Simulations considered five sources of moose mortality, four sources of caribou mortality, and two sources of wolf mortality. Mortality rates were based on data, literature, and, when necessary, consultation with experts. In order to model wolf predation rate, we employed a functional response to simulated wolf density per cell using a relationship from Messier (1994). With the exception of density dependent mortality, other mortality rates were assumed constant.
3.2.2.3 Simulating cumulative effects to assess risk
Threats identified in the bowtie diagram include changes in habitat caused by resource development and climate change and changes to wildlife harvest caused by road network expansion. A comprehensive accounting of the CE of these threats required simulation of the major (mining, hydroelectric) and minor (forestry) natural resource industries in the region and associated infrastructure (roads, transmission lines), as well as the fire regime in the presence of climate change. The landscape simulation model in AO (referred to as Mapper) was applied for this purpose. Simulations were 50 years in length and applied assumptions for land use and fire that were informed by management plans, previous assessments, experts (Rempel et al., 2021), and proposed resource developments in the region. The resulting scenario is referred to as business as usual (BAU), the assumptions for which are described here.
The mining trajectory incorporated the exploration and development of seven mines in the Ring of Fire area (Big Daddy, Black Creek, Black Thor, Butler, Eagle’s Nest, McFaulds Lake, and Wabassi) and two additional mines in the south (Hardrock and Albany Graphite). An all-season road was created to link the Ring of Fire to highway 643 to the south. Additional roads were created to link northern communities (Fort Hope, Attawapiskat, Winisk Lake, Marten Falls) and new mines to the expanded road network. Hydroelectric development assumptions were informed by a previous scenario analysis completed for the Far North (Chetkiewicz et al., 2017). They included one dam along the Kabinakagami River, four along the Albany River, one along the Winisk River, and transmission line segments linking the dams to the transmission line network located outside of the area studied. Timber harvest assumptions were based on forest management plans for the six units of forest management (Hearst, Nagagami, Big Pic, Kenogami, Ogoki, Lake Nipigon) that partially overlapped the southern part, and used an aggregated block schedule to characterize forestry parameters for caribou range. Permanent roads were generated to connect harvest blocks to the road network, and temporary (20-year) roads were created to access timber within harvest blocks. The simulated fire regime assumed an increasing rate of disturbance under representative concentration 8.5 (Boulanger et al., 2014), a spatial pattern affected by the type and age of land cover (Bernier et al., 2016), and a size class distribution informed by fire data from the region over the past 20 years. Climate (temperature, precipitation) projections for the representative concentration pathway (RCP) 8.5 emission scenario from the Second-Generation Earth System Model (Environment and Climate Change Canada, 2017) were downscaled to a resolution of 1 km across the study area using Wang et al. (2016) methodology.
3.2.2.4 Assessing sensitivity to threats
To compare the impact of the threats (resource development, climate change, harvest), a series of scenarios under No Development, Low Development, and Increased Moose Harvest were simulated in which the threats were manipulated independently relative to the CE scenario described under the business as usual (BAU) scenario.
• The No Development scenario simulated the influence of climate in the absence of development.
• The Low Development scenario simulated the influence of resource development by applying a lower rate of mine development, reducing the area of new mine and exploration footprint by about half (45.4 km2 compared to 23.6 km2).
• The Increased Moose Harvest scenario simulated the influence of wildlife harvest by increasing moose harvest by 50% compared to the BAU scenario.
4 Results and discussion
4.1 The behaviour of the multispecies model to assess indicator relationships
The performance of the multispecies MWC population dynamics model was tested using a 50-year simulation in which climate remained static at current conditions, no new resource extraction or related infrastructure (e.g., timber harvest, mining, roads network, etc.) were applied, and fire occurred at the historical (1959–1999) rate. The moose population remained constant during the simulation at around 12,000, whereas the wolf population increased by approximately 100 (14%) during the first decade before leveling off at about 800. The initial increase in wolves suggests that the current population may not yet have adjusted to the moose population, which is expected if the moose population has recently shifted northwards in response to climate change (Rempel, 2011) and to the early seral-stage forest created by timber harvest. In response to wolf population growth, the caribou population declined over the first two decades before stabilizing at approximately 2,750. The lag in the stabilization of the caribou population was due to the time needed for the caribou population to attain a steady state dictated by the wolf predation rate. Caribou population decline during the first two decades of the simulation was focused on the southern half of the range, following the observed pattern of range recession in the province (Schaefer, 2003). The behaviour of the multispecies model was judged to be reasonable given that it produced stable populations of the three species in the absence of changing conditions. Further to predicting the behaviour of the model, the simulation also provided a baseline to interpret risk associated with scenarios that incorporate threats such as land use and climate change.
4.2 Cumulative effects of disturbances on MWC system
The anthropogenic footprint increased by 223 km2 (from 416 to 639 km2) during the simulation (Figure 5A). Forestry roads accounted for most of the new footprint in the southern part, although the 603 km increase was relatively minor (3.4%) relative to the existing forestry road network. In contrast, mining and associated infrastructure accounted for most of the new footprint in the north. Young forests (<30 years) also became more abundant, increasing from 9,541 to 24,267 km2 in response to a rising fire rate and, in the south, timber harvest (Figure 5B). The most pronounced change projected for the study area was temperature, with an average annual temperature rising from −0.2°C to 4.0°C (Figure 5C). The elevated temperature and abundant young forest drove the moose population growth such that abundance was 36% higher compared to the baseline after the simulation (16,774 compared to 12,369; Figure 6A).
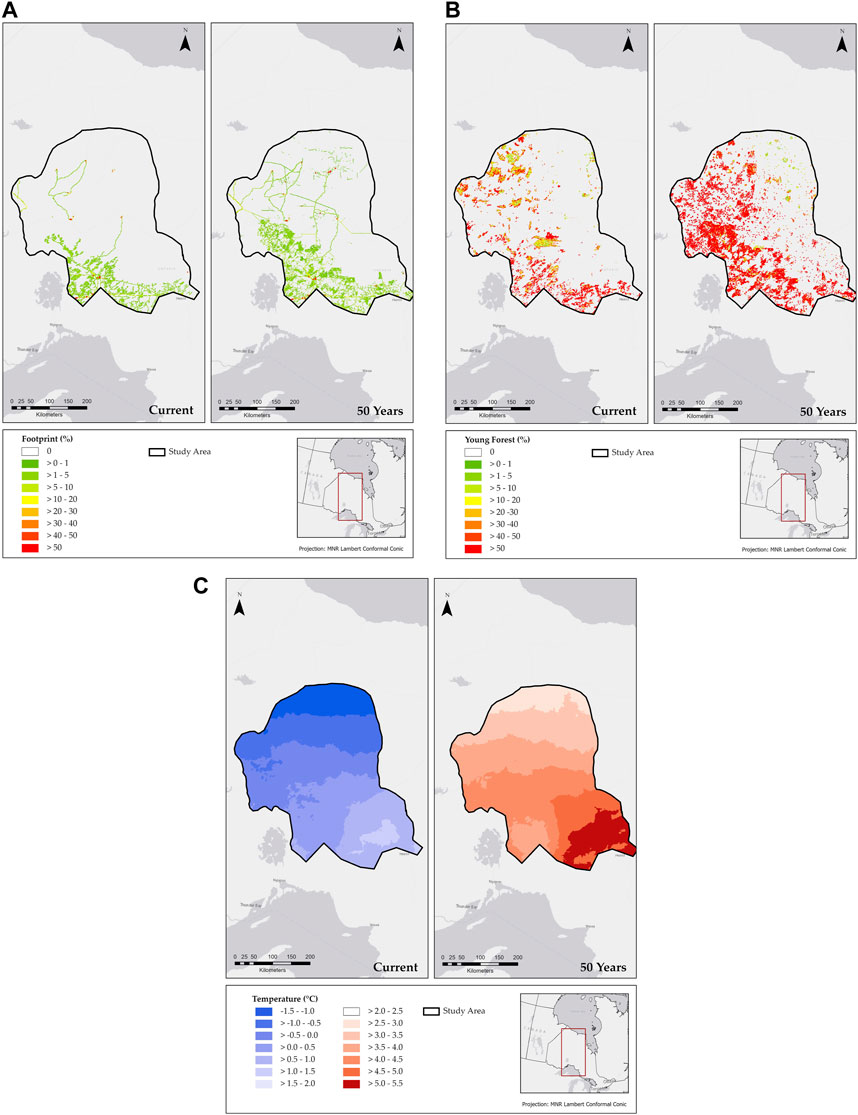
FIGURE 5. (A–C) Current and simulated future anthropogenic footprint, young forest, and average annual temperature.
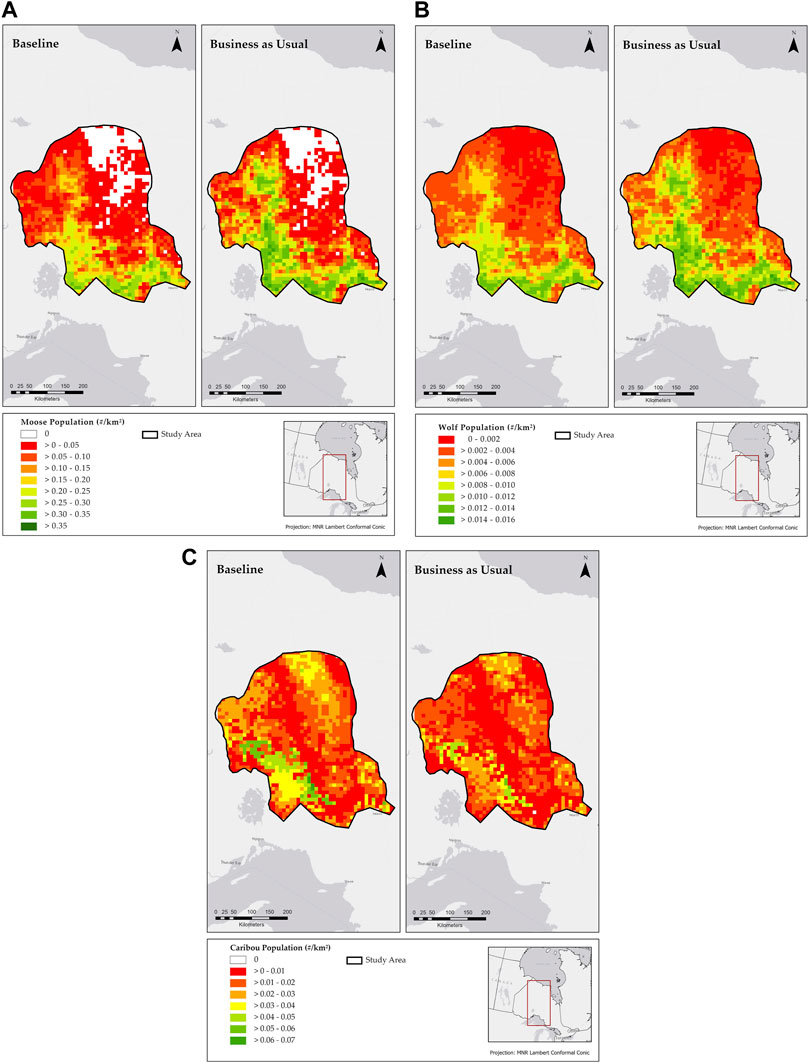
FIGURE 6. (A–C) Moose, Wolf and Caribou population density of a 50-year simulation of baseline and business as usual (BAU) scenarios.
Growth in the moose population was most apparent to the west, where warmer winters combined with frequent forest fires improved moose habitat (Figure 6A). With the large moose population, the harvest of moose by Indigenous communities also increased relative to the baseline (1,674 compared to 1,237, Figure 7A). Increased availability of prey resulted in the wolf population showing a similar pattern to moose: 22% population growth relative to the baseline (877 compared to 720; Figure 7B) that was focused in the west (Figure 6B). Increased predation by wolves drove a 22% decline in the caribou population relative to the baseline (2,100 compared to 2,703; Figure 7C), with the decline again most prevalent in the west (Figure 6C). Caribou habitat (i.e., probability of use) was less sensitive to the scenario, declining by only 5% relative to the baseline, thereby demonstrating the dominant role of predation as opposed to habitat in the simulated drop in the caribou population.
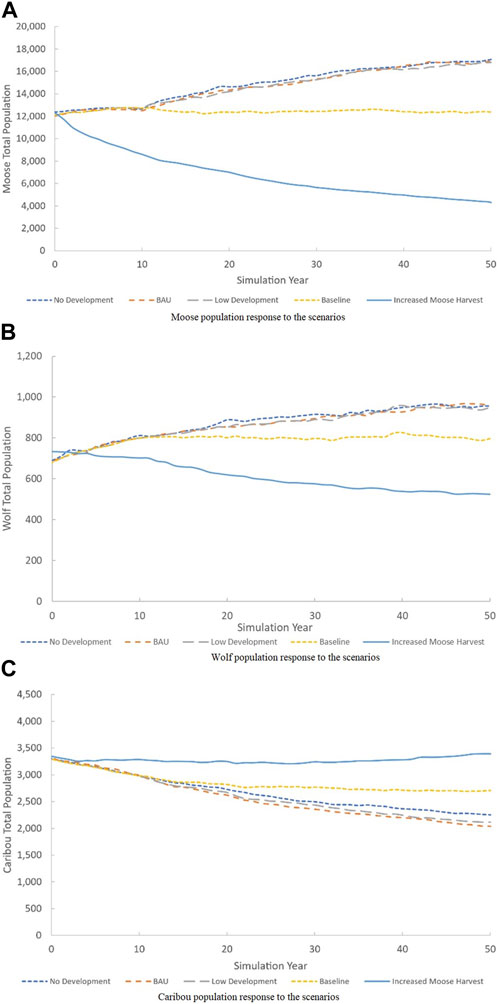
FIGURE 7. (A–C) Moose, Wolf, and Caribou population response to the scenarios described in the sections define indicator relationships, simulate cumulative effects to assess risk, and assess sensitivity to risk.
In summary, the CE of threats is projected to disrupt the MWC system, with moose and wolves increasing in abundance and caribou decreasing in abundance. As a result, a negative consequence is that risk to caribou is projected to increase in the presence of plausible resource development and climate trajectories. A positive consequence is that Indigenous moose harvest is also projected to increase. In the next section, the effect of each threat on the MWC system is compared to three different scenarios to help identify management priorities for preventing or mitigating the caribou population decrease.
4.3 Scenario outcomes of MWC system
Under a No Development scenario, the study observed more caribou than when development was included (2,294 compared to 2,100); Figure 7, shows the negative effect of development. However, the scenario also demonstrates the important role of climate change, given that the caribou population still declined by 15% relative to the baseline (2,294 compared to 2,703; Figure 7), even without development. A beneficial outcome of climate change is that indigenous moose harvest increased by 36% relative to the baseline (1,679 compared to 1,237).
The Low Development scenario only achieved a slight reduction in the rate of caribou population decline. Under this scenario, the caribou population declined by 20% relative to the baseline (2,152 compared to 2,703; Figure 7), which was only marginally lower than the 22% decline when resource development was higher. The lower rate of development had a similar effect on indigenous moose harvest as the BAU scenario (1,674 compared to 1,650).
The caribou population under the Increased Moose Harvest responded favorably, leading to a 20% increase in the caribou population compared to the baseline (3,256 compared to 2,703; Figure 7). Growth in the caribou population was due to a 62% decline in the moose population relative to the baseline (4,680 compared to 12,369; Figure 8A), with negative implications for the wolf population. However, a negative effect of the increased moose harvest scenario was that the Indigenous moose harvest declined. By the end of the simulation, Indigenous moose harvest was 711 under the increased harvest scenario compared to 1,674 for the BAU scenario and 1,237 for the baseline scenario. The decline in Indigenous moose harvest despite an increase in the overall harvest rate demonstrates that the moose population is susceptible to overharvest, with negative implications for subsistence wildlife harvest.
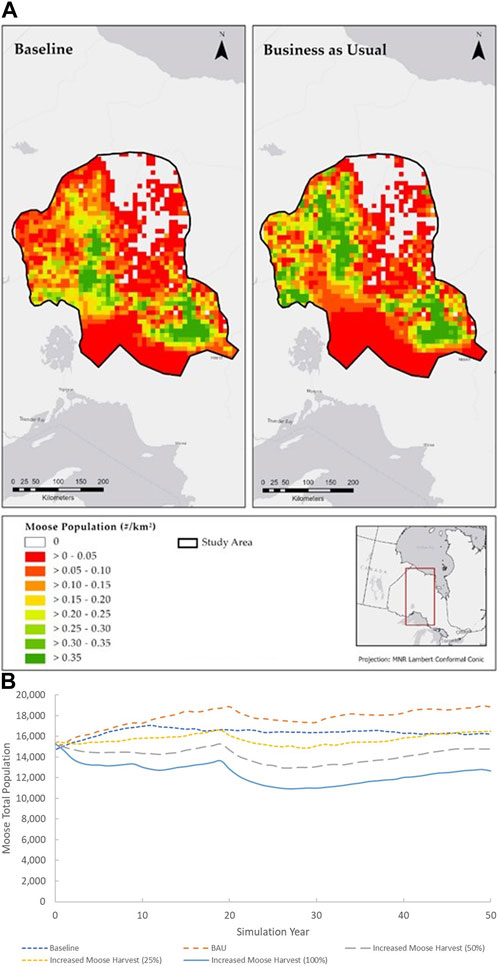
FIGURE 8. (A, B) Population density of 50-year simulations of baseline and business as usual (BAU) scenarios that incorporate the harvest proximity index.
In summary, the scenarios demonstrated that climate change was responsible for much of the projected disruption of the MWC system due to its positive effect on moose and, as a result, its negative effect on caribou through apparent competition between the species (i.e., indirect interactions resulting from both moose and caribou being preyed upon by the common predator, wolves). In comparison to climate change, resource development had a minor effect on population dynamics. The importance of the climate change threat is problematic because the trend toward warmer winters informed by global processes cannot be directly controlled. However, a promising strategy is increased moose harvest, which was shown to avoid caribou population declines through climate change by controlling the population growth of moose and consequently, controlling the increase in the wolf population, which is a primary predator of moose. However, an apparent trade-off is that an increase in the rate of moose harvest can negatively affect hunting by Indigenous communities by reducing the moose population beyond the limits of maximum sustainable yield.
A limitation of these exploratory simulations is that they did not incorporate the effect of road network expansion on wildlife harvest, which is likely an important consideration given the sensitivity of the MWC system to moose mortality. Indeed, the effect of resource development on wildlife harvest may be as important as its effect on habitat, given the higher sensitivity of population dynamics to increased wildlife harvest than increased resource development in the simulations. In the next section, moose harvest is assessed in greater detail as a preventative barrier by incorporating the effect of road density and simulating a wider range of harvest levels to identify a balance between reducing caribou mortality and maintaining opportunities for Indigenous moose harvest.
4.4 Cumulative effects of management options towards sustainable MWC system
Investigating wildlife harvest in greater detail as a management option required that moose harvest be functionally linked to linear disturbances in the simulations. This results in a more realistic representation of how moose harvest, and therefore the MWC system, may change spatially and temporally in response to natural resource development. In the exploratory simulations presented earlier, moose mortality due to harvest was applied at a constant rate across the entire study area, regardless of proximity to linear footprints (roads, transmission lines). However, proximity to linear footprints can provide access for hunters and facilitate the movement of ungulates, leading to their higher concentration at and near linear features. As such, the simulations likely under-represented moose mortality in areas with increased accessibility and over-represented moose mortality in areas without linear footprints. Perhaps more importantly, the simulations were ill-equipped to assess the interaction between road network expansion and moose mortality. Hence, moose mortality was modified by applying a harvest proximity index to non-Indigenous moose hunting. The negative linear relationship was described as a lookup table, where harvest was modified for distances of 0, 4, 8, and 12 km from an anthropogenic linear feature by a factor of 1.5, 1.0, 0.25, and 0, respectively. These values were finalized through iteration, aiming to increase the harvest rate near the road but maintain a similar overall harvest rate as would occur without the proximity index. Thus, for distances <4 km from a linear feature, the non-Indigenous harvest rate was elevated above the regional average, and for distances >4 km, harvest decreased linearly. Although moose harvest tends to be concentrated within 1 km of roads (Courtois and Beaumont, 1999; Shanley and Pyare, 2011), moose harvested near linear features occupy home ranges that extend far beyond a 1 km distance from the road. Moose have home ranges that average about 36 km2 and may be even more significant in environments like the Far North, with low browse productivity rates. Consequently, the index equaled 1.5 (50% increase in harvest) when closest to linear features (<0.4 km), a factor of 1 at 1.2 km, and dropped to an aspect of 0.1 (i.e., negligible harvest) when linear features were farther away than 3 km. The harvest proximity index was not applied to Indigenous moose harvest because Indigenous hunters were assumed to be more capable of accessing areas distant from roads. The index was also not applied to caribou harvest because it is associated with indigenous hunters. Furthermore, caribou may avoid linear features as they can be associated with a higher risk of wolf predation (DeMars and Boutin, 2018), although others have found caribou to be attracted to linear features (Superbie et al., 2022).
Scenarios were simulated to explore the effect of the harvest proximity index at four levels of harvest: current (i.e., as per the BAU scenario), +25% (i.e., relative to BAU), +50%, and +100%. In addition, the harvest proximity index was applied to the scenario without resource development or climate change to provide an updated baseline estimate. The consequences of the five scenarios to the moose and caribou populations and Indigenous moose harvest are described next.
The spatial distribution of moose harvest changed substantially when the harvest proximity index was applied, aggregating in the southern, where forestry roads provide abundant access. The contrast in harvest levels caused a reduction in the moose population in the south but allowed population growth in the north, where harvest was insufficient to offset the positive effect of climate change on habitat (Figure 8A). Overall, there was still a net increase in the moose population, and, as a result, Indigenous moose harvest almost doubled under the BAU scenario relative to the baseline (894 compared to 449; Figure 8B).
The impact of the BAU scenario on the caribou population was less when the harvest proximity index was used to model moose harvest in the area studied. Interestingly, however, the reduced sensitivity of caribou to the BAU scenario was due to a stable caribou population in the southern part where moose were all but extirpated by high harvest pressure (Figure 9A). The simulated pattern of a stable caribou population in the south and population decline in the north is contrary to the historical pattern of range recession from the south (e.g., Schaefer, 2003) and requires greater investigation to validate. The pattern may be unrealistic if white-tailed deer (Odocoileus virginianus) expand into the southern part (Kennedy-Slaney et al., 2018) and support a high wolf population (Latham et al., 2011). In the northern part of the area studied road network expansion was insufficient to control moose population growth through increased harvest, such that the caribou population declined. To address the concern that the projected caribou population increase in the southern part may be unrealistic, caribou population outcomes for the scenarios described in this section are limited to the Ozhiski and Mississa caribou ranges located in the northern part and overlap with the Ring of Fire. At that scale, the population of caribou declined by 19% under BAU relative to the baseline (2,041 compared to 2,709; Figure 9B).
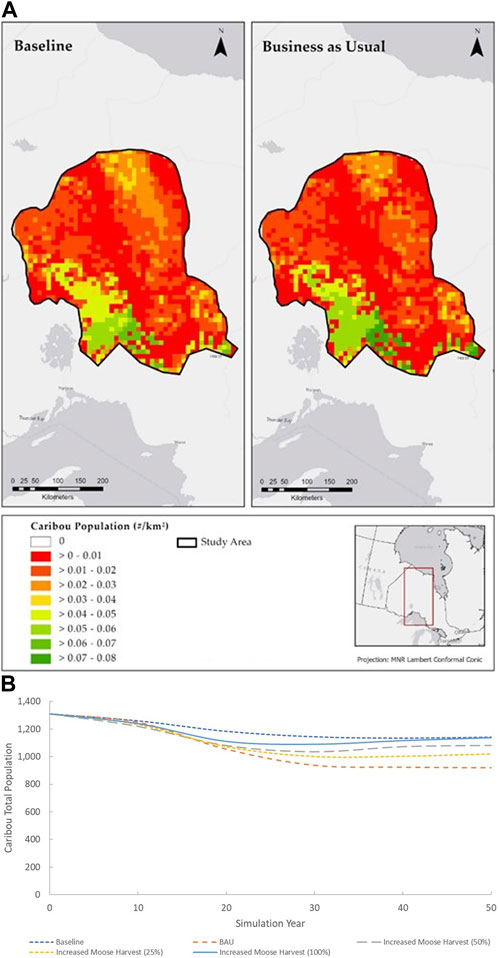
FIGURE 9. (A, B) Caribou population density and response to scenarios incorporating harvest proximity index.
Increasing the rate of moose harvest by 25% reduced the caribou population decline by half to 10% relative to the baseline. Increasing the rate of moose harvest further to 50% reduced the caribou population decrease to just 5% relative to the baseline, and doubling the rate of harvest prevented the decline altogether (Figure 9B). As such, the scenario suggests that elevated moose harvest (non-Indigenous or Indigenous hunting) has the potential to prevent caribou population decline that is projected to occur due to climate change. Lag effects, however, are important to consider in such prey reductions. For example, Serrouya et al. (2015) found that when a caribou predator’s main prey is reduced suddenly, the predator may initially increase its predation rate on the secondary prey (caribou). Thus, there is a lag period before the intended effect of reduced predation occurs. However, under an MWC system, when moose were reduced gradually, the wolf population declined in synchrony, along with predation rates on moose. An additional negative consequence of sudden moose reduction emerging from the simulation that is soon led to reduced Indigenous moose harvest caused by long-term moose population decline. In the end, Indigenous moose harvest was 13% lower than BAU when the rate of moose harvest was increased by a factor of 1.25, 23% lower than BAU when the rate of moose harvest was raised by a measure of 1.5, and 39% lower than BAU when the rate of moose harvest was increased by 2.
To summarize, linking moose harvest to a linear footprint resulted in a rather complicated influence of resource development and harvest on the MWC system. Under the BAU scenario, moose were all but eliminated in the heavily accessed south of the area studied due to high mortality from hunting. In the more remote north, the moose population increased because the harvest was insufficient to offset increased fecundity as habitat improved with climate change. Moose population growth pattern north of the area studied and the decline in the southern part is consistent with current provincial survey data (Ontario Ministry of Natural Resources and Forestry, 2014b). In response to the simulated moose population trajectory, the caribou population declined in the north and remained stable in the south, a pattern that could change to caribou population decline throughout the study area if white-tailed deer become the dominant ungulate (instead of moose), or white-tailed deer add to the prey base. The system was sensitive to elevated moose harvest, with positive and negative consequences. In the north, a higher harvest rate was sufficient to control moose population growth despite the low road density, with positive implications for caribou. In the south, however, abundant access and increasing moose harvest levels above current tag allocations led to the near extirpation of moose, and increasing moose harvest rate had a negative impact on Indigenous moose harvest. As such, the scenario analysis suggests that moose harvest can promote balance in the MWC system but only if applied in a sophisticated manner that limits moose harvest in areas with high road density, increases moose harvest in more remote areas that may be susceptible to moose population expansion with climate change, and prioritizes Indigenous moose harvest to ensure a sustainable supply of moose for subsistence harvest.
4.5 Implication of risk outcome, limitations, and lessons for future studies
Our results from the simulation are consistent with other reported results in the literature. For example, the decline in caribou for the model is similar to the decline reported by the Ontario Ministry of Natural Resources and Forestry (2014b) for the Missisa and Ozhiski caribou ranges. In their population viability model of the caribou/wolf system in northern Ontario, Fryxell et al. (2020) also projected declines in caribou populations due to development-related increases in wolf predation risk. In a 3-species model of moose, wolf, and caribou for ranges in Alberta and Quebec, Johnson et al. (2019) also found wolves drove the caribou population response. In Alberta, Barber et al. (2018) found that changing landscapes resulting from climate change will increase the risk to caribou as conditions for alternate wolf prey and white-tailed deer also increase. The simulated expansion of moose carrying capacity and moose population abundance is consistent with the expansion of the moose population observed in Alaska, where Tape et al. (2016) attribute this to climate change causing increased moose to browse production from riparian shrubs. A cautionary note, however, is that moose may not response equally to fire disturbance among forest types (DeMars et al., 2019). The role of wolf predation in modulating moose response to climate change has been reported by others, where wolves kept the moose population from experiencing precipitous increases and decreases (Wilmers et al., 2007).
The simulated management options are also generally consistent with adaptive management field experiments, where Serrouya et al. (2019) found that caribou populations in British Columbia exhibited a reduced rate of decline when moose populations were reduced by 40% and that caribou decline was avoided when moose populations were reduced by 70%. In an experimental study in BC where elevated moose harvest resulted in a decline in the moose population by 70%, wolf numbers declined (as a result of increased dispersal), and caribou adult survival increased from 0.78 to 0.88 in the treatment area (Serrouya et al., 2017).
While consistent with such reported results, our modelling provided novel perspectives on the MWC system. Incorporating the effects of climate change, habitat dynamics, vital rates, and interspecies interactions in the modelling made it possible to comprehensively assess the numerous threat pathways that potentially affect the interrelated objectives of conserving caribou and sustaining indigenous moose harvest. The caribou ranges in Ontario are large, remote, and virtually roadless relative to ranges where experimental manipulations have occurred, and so adaptive management conservation experiments in such areas are logistically difficult, very expensive, and potentially risky. As Serrouya et al. (2015) express, simulation experiments offer a safer and more feasible alternative to field experiments to explore the effectiveness of potential management actions, and in our case, simulation can include dynamic interactions among multiple species and climate effects. For example, contrary to expectations, our simulations identified warming as opposed to development footprint or fire as the most influential threat due to its potential to increase moose and, thereby, predation of caribou by wolves in the northern part of the study area. Spatial simulation of moose harvest identified it as a promising management strategy but also problematic due to the risk of negatively affecting indigenous moose harvest in roaded areas and, conversely, being ineffective at controlling moose and, therefore, wolf predation in remote areas.
In summary, the holistic and spatial nature of the dynamic spatial simulations provided the insight that careful application of moose harvest in remote areas while controlling harvest in roaded areas is a promising management strategy to conserve caribou while maintaining the opportunity for Indigenous harvest of moose. The MWC system is complex and while simulations captured key dynamics, future analyses should explore additional components not addressed by the scenario analysis presented in this case example. Among these are white-tailed deer range expansion (Latham et al., 2011; Kennedy-Slaney et al., 2018). Deer population growth in northern Ontario could elevate wolf populations, with negative implications for caribou. For example, studies in Alberta found that climate change was a primary driver of range expansion for white-tailed deer in the northern extent of its range (Dawe et al., 2014; Dawe and Boutin, 2016). Deer population growth could also negatively affect moose due to competition and increased risk of parasites such as meningeal brain worms and liver fluke (Escobar et al., 2019). The scenario analysis could also be expanded to evaluate the full range of management practices identified in the bowtie diagram. The described scenarios focused on moose harvest because exploratory simulations were sensitive to this management lever and would likely be easier to implement (i.e., through harvest regulations) than the mitigative barriers of wolf control and maternal penning (Adams et al., 2019). However, wolf control and maternal penning of caribou could be explored as emergency measures for caribou conservation, and additional simulations should evaluate their potential effectiveness before implementation (Johnson et al., 2019; Serrouya et al., 2019). Future research should also investigate influential system components in greater detail to bracket uncertainty and verify assumptions. The influence of roads on moose harvest, especially in remote environments such as the Far North, should be explored, given the sensitivity of simulation outcomes to the harvest proximity index. Moreover, since some local communities may grow as mining activity develops and leads to an increase in housing and infrastructure, future studies should integrate preventative/mitigative barriers into the bowtie risk analysis, e.g., the impact of local rules and zoning regulations that prevent development on land set aside for habitat. Finally, given the influence of climate change on moose and, therefore, caribou, the implication of a more moderate climate change scenario (e.g., RCP 4.5) should be assessed, as well as the negative effects of climate change on moose, such as higher winter tick (Dermacentor albipictus) loads resulting in coat degradation causing higher mortality rates. Monitoring (e.g., moose surveys) should be designed to track potential population expansion to the north.
5 Conclusion
The CE of climate change and resource exploitation can cause an unprecedented rate of change to ecosystems in northern Ontario’s Ring of Fire region. Maintaining environmental and community values in the presence of such change will require a comprehensive understanding of potential long-term risks and opportunities to prevent or mitigate those risks. The case example presented in this article shows the role of conceptual and quantitative modelling in advancing strategic perspective.
BRAT provided the mechanism to define the management problem by identifying threats that contribute to risk and the consequences of that risk. More importantly, bowtie diagram development provided a systematic and rigorous conceptual framework for identifying opportunities to prevent or mitigate risk, including identifying a legislative framework that exists to pursue those opportunities. Through the bowtie diagram prepared for the case example, various management strategies were identified that could be pursued under Provincial legislation to prevent or mitigate the imbalance in the MWC system. Insight into which strategy to pursue required additional information to quantify the magnitude of the risk and the positive and negative implications of management options. The ALCES simulation was used to estimate these parameters by simulating the long-lasting (five decades) impacts of the threats identified by the bowtie diagram across a range of management actions. Notably, the simulation model handled system dynamics, incorporating land use, fire, climate change, inter-species interactions, and wildlife harvest.
Simulation modelling of multiple management scenarios allowed for a more comprehensive examination of the complex processes driving the social-ecological system. For example, the simulations demonstrated that climate change could increase moose populations with positive implications for Indigenous moose harvest but negative implications for caribou populations. Road construction from natural resource development is likely to decrease caribou habitat (Brown et al., 2007; Newton et al., 2017); however, our results suggest there is an opportunity to mitigate some of these impacts through the increased accessibility to moose harvest offered by the expanded road network. The negative effect of resource exploitation on habitat in the Ring of Fire was smaller than the impact of climate change. Roads associated with development may indirectly help mitigate the impact of climate change if they positively contribute to moose mortality through increased harvest. However, the simulations also demonstrated that a high rate of moose harvest can cause a steep decline in the moose population in areas that have high road network density and diminish opportunities for Indigenous harvest by reducing moose availability. This nuanced understanding of the relative importance of threats, and trade-offs associated with management options, suggests that a sophisticated moose harvest regime that increases harvest in the Far North and prioritizes Indigenous harvest is a promising opportunity to control moose population growth to impede caribou population decline.
Our study demonstrates the bowtie risk assessment method and ALCES as complementary modelling approaches that can be applied in an SDM framework to jointly provide the information required for regional assessment. BRAT provides a structured yet accessible modelling approach that can be done in a workshop environment. As such, it provides a tool to build agreement among diverse actors over the strategic formulation of the management problem. This strategic formulation includes the management objective, threats, risk events, consequences, and mitigation opportunities. The strategic formulation bounds the management problem and links it to the existing policy to identify opportunities for future decisions to influence the issue. Scenario analysis using a simulation model provides an approach to build upon the strategic formulation by assessing the importance of threats and the effectiveness of mitigation options. To meet the needs of regional assessment, the scenario analysis should be flexible with respect to the threats and consequences that are assessed and broad with respect to spatial and temporal scales. The analysis should also be accessible to engage and inform a wide range of actors. ALCES can be described as meeting these needs.
Data availability statement
The original contributions presented in the study are included in the article/Supplementary Material, further inquiries can be directed to the corresponding author.
Author contributions
EA: Conceptualization, development or design of methodology; creation of models, writing–original draft, visualization, supervision, RR: Conceptualization, design of methodology; writing–original and final draft preparation. MC: Conceptualization, design of methodology; writing–original and final draft preparation. JB-D: Conceptualization, design of methodology; writing–original and final draft preparation. RW: Conceptualization, reviewing and editing. AD: Conceptualization; writing–original draft preparation WO-B: Conceptualization, design of methodology; review and editing. EB: Conceptualization; writing–reviewing and editing. IE: Conceptualization; writing–reviewing and editing. All authors contributed to the article and approved the submitted version.
Conflict of interest
Author RR was employed by FERIT Environmental Consulting. Author MC was employed by ALCES Landscape and Land Use.
The remaining authors declare that the research was conducted in the absence of any commercial or financial relationships that could be construed as a potential conflict of interest.
Publisher’s note
All claims expressed in this article are solely those of the authors and do not necessarily represent those of their affiliated organizations, or those of the publisher, the editors and the reviewers. Any product that may be evaluated in this article, or claim that may be made by its manufacturer, is not guaranteed or endorsed by the publisher.
References
Adams, L. G., Farnell, R., Oakley, M. P., Jung, T. S., Larocque, L. L., Lortie, G. M., et al. (2019). Evaluation of maternal penning to improve calf survival in the Chisana caribou herd. Wildl. Monogr. 204 (1), 5–46. doi:10.1002/wmon.1044
Antwi, E. K., Boakye-Danquah, J., Owusu-Banahene, W., Webster, K., Dabros, A., et al. (2022). A Global review of cumulative effects assessments of disturbances on forest ecosystems. J. Environ. Manage. 317, 115277.
Antwi, E. K., Boakye-Danquah, J., Owusu-Banahene, W., Dabros, A., Eddy, I., Silver, D. A., et al. (2023). Risk assessment framework for cumulative effects (RAFCE). Front. Environ. Sci. 10, 1055159.
Barber, Q. E., Parisien, M.-A., Whitman, E., Stralberg, D., Johnson, C. J., St-Laurent, M.-H., et al. (2018). Potential impacts of climate change on the habitat of boreal woodland caribou. Ecosphere 9, e02472. doi:10.1002/ecs2.2472
Bernier, P. Y., Gauthier, S., Jean, P.-O., Manka, F., Boulanger, Y., Beaudoin, A., et al. (2016). Mapping local effects of forest properties on fire risk across Canada. Forests 7, 157. doi:10.3390/f7080157
Boschetti, F., Lozano-Montes, H., and Stelfox, B. (2020). Modelling regional futures at decadal scale: Application to the kimberley region. Sci. Rep. 10 (1), 849–911. doi:10.1038/s41598-019-56646-x
Boulanger, Y., Gauthier, S., and Burton, P. J. (2014). A refinement of models projecting future Canadian fire regimes using homogeneous fire regime zones. Can. J. For. Res. 44, 365–376. doi:10.1139/cjfr-2013-0372
Carlson, M., Browne, D., and Callaghan, C. (2019). Application of land-use simulation to protected area selection for efficient avoidance of biodiversity loss in Canada’s western boreal region. Land Use Policy 82, 821–831. doi:10.1016/j.landusepol.2019.01.015
Carlson, M., Mitchell, R., and Rodriguez, L. (2011). Scenario analysis to identify viable conservation strategies in Paraguay’s imperiled Atlantic Forest. Ecol. Soc. 16 (3), art8. doi:10.5751/es-04267-160308
Carlson, M., Quinn, J., and Stelfox, B. (2015). “Exploring cumulative effects of regional urban growth strategies: A planning scenario case study from the calgary region of western Canada,” in International society of city and regional planners (ISOCARP) review 11.
Carlson, M., and Stelfox, J. B. (2014). “Alberta oil sands development and risk management of Canadian boreal ecosystems,” in Peak oil, economic growth, and wildlife conservation (Berlin: Springer), 219–244.
Carlson, M., Young, H., Linnard, A., and Ryan, M. (2022). Supplementing environmental assessments with cumulative effects scenario modeling for grizzly bear connectivity in the Bow Valley, Alberta, Canada. Environ. Manag. 70, 1066–1077. doi:10.1007/s00267-022-01720-w
Chetkiewicz, C.-L. B., Carlson, M., O'Connor, C. M., Edwards, B., Southee, F. M., and Sullivan, M. (2017). “Assessing the potential cumulative impacts of land use and climate change on freshwater fish in northern Ontario,” in Wildlife conservation society Canada conservation report No. 11 (Toronto, Ontario, Canada: Wildlife Conservation Society Canada).
Chetkiewicz, C., and Carlson, M. (2013). A fork in the road, future development in Ontario's Far North.
Chong, J. (2014). Resource development in Canada: A case study on the ring of fire. Ottawa: Library of Parliament.
Cormier, R., Elliott, M., and Rice, J. (2019). Putting on a bowtie to sort out who does what and why in the complex arena of marine policy and management. Sci. Total Environ. 648, 293–305. doi:10.1016/j.scitotenv.2018.08.168
Corvalán, C. F., Kjellström, T., and Smith, K. R. (1999). Health, environment and sustainable development: Identifying links and indicators to promote action. Epidemiology 10, 656–660. doi:10.1097/00001648-199909000-00036
Council of Canadian Academies (2019). “Greater than the sum of its parts: Toward integrated natural resource management in Canada,” in The expert Panel on the state of knowledge and practice of integrated approaches to natural resource management in Canada (Ottawa, ON: Council of Canadian Academies).
Courtois, R., and Beaumont, A. (1999). The influence of accessibility on moose hunting in northwestern Quebec, 41+. in Alces.
Creed, I. F., Cormier, R., Laurent, K. L., Accatino, F., Igras, J., Henley, P., et al. (2016). Formal integration of science and management systems needed to achieve thriving and prosperous Great Lakes. BioScience 66 (5), 408–418. doi:10.1093/biosci/biw030
Crins, W. J., Gray, P. A., Uhlig, P. W. C., and Wester, M. C. (2009). The ecosystems of Ontario, Part 1: Ecozones and ecoregions. Sault Ste Marie, ON: Ontario Ministry of Natural Resources.
Dammers, E., and Evers, D. (2008). Beyond heuristics: Applying scenarios to European territorial development. Tijdschr. Econ. Soc. Geogr. 99, 629–635. doi:10.1111/j.1467-9663.2008.00498.x
Dammers, E., van’t Klooster, S., de Wit, B., Hilderink, H., Petersen, A., and Tuinstra, W. (2019). Building scenarios for environmental, nature and spatial planning policy: A guidance document. The Hague: PBL Netherlands Environmental Assessment Agency.
Dawe, K. L., Bayne, E. M., and Boutin, S. (2014). Influence of climate and human land use on the distribution of white-tailed deer (Odocoileus virginianus) in the western boreal forest. Can. J. Zoology 92, 353–363. doi:10.1139/cjz-2013-0262
Dawe, K. L., and Boutin, S. (2016). Climate change is the primary driver of white-tailed deer (Odocoileus virginianus) range expansion at the northern extent of its range; land use is secondary. Ecol. Evol. 6, 6435–6451. doi:10.1002/ece3.2316
de Ruijter, A., and Guldenmund, F. (2016). The bowtie method: A review. Saf. Sci. 88, 211–218. doi:10.1016/j.ssci.2016.03.001
DeMars, C. A., and Boutin, S. (2018). Nowhere to hide: Effects of linear features on predator–prey dynamics in a large mammal system. J. Animal Ecol. 87 (1), 274–284. doi:10.1111/1365-2656.12760
DeMars, C. A., Serrouya, R., Mumma, M. A., Gillingham, M. P., McNay, R. S., and Boutin, S. (2019). Moose, caribou, and fire: Have we got it right yet? Can. J. Zoology 97, 866–879. doi:10.1139/cjz-2018-0319
Energy Northern Development and Mines, (2011). Mining act | Ministry of energy, northern development and mines.
Environment, Climate Change Canada (2017). Second generation Canadian Earth system model. Available from: https://www.ec.gc.ca/ccmac-cccma/default.asp?lang=En&n=1A3B7DF1-1&wbdisable=false (Accessed October 10, 2020).
Escobar, L. E., Moen, R., Craft, M. E., and VanderWaal, K. L. (2019). Mapping parasite transmission risk from white-tailed deer to a declining moose population. Eur. J. Wildl. Res. 65, 60. doi:10.1007/s10344-019-1297-z
Fahrig, L., and Rytwinski, T. (2009). Effects of roads on animal abundance: An empirical review and synthesis. Ecol. Soc. 14 (1), art21. doi:10.5751/es-02815-140121
Far North Science Advisory Panel (2010). “Science for a changing Far North,. Far North Science advisory Panel,” in A report submitted to the Ontario Ministry of natural resources.
Found, R., McLaren, A. A., Rodgers, A. R., and Patterson, B. R. (2017). Diet of grey wolves (Canis lupus) during calving in a moose–caribou system in northern Ontario. Can. Field-Naturalist 131 (3), 215–220. doi:10.22621/cfn.v131i3.1822
Francis, S. R., and Hamm, J. (2011). Looking forward: Using scenario modeling to support regional land use planning in northern yukon, Canada. Ecol. Soc. 16 (4), art18. doi:10.5751/es-04532-160418
Fryxell, J. M., Avgar, T., Liu, B., Baker, J. A., Rodgers, A. R., Shuter, J., et al. (2020). Anthropogenic disturbance and population viability of woodland caribou in Ontario. J. Wildl. Manag. 84, 636–650. doi:10.1002/jwmg.21829
GeoHub, Ontario (2020). Ontario imagery web map service (OIWMS). Available from: https://geohub.lio.gov.on.ca/datasets/101295c5d3424045917bdd476f322c02 (Accessed October 10, 2020).
Gregory, R., Arvai, J., and Gerber, L. R. (2013). Structuring decisions for managing threatened and endangered species in a changing climate. Conserv. Biol. 27 (6), 1212–1221. doi:10.1111/cobi.12165
Gregory, R., Failing, L., Harstone, M., Long, G., McDaniels, T., and Ohlson, D. (2012). Structured decision making: A practical guide to environmental management choices. New Jersey, United States: John Wiley & Sons.
Gunn, J. H., and Noble, B. F. (2009). Integrating cumulative effects in regional strategic environmental assessment frameworks: Lessons from practice. J. Environ. Assess. Policy Manag. 11 (03), 267–290. doi:10.1142/s1464333209003361
Harrington, F. H., David Mech, L., and Fritts, S. H. (1983). Pack size and wolf pup survival: Their relationship under varying ecological conditions. Behav. Ecol. Sociobiol. 13, 19–26. doi:10.1007/bf00295072
Hines, E., Baldwin, C., Jones, C., Lewison, R. L., Lieske, S., and Rudd, M. (2016). A Driver Pressure State Impact Response (DPSIR) framework applied to an interdisciplinary coastal zone management workshop along the eastern Gulf of Thailand. Washington, D.C., United States: American Geophysical Union, ME13A–03.
Hornseth, M. L., and Rempel, R. S. (2016). Seasonal resource selection of woodland caribou (Rangifer tarandus caribou) across a gradient of anthropogenic disturbance. Can. J. Zoology 94, 79–93. doi:10.1139/cjz-2015-0101
Impact Assessment Agency of Canada (2021). Planning the regional assessment in the ring of fire area. Available from: https://iaac-aeic.gc.ca/050/documents/p80468/136708E.pdf
International Organization for Standardization (2018). Risk management (ISO standard No. 31000:2018). Bowties are in 31010, risk management – risk assessment techniques.
James, A. R., Boutin, S., Hebert, D. M., and Rippin, A. B. (2004). Spatial separation of caribou from moose and its relation to predation by wolves. J. Wildl. Manag. 68 (4), 799–809. doi:10.2193/0022-541x(2004)068[0799:ssocfm]2.0.co;2
Johnson, C. J., Mumma, M. A., and St-Laurent, M. H. (2019). Modeling multispecies predator–prey dynamics: Predicting the outcomes of conservation actions for woodland caribou. Ecosphere 10, e02622. doi:10.1002/ecs2.2622
Jones, F. V., and Israni, K. (2012). “Environmental risk assessment utilizing bow-tie methodology,” in SPE international conference and exhibition on health, safety, environment, and sustainability? (Donnybrook, Ireland: SPE). SPE-156833.
Kennedy-Slaney, L., Bowman, J., Walpole, A. A., and Pond, B. A. (2018). Northward bound: The distribution of white-tailed deer in Ontario under a changing climate. Wildl. Res. 45, 220–228. doi:10.1071/wr17106
Kishchuk, B. E., Creed, I. F., Laurent, K. L., Nebel, S., Kreutzweiser, D., Venier, L., et al. (2018). Assessing the ecological sustainability of a forest management system using the ISO Bowtie Risk Management Assessment Tool. For. Chron. 94 (1), 25–34. doi:10.5558/tfc2018-005
Kristensen, P. (2004). “The DPSIR framework,” in Paper presented at the 27-29 September 2004 workshop on a comprehensive/detailed assessment of the vulnerability of water resources to environmental change in Africa using river basin approach (Nairobi, Kenya: UNEP Headquarters).
Latham, A. D. M., Latham, M. C., McCutchen, N. A., and Boutin, S. (2011). Invading white-tailed deer change wolf-caribou dynamics in northeastern Alberta. J. Wildl. Manag. 75, 204–212. doi:10.1002/jwmg.28
Leston, L., Bayne, E., Dzus, E., Solymos, P., Moore, T., Andison, D., et al. (2020). Quantifying long-term bird population responses to simulated harvest plans and cumulative effects of disturances. Front. Ecol. Evol. 8, 252. doi:10.3389/fevo.2020.00252
Lienert, J., Scholten, L., Egger, C., and Maurer, M. (2015). Structured decision-making for sustainable water infrastructure planning and four future scenarios. EURO J. Decis. Process. 3 (1), 107–140. doi:10.1007/s40070-014-0030-0
Mahon, C. L., and Pelech, S. (2021). Guidance for analytical methods to cumulative effects assessment for terrestrial species. Environ. Rev. 29 (999), 201–224. doi:10.1139/er-2020-0037
Martin, J., Runge, M. C., Nichols, J. D., Lubow, B. C., and Kendall, W. L. (2009). Structured decision making as a conceptual framework to identify thresholds for conservation and management. Ecol. Appl. 19 (5), 1079–1090. doi:10.1890/08-0255.1
McGarigal, K., Wan, H. Y., Zeller, K. A., Timm, B. C., and Cushman, S. A. (2016). Multi-scale habitat selection modeling: A review and outlook. Landsc. Ecol. 31 (6), 1161–1175. doi:10.1007/s10980-016-0374-x
Mech, L. D., Fieberg, J., and Barber-Meyer, S. (2018). An historical overview and update of wolf–moose interactions in northeastern Minnesota. Wildl. Soc. Bull. 42, 40–47. doi:10.1002/wsb.844
Messier, F. (1994). Ungulate population models with predation: A case study with the North American moose. Ecology 75, 478–488. doi:10.2307/1939551
Newton, E. J., Patterson, B. R., Anderson, M. L., Rodgers, A. R., Vander Vennen, L. M., and Fryxell, J. M. (2017). Compensatory selection for roads over natural linear features by wolves in northern Ontario: Implications for caribou conservation. PloS one 12 (11), e0186525. doi:10.1371/journal.pone.0186525
Noble, B., Gibson, R., White, L., Blakley, J., Croal, P., Nwanekezie, K., et al. (2019). Effectiveness of strategic environmental assessment in Canada under directive-based and informal practice. Impact Assessment and Project Appraisal 37 (3-4), 344–355. doi:10.1080/14615517.2019.1565708
Ontario Ministry of Energy Northern Development and Mines (2012). Closure plan | Ministry of energy, northern development and mines. Available from: https://www.mndm.gov.on.ca/en/mines-and-minerals/mining-sequence/evaluation/advanced-exploration/closure-plan (Accessed February 10, 2021).
Ontario Ministry of Natural Resources and Forestry, (2014b). “State of the woodland caribou resource report,” in Species at risk branch thunder Bay (Ontario: Ontario Ministry of Natural Resources and Forestry).
Ontario Ministry of Natural Resources and Forestry (2014a). The Far North land use planning initiative. Available from: https://www.ontario.ca/page/far-north-land-use-planning-initiative (Accessed February 10, 2021).
Packalen, M. S., Finkelstein, S. A., and McLaughlin, J. W. (2014). Carbon storage and potential methane production in the Hudson Bay Lowlands since mid-Holocene peat initiation. Nat. Commun. 5, 4078. doi:10.1038/ncomms5078
Pellisey, J., and Routh, M. (2023). New decision-support tools for understanding cumulative impacts on barren-ground caribou in the NWT. N. W. T. Cumul. Impact Monit. Program Res. Bull. 8 (55).
Peterson, G. D., Cumming, G. S., and Carpenter, S. R. (2003). Scenario planning: A tool for conservation in an uncertain world. Conserv. Biol. 17, 358–366. doi:10.1046/j.1523-1739.2003.01491.x
Pirrone, N., Trombino, G., Cinnirella, S., Algieri, A., Bendoricchio, G., and Palmeri, L. (2005). The driver-pressure-state-impact-response (DPSIR) approach for integrated catchment-coastal zone management: Preliminary application to the Po catchment-adriatic sea coastal zone system. Reg. Environ. change 5, 111–137. doi:10.1007/s10113-004-0092-9
Rempel, R. S., Carlson, M., Rodgers, A. R., Shuter, J. L., Farrell, C. E., Cairns, D., et al. (2021). Modeling cumulative effects of climate and development on moose, wolf, and caribou populations. J. Wildl. Manag. 85 (7), 1355–1376. doi:10.1002/jwmg.22094
Rempel, R. S. (2011). Effects of climate change on moose populations: Exploring the response horizon through biometric and systems models. Ecol. Model. 222, 3355–3365. doi:10.1016/j.ecolmodel.2011.07.012
Rempel, R. S., Elkie, P. C., Rodgers, A. R., and Gluck, M. J. (1997). Timber-management and natural-disturbance effects on moose habitat: Landscape evaluation. J. Wildl. Manag. 61, 517–524. doi:10.2307/3802610
Schaefer, J. A. (2003). Long-term range recession and the persistence of caribou in the taiga. Conserv. Biol. 17, 1435–1439. doi:10.1046/j.1523-1739.2003.02288.x
Schneider, R. R., Latham, M. C., Stelfox, B., Farr, D., and Boutin, S. (2010). Effects of a severe mountain pine beetle epidemic in western Alberta, Canada under two forest management scenarios. Int. J. For. Res. 2010, 1–7. doi:10.1155/2010/417595
Schneider, R. R., Stelfox, J. B., Boutin, S., and Wasel, S. (2003). Managing the cumulative impacts of land uses in the western Canadian sedimentary basin: A modeling approach. Conserv. Ecol. 7 (1), art8. doi:10.5751/es-00486-070108
Serrouya, , McLellan, B. N., van Oort, H., Mowat, G., and Boutin, S. (2017). Experimental moose reduction lowers wolf density and stops decline of endangered caribou. PeerJ 5, e3736. doi:10.7717/peerj.3736
Serrouya, R., Seip, D. R., Hervieux, D., McLellan, B. N., McNay, R. S., Steenweg, R., et al. (2019). Saving endangered species using adaptive management. Proc. Natl. Acad. Sci. 116, 6181–6186. doi:10.1073/pnas.1816923116
Serrouya, R., Wittmann, M. J., McLellan, B. N., Wittmer, H. U., and Boutin, S. (2015). Using predator-prey theory to predict outcomes of broadscale experiments to reduce apparent competition. Am. Nat. 185, 665–679. doi:10.1086/680510
Shanley, C. S., and Pyare, S. (2011). Evaluating the road-effect zone on wildlife distribution in a rural landscape. Ecosphere 2, art16–16. doi:10.1890/es10-00093.1
Skinner, K., Hanning, R. M., Desjardins, E., and Tsuji, L. J. (2013). Giving voice to food insecurity in a remote indigenous community in subarctic Ontario, Canada: Traditional ways, ways to cope, ways forward. BMC Public Health 13 (1), 427–513. doi:10.1186/1471-2458-13-427
Spectranalysis, (2004). “Introduction to the Ontario land cover database second edition,” in Outline of production methodology and description of 27 land cover classes: Report to the Ontario Ministry of Natural Resources.
Stillwater Canada Inc. (2012). Marathon PGM-Cu project environmental impact statement — main report. Thunder Bay, ON: Stillwater Canada Inc.
Superbie, C., Stewart, K. M., Regan, C. E., Johnstone, J. F., and McLoughlin, P. D. (2022). Northern boreal caribou conservation should focus on anthropogenic disturbance, not disturbance-mediated apparent competition. Biol. Conserv. 265, 109426. doi:10.1016/j.biocon.2021.109426
Swart, R. J., Raskin, P., and Robinson, J. (2004). The problem of the future: Sustainability science and scenario analysis. Glob. Environ. change 14 (2), 137–146. doi:10.1016/j.gloenvcha.2003.10.002
Tape, K. D., Gustine, D. D., Ruess, R. W., Adams, L. G., and Clark, J. A. (2016). Range expansion of moose in arctic Alaska linked to warming and increased shrub habitat. PLoS ONE 11, e0152636. doi:10.1371/journal.pone.0152636
Thompson, J. R., Wiek, A., Swanson, F. J., Carpenter, S. R., Fresco, N., Hollingsworth, T., et al. (2012). Scenario studies as a synthetic and integrative research activity for long-term ecological research. BioScience 62, 367–376. doi:10.1525/bio.2012.62.4.8
Trombulak, S. C., and Frissell, C. A. (2000). Review of ecological effects of roads on terrestrial and aquatic communities. Conserv. Biol. 14 (1), 18–30. doi:10.1046/j.1523-1739.2000.99084.x
United Nations Environment Programme, (2021). Decision from the Minister of Environment and Climate Change concerning da Regional Assessment. Nairobi, Kenya: United Nations Environment Programme. Available from: https://www.ceaa.gc.ca/050/documents/p80468/133830E.pdf (Accessed.
U. S. Geological Survey (2021). Structured decision making. Available from: https://www.usgs.gov/centers/pwrc/science/structured-decision-making?qt-science_center_objects=0#qt-science_center_objects (Accessed February 9, 2021).
Van Oudenhoven, A. P., Petz, K., Alkemade, R., Hein, L., and de Groot, R. S. (2012). Framework for systematic indicator selection to assess effects of land management on ecosystem services. Ecol. Indic. 21, 110–122. doi:10.1016/j.ecolind.2012.01.012
Waheed, B., Khan, F., and Veitch, B. (2009). Linkage-based frameworks for sustainability assessment: Making a case for driving force-pressure-state-exposure-effect-action (DPSEEA) frameworks. Sustainability 1 (3), 441–463. doi:10.3390/su1030441
Walker, P. D., Rodgers, A. R., Shuter, J. L., Thompson, I. D., Fryxell, J. M., Cook, J. G., et al. (2020). Comparison of woodland caribou calving areas determined by movement patterns across northern Ontario. J. Wildl. Manag. 85, 169–182. doi:10.1002/jwmg.21961
Wang, X., Huang, G., and Liu, J. (2016). Observed regional climatic changes over Ontario, Canada, in response to global warming. Meteorol. Appl. 23, 140–149. doi:10.1002/met.1541
Weber, M., Krogman, N., and Antoniuk, T. (2012). Cumulative effects assessment: Linking social, ecological, and governance dimensions. Ecol. Soc. 17 (2), art22. doi:10.5751/es-04597-170122
Wilmers, C. C., Post, E., and Hastings, A. (2007). The anatomy of predator–prey dynamics in a changing climate. J. Animal Ecol. 76, 1037–1044. doi:10.1111/j.1365-2656.2007.01289.x
Keywords: cumulative effects management, moose-wolf-caribou system, northern Ontario, regional assessment, risk analysis, scenario analysis
Citation: Antwi EK, Rempel RS, Carlson M, Boakye-Danquah J, Winder R, Dabros A, Owusu-Banahene W, Berryman E and Eddy I (2023) A modelling approach to inform regional cumulative effects assessment in northern Ontario. Front. Environ. Sci. 11:1217195. doi: 10.3389/fenvs.2023.1217195
Received: 05 May 2023; Accepted: 11 September 2023;
Published: 04 October 2023.
Edited by:
Christopher Lant, Utah State University, United StatesReviewed by:
Robert Serrouya, University of Alberta, CanadaStanley Mubako, California Department of Water Resources, United States
Copyright © 2023 Antwi, Rempel, Carlson, Boakye-Danquah, Winder, Dabros, Owusu-Banahene, Berryman and Eddy. This is an open-access article distributed under the terms of the Creative Commons Attribution License (CC BY). The use, distribution or reproduction in other forums is permitted, provided the original author(s) and the copyright owner(s) are credited and that the original publication in this journal is cited, in accordance with accepted academic practice. No use, distribution or reproduction is permitted which does not comply with these terms.
*Correspondence: Effah Kwabena Antwi, ZWZmYWguYW50d2lAbnJjYW4tcm5jYW4uZ2MuY2E=