 Xijing Li
 Xinlin Ma1,2*†
 Fangzheng Lyu
 Yan Song
- 1Department of City and Regional Planning, University of North Carolina at Chapel Hill, Chapel Hill, NC, United States
- 2School of Public Policy and Management, Tsinghua University, Beijing, China
- 3Department of Geography and Geographic Information Science, University of Illinois Urbana-Champaign, Urbana, IL, United States
Climate adaptation policies have received attention in major due to the dual challenges of external factors like global warming, and internal factors related to the transition from rapid urbanization to sustainable development. However, previous research on heat or climate mitigation has often focused on external factors, neglecting the internal factors throughout the process of urban development and planning history. Research has revealed that city center where urban heat island phenomena is prominent, are subjected to external factors of intense heat exposure, as well as deeply influenced by the internal factors “urban development legacy.” An increasing body of research note that the inequitable legacy from urban development could impact environmental equity outcomes of cities. Based on this, we argue that urban heat mitigation research should adopt the perspective of the urban development process. We then utilize the Heat Mitigation Framework to examine the tangible outcomes of environmental equity over an extended period of urban development. This study focuses on the Charlotte city center that have undergone multiple processes of redlining policies and rapid urbanization, using a research framework for environmental equity-oriented urban heat management to examine whether a series of heat mitigation policies have effectively reduced heat exposure and whether they have truly benefited heat-vulnerable groups. Based on 20 years of multi-source heat exposure and urban spatial data, this paper provides evidence of ongoing enhancements to the heat exposure environment in the Charlotte city center. However, despite these improvements, heat vulnerable group that are particularly susceptible to the negative effects of heat exposure did not experience commensurate benefits. The conclusion of this article validates the ongoing trends of global sustainable studies in nature-based solutions and social-ecological systems, highlighting the issue of environmental equity evaluation.
1 Introduction
Global climate change and the rapid process of urbanization have intensified environmental consequences, leading to frequent urban heat island (UHI) problems (McCarthy et al., 2010; Chapman et al., 2017), and heated discussion arouse in climate adaptation strategies all over the world (Baniassadi et al., 2019; Augusto et al., 2020; Ascenso et al., 2021). Long-term exposure to hot environments not only has adverse effects on human health (Tong et al., 2021), exacerbated heat exposure for residents in disadvantaged communities could easily worsen environmental inequity in cities (Harlan et al., 2007). To alleviate the adverse effects of UHI and address the environmental inequality, urban heat management has become an increasingly important for urban heat mitigation as well as climate adaptation (Zhou et al., 2017; Sanchez and Reames, 2019; Herath et al., 2021).
In practice, urban heat management involves a range of urban heat mitigation techniques. The planning practice has been informed by a conceptual model of vulnerability to heat, which highlights exposure, sensitivity, and adaptive capacity as key factors (Turner et al., 2003; Wilhelmi and Hayden, 2010). Direct measures primarily involve improving urban fabrics like urban greenspace and green infrastructure (Augusto et al., 2020; Kraemer and Kabisch, 2022; Li et al., 2022). While indirect measures are enhancing adaptability and sensitivity, which are closely linked to socio-economic and demographic factors (Voelkel et al., 2018). At the conceptual level, there is a growing trend to incorporate the legacy of previous policies into the research framework (Grove et al., 2018; Wilson, 2020; Roberts et al., 2022) as the rapid urbanization has a profound impact on the urban environment, which is not only a historical legacy issue but also a current situation problem that urban management must face. Finally, at the methodological level, heat management increasingly relies on high spatiotemporal resolution (Eastin et al., 2018; Xu C. et al., 2022a; Lyu et al., 2022) and long-term (Xiong et al., 2022) remote sensing, as well as urban socio-economic data to conduct simulations based on objective changes and trends to enhance the specificity and effectiveness of urban heat management.
In response to real-world issues, cities across the world are progressively inclined to a more comprehensive and sustainable methodological approach in the context of climate adaptation and heat management. Nature-based solutions (NBS), as a research direction that has garnered increasing attention in recent years, aim to achieve a more intricate comprehension of urban strategies geared towards addressing climate challenges by means of integrating ecosystem services, implementing place-based modeling, and accounting for both immediate and long-term impacts. This concerted effort collectively contributes to an enriched understanding of urban strategies aimed at mitigating climate challenges (Augusto et al., 2020; Ascenso et al., 2021; Liu et al., 2022; Cong et al., 2023). Furthermore, in addition to addressing climate adaptation and enhancing urban environments, the issues intertwined with societal and economic inequality and unbalanced development are deemed amenable to systematic resolution through the adoption of a social-ecological system (SES) approach. This approach is increasingly being recognized as a methodological framework that systematically addresses such issues (Fedele et al., 2019; Mafi-Gholami et al., 2021). SES progressively evolves into a methodological framework aimed at holistically assessing vulnerabilities, considering the intricate interplay between social and ecological factors. This kind of comprehensive methodological and strategic approach, prevalent on a global scale, aligns harmoniously with the emerging strategies adopted by cities, emphasizing the imperative of comprehensive solutions that account for the intricacies of urban environments and the overall wellbeing of their inhabitants.
Therefore, when focusing on urban heat mitigation, research has emerged concerning with the process and legacy of urban development (Bolin et al., 2013), starting to highlight the long-term impacts of urban legacies on environmental inequity (Jenerette et al., 2011; Wilson, 2020). It must be acknowledged that high-precision spatiotemporal data (Grilo et al., 2020; García and Diaz, 2023; Derakhshan et al., 2023) and long-term observations (Wilson, 2020; Li et al., 2022) provide comprehensive contextual information for revealing the temporal and spatial changes in urban environmental inequality. This also assists in substantiating the enduring effects of policy legacies on environmental inequality, and in providing precise guidance for the formulation of comprehensive heat exposure mitigation strategies that take into account economic, social, and ecological integrated benefits (Jenerette et al., 2011; Mafi-Gholami et al., 2021; Zhu et al., 2022). Similar to the urbanization process of other countries worldwide, the legacies experienced in the course of urban development in the United States have been substantiated to exert profound impacts on environmental and equity concerns. In recent years, research into heat management within the context of environmental equity in the United States has increasingly focused on the legacy of Redlining, in its enduring implications for urban heat management efforts aimed at promoting environmental justice (Lynch et al., 2021; Lane et al., 2022).
Duting the past two decades, despite a series of urban retrofitting measures aimed at addressing extreme weather events and promoting urban sustainability (Wong and Lau, 2013; Akkose et al., 2021), including heat mitigation strategies implemented in the original city center (Gaber et al., 2020), where rapid urbanization is still occurring, and the effects of the redlining legacy have not dissipated (D'Aquila, 2022). In this context, urban heat management urgently needs to consider the environmental changes and their equitable impacts brought about by complex urbanization processes over a long-time scale. Although there have been some studies on the equity impacts of redlining legacy on urban heat exposure in the past two decades (Wilson, 2020; Lynch et al., 2021), less attention has been paid to the rapid urbanization process and land surface changes in the redlining areas, as well as the application of heat mitigation frameworks. This has limited our understanding of the heat exposure experienced by vulnerable locations and populations over the past few decades. In addition, the measurement of heat exposure based on environmental equity requires high-precision spatiotemporal data and long-term observations, which demands more accurate measurement of heat exposure across different regions, populations, and time periods.
Therefore, this study, based on the research framework of urban heat management and using high-precision spatiotemporal data, measured the heat exposure experienced by the redlined areas over the past two decades and evaluated whether heat mitigation strategies implemented during this time period have led to improvements in environmental equity. This study selected a American city Charlotte as the case study area, which has experienced redlining legacy since 1930s and has witnessed rapid urbanization in the past two decades. Heat management measures in Charlotte has arisen discussion (Eastin et al., 2018; Westernorff, 2020), but the environmental inequity outcome remains unanswered. The study focused on the changes in heat exposure in Charlotte’s redlining areas over the past 20 years, revealing the multiple effects of policy legacy and heat mitigation strategies on improving environmental equity in this area. This study aims to implement a comprehensive research framework for climate mitigation in the context of legacy policies and provides a detailed and comprehensive interpretation of environmental equity research in a long-lasting and complex urbanization processes.
2 Literature review
In recent years, research on heat exposure for climate adaptation has increasingly focused on heat vulnerability and environmental equity issues. Methodologically, the study of heat mitigation indexes focuses particularly on low-income and African American populations in urban areas. However, in the planning practice of heat management, there is a lack of targeted research for heat-vulnerable populations living in city centers. Most of the downtowns of southern US cities experienced redlining legacies and rapid urbanization, and many studies have focused on redlining’s reshaping of urban environments and the resulting environmental inequity issues. However, whether heat management nowadays in historical redlining areas could environmental justice requires long-term, high spatiotemporal resolution heat exposure measurements, as well as adopting the heat management framework.
2.1 Heat management framework in megacities
Sustainable adaptation and social equity have been recognized as important considerations in local climate adaptation planning, including for UHI mitigation strategies (Harlan et al., 2007; Wilson and Chakraborty, 2019; Tong et al., 2021; Xu et al., 2022b). Fiack et al. (2021) discussed social equity and local climate adaptation planning in US cities, while Sanchez and Reames (2019) conducted the socio-spatial analysis of equity in green roofs as an urban heat island mitigation strategy. Amorim-Maia et al. (2022) proposed intersectional climate equity as a conceptual pathway for bridging adaptation planning, transformative action, and social equity. Previous literature has also investigated the effects of heat vulnerability on heat-related emergency medical service incidents. Seong et al. (2023) examined the effects of heat vulnerability on heat-related emergency medical service incidents in Austin, Texas, while Li et al. (2022) modeled the relationships between historical redlining, urban heat, and heat-related emergency department visits in 11 Texas cities. D'Aquila (2022) examined the legacy of redlining and the disproportionate exposure to extreme heat in Seattle, Washington.
Heat vulnerability indices (HVIs), which integrate exposure, sensitivity, and adaptive capacity to extreme heat, have been incorporated into urban public health management. Examples include the HVIs developed for San Juan, Puerto Rico (Méndez-Lázaro et al., 2018), Santiago de Chile (Inostroza et al., 2016), Milwaukee and Wisconsin (Christenson et al., 2017), and Ludwigsburg, Germany (Birkmann et al., 2021). Daniel et al. (2018) discusses the role of watering practices in large-scale urban planning strategies to face the heat-wave risk in the future climate, while Yuan et al. (2022) explore the drivers of heat-induced health impacts and implications for accurate heat-health plans and guidelines.
The understanding of equity in urban heat mitigation often starts from spatial equity. On the one hand, the increasingly sophisticated spatiotemporal measurements have improved the precision of urban heat exposure research. Zhou et al. (2017) improved the assessment of the effects of configuration on land surface temperature (LST) by controlling tree cover. Xu et al. (2022a) discussed the potential influence of the spatial equity of urban green space (UGS) distribution on the urban heat island (UHI) using remote sensing data and the Gini coefficient. On the other hand, the exploration of spatial equity contributes to the implementation of heat mitigation strategies. Urban heat management often relies on the transformation of the physical spatial environment of the city to mitigate the health risks brought by extreme heat. Qin et al. (2012) proved that green roof could be effective strategies for reducing urban heat, Oliveira et al. (2011); Wang et al. (2022) both found that urban green space could be another effective cooling strategy. Also, green belts and blue space are effective environmental planning toolbox, argued by Zhu et al. (2017); Gunawardena et al. (2017).
Environmental equity has gained significant attention in climate change adaptation and mitigation efforts. Adger (2001) emphasizes the importance of governance scales in achieving environmental equity. In the context of heat management, Zhu et al. (2022) have explored environmental justice in heat-related health risks by integrating anthropogenic heat emissivity and cooling accessibility in Shanghai, China. Additionally, Ernstson (2013) provides a framework for studying environmental justice and ecological complexity in urban landscapes, highlighting the social production of ecosystem services. Recent studies, including Xu et al. (2022b); Xiong et al. (2022) in Guangzhou et al. (2021) in Dera Ghazi Khan, Pakistan, have utilized remote sensing and GIS data to assess urban heat islands and their associations with land use/cover change. Sobrino et al. (2004); Li et al. (2022) conducted studies that investigated the relationship between land surface temperature (LST) and vegetation fraction, taking into full consideration the complexity of land cover in urban environments. By utilizing their LST retrieval approaches, the heat exposure of urban residents can be quantified with greater precision. However, to shed light on the impact of environmental equity, there is a need for more precise, long-term scale measurements of heat exposure and targeted incorporation into heat management frameworks to provide accurate evidence for heat mitigation strategies.
While sustainable urban retrofitting has indeed improved the urban environment in specific areas, they have also increased the costs of living, resulting in historical marginalized groups being forced to relocate. As a result, these heat-vulnerable groups are actually unable to benefit from the positive effects of environmental improvements. Gould and Lewis (2018) exposed the cruel process of “green gentrification” in New York, where people of color were unable to enjoy the beautiful waterfront after renovation and may continue to bear the risks of extreme weather in the city. Anguelovski et al. (2019) further summarized this unjust trend as “green climate gentrification” which poses a threat to the poor and vulnerable populations. Therefore, it is urgent to understand the effects of urban heat mitigation strategies from the perspectives of spatial equity and social equity, in order to better promote human-centered environmental planning.
2.2 Urban legacy, urban retrofitting and environmental inequity
The legacies within the urban development process often exert significant influence on the current environmental adaptation strategies of cities. Strategies such as Europe’s sustainable urban transformation (Addanki and Venkataraman, 2017) and China’s urban carbon neutrality initiative (Hepburn et al., 2021) must take into account the physical environment inherited from urban history and the socially constructed spatial structures that have accumulated over time.
Urban policies along with the urban development, such as redlining in the US context, had far-reaching impacts on later issues of social segregation and environmental inequity, even after decades of urbanization. When urban extremes occur, many studies have shown that redlining is a historical policy that deserves blame (Li and Yuan, 2022). Studies have shown that historical redlining practices have played a role in the disproportionate distribution of heat-related health outcomes across neighborhoods, with low-income communities of color, who were redlined in the past, being the most affected (Wilson, 2020; Lee et al., 2022; Swope et al., 2022). Wilson (2020) discusses the legacy of redlining and the role of urban heat management, while Lee et al. (2022) reviews the literature on health outcomes in redlined versus non-redlined neighborhoods. Swope et al. (2022); Cross et al. (2023) examine the relationship of historical redlining with present-day environmental and health outcomes and present research agendas. What’s more, the past redlining policies still have a profound impact on the current environmental extreme exposure of historical marginalized areas. Hoffman et al. (2020) proved that land surface temperatures in redlined areas are approximately 2.6°C warmer than in non-redlined areas in U.S., and reveals that historical housing policies may, in fact, be directly responsible for disproportionate exposure to current heat events. Lane et al. (2022) illustrated how redlining continues to shape systemic environmental exposure disparities in the United States in perspective of air pollution disparities.
Also, historical heat vulnerable groups, include African American (Hamstead et al., 2018), low-income citizens (Osberghaus and Abeling, 2022), rental households (Uejio et al., 2011), senior citizens (Rosenthal et al., 2014) have proved to be heat vulnerable group and arouse great attention especially on health outcomes of other environmental inequities, such as of exposure to crucial environment and worse health conditions. Nardone et al. (2021) proved that the historical redlined group shares highly association with greenspace decrease. Lynch et al. (2021) found that redlined neighborhoods with high sustained disinvestment had worse physical and mental health than neighborhoods with high investment. Sandlos and Keeling (2016) discuss toxic legacies, slow violence, and environmental inequity at Giant Mine, Northwest Territories, while Gonzalez et al. (2023) examine the historic redlining and the siting of oil and gas wells in the United States.
In the past few decades, all countries in the world have actively tried environmental improvement and climate adaptation strategies, and urban retrofitting has also been actively carried out in Europe (Vall-Casas et al., 2011), the United States (Dixon et al., 2014) and other regions. Some environmental adaptation changes and green tactics in urban space have indeed been proved to bring good environmental and social benefits. Ascenso et al. (2021) provide a valuable case study investigating the impacts of nature-based solutions on the urban atmospheric environment. Focusing on Eindhoven, Netherlands, the authors analyze the effects of these solutions on air quality and temperature regulation. This study contributes to the understanding of how nature-based interventions can influence urban microclimates, emphasizing the broader implications of these approaches beyond localized heat management. Cong et al. (2023) offer a modeling-based exploration of place-based nature-based solutions, aiming to facilitate urban carbon neutrality. The paper demonstrates the role of nature-based solutions in not only mitigating heat but also in achieving broader carbon reduction targets, further supporting the idea of an integrated approach to urban climate challenges. Based on this, emerging studies hope to investigate the comprehensive effectiveness of these series of climate adaptation strategies, and whether the new improvement measures align with urban expansion (Liu et al., 2022). While whether they can take into account the social benefits of urban development and benefit more groups, especially the environmentally disadvantaged groups, which is also the focus of this paper.
3 Methodology
3.1 Research area
The research area, illustrated in Figure 1, primarily concentrates on a US city, Charlotte’s downtown area. The city has to deal with both the legacy of spatial inequity in the process of urbanization and the ongoing strategies at urban retrofitting and heat mitigation over the past two decades. These areas are located in the heart of Charlotte city, with the total redlined area spanning 54.66 km2, accounting for more than 80% of the urban area back in the 1930s. Due to the imprecise nature of historical redlining boundary delineation in cities like Charlotte, which lacked real estate cases at that time (Winling and Michney, 2021), the boundaries do not perfectly align with past and current blocks and block group boundaries. Considering the growth of the road network, we have extended the redlining boundaries by 1 km (∼0.6 mile) based on walking distance in this study. The 1 km distance is similar to walking distances commonly used to measure neighborhood environments, such as greenspace accessibility (Song and Wu, 2016), which is a significant factor in mitigating heat exposure (Chakraborty and Li, 2022). As a result, our expanded research area encompasses 96.7 km2, covering the majority of Charlotte’s downtown.
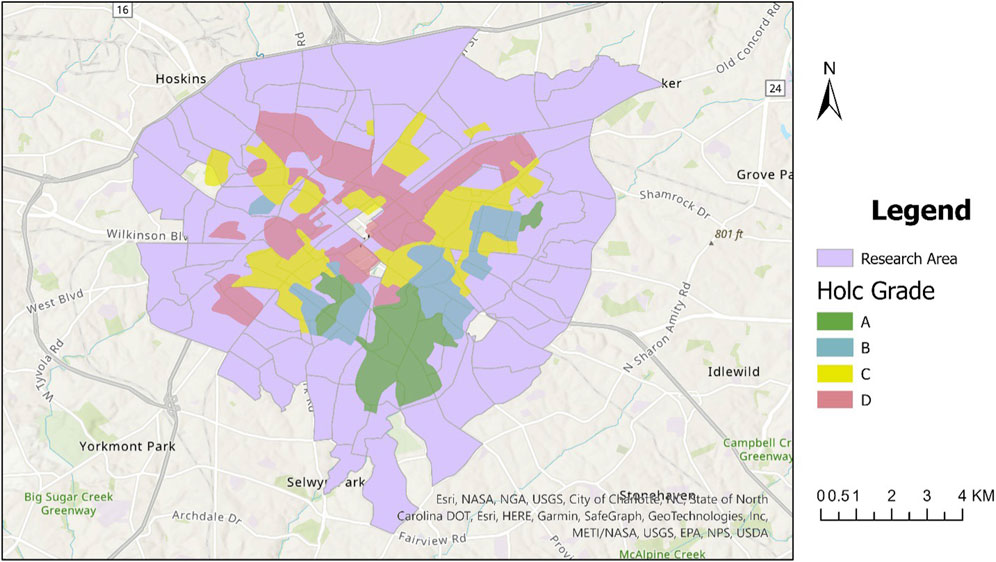
FIGURE 1. Map of research area in Charlotte (Note: blank block group are mainly commercial sites).
Historically, Charlotte’s Home Owners’ Loan Corporation (HOLC) grade map was divided into four grades as shown in Figure 1: A (Best), B (Desirable), C (Definitely Declining, Redlined), and D (Hazard, Redlined), with their respective area proportions being 16% for Grade A, 19% for Grade B, 30% for Grade C, and 35% for Grade D. Deviating slightly from the pattern observed in other cities, Charlotte did not exhibit a concentric circle structure from the city center to suburban areas with Grade D transitioning to Grade A. Instead, apart from Grade A, Grades C, D (Redlined), and B (Not Redlined) were interspersed from the city center to the city’s outskirts at the time. This spatial distribution pattern may result in less pronounced differences in land surface temperature patterns between various redlining area grades in Charlotte, as well as a less evident heat legacy compared to cities like Baltimore and Kansas City, which have been studied in existing research (Wilson, 2020; Liu et al., 2021).
Over the past two decades, Charlotte has experienced rapid urban population growth, making it one of the fastest-growing metropolitan areas in the United States (Tosé, 2023). Within this rapid population growth process, the population in the study area, which serves as the center of the entire metropolitan area, has also increased by over 35% in the past 20 years, reaching a total of 127,972 residents in 2019. Amid this swift urban population growth, the area has undergone significant urban center redevelopment, including urban regreening projects for environmental development, light rail construction, and new housing redevelopment (Yonto and Thil, 2020). These landscape changes in the study area will alter the distribution pattern of urban land surface temperatures (LST), potentially affecting the heat vulnerability and heat management effectiveness for residents in the area.
3.2 Workflow
The aim of this study is to address two main research questions: 1) Have areas in Charlotte, US that were redlined (Grade C and Grade D) in the 1930s experienced greater increases in heat exposure over the past 20 years in the context of climate change? 2) How do changes in the association patterns between heat exposure and heat vulnerability in these areas over the past two decades inform climate change adaptation, particularly within the heat management framework? To tackle these questions, this study follows the workflow illustrated in Figure 2.
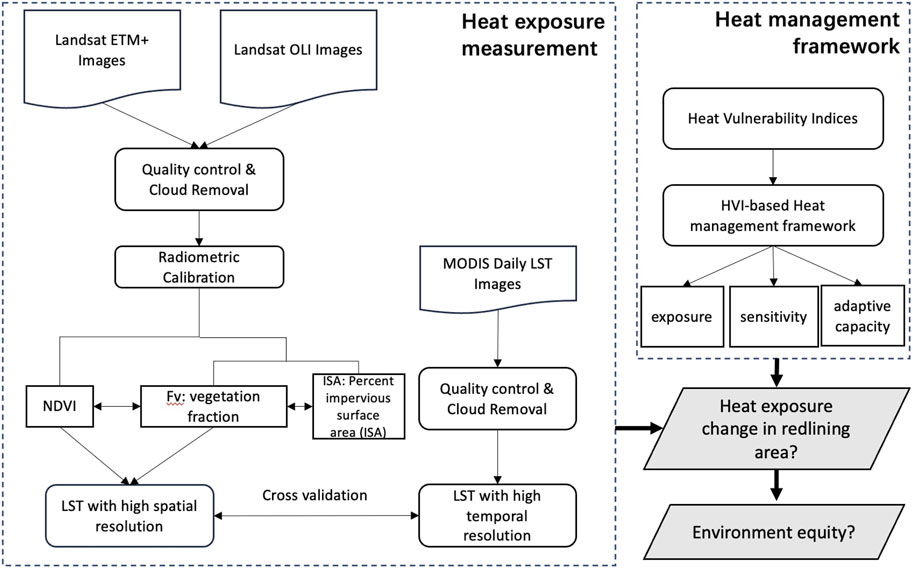
FIGURE 2. Research workflow.
First, the research unit is defined, and the dependent variable, heat exposure, is constructed and calculated. Heat exposure is measured using land surface temperature (LST) during summer in Charlotte. Based on the LST retrieval from the digital number (DN) of Landsat sensors’ “four-step framework” described by Sobrino et al. (2004) and developed by Li et al. (2022), we retrieved the summer LST of the research area for 2001 and 2020. Due to the low temporal resolution of Landsat data, high temporal resolution MODIS data is used to cross-validate the estimation results, ensuring that the Landsat data collection dates from 2001 to 2020 reflect a general summer day’s LST spatial distribution pattern. Next, the difference in cross-validated LST variables between 2001 and 2020 serves as the input for the subsequent Kruskal–Wallis test to compare the average LST change over the 20 years among the four HOLC grades (Wilson, 2020). The results will indicate whether the LST change is significantly different among the four grade areas and address the first research question. To answer the second research question, this paper refers to the heat management conceptual framework (Hess et al., 2002) and applies the socioeconomic and demographic factors from Chakraborty and Li, (2019)’s work to quantify the residents’ heat vulnerability in the research area. Finally, an interaction effect regression model is conducted to explore the association between heat exposure change and heat vulnerability changes from 2001 to 2020, considering the combined effect of HOLC grades (Simensen et al., 2010). The results will answer the second question and offer suggestions for future metropolitan heat mitigation strategies.
The results of the regression will reveal the association between changes in heat exposure in redlining areas over the past 20 years and changes in residents’ heat vulnerability. This association will inform the implications of the relationship between urban environmental changes leading to heat exposure variations and socioeconomic changes among redlining residents in the context of rapid urbanization and climate change from 2001 to 2020. By addressing the second research question, this study will provide policy implication for future environmental planning and heat management initiatives.
3.3 Dataset
To define the research unit, we take into account the research context of this case, which includes: the relatively small total area of Charlotte’s historical redlining areas, the comparatively large size of each redlining parcel in Charlotte, and the availability of socioeconomic attributes related to heat vulnerability for the years 2001 and 2020 in social census data. Consequently, we define our research unit as the block group in 2001. The block group is a unit employed in the U.S. social census system, serving as a geographic subdivision for aggregating population and demographic data. Regarding the changes in block group boundaries over the past 20 years, we discovered that all alterations were due to rapid population growth, leading to the decomposition of block groups from 2001 into several new block groups. Therefore, we use the block groups from 2019 as our research units. In this study, the sample size comprises 104 block groups. Among these 104 block groups, 22 were classified as Grade A, 27 as Grade B, 30 as Grade C, and 25 as Grade D. Overall, the distribution across the four grades is relatively balanced, and the proposed interaction-effect regression model is feasible in this study.
After defining the research units, we primarily utilized satellite images and social census data to construct variables for this study, as outlined in Table 1. Three types of variables were constructed. The first type measures changes in heat exposure from 2001 to 2020, as indicated by land surface temperature (LST). Higher LST values are associated with higher potential heat exposure (Huang et al., 2011). We selected Landsat 7 ETM+ and Landsat 8 OLI images from June 1 to August 31 in 2001 and 2020, ensuring cloud coverage was less than 5%. Then, based on the approaches of Sobrino et al. (2004), Li et al. (2022), and Xu et al. (2022a), we retrieved the LST of the research areas. Simultaneously, we collected corresponding MODIS daily daytime LST data for the same periods. The dataset is a widely used remote sensing product that provides global coverage of land surface temperature, featuring a spatial resolution of 1 km and a temporal resolution of daily observations (Liu et al., 2021). The MODIS LST dataset has been available since 18 March 2001, and well covers the whole research period. After removing poor-quality pixels to calculate the spatial patterns of daily LST in the 2 years, we applied this dataset to validate the representativeness of the selected dates’ spatial patterns.

TABLE 1. Variables and descriptions.
The second type of variable is dummy variables constructed based on the HOLC map. We referred to the divisions of the four HOLC grades on Charlotte’s 1935 HOLC redlining map from Mapping Inequality historical redlining map data portal1, constructing binary dummy variables for Grade B, Grade C, and Grade D.
The third type of variable involves socioeconomic factors. Based on the heat management framework, case studies of heat management in U.S. metropolitan statistical areas (Stone et al., 2014; Chakraborty and Li, 2022), and the criteria for HOLC map grade divisions (mainly the proportion of African Americans and income), we identified four relevant socioeconomic variables reflecting heat vulnerability in Table 1. The senior city rate and African American rate represent heat sensitivity, with higher proportions indicating increased heat sensitivity (Chakraborty and Li, 2022). Income and poverty rate serve as measurements of individual heat adaptivity. As income levels increase, residents’ heat adaptivity tends to be higher, primarily because higher-income individuals typically have greater access to resources, such as air conditioning and better-insulated housing, which enable them to better adapt to and cope with urban heat (Moore et al., 2017). In contrast, a high poverty rate indicates poor heat adaptivity among residents. It should be noted that, due to our sample size of 104, we should avoid having too many independent variables. Additionally, poverty rate and rent exhibit strong collinearity, and given that the median rent in Charlotte is generally high, along with higher incomes in downtown areas exceeding the poverty line established for North Carolina (Yan et al., 2012), we used the poverty rate as a control variable and did not interact it with the subsequent HOLC Grade dummy variables. These four variables were constructed based on the 2001 Decennial Social Census data and the 2019 American Community Survey (ACS) data.
3.4 LST retrieval
Due to the relatively small study area, we opted for fine spatial resolution Landsat satellite images to estimate land surface temperature. Given the relatively low temporal resolution of Landsat satellites, it is crucial to ensure that the selected dates are representative. We referred to the historical daily LST pattern calculated from MODIS data, which boasts high temporal accuracy (daily) but lower spatial resolution, to cross-validate and ensure that the chosen dates’ LST patterns reflect the general conditions during the summer. Table 2 presents the details of the two Landsat scenes employed in this study to retrieve land surface temperature. We selected scenes with cloud coverage below 5% between June 1 and August 31 in 2001 and 2020. Since the available images in 2001 are fewer than 2020, we first determine the image of 2001. Then based on its collection date, we selected the image from candidate images in 2020 ensuring that its date is sufficiently close to the 2001 date. As shown in Table 2, the selected scenes are free from cloud interference, and the satellite transit times are close to noon (corresponding to the time of MODIS daily daytime LST).
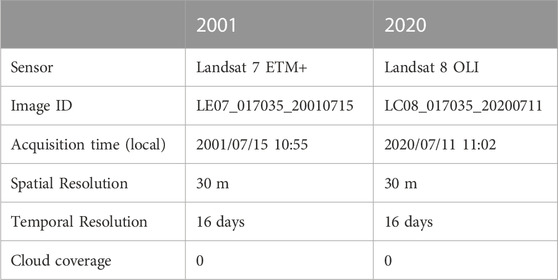
TABLE 2. Details of Landsat images data source for LST retrieval.
In this study, land surface temperature was estimated based on selected Landsat scenes, after removing all bad quality pixels. The land surface retrieval approaches by Sobrino et al. (2004) and Li et al. (2022) were primarily referred to, and MODIS daily daytime data was employed for cross-validation. A flowchart illustrating the process and cross-validation of LST retrieval can be found in Figure 2.
The digital number (DN) was first converted to radiance, followed by the calculation of the brightness LST, which represents temperature without considering land cover conditions. This calculation utilized Eq. 1, where Lλ is the spectral radiance converted from DN, and K1 and K2 are parameters derived from Landsat 7 and Landsat 8 handbooks (Landsat 7: K1 666.09; K21282.71; Landsat 8 K1: 774.8853, K2: 1321.0789).
Subsequently, the brightness LST was transferred to LST by considering real-world land cover conditions, as described in Eq. 2. The emissivity (ε) was calculated in Eq. 3 for Landsat 7 (Nicol, 2009) and Eq. 4 for Landsat 8 (Mehmood, 2022). λ is the wavelength of emitted radiance, taking a value of 11.5 μm (Markham and Barker, 1985); and α = hc/b (1.438 × 10⁻² m·K), h is the Planck’s constant (h = 6.626 × 10⁻³⁴ J·s), b is the Boltzmann constant (b = 1.38 × 10⁻²³ J/K), c is the speed of light (2.998 × 10⁸ m/s); ε is the surface emissivity and was estimated using the method proposed by Li et al. (2022), which can be calculated for Landsat 7 by Eq. 3 (Li et al., 2022) and Landsat 8 by Eq. 4 (Mehmood, 2022) with Fv being vegetation fraction derived from Normalized Difference Vegetation Index (NDVI) (Li et al., 2022)
Once we converted the brightness temperature to LST, we could apply it to measure heat exposure after conducting the cross-validation.
3.5 Regression model with interaction effect
To investigate the relationship between heat exposure changes represented by LST and heat vulnerability in historical redlining areas, this study constructs a regression model with interaction effect as shown in Eq. 5. In the equation, both dependent and independent variables are denoted as ΔY and ΔXi, respectively, measuring the changes in corresponding variables from 2001 to 2020.
In the regression model, the heat vulnerability variables are denoted as ΔXi, ranging from 1 to k, and the dummy variables representing HOLC grades are denoted as Dj, ranging from 1 to m. The coefficients of the changes in continuous independent variables are βi. The significance of these coefficients indicates that the changes in the corresponding heat vulnerability variables are significantly related to heat exposure changes across the entire study area. The coefficients of the dummy variables, δj, reflect the significant relationship between heat exposure changes and a specific HOLC grade area. The coefficients of the interaction terms between the changes in continuous independent variables and the dummy variables, γij, represent the significant relationship between the changes in a specific heat vulnerability variable and heat exposure changes within a particular HOLC grade area. The error term in the model is represented by ε. As all variables are scaled for direct comparison among regression coefficients, there is no intercept in this model.
4 Results
In this paper, the results section is organized into three sections, based on the study design. First, we calculate and cross-validate the spatial distribution pattern of Land Surface Temperature (LST) in the study area. Second, we provide a summary of the LST among the four HOLC grades and test for any significant differences in the average values. Lastly, we examine the relationship between changes in heat exposure and variations in heat vulnerability variables within the study area.
4.1 Heat exposure change patterns and cross validation
Figure 3 illustrates the land surface temperature (LST) distribution patterns calculated from Landsat 7 and Landsat 8 images in (A) 2001 and (B) 2020, respectively. Referring to Figure 3, which depicts the summer daily LST patterns measured by the MODIS daily LST dataset over 20 years, the LST values of the two dates when the Landsat images were captured are not outliers. Additionally, the correlation coefficients between MODIS-calculated LST and Landsat LST in the 104 block groups are 0.662 and 0.771, indicating that the spatial distribution patterns of LST measured by Landsat are typical and can be applied to quantify heat exposure.
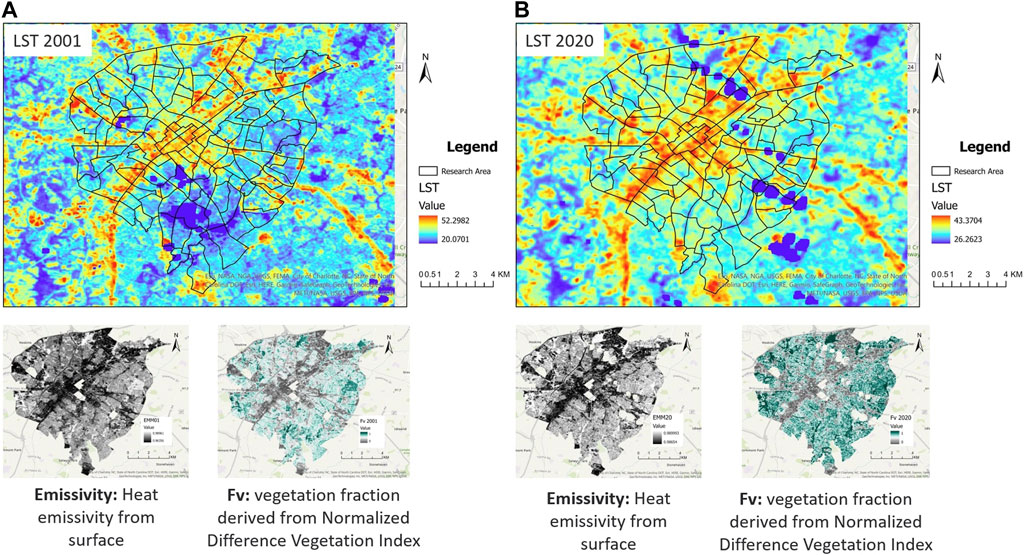
FIGURE 3. LST distribution pattern in 2001 and 2020 [(A) 2001, (B) 2020 both derived from the emissivity and Fraction of vegetation].
From 2001 to 2020, the average summer LST for the Research Area was 34.73°C, while the average for Mecklenburg County was 31.12°C, and for the MSA, it was 30.21°C. It is worth noting that the Research Area’s LST on 15 July 2001, was 33.93°C, and on 11 July 2020, it was 34.96°C. The standard deviation for the Research Area is 3.24°C, as shown in Figure 3. Therefore, regarding the heat exposure pattern, metropolitan heat mitigation strategies should specifically address urban downtown areas with historical racial inequality planning legacies. However, as reflected by standard deviation values, the LST values in the research area exhibit greater spatial heterogeneity in 2001. Many high values exceeding 50°C are present in the urban center’s redlined neighborhoods in 2001 but are absent in 2020. This change, particularly the high LST mitigation in redlined neighborhoods, is associated with a significant increase in NDVI, which is used to calculate the Fv parameter. The increase in NDVI values may imply the improvements in the urban environment, tree planting, and greening activities. Lastly, Figure 4 presents the spatial distribution of LST changes over 20 years among the 104 block groups. Generally, LST has significantly decreased in the urban center and the northwest area, corresponding to Grade C and Grade D on the HOLC map. In contrast, LST has significantly increased in the southeast area, which includes Grade A and Grade B regions.
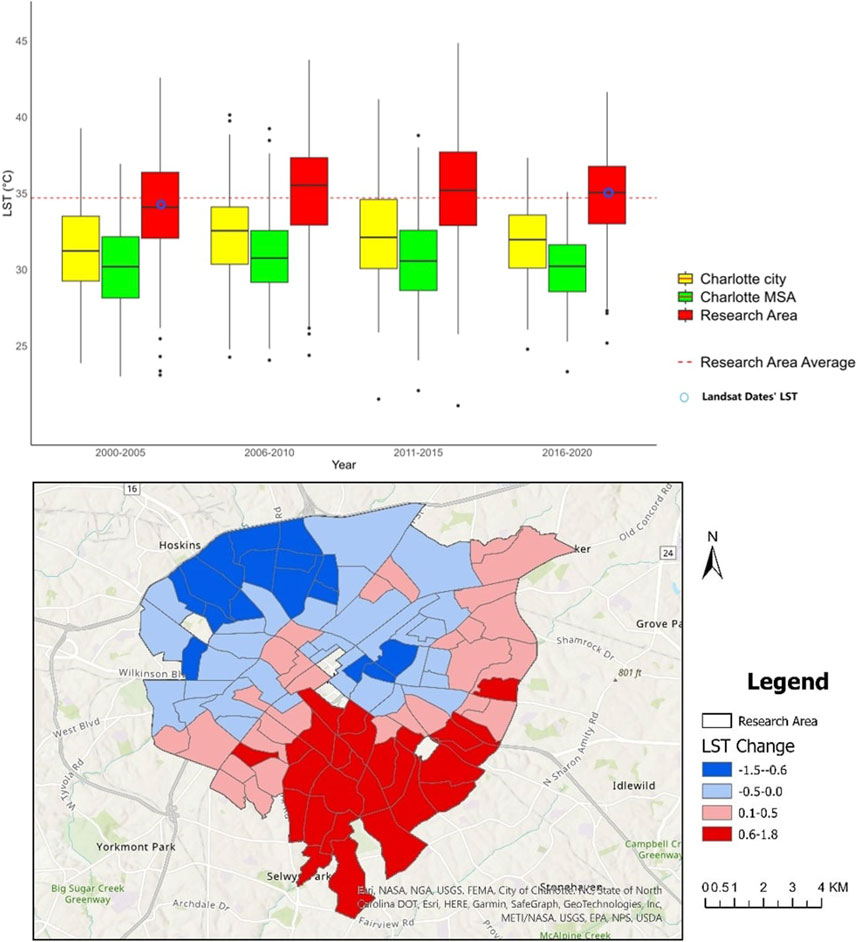
FIGURE 4. Spatial distribution of LST change (Cross-validated by daily LST).
4.2 LST change in redlining areas
The LST change pattern in Figure 5 exhibits noticeable spatial heterogeneity. When aggregating the retrieved LST into redlining parcels, this study identifies a significant difference among HOLC grades in Figure 5 Table 3. In 2001, it is evident that the LST in redlined areas (Grade C and Grade D) is significantly higher than in non-redlined areas, passing the Kruskal–Wallis (K-W) test. This suggests that redlining has a significant legacy on heat exposure, confirming the findings of previous studies and Rust Belt cities (Wilson, 2020). In contrast, by 2020, the LST in redlined and non-redlined areas fails to pass the Kruskal–Wallis test, indicating no significant difference between them. Over the 20-year period, the average LST in redlined areas has decreased, particularly in Grade D regions as shown on the HOLC map. This observation implies that heat exposure inequality among the four HOLC grades has been considerably mitigated. As a result, it appears that the negative legacy of redlining is being eliminated, and the physical environment of urban downtown areas is improving.
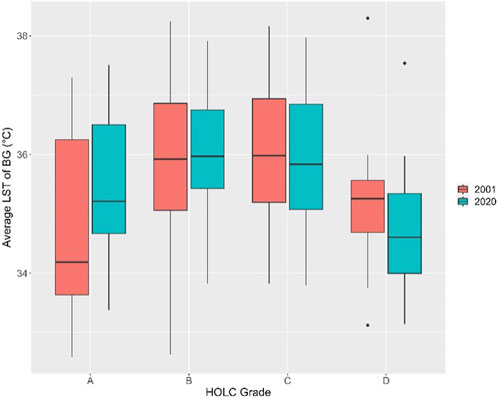
FIGURE 5. Box plot of blocked level LST average in redlining areas.
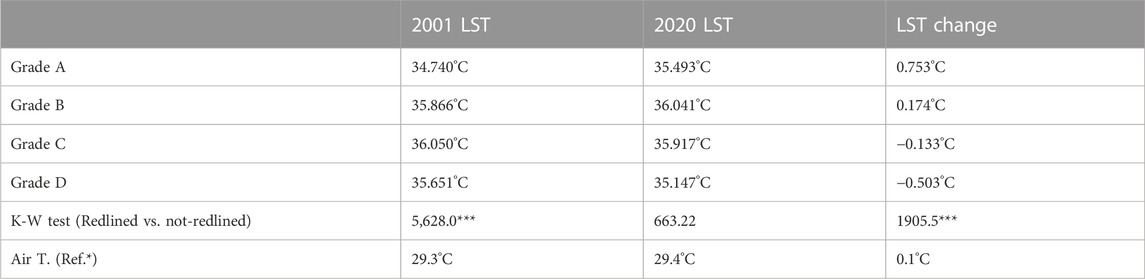
TABLE 3. LST changes in redlining areas.
4.3 Association between heat exposure and heat vulnerability change
Over 20 years, environmental improvements and heat exposure mitigation have occurred in redlining neighborhoods, particularly in historically redlined areas, as shown in Figure 3. This has led to changes in heat vulnerability variables, with noticeable variations among the four HOLC grade areas. The results of the regression model used in this study aim to address the second research question: “How do the association patterns between heat exposure and heat vulnerability change in these areas over the past two decades inform climate change adaptation, particularly within the heat management framework?"
The results from Table 4 show that heat exposure changes in redlining areas are significantly associated with heat vulnerability variables, as indicated by the F-value and overall p-value. This suggests that at least heat vulnerability change variables, HOLC grades, or their interaction effect have a significant correlation with heat exposure changes. The redlined dummy variables (Grade C and Grade D) are negatively associated with heat exposure, consistent with the results of the Kruskal–Wallis test. Among the heat vulnerability variables, their relationships with heat exposure differ and vary among HOLC grades. The changes in senior citizen rate are not significantly related to heat exposure changes, but the changes in the African American population and income, which are highly related to HOLC grade divisions on the redlining map, have a significant yet opposite relationship with heat exposure changes. Over the past 20 years, as heat exposure in the research area has decreased, high heat sensitivity and low adaptivity social groups have left these environmentally improved areas, not benefiting from the implemented heat mitigation strategies. This phenomenon indicates a potential environmental gentrification or displacement effect (Checker, 2011). Since all variables have been standardized and the regression coefficients can be directly compared, the interaction effect’s regression coefficients between redlined areas and heat vulnerability imply that, compared to other urban areas, redlined areas may experience more obvious and severe environmental gentrification triggered by heat mitigation strategies. This pattern is worth discussing in conjunction with the environmental improvements in historical redlining areas over the past two decades in the following section.
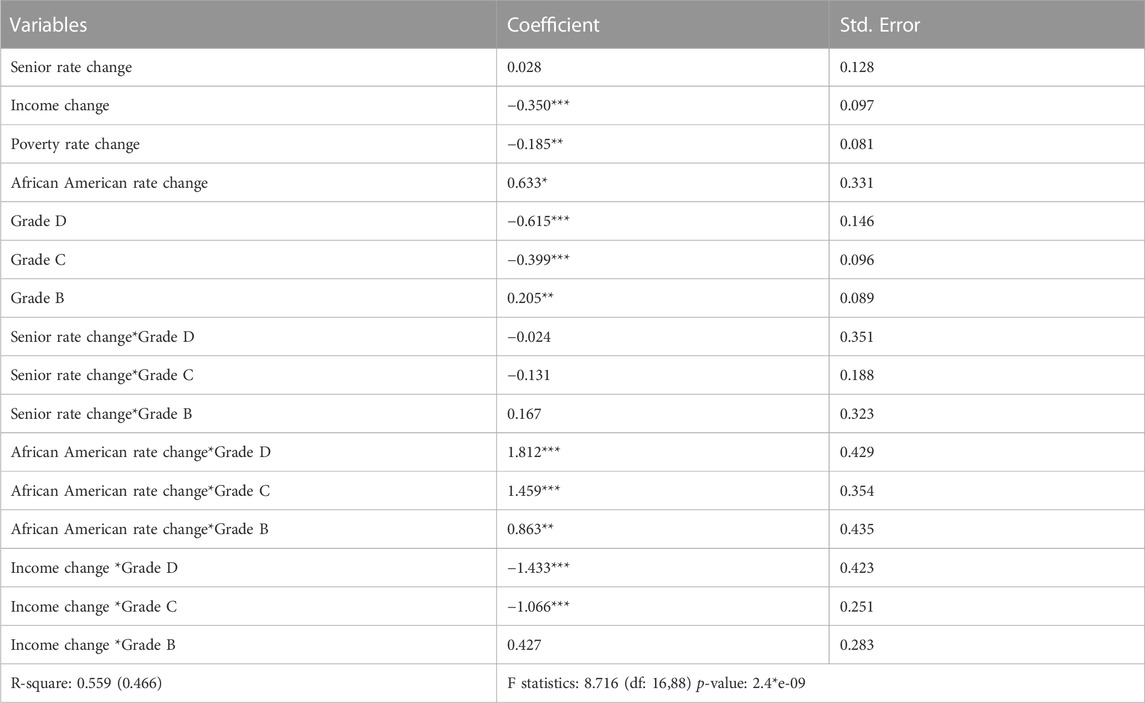
TABLE 4. Regression results.
5 Discussion
The LST pattern results reveal that from 2001 to 2020, the land surface temperature in Grade D areas has significantly decreased during the summer, reducing heat exposure. However, the nested regression model uncovers that the decrease in heat exposure in redlined areas is associated with the reduction of low heat adaptivity and high vulnerability social groups in these regions. To explain the change in heat exposure, this study examines the changes in land cover and local heat mitigation strategies in the redlined areas over the past 20 years. Furthermore, to account for the change of heat vulnerable groups as heat exposure decreases, we discuss this phenomenon from the perspective of environmental gentrification and explore its planning implications.
5.1 Heat exposure mitigation and urban regreening
Between 2001 and 2020, changes in heat exposure, as reflected by land surface temperature (LST), have been observed, and this study posits that these changes may be linked to improvements in urban environments, particularly urban heat mitigation projects like urban greening projects. Research on the biophysical processes of the urban heat island effect demonstrates that urban LST is closely related to land cover, especially impervious surfaces and vegetation land cover. As urban greening activities are carried out, land cover transitions from impervious surfaces to vegetation land cover, leading to a significant change in LST. According to Oke (1982) Song and Wu (2016), the energy mechanisms underlying the urban heat island effect involve a shift from sensible heat to latent heat as land cover changes. Before urban greening initiatives, impervious surfaces primarily contributed to sensible heat, which is the heat energy directly exchanged between the ground and the atmosphere. However, as land cover transitions to vegetation, the heat transfer mechanism shifts to latent heat, which is the energy absorbed or released during phase changes of water, such as evaporation or condensation. This transformation results in a significant decrease in surface temperature. Furthermore, previous research has shown that even small, scattered urban regreening projects can have a substantial neighborhood effect on heat mitigation. According to Cheng et al. (2015), these projects can reduce heat exposure in larger surrounding areas, demonstrating the potential impact of urban greening initiatives on a broader spatial scale.
In Charlotte, the land cover changes in Grade C and Grade D areas can be illustrated by the changes in the annual maximum NDVI values of each pixel, as different vegetation types within the city exhibit unique phenological characteristics. Consequently, the maximum NDVI values better reflect urban vegetation coverage (Song and Wu, 2016; Tong et al., 2021). Based on this, the study first examines the general land cover changes and regreening patterns by calculating the changes in the annual maximum NDVI values of each pixel between 2001 and 2020. As seen in Figure 4, the annual largest NDVI of Grade C and Grade D areas in Charlotte increased considerably between 2001 and 2020, while Grade A and Grade B areas experienced a reduction in many places. Grade C and Grade D areas are generally closer to the city center and, in 2001, are predominantly covered by impervious surfaces (Westendorff, 2020). Various urban regreening projects have significantly changed land cover and reduced the neighborhood LST over a larger area. For instance, Figure 6 highlights numerous scattered regreening projects, such as eco-housing projects and strip-like greenbelts in these areas.
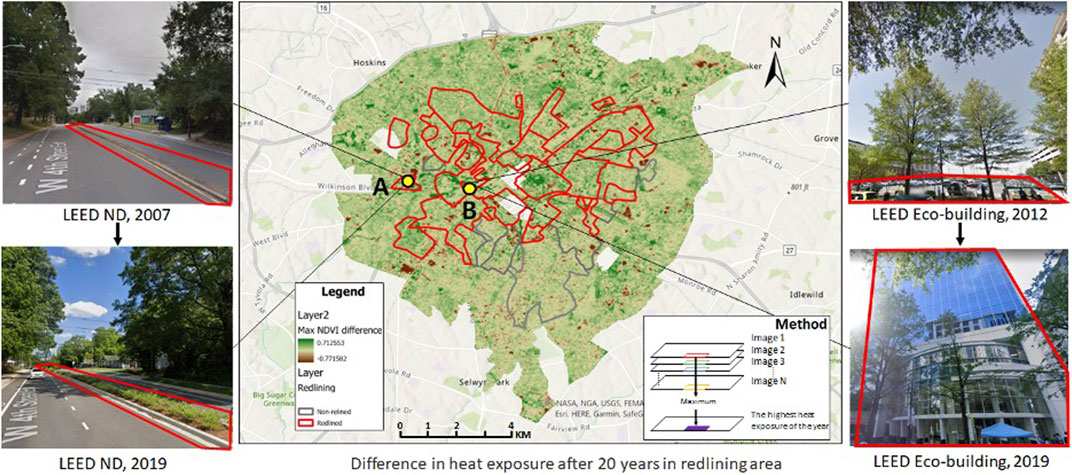
FIGURE 6. Representative re-greening projects with cooling effect. [The map displayed the NDVI changes over 20 years, (A) and (B) are two sample sites with urban re-greening projects mitigating the heat exposure in the redlined areas].
LEED (Leadership in Energy and Environmental Design) is the most widely used green building rating system in the world. Available for virtually all building types, LEED provides a framework for healthy, efficient, and cost-saving green buildings. The city of Charlotte has been promoting the LEED for Neighborhood Development (LEED ND) project and LEED eco-housing project since 2007, which is a national initiative designed to encourage and support the creation of more sustainable, well-connected neighborhoods. Point A in the picture shows a green belt built in the center of a multi-family residential neighborhood, while point B represents an eco-building constructed as a replacement of an existing downtown parking lot, featuring a building-wide cooling system and meeting sustainable building standards. These typical heat mitigation strategies often occur in the original redlined area (marked in red in Figure 5), where the low renovation costs have significantly improved the NDVI level after regreening. We used the maximum LST obtained at regular intervals to demonstrate that the greatest reduction in the highest heat exposure over 20 years occurred in the historical redlined area where the regreening project was concentrated.
Although most regreening projects were not directly aimed at heat mitigation but rather focused on urban water conservation, reducing the impact of transportation routes, and saving energy (Charlotte Master Plan), their implementation has objectively lowered the LST in these areas due to the biophysical mechanisms of the urban heat island effect. Through this analysis, it becomes evident that urban regreening projects in Charlotte’s redlined areas over the past two decades have generated substantial ecological benefits, significantly reducing urban LST and residents’ heat exposure. If these heat mitigation effects can benefit heat-vulnerable groups, namely, those social groups with low adaptivity and high sensitivity, the city’s heat management goals can be achieved. By prioritizing the needs of these vulnerable populations, urban planners and policymakers can help ensure that regreening initiatives continue to enhance environmental quality and reduce heat-related risks for all residents.
5.2 Heat exposure mitigation and environmental inequity
The results of the regression model considering the interaction effect reveal that although heat mitigation strategies, such as urban greening projects, have effectively reduced urban LST and heat exposure for residents in Charlotte, the decrease in LST within redlined areas is significantly correlated with the reduction of heat vulnerable groups, particularly African Americans and low-income populations. Overall, heat mitigation strategies might not have benefited the heat vulnerable groups within the study area, ultimately failing to achieve the goals of urban heat management.
The relationship between changes in heat exposure and heat vulnerability group distribution over 20 years in Charlotte may reflect an environmental gentrification process driven by urban heat mitigation strategies. Environmental gentrification refers to a process where urban neighborhoods experience revitalization and improvements in environmental quality, leading to an influx of more affluent residents and the displacement of lower-income residents (Checker, 2011). This concept has gained traction in recent years as cities increasingly prioritize sustainable development, green spaces, and environmental improvements. In the implementation of urban heat mitigation strategies, urban regreening projects occurring in Grade C and Grade D areas may improve the urban environment while attracting higher-income individuals and white communities to these formerly declining areas with redlining legacies. During this process, housing prices and living costs increase significantly, but the improved neighborhood physical environment does not directly translate into economic benefits (Wu and Rowe, 2022). The previously urban vulnerable groups, who are also socio-economically disadvantaged, may be enforced to leave their original communities due to the rising costs of living, thus preventing them from benefiting from heat mitigation strategies. This is consistent with the regression analysis, where the increase in income as a measure of heat adaptivity is significantly correlated with the decrease in LST in Grade D and Grade C areas.
In particular, Charlotte has been one of the fastest-growing cities in the United States in terms of population and metropolitan area expansion over the past two decades. For the downtown area, a trajectory of urban retrofitting spanning nearly two decades has contributed to consistent improvements in environmental quality and urban greenery, culminating in an increasingly habitable residential environment. However, concomitant with the enhancement of living conditions has been the escalation of land prices. As the downtown district concurrently experiences environmental amelioration through retrofitting, it also undergoes redevelopment, signifying the encroachment of an escalating number of high-return investment projects, vying for the urban core’s real estate. Consequently, marginalized communities with heightened vulnerability to urban heat exposure, who once resided in the downtown area, may be compelled to relocate from the ameliorated regions due to rising living costs. As a result, the outcomes of environmental enhancement are challenging to extend to these thermally vulnerable groups. This phenomenon resonates with the international trend of green gentrification that has garnered attention in recent years. In global metropolises such as New York (Pearsall, 2010), Toronto (Parish, 2020), and Hong Kong (Ye et al., 2015), the consequences of environmental improvement do not universally benefit the entirety of the resident population. This result also echoes with notion of equity while reaching the sustainable and comprehensive goal through NBS and SES (Mafi-Gholami et al., 2021; Liu et al., 2022).
6 Conclusion
The study’s results suggest that, despite the alleviation of heat exposure in Charlotte’s city center in the past two decades, thanks to urban retrofitting and heat mitigation strategies. However, improved environmental conditions may have resulted in social disadvantage groups being forced to relocate, thereby not benefiting from heat management efforts. This raises the potential risk of exacerbating environmental inequity within larger urban spaces, which is consistent with the trend of green gentrification observed in megacities. Another critical insight is that the influence of policy legacy on the urbanization process cannot be disregarded in the heat management process, even in the late urbanization phase of the megacity’s urban retrofitting. Therefore, heat management research in metropolitan areas requires more precise and long-term heat exposure analysis, as well as the integration of urban heat management frameworks to achieve the vision of environmental equity.
The implications of this research echoes with the increasing shift toward a more holistic and sustainable methodological approach in cities worldwide. Nature-based solutions, adaptive modeling, and considerations of social equity emerge as pivotal strategies for effective climate adaptation (Augusto et al., 2020; Ascenso et al., 2021; Liu et al., 2022; Cong et al., 2023). We believe that the integration of a consideration of both short and long-term impacts, inward and outward factors collectively contribute to a nuanced understanding of urban strategies aimed at tackling climate challenges. As cities continue to adapt to the realities of climate change, these insights become instrumental in shaping effective and inclusive urban environmental mitigation policies.
Data availability statement
Publicly available datasets were analyzed in this study. This data can be found here: Remote Sensing Dataset: https://earthexplorer.usgs.gov/American Community Survey Data: https://www.census.gov/programs-surveys/acs/data.html Decennial Census of Population and Housing: https://www.census.gov/programs-surveys/decennial-census/data.html. Mapping inequality to retrieve redlining delineation https://dsl.richmond.edu/panorama/redlining/.
Author contributions
Conceptualization, XL and XM; methodology, XL; writing, XL, XM, FL, and YS. All authors contributed to the article and approved the submitted version.
Funding
The work was supported by the National Natural Science Foundation of China 42101192 and UNC DEI research grant.
Acknowledgments
The authors thank Conghe Song, Department of Geography in UNC Chapel Hill, for his guidance in idea development and remote sensing technique suggestions.
Conflict of interest
The authors declare that the research was conducted in the absence of any commercial or financial relationships that could be construed as a potential conflict of interest.
Publisher’s note
All claims expressed in this article are solely those of the authors and do not necessarily represent those of their affiliated organizations, or those of the publisher, the editors and the reviewers. Any product that may be evaluated in this article, or claim that may be made by its manufacturer, is not guaranteed or endorsed by the publisher.
Footnotes
1https://dsl.richmond.edu/panorama/redlining/#loc=5/39.1/-94.58
References
Addanki, S. C., and Venkataraman, H. (2017). Greening the economy: a review of urban sustainability measures for developing new cities. Sustain. Cities Soc. 32, 1–8. doi:10.1016/j.scs.2017.03.009
Akkose, G., Akgul, C. M., and Dino, I. G. (2021). Educational building retrofit under climate change and urban heat island effect. J. Build. Eng. 40, 102294. doi:10.1016/j.jobe.2021.102294
Amorim-Maia, A. T., Anguelovski, I., Chu, E., and Connolly, J. (2022). Intersectional climate justice: a conceptual pathway for bridging adaptation planning, transformative action, and social equity. Urban Clim. 41, 101053. doi:10.1016/j.uclim.2021.101053
Anguelovski, I., Connolly, J. J., Pearsall, H., Shokry, G., Checker, M., Maantay, J., et al. (2019). Why green “climate gentrification” threatens poor and vulnerable populations. Proc. Natl. Acad. Sci. 116 (52), 26139–26143. doi:10.1073/pnas.1920490117
Ascenso, A., Augusto, B., Silveira, C., Rafael, S., Coelho, S., Monteiro, A., et al. (2021). Impacts of nature-based solutions on the urban atmospheric environment: a case study for eindhoven, The Netherlands. Urban For. Urban Green. 57, 126870. doi:10.1016/j.ufug.2020.126870
Augusto, B., Roebeling, P., Rafael, S., Ferreira, J., Ascenso, A., and Bodilis, C. (2020). Short and medium-to long-term impacts of nature-based solutions on urban heat. Sustain. Cities Soc. 57, 102122. doi:10.1016/j.scs.2020.102122
Birkmann, J., Sauter, H., Garschagen, M., Fleischhauer, M., Puntub, W., Klose, C., et al. (2021). New methods for local vulnerability scenarios to heat stress to inform urban planning—Case study city of Ludwigsburg/Germany. Clim. Change 165, 37–20. doi:10.1007/s10584-021-03005-3
Baniassadi, A., Sailor, D. J., Krayenhoff, E. S., Broadbent, A. M., and Georgescu, M. (2019). Passive survivability of buildings under changing urban climates across eight US cities. Environ. Res. Lett. 14 (7), 074028. doi:10.1088/1748-9326/ab28ba
Bolin, B., Barreto, J. D., Hegmon, M., Meierotto, L., and York, A. (2013). Double exposure in the sunbelt: The sociospatial distribution of vulnerability in Phoenix, Arizona. Urbanization and sustainability: Linking urban ecology. Environ. equity Glob. Environ. change, 159–178. doi:10.1007/978-94-007-5666-3_10
Chakraborty, A., and Li, X. (2022). Exploring the heterogeneity in relationship between heat exposure and land development in Mumbai, India: a framework to address urban vulnerability in developing megacities. J. Environ. Plan. Manag. 65 (2), 337–355. doi:10.1080/09640568.2021.1884050
Chapman, S., Watson, J. E., Salazar, A., Thatcher, M., and McAlpine, C. A. (2017). The impact of urbanization and climate change on urban temperatures: a systematic review. Landsc. Ecol. 32, 1921–1935. doi:10.1007/s10980-017-0561-4
Checker, M. (2011). Wiped out by the “greenwave”: Environmental gentrification and the paradoxical politics of urban sustainability. City & Soc. 23 (2), 210–229. doi:10.1111/j.1548-744x.2011.01063.x
Cheng, X., Wei, B., Chen, G., Li, J., and Song, C. (2015). Influence of park size and its surrounding urban landscape patterns on the park cooling effect. J. Urban Plan. Dev. 141 (3), A4014002. doi:10.1061/(asce)up.1943-5444.0000256
Christenson, M., Geiger, S. D., Phillips, J., Anderson, B., Losurdo, G., and Anderson, H. A. (2017). Heat vulnerability index mapping for Milwaukee and Wisconsin. J. public health Manag. Pract. 23 (4), 396–403. doi:10.1097/phh.0000000000000352
Cong, C., Pan, H., Page, J., Barthel, S., and Kalantari, Z. (2023). Modeling place-based nature-based solutions to promote urban carbon neutrality. Ambio 52 (8), 1297–1313. doi:10.1007/s13280-023-01872-x
Cross, R. I., Huỳnh, J., Bradford, N. J., and Francis, B. (2023). Racialized housing discrimination and population health: a scoping review and research agenda. J. Urban Health, 1–34. doi:10.1007/s11524-023-00725-y
D'Aquila, S. (2022). The legacy of redlining and the disproportionate exposure to extreme heat in Seattle. Washington: Doctoral dissertation, University of Washington.
Daniel, M., Lemonsu, A., and Viguie, V. (2018). Role of watering practices in large-scale urban planning strategies to face the heat-wave risk in future climate. Urban Clim. 23, 287–308. doi:10.1016/j.uclim.2016.11.001
Derakhshan, S., Bautista, T. N., Bouwman, M., Huang, L., Lee, L., Tarczynski, J., et al. (2023). Smartphone locations reveal patterns of cooling center use as a heat mitigation strategy. Appl. Geogr. 150, 102821. doi:10.1016/j.apgeog.2022.102821
Dixon, F. A., Yssel, N., McConnell, J. M., and Hardin, T. (2014). Differentiated instruction, professional development, and teacher efficacy. J. Educ. Gift. 37 (2), 111–127. doi:10.1177/0162353214529042
Eastin, M. D., Baber, M., Boucher, A., Di Bari, S., Hubler, R., Stimac-Spalding, B., et al. (2018). Temporal variability of the Charlotte (sub) urban heat island. J. Appl. Meteorology Climatol. 57 (1), 81–102. doi:10.1175/jamc-d-17-0099.1
Ernstson, H. (2013). The social production of ecosystem services: a framework for studying environmental justice and ecological complexity in urbanized landscapes. Landsc. Urban Plan. 109 (1), 7–17.
Fedele, G., Donatti, C. I., Harvey, C. A., Hannah, L., and Hole, D. G. (2019). Transformative adaptation to climate change for sustainable social-ecological systems. Environ. Sci. Policy 101, 116–125. doi:10.1016/j.envsci.2019.07.001
Fiack, D., Cumberbatch, J., Sutherland, M., and Zerphey, N. (2021). Sustainable adaptation: Social equity and local climate adaptation planning in US cities. Cities 115, 103235. doi:10.1016/j.cities.2021.103235
Gaber, N., Ibrahim, A., Rashad, A. B., Wahba, E., El-Sayad, Z., and Bakr, A. F. (2020). Improving pedestrian micro-climate in urban canyons: City Center of Alexandria, Egypt. Urban Clim. 34, 100670. doi:10.1016/j.uclim.2020.100670
García, D. H., and Díaz, J. A. (2023). Space–time analysis of the earth's surface temperature, surface urban heat island and urban hotspot: Relationships with variation of the thermal field in andalusia (Spain). Urban Ecosyst. 26, 525–546. doi:10.1007/s11252-022-01321-9
Gonzalez, D. J., Nardone, A., Nguyen, A. V., Morello-Frosch, R., and Casey, J. A. (2023). Historic redlining and the siting of oil and gas wells in the United States. J. Expo. Sci. Environ. Epidemiol. 33 (1), 76–83. doi:10.1038/s41370-022-00434-9
Gould, K. A., and Lewis, T. L. (2018). From green gentrification to resilience gentrification: an example from Brooklyn.
Grilo, F., Pinho, P., Aleixo, C., Catita, C., Silva, P., Lopes, N., et al. (2020). Using green to cool the grey: Modelling the cooling effect of green spaces with a high spatial resolution. Sci. Total Environ. 724, 138182. doi:10.1016/j.scitotenv.2020.138182
Grove, M., Ogden, L., Pickett, S., Boone, C., Buckley, G., Locke, D. H., et al. (2018). The legacy effect: Understanding how segregation and environmental injustice unfold over time in Baltimore. Ann. Am. Assoc. Geogr. 108 (2), 524–537. doi:10.1080/24694452.2017.1365585
Gunawardena, K. R., Wells, M. J., and Kershaw, T. (2017). Utilising green and bluespace to mitigate urban heat island intensity. Sci. Total Environ. 584, 1040–1055. doi:10.1016/j.scitotenv.2017.01.158
Hamstead, Z. A., Farmer, C., and McPhearson, T. (2018). Landscape-based extreme heat vulnerability assessment. J. Extreme Events 5 (04), 1850018. doi:10.1142/s2345737618500185
Harlan, S. L., Brazel, A. J., Darrel Jenerette, G., Jones, N. S., Larsen, L., Prashad, L., et al. (2007). “In the shade of affluence: The inequitable distribution of the urban heat island,” in Equity and the environment (Emerald Group Publishing Limited), 173–202.
Hepburn, C., Qi, Y., Stern, N., Ward, B., Xie, C., and Zenghelis, D. (2021). Towards carbon neutrality and China's 14th Five-Year Plan: Clean energy transition, sustainable urban development, and investment priorities. Environ. Sci. Ecotechnology 8, 100130. doi:10.1016/j.ese.2021.100130
Herath, P., Thatcher, M., Jin, H., and Bai, X. (2021). Effectiveness of urban surface characteristics as mitigation strategies for the excessive summer heat in cities. Sustain. Cities Soc. 72, 103072. doi:10.1016/j.scs.2021.103072
Hess, U., Richter, K., and Stoppa, A. (2002). Climate risk and the weather market, financial risk management with weather hedges. London: Risk Books.Weather risk management for agriculture and agri-business in developing countries
Hoffman, J. S., Shandas, V., and Pendleton, N. (2020). The effects of historical housing policies on resident exposure to intra-urban heat: a study of 108 US urban areas. Climate 8 (1), 12. doi:10.3390/cli8010012
Huang, G., Zhou, W., and Cadenasso, M. L. (2011). Is everyone hot in the city? Spatial pattern of land surface temperatures, land cover and neighborhood socioeconomic characteristics in Baltimore, MD. J. Environ. Manag. 92 (7), 1753–1759. doi:10.1016/j.jenvman.2011.02.006
Inostroza, L., Palme, M., and De La Barrera, F. (2016). A heat vulnerability index: Spatial patterns of exposure, sensitivity and adaptive capacity for Santiago de Chile. PLOS one 11 (9), e0162464. doi:10.1371/journal.pone.0162464
Jenerette, G. D., Harlan, S. L., Stefanov, W. L., and Martin, C. A. (2011). Ecosystem services and urban heat riskscape moderation: Water, green spaces, and social inequality in Phoenix, USA. Ecol. Appl. 21 (7), 2637–2651. doi:10.1890/10-1493.1
Kraemer, R., and Kabisch, N. (2022). Parks under stress: air temperature regulation of urban green spaces under conditions of drought and summer heat. Front. Environ. Sci. 318. doi:10.3389/fenvs.2022.849965
Lane, H. M., Morello-Frosch, R., Marshall, J. D., and Apte, J. S. (2022). Historical redlining is associated with present-day air pollution disparities in US cities. Environ. Sci. Technol. Lett. 9 (4), 345–350. doi:10.1021/acs.estlett.1c01012
Lee, E. K., Donley, G., Ciesielski, T. H., Yamoah, O., Roche, A., Martinez, R., et al. (2022). Health outcomes in redlined versus non-redlined neighborhoods: a systematic review and meta-analysis. Soc. Sci. Med. 294, 114696. doi:10.1016/j.socscimed.2021.114696
Li, C., Lu, L., Fu, Z., Sun, R., Pan, L., Han, L., et al. (2022). Diverse cooling effects of green space on urban heat island in tropical megacities. Front. Environ. Sci. 10, 2400. doi:10.3389/fenvs.2022.1073914
Li, D., Newman, G. D., Wilson, B., Zhang, Y., and Brown, R. D. (2022). Modeling the relationships between historical redlining, urban heat, and heat-related emergency department visits: an examination of 11 Texas cities. Environ. Plan. B Urban Anal. City Sci. 49 (3), 933–952. doi:10.1177/23998083211039854
Li, M., and Yuan, F. (2022). Historical redlining and food environments: a study of 102 urban areas in the United States. Health & Place 75, 102775. doi:10.1016/j.healthplace.2022.102775
Liu, H., Huang, B., Gao, S., Wang, J., Yang, C., and Li, R. (2021). Impacts of the evolving urban development on intra-urban surface thermal environment: Evidence from 323 Chinese cities. Sci. total Environ. 771, 144810. doi:10.1016/j.scitotenv.2020.144810
Liu, Y., Gao, Y., Liu, L., Song, C., and Ai, D. (2022). Nature-based solutions for urban expansion: Integrating ecosystem services into the delineation of growth boundaries. Habitat Int. 124, 102575. doi:10.1016/j.habitatint.2022.102575
Lynch, E. E., Malcoe, L. H., Laurent, S. E., Richardson, J., Mitchell, B. C., and Meier, H. C. (2021). The legacy of structural racism: associations between historic redlining, current mortgage lending, and health. SSM-population health 14, 100793. doi:10.1016/j.ssmph.2021.100793
Lyu, F., Wang, S., Han, S. Y., and Catlett, C. (2022). An integrated cyberGIS and machine learning framework for fine-scale prediction of Urban Heat Island using satellite remote sensing and urban sensor network data. Urban Info 1, 6. doi:10.1007/s44212-022-00002-4
Mafi-Gholami, D., Pirasteh, S., Ellison, J. C., and Jaafari, A. (2021). Fuzzy-based vulnerability assessment of coupled social-ecological systems to multiple environmental hazards and climate change. J. Environ. Manag. 299, 113573. doi:10.1016/j.jenvman.2021.113573
Markham, B. L., and Barker, J. L. (1985). Spectral characterization of the Landsat Thematic Mapper sensors. Int. J. Remote Sens. 6 (5), 697–716. doi:10.1080/01431168508948492
McCarthy, M. P., Best, M. J., and Betts, R. A. (2010). Climate change in cities due to global warming and urban effects. Geophys. Res. Lett. 37 (9). doi:10.1029/2010gl042845
Mehmood, M. S., et al. (2022). Evaluating land use/cover change associations with urban surface temperature via machine learning and spatial modelling: Past trends and future simulations in Dera Ghazi khan, Pakistan. Front. Ecol. Evol. 11, 232. doi:10.3389/fevo.2023.1115074/full
Méndez-Lázaro, P., Muller-Karger, F. E., Otis, D., McCarthy, M. J., and Rodríguez, E. (2018). A heat vulnerability index to improve urban public health management in San Juan, Puerto Rico. Int. J. biometeorology 62, 709–722. doi:10.1007/s00484-017-1319-z
Moore, T., Ridley, I., Strengers, Y., Maller, C., and Horne, R. (2017). Dwelling performance and adaptive summer comfort in low-income Australian households. Build. Res. Inf. 45 (4), 443–456. doi:10.1080/09613218.2016.1139906
Nardone, A., Rudolph, K. E., Morello-Frosch, R., and Casey, J. A. (2021). Redlines and greenspace: The relationship between historical redlining and 2010 greenspace across the United States. Environ. health Perspect. 129 (1), 017006. doi:10.1289/ehp7495
Nichol, J. (2009). An emissivity modulation method for spatial enhancement of thermal satellite images in urban heat island analysis. Photogramm. Eng. Remote Sens. 75 (5), 547–556. doi:10.14358/pers.75.5.547
Oke, T. R. (1982). The energetic basis of the urban heat island. Q. J. R. meteorological Soc. 108 (455), 1–24. doi:10.1002/qj.49710845502
Oliveira, S., Andrade, H., and Vaz, T. (2011). The cooling effect of green spaces as a contribution to the mitigation of urban heat: a case study in lisbon. Build. Environ. 46 (11), 2186–2194. doi:10.1016/j.buildenv.2011.04.034
Osberghaus, D., and Abeling, T. (2022). Heat vulnerability and adaptation of low-income households in Germany. Glob. Environ. Change 72, 102446. doi:10.1016/j.gloenvcha.2021.102446
Parish, J. (2020). Re-Wilding parkdale? Environmental gentrification, settler colonialism, and the reconfiguration of nature in 21st century Toronto. Environ. Plan. E Nat. Space 3 (1), 263–286. doi:10.1177/2514848619868110
Pearsall, H. (2010). From brown to green? Assess. Soc. vulnerability Environ. gentrification N. Y. City. Environ. Plan. C Gov. Policy 28 (5), 872–886. doi:10.1068/c08126
Qin, X., Wu, X., Chiew, Y. M., and Li, Y. (2012). A green roof test bed for stormwater management and reduction of urban heat island effect in Singapore. Br. J. Environ. Clim. Change 2 (4), 410–420. doi:10.9734/bjecc/2012/2704
Roberts, J. D., Dickinson, K. L., Hendricks, M. D., and Jennings, V. (2022). “I can’t breathe”: Examining the legacy of American racism on determinants of health and the ongoing pursuit of environmental justice. Curr. Environ. health Rep. 9 (2), 211–227. doi:10.1007/s40572-022-00343-x
Rosenthal, J. K., Kinney, P. L., and Metzger, K. B. (2014). Intra-urban vulnerability to heat-related mortality in New York City. Health & place 30, 45–60. doi:10.1016/j.healthplace.2014.07.014
Sanchez, L., and Reames, T. G. (2019). Cooling Detroit: a socio-spatial analysis of equity in green roofs as an urban heat island mitigation strategy. Urban For. Urban Green. 44, 126331. doi:10.1016/j.ufug.2019.04.014
Sandlos, J., and Keeling, A. (2016). Toxic legacies, slow violence, and environmental injustice at Giant Mine, Northwest Territories. North. Rev. (42), 7–21. doi:10.22584/nr42.2016.002
Seong, K., Jiao, J., and Mandalapu, A. (2023). Evaluating the effects of heat vulnerability on heat-related emergency medical service incidents: Lessons from Austin, Texas. Tex. Environ. Plan. B Urban Anal. City Sci. 50 (3), 776–795. doi:10.1177/23998083221129618
Siemsen, E., Roth, A., and Oliveira, P. (2010). Common method bias in regression models with linear, quadratic, and interaction effects. Organ. Res. methods 13 (3), 456–476. doi:10.1177/1094428109351241
Sobrino, J. A., Jiménez-Muñoz, J. C., and Paolini, L. (2004). Land surface temperature retrieval from LANDSAT TM 5. Remote Sens. Environ. 90 (4), 434–440. doi:10.1016/j.rse.2004.02.003
Song, Y., and Wu, C. (2016). Examining the impact of urban biophysical composition and neighboring environment on surface urban heat island effect. Adv. Space Res. 57 (1), 96–109. doi:10.1016/j.asr.2015.10.036
Stone, B., Vargo, J., Liu, P., Habeeb, D., DeLucia, A., Trail, M., et al. (2014). Avoided heat-related mortality through climate adaptation strategies in three US cities. PloS one 9 (6), e100852. doi:10.1371/journal.pone.0100852
Swope, C. B., Hernández, D., and Cushing, L. J. (2022). The relationship of historical redlining with present-day neighborhood environmental and health outcomes: a scoping review and conceptual model. J. Urban Health 99 (6), 959–983. doi:10.1007/s11524-022-00665-z
Tong, S., Prior, J., McGregor, G., Shi, X., and Kinney, P. (2021). Urban heat: an increasing threat to global health. bmj, 375.
Tosé, B. (2023). Developing an anti-displacement toolkit for Charlotte, NC: an assessment of strategies from the fastest-growing US metros.
Turner, B. L., Kasperson, R. E., Matson, P. A., McCarthy, J. J., Corell, R. W., Christensen, L., et al. (2003). A framework for vulnerability analysis in sustainability science. Proc. Natl. Acad. Sci. 100 (14), 8074–8079. doi:10.1073/pnas.1231335100
Uejio, C. K., Wilhelmi, O. V., Golden, J. S., Mills, D. M., Gulino, S. P., and Samenow, J. P. (2011). Intra-urban societal vulnerability to extreme heat: The role of heat exposure and the built environment, socioeconomics, and neighborhood stability. Health & place 17 (2), 498–507. doi:10.1016/j.healthplace.2010.12.005
Vall-Casas, P., Koschinsky, J., and Mendoza, C. (2011). Retrofitting suburbia through pre-urban patterns: Introducing a European perspective. URBAN Des. Int. 16, 171–187. doi:10.1057/udi.2011.9
Voelkel, J., Hellman, D., Sakuma, R., and Shandas, V. (2018). Assessing vulnerability to urban heat: a study of disproportionate heat exposure and access to refuge by socio-demographic status in portland, Oregon. Int. J. Environ. Res. public health 15 (4), 640. doi:10.3390/ijerph15040640
Wang, C., Ren, Z., Dong, Y., Zhang, P., Guo, Y., Wang, W., et al. (2022). Efficient cooling of cities at global scale using urban green space to mitigate urban heat island effects in different climatic regions. Urban For. Urban Green. 74, 127635. doi:10.1016/j.ufug.2022.127635
Westendorff, V. E. (2020). Role of trees in mitigating urban heat island in charlotte, North Carolina, USA. WIT Trans. Ecol. Environ. 245, 73–83.
Wilhelmi, O. V., and Hayden, M. H. (2010). Connecting people and place: a new framework for reducing urban vulnerability to extreme heat. Environ. Res. Lett. 5 (1), 014021. doi:10.1088/1748-9326/5/1/014021
Wilson, B., and Chakraborty, A. (2019). Mapping vulnerability to extreme heat events: Lessons from metropolitan chicago. J. Environ. Plan. Manag. 62 (6), 1065–1088. doi:10.1080/09640568.2018.1462475
Wilson, B. (2020). Urban heat management and the legacy of redlining. J. Am. Plan. Assoc. 86 (4), 443–457. doi:10.1080/01944363.2020.1759127
Winling, L. C., and Michney, T. M. (2021). The roots of redlining: academic, governmental, and professional networks in the making of the new deal lending regime. J. Am. Hist. 108 (1), 42–69. doi:10.1093/jahist/jaab066
Wong, J. K. W., and Lau, L. S. K. (2013). From the ‘urban heat island’to the ‘green island’? A preliminary investigation into the potential of retrofitting green roofs in mongkok district of Hong Kong. Habitat Int. 39, 25–35. doi:10.1016/j.habitatint.2012.10.005
Wu, L., and Rowe, P. G. (2022). Green space progress or paradox: Identifying green space associated gentrification in Beijing. Landsc. Urban Plan. 219, 104321.
Xiong, L., Li, S., Zou, B., Peng, F., Fang, X., and Xue, Y. (2022). Long time-series urban heat island monitoring and driving factors analysis using remote sensing and geodetector. Front. Environ. Sci. 759. doi:10.3389/fenvs.2021.828230
Xu, C., Chen, G., Huang, Q., Su, M., Rong, Q., Yue, W., et al. (2022a). Can improving the spatial equity of urban green space mitigate the effect of urban heat islands? An empirical study. Sci. Total Environ. 841, 156687. doi:10.1016/j.scitotenv.2022.156687
Xu, X., Qiu, W., Li, W., Huang, D., Li, X., and Yang, S. (2022b). Comparing satellite image and GIS data classified local climate zones to assess urban heat island: a case study of Guangzhou. Front. Environ. Sci. 2159. doi:10.3389/fenvs.2022.1029445
Yan, Sisi, Delmelle, Eric, and Duncan, Michael (2012). The impact of a new light rail system on single-family property values in Charlotte, North Carolina. J. Transp. Land Use 5, 60–67. doi:10.5198/jtlu.v5i2.261
Ye, M., Vojnovic, I., and Chen, G. (2015). The landscape of gentrification: Exploring the diversity of “upgrading” processes in Hong Kong, 1986–2006. Urban Geogr. 36 (4), 471–503. doi:10.1080/02723638.2015.1010795
Yonto, D., and Thill, J. C. (2020). Gentrification in the US new south: Evidence from two types of african American communities in Charlotte. Cities 97, 102475. doi:10.1016/j.cities.2019.102475
Yuan, W., He, B. J., Yang, L., Liu, X., and Yan, L. (2022). Heat-induced health impacts and the drivers: Implications on accurate heat-health plans and guidelines. Environ. Sci. Pollut. Res. 29 (58), 88193–88212. doi:10.1007/s11356-022-21839-x
Zhu, Y., Myint, S. W., Schaffer-Smith, D., Muenich, R. L., Tong, D., and Li, Y. (2022). Formulating operational mitigation options and examining intra-urban social inequality using evidence-based urban warming effects. Front. Environ. Sci. 9, 795474. doi:10.3389/fenvs.2021.795474
Zhou, W., Wang, J., and Cadenasso, M. L. (2017). Effects of the spatial configuration of trees on urban heat mitigation: a comparative study. Remote Sens. Environ. 195, 1–12. doi:10.1016/j.rse.2017.03.043
Keywords: environmental inequity, redlining, urban retrofitting, metropolitan heat mitigation, spatial analysis
Citation: Li X, Ma X, Lyu F and Song Y (2023) Examine the environmental inequity impact of urban heat mitigation on redlining legacy: case study of Charlotte’s retrofitting, 2001–2020. Front. Environ. Sci. 11:1218819. doi: 10.3389/fenvs.2023.1218819
Received: 08 May 2023; Accepted: 12 September 2023;
Published: 27 September 2023.
Edited by:
Danlu Cai, Chinese Academy of Sciences (CAS), ChinaReviewed by:
Haozhi Pan, Shanghai Jiao Tong University, ChinaXiaoxin Zhang, University of Copenhagen, Denmark
Copyright © 2023 Li, Ma, Lyu and Song. This is an open-access article distributed under the terms of the Creative Commons Attribution License (CC BY). The use, distribution or reproduction in other forums is permitted, provided the original author(s) and the copyright owner(s) are credited and that the original publication in this journal is cited, in accordance with accepted academic practice. No use, distribution or reproduction is permitted which does not comply with these terms.
*Correspondence: Xinlin Ma, bWF4aW5saW5AdW5jLmVkdQ==
†These authors share first authorship