 Adrian-Gabriel Enescu1*
 Monica Răileanu Szeles2
- 1Transilvania University of Brașov, Brașov, Romania
- 2Institute for Economic Forecasting, Transilvania University of Brașov, Brașov, Romania
The ongoing Russo–Ukrainian War has highly affected energy markets in the EU and worldwide, with different EU- and country-level emergency policy measures being advanced to tackle high energy prices. Despite the progress in green energy initiatives and the race toward climate neutrality by 2050, high energy prices are a matter of concern for all EU countries in the short-to-medium term. The current study investigates the energy price volatility in the aftermath of the Russia–Ukraine conflict, which is of high interest for designing effective government measures (such as monetary and energy policies) addressing the consequent changes occurring in employment, economic activity, commodity and food prices, and, ultimately, sustainable development. For the empirical analysis, we employed generalized autoregressive conditional heteroskedasticity models to capture the volatility of the following energy commodities: Brent crude oil, TTF natural gas, and UK natural gas. The empirical results reveal an elevated degree of persistence of the volatility, namely, that the generalized autoregressive conditional heteroskedasticity term has a slow decay and pronounced fluctuations for all the energy products. The vulnerability of the EU’s energy policy to geopolitical factors is highlighted, especially for gas, which could be due to its dependence on Russian imports. Moreover, the sanctions imposed by the EU on Russia, namely the sixth package of sanctions, have a minimal immediate effect on stabilizing energy returns. The study offers several policy recommendations to improve the resilience of the EU’s energy sector.
1 Introduction
The ongoing confrontation between Russia and Ukraine has far-reaching and long-lasting consequences. The economic and political turmoil caused by the conflict affects not only the countries directly involved in the conflict but also global markets and the business environment. Uncertainty worldwide increased as the conflict commenced on February 24, 2022. The transmission of uncertainty was facilitated by tensed bilateral and international relationships, natural catastrophes, global dependencies, global integrations, and other war-related events.
The destruction pertaining to war includes the loss of countless lives, physical damage to critical infrastructure, the displacement of millions of persons, psychological trauma, economic recession, and environmental damage. The energy sector was particularly affected, which encountered a spike in volatility amid the degradation of multilateral relationships between Russia, Europe, and other world economies, considering that Russia is an important supplier of gas and oil to Europe and Russia is the world’s third-largest producer of oil. Concerns appeared in Europe regarding access to energy products and the prices of those products.
The ongoing Russo–Ukrainian War has highly affected energy markets in the EU and worldwide, with different EU- and country-level emergency policy measures being advanced to tackle high energy prices. Despite the progress in the area of green energy initiatives and the race toward climate neutrality by 2050, in the short-to-medium term, the high energy price is a matter of concern for all EU countries.
A series of packages of economic sanctions against Russia has been gradually adopted by the European Council to weaken Russia’s ability to finance the war and penalize the political, economic, and military representatives and elite who are responsible for the invasion. Despite the amplitude and severity of sanctions, which generate a sharp contraction of Russia’s economy, the war is still going on. However, the literature on economic sanction effectiveness is broad, and the results are mixed. The econometric specifications (Drury, 1998) and the selection of study hypotheses explain the wide diversity of empirical results, while the large majority of studies conclude that most sanctions fail to achieve their intended aims, especially against authoritarian countries (Brooks, 2002). Some studies found that the effects of sanctions on target countries are negative (Ahn and Ludema, 2020), while others reported a partial economic impact on the sanctioned country’s trade and growth (Shin et al., 2016). Considering the importance of understanding the potential effect of economic sanctions against Russia following its invasion of Ukraine, our study is intended to provide new evidence and formulate conclusions in this regard.
However, our main emphasis is concentrated on energy price volatility during the Russian–Ukrainian war. In recent times, a substantial body of research has emerged to study the implications of geopolitical risk on energy price volatility and forecast volatility persistence over the post-war crisis period (Chen et al., 2023; Sokhanvar and Bouri, 2023; Lee et al., 2021; Lo et al., 2022). Recent research on this topic has been focused on the long memory in the financial and energy markets, the nexus between the black swan events and the energy market volatility, and the accuracy of predictions derived from a wide array of models and specifications. Moreover, the effects of war and energy volatility on the climate and environment open new research directions and debates.
Since several global and bilateral agreements on energy prices have been abandoned, the achievement of climate-related objectives and projects may be disrupted. The EU’s carbon border adjustment initiative and the green energy phase are global climate measures that might be impeded due to the Russian–Ukrainian war or might require substantial effort from large nations in implementation. However, the effects of war on EU climate-related targets are differently perceived in the literature, either as an opportunity or a threat. As Girardone (2022) underlined, the analysis of the indirect impact of international sanctions against Russia on climate transition targets in the areas of energy and food security becomes crucial. She concludeed that reducing energy dependency on Russia would allow policymakers to achieve net zero targets in the medium term. The catastrophic implications of the Russian–Ukrainian armed conflict have been largely debated in the recent literature, as discussed by Pereira et al. (2022), who analyzed the threats to achieving the United Nations Sustainable Development Goals not only by the countries directly involved in the conflict. In turn, Steffen and Patt (2022) viewed the conflict as a “window of opportunity for a step change in policy ambition toward net-zero energy systems.” Therefore, further studies and discussion on those impacts would be needed.
Furthermore, the global financial markets, including the commodity markets, are vulnerable to climate change issues. The contagion effect of the war would imply that the commodity markets shiver, transmitting shocks to economies, industries, business cycles, and climate-related initiatives. An assessment of the environmental consequences and climate risk must be conducted to identify possible measures for mitigation and strategies to escalate tensions, which may provide benefits to various stakeholders, including portfolio managers, practitioners, investors, and policymakers.
Forecasting the energy price volatility in the aftermath of the Russia–Ukraine conflict would, therefore, be of high interest for the design of effective government measures (such as monetary and energy policies) addressing the changes consequently occurring in employment, economic activity, commodity and food prices, and, ultimately, sustainable development.
Considering the importance of this topic at the macro- and microeconomic level, we intend to derive empirical insights from modeling the energy price volatility as an effect of the Russia–Ukraine war, while also taking into account the EU economic sanctions against Russia. The original contribution is three-fold. First, we utilized models from the autoregressive conditional heteroskedasticity (GARCH) framework that enabled us to model series with heteroscedasticity, including the introduction of a binary variable in the variance equations that captures the sanctions imposed by the EU on Russia. The models were applied to illustrate the vulnerability of the European oil and gas sectors at the time of the invasion. Second, we discussed the various implications of the Russian–Ukrainian conflict on the European energy sector. Last, we drew up policy implications and recommendations for the security and stability of the EU’s energy sector.
This paper is organized as follows. Section 2 is dedicated to the literature review. Section 3 describes the methodological framework, and Section 4 provides the empirical results. Section 5 is dedicated to discussion and policy implications.
2 Literature review
The literature review section is divided into two subsections. First, the impact of the Russo–Ukrainian war on energy price volatility is discussed, while the later section is concerned with the volatility measures of market prices.
2.1 Impact of the Russo–Ukrainian War on energy price volatility
Following full-scale invasion of Ukraine by Russia on 24 February 2022, concerns appeared regarding the supply of energy products for the EU countries. Russia was one of the most important suppliers of gas, oil, and coal in the world. The influence of this was propagated to the clean energy sector and conventional energy, leading to an energy crisis. A series of packages of economic sanctions were gradually applied by allied countries, including the EU, against Russia to limit Russia’s ability to finance the war and to also penalize the economic, political, and military elite who are considered to be responsible for the invasion.
On one hand, the impact of the war on the clean energy market is discussed. The stocks of companies in the clean energy sector have surged since the war started (Umar et al., 2022). This may be based on multiple theoretical considerations. Investors have seized the opportunity to invest in cleaner energy, for which demand will increase in the following years and may reduce energy dependency. In the case of the EU, the reliance on Russia will get reduced if the investments in renewable energy increase (Martin, 2022).
Therefore, renewable energy may contribute to ensuring energy security and diminishing the impact of geopolitical turmoil on the EU’s energy prices. Deng et al. (2022) contended that stocks with opportunities for a cleaner, lower-carbon transition exhibited superior returns compared to others. This effect was magnified by the dependency of Europe on Russian energy resources. The energy firms outperformed the stock market following the Russian invasion of Ukraine, based on a global sample of 1630 energy firms (Nerlinger and Utz, 2022).
On the other hand, the influence of the war propagated to the conventional energy market. Adekoya et al. (2022) asserted that one of the main transmitters of shocks during the Russian–Ukrainian war was oil, which was also facilitated by the prominent interconnectedness among different asset classes. Apart from the energy market, significant volatility increases occurred for the agricultural and metal markets, with higher volatility risk for commodities in which Russia has a high global market share (Fang and Shao, 2022).
Not only was the energy market significantly affected by the Russian invasion of Ukraine but the energy market may also provide insights regarding the causal pathway leading to the conflict. It was identified that Russia is severely dependent on the revenues obtained by exporting gas to the EU and Ukraine and that the energy deposits possessed by Ukraine and the pipeline system may pose threats to Russian exports (Johannesson and Clowes, 2022). Therefore, as this study claims, the threats to Russian exports may represent the reasons for the war in Ukraine and the prior annexation of Crimea by Russia.
The economic sanctions against Russia are expected to produce effects in the short, medium, and long term, ultimately resulting in economic decline and instability. In the literature, the effectiveness of economic sanctions is analyzed by the effect of sanctions on trade, investment, and GDP growth in both sanctioning and target countries. Over time, the volume of international sanctions has increased along with the development of international trade and economic globalization, but the real effect of sanctions is debatable.
A broad stream of literature indicates mixed results with regard to the effectiveness of economic sanctions. According to Brooks (2002), sanctions against authoritarian countries generally fail but succeed when being imposed against democracies. When looking at different timespans from the 1940s to the present, most studies find that sanctions do not generally produce a change in public policy in the sanctioned country, or they produce a limited economic effect. Moreover, other studies (Drezner, 2000) examined the implications for the sanctioning countries as well, focusing on the costs of the sanctioning countries that occur despite the intuitive assumption that multilateral cooperation among sanctioning countries is necessary or sufficient for generating effective economic sanctions. In this regard, empirical studies have proven the lack of a significant correlation between cooperation and policy success (Mansfield, 1995; Kaempfer and Lowenberg, 1999). Moreover, Kaempfer and Lowenberg (1999) revealed another perspective on the implications of economic sanctions, underlining that sanctions should be regarded as a way of advancing the agendas of lobbying groups within the sender countries and not as a punishment method.
When moving the debate into the framework of bilateral EU–Russia sanctions, Bělín and Jan (2021) used a quasi-natural experiment of reciprocal imposition of trade sanctions by Russia and the EU since 2014 and found that Western sanctions caused a minimal-to-no decline of the trade flows in equipment required for the extraction of oil and natural gas, therefore being of lower effectiveness. They explain that due to the European reliance on Russian energy imports, the costs of disrupting these trade flows are very important and likely to increase opposition to sanctions from European firms and voters. More recently, Mahlstein et al. (2022) estimated Russia’s losses as amounting to up to 14% of real GDP from an Allied trade embargo, even in the short run. Russell (2022) discussed the deterrent effect of international sanctions against Russia by analyzing the EU- and the US-adopted sanctions against Russia after it annexed Crimea.
Girardone (2022) emphasized the importance of accounting for the indirect impact of international sanctions against Russia on climate transition targets in the areas of energy and food security and concluded on the necessity to reduce energy dependency on Russia to achieve net zero targets in the medium term.
The effect of the war was transmitted to the financial markets, which was expected since the Russian–Ukrainian war was the most devastating in Europe following World War II. Various studies from the literature analyzed the impact on stock market returns following the commencement of the war. Boungou and Yatie (2022) highlighted that the conflict generated negative stock returns for 94 nations across the globe. A similar finding was established by Boubaker et al. (2022); the global stock markets experienced negative cumulative abnormal returns. The impact of the war was heterogeneous, according to this study. In the context of the war, the majority of the G20 stock market indexes incurred negative abnormal returns, with the war influencing adversely the European and Asian regions (Yousaf et al., 2022).
Apart from the financial volatility mentioned earlier, the war also impacted the Russian ruble, which rapidly depreciated against the USD (Lyócsa and Plíhal, 2022). The depreciation of the Russian ruble caused volatility in the exchange markets.
Prior to the Russian invasion of Ukraine, a body of literature was focused on identifying the impact of wars on the financial markets. Choudhry (2010) examined the volatility of the Dow Jones Industrial Index during the Second World War (WWII), which is an important US equity index, while Hudson and Urquhart (2015) analyzed the effects of the Second World War on the British stock market. The influence of WWII on financial variables from other European countries was also investigated in the literature (Frey and Kucher, 2000; Frey and Kucher, 2001). Rigobon and Sack (2005) also measured the effects of war risks on various US financial variables, including an equity index and oil, during the war in Iraq. The principal common element of the studies is that war has a significant influence on financial variables.
2.2 Volatility measures of the market prices
Forecasting and modeling stock market volatility has practical and theoretical implications. The accuracy of forecasting is of vital importance for portfolio decisions, risk management (including hedging), financial regulations, derivative markets, and other fields in the financial sector (Wang et al., 2020). Considering the aforementioned implications of volatility on the financial markets, various scholars have analyzed this topic.
In the literature, the concept of volatility was extensively analyzed, and multiple statistical methods of quantifying the volatility of prices emerged, which will be further examined. In a broad sense, the concept of volatility refers to unpredictable changes in a process over a specific period, which can be utilized to illustrate the riskiness of a financial asset. However, analyzing the volatility poses a major drawback since the volatility process is unobserved, even ex-post. The evaluation of volatility forecasts is considerably influenced by the proxy chosen for latent population volatility (Andersen and Bollerslev, 1998).
From a practical point of view, volatility serves as an important element in investment decisions and capital allocation, with volatility forecasts being commonly used to assess the level of risk associated with an asset. Moreover, volatility is the variable with the foremost importance when pricing financial derivatives, which has become more attractive to investors for speculation or hedging.
The most common measure for stock volatility is the standard deviation of returns, which is useful since it illustrates the probability of extreme values of returns, regardless of whether they are positive or negative (Schwert, 1990). The standard deviation, or σ, is computed as the square root of the average squared deviation of returns from the average return in the sample for a sample of T observations. Therefore, if the standard deviation is large, a high probability of obtaining either excessive positive or negative returns is associated.
However, even though the standard deviation is a simple measure of market volatility and is commonly used, academics argue that it has certain limitations and that alternative measures provide a more accurate representation of volatility. For instance, McNeil et al. (2015) stated that the risk of extreme events in stock returns (i.e., market crashes) is underestimated by the standard deviation. This is due to the particularities of financial data, which usually have skewed distributions with fatter tails. When data are skewed or have very long tails, it may be recommended to utilize a different summary statistic (Bland and Altman, 1999).
Another limitation of using the standard deviation as a volatility measure is that it treats all deviations from the mean as equally important. Investors are typically more concerned about downward risks than upward deviations in prices; therefore, a measurement that accords more weight to negative movements may provide more insights.
To deal with the shortcomings of standard deviation as a measure of market volatility, alternative measures for stock market volatility appeared. For instance, the GARCH models of Engle (1982) and GARCH extensions were introduced to analyze and forecast stock market volatility. Such models are particularly useful, considering that financial series commonly exhibit heteroskedasticity and can be used to measure time-varying volatility, which is assumed to have a non-normal distribution. Blair et al. (2001) depicted that GARCH models generated more accurate forecasts than the realized volatility proxy for stock market indices, generating an R2 of approximately 50%. A similar result was reiterated for FX data (Andersen and Bollerslev, 1998).
However, even though the GARCH framework is extensively used in the research literature, there are some limitations regarding the predictions of volatility. For instance, GARCH forecasts for out-of-sample regressions based on squared returns generated low determination coefficient values, below the 10% threshold, as shown by numerous research studies (Franses and van Dijk, 1996; Brooks, 1998).
Furthermore, another potential limitation of GARCH models is that the predicted returns’ variance is expressed as a polynomial of past squared returns, which may be mitigated by adding variables to GARCH models that can improve the predictive ability (Fuertes et al., 2009). This assumes that the future variance is based on the variance of previous returns, which may be valid in some cases given the concept of volatility clustering of financial data. However, in certain situations, the past variance fails to predict the future variance.
Based on the original GARCH model, subsequent studies introduced various extensions, which are appropriate for certain cases. However, Hansen and Lunde (2005) empirically compared out-of-sample 330 ARCH-type models with a GARCH(1,1) model regarding the accuracy of describing the conditional variance. The analysis was limited to the comparison of Deutsche Mark-USD exchange rates and IBM stock returns using six loss functions, and an unobserved conditional variance was constructed based on the realized variance. The results suggest that there is no proof that sophisticated models outperform GARCH(1,1) regarding exchange rate data. However, for the stock market data, GARCH(1,1) generated inferior predictive performance.
As an alternative measure for volatility, especially during extreme events, tail measures such as expected shortfall (ES) or value-at-risk (VaR) may be more adequate than the standard deviation. Value-at-risk is included in the Basel II capital-adequacy framework and is probably the most used risk metric by financial institutions (McNeil et al., 2015). VaR measures the maximum potential loss that can occur to an investment over a certain period, given an established degree of confidence. The expected shortfall is closely related to VaR and represents the average loss that occurs beyond the VaR level.
Another commonly used framework to measure stock market volatility is represented by the volatility index VIX, which captures the price movements of S&P 500 index options. Other frameworks for measuring volatility were introduced by scholars. Andersen et al. (2003) introduced a framework for measuring, modeling, and forecasting realized volatility and correlation by estimating a long-memory Gaussian vector autoregression (VAR) model. The model outperformed conventional GARCH models and produced successful forecasts. Corsi (2009) provided a volatility model, namely, heterogeneous autoregressive (HAR-RV), which has as a main feature that includes volatilities realized over different interval sizes. HAR-RV obtains similar results to a more complicated model, ARFIMA, for all time horizons: 1 day, 1 week, and 2 weeks.
Recently, the energy market volatility has been analyzed in the context of the Russian–Ukrainian war using a large spectrum of models, such as volatility ratio and volatility-of-volatility (Chen et al., 2023), dynamic simulated autoregressive distributed lag (DS-ARDL) as a complement to the cross-quantilogram (Sokhanvar et al., 2023), panel data methods (Lo et al., 2022), GJR-GARCH and vector autoregression (VAR) models (Fang and Shao, 2022), or simply structured VAR models (Dickson and Munishi, 2022). The slack-based measure data envelopment analysis (SBM-DEA) and the Malmquist–Luenberger Index (MLI) were also utilized to evaluate energy efficiency (Shah et al., 2023a; Shah et al., 2023b).
3 Methodology
3.1 Data
The empirical analysis is conducted using commodity historical data retrieved from Refinitiv Eikon for a sample period of roughly 5 years: 18/4/2019-04/4/2023. The sample period is established to capture in the model the ex-ante and ex-post impacts of the Russian–Ukrainian war.
The historical prices for the following commodities are utilized, and the abbreviation from Refinitiv Eikon is presented in the brackets: Brent Crude Oil Europe (LCOF9), UK Natural Gas Yearly Energy Futures (NGLNYc1), and Natural Gas TTF Monthly Energy Futures (TRNLTTFMc1). The descriptive statistics for the European energy commodities are presented in Table 1.
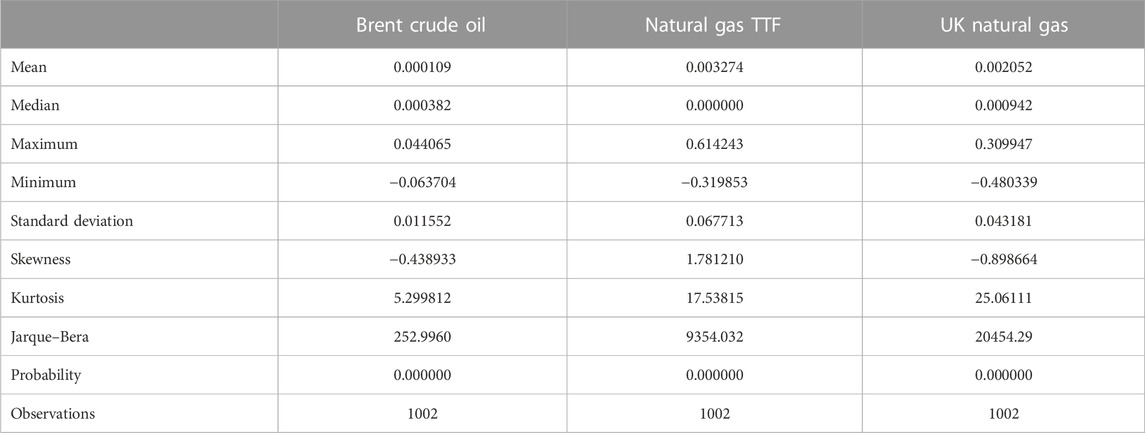
TABLE 1. Descriptive statistics for European energy commodities.
The commodities were selected based on theoretical considerations and following the practices in the literature that investigate the volatility of energy commodities. The futures prices are utilized since they incorporate the expectations of investors regarding the evolution of the market.
Brent crude represents a benchmark for pricing crude oil worldwide, especially in Europe, and it can be used to refer to the price of other oil products, such as diesel or gasoline, which are critical for the transportation sector and may provide insights regarding potential ripple effects. TTF natural gas is widely used by energy companies for hedging against price volatility and to ensure the supply of natural gas, being a representative measure of the energy costs in the European market and the price formation of other commodities. UK gas was included in the analysis since the UK is one of the principal producers of natural gas in Europe and served as an important supplier of gas to continental Europe, contributing to the energy supply stability and diversity.
The returns of the energy commodities series are plotted in Figure 1. TTF gas peaked at the beginning of 2022 as a result of the concerns regarding the supply of natural gas amid the invasion of Ukraine by Russia. On February 24, 2022, the day of the invasion, the price of TTF gas increased by 61.42% in only 1 day. On the same day, UK natural gas increased by 22.58%, indicating that investors were concerned about access and the subsequent demand for natural gas. The increase in energy commodity prices was also present for Brent oil, which, however, exhibited greater resilience compared to natural gas prices.

FIGURE 1. Returns of the energy commodities.
3.2 Methods
This study uses several GARCH models to model and forecast energy prices, such as the GARCH(1,1) model, under which the conditional variance follows an AR(1) process, the GARCH(2,1) model, where the conditional variance follows an AR(2) process, and the GARCH in mean (GARCH-M) model, where the conditional variance enters the conditional mean as a covariate. We also included an ARCH(2) model as the baseline model. This allows us to comparatively evaluate the models’ performance with regard to their volatility forecasts.
In our research, we selected the aforementioned GARCH models for several reasons. First, the models utilized are widely recognized and extensively used in financial econometrics due to their simplicity and effectiveness in capturing volatility clustering, especially the standard GARCH(1,1) model. The GARCH(1,1) model is parsimonious and often serves as a benchmark model against other types of GARCH models. Even though GARCH(1,1) is the standard GARCH model, the ability to capture the conditional variance is commonly on par with more resource-intensive and sophisticated models. For instance, in the seminal work of Hansen and Lunde (2005), 330 ARCH-type models were compared regarding their ability to describe conditional variance. The results of the study indicate that for the exchange rate data series, no evidence was present that a simple GARCH(1,1) model was outperformed by more sophisticated models. Furthermore, the parsimony of the utilized models makes the specifications desirable for information criteria such as AIC or BIC.
Finally, while we recognize that other specifications of GARCH models, such as EGARCH and GJR-GARCH, may provide additional benefits in modeling financial time series, we have decided to focus on the models from the study due to the specific objectives and scope of our study. Our intention was not to provide an exhaustive analysis of all available GARCH-type models but rather to examine the evolution of the conditional volatility in order to formulate policy implications and to assess the impact of sanctions on the volatility by incorporating a dummy volatility regressor, which is possible with the utilized framework.
Before applying the models, we conducted heteroskedasticity tests to identify existing ARCH effects for the series. We established the specifications of our earlier models from the literature, following the work of Chan and Angelia (2016). First, the first model that is explained is the GARCH(1,1) model, which is commonly used to model the volatility of prices and accurately predicts the conditional variance using out-of-sample data (Hansen and Lunde, 2005). The model includes a mean and a variance
where we suppose that the errors follow a normal distribution with a mean of 0.
The second GARCH model, GARCH(2,1), is similar to the previous model regarding the mean equation. The conditional variance
The third GARCH model, GARCH-M, is an extension of the previous model and incorporates the effects of volatility on the mean of the series, namely, the conditional variance
Finally, ARCH(2) serves as a benchmark against the more complex models to identify if the increase in forecasting accuracy is justifying the increase in complexity of the models. Therefore, the conditional variance of the ARCH(2) model can be described as follows:
Maximum likelihood estimation (MLE) is utilized for estimating the parameters of the models to generate robust estimates, as highlighted by White, Enquist, and Green (2008).
4 Results
We expect to accurately predict the volatility of energy prices by distinctively forecasting the volatility induced by the Russia–Ukraine conflict, which also allows us to subsequently analyze the implications for energy security and the pace of the green energy transition. We also expect to get comparative insights from running several GARCH model types.
The models applied to each series were compared using standard criteria from the literature, such as log-likelihood, Akaike information criterion, Schwarz information criterion, and Hannan–Quinn criterion. A higher value for the log-likelihood indicates a better fit of the model, whereas, for the other criteria, a lower value denotes a superior model. Table 2 indicates the comparison of ARCH/GARCH models using the criteria mentioned earlier, with the asterisk suggesting that the model was preferred over the others. Generally, a more parsimonious model was preferred to avoid overparameterization; even a more complex model could have a higher log-likelihood.
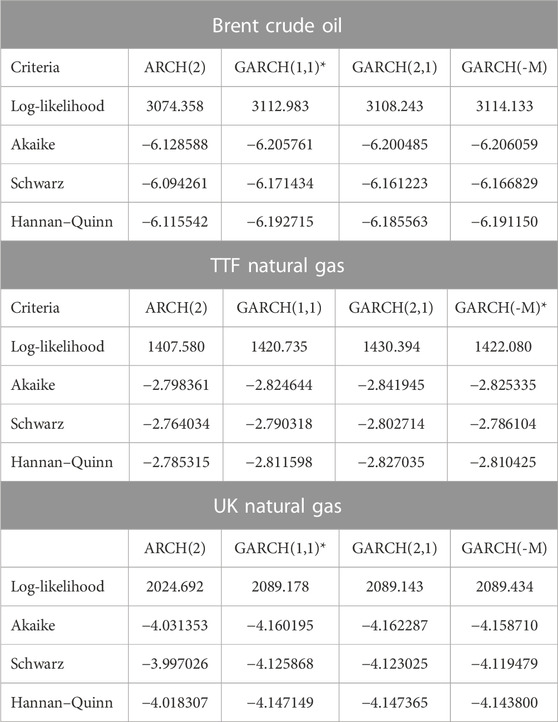
TABLE 2. ARCH/GARCH model comparison.
We have applied ARCH-LM heteroskedasticity tests to check the presence of residual ARCH effects. The p-values obtained are higher than 0.05 for all the models, indicating the failure to reject the null hypothesis, according to which there is no evidence for residual ARCH effects on the variance of the series.
We have compared the in-sample predictive accuracy of models with dummy variables included as volatility regressors for the sanctions imposed by the European Union on Russia to models without dummy variables. The introduction of dummy variables is supported by the increase in the in-sample predictive accuracy of the GARCH-type models applied for Brent oil and TTF natural gas series, where the root mean squared error (RMSE) and mean absolute error (MAE) decreased. The comparison for the in-sample forecasting of the models is provided in Table 3, based on static forecasting, for the in-sample forecasting period 02/04/2023-04/04/2023.
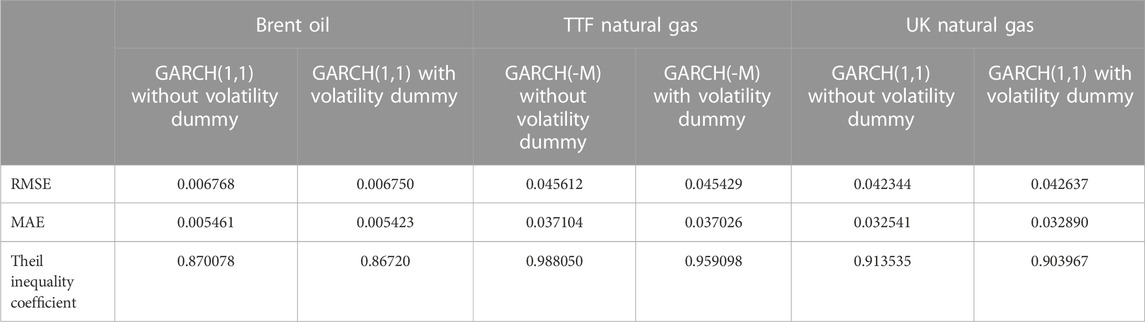
TABLE 3. Comparison between the predictive accuracies of GARCH models.
The GARCH(1,1) model for Brent crude oil data contains statistically significant coefficients at the 1% threshold for the ARCH and GARCH terms, as shown in Table 4. The past squared residuals have a positive effect on the current volatility since the ARCH coefficient is positive. However, the impact is relatively small since the coefficient is 0.107429. The GARCH term has a relatively strong impact on the current volatility, capturing the impact of both the lagged conditional variance and the lagged squared residual on the current conditional variance. This indicates that the volatility is persistent. The sixth package of sanctions imposed by the EU on Russia does not have a significant impact on the conditional variance of the Brent crude oil data.
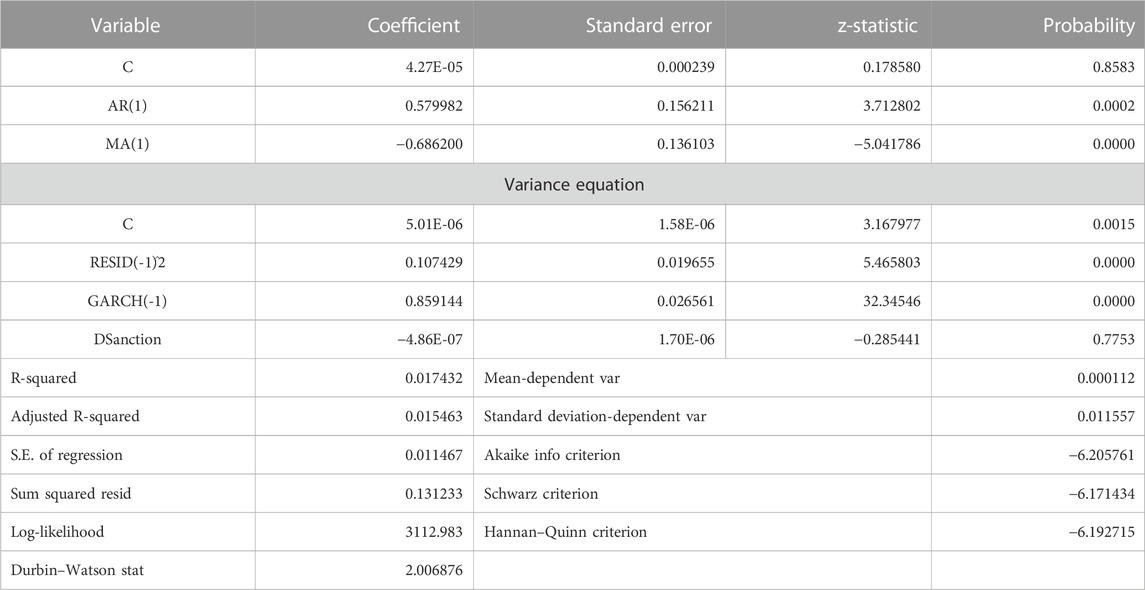
TABLE 4. Brent crude oil estimation output- GARCH(1,1).
All the coefficients from the variance equation of the GARCH(-M) model for TTF natural gas are statistically significant at the 1% threshold, as illustrated in Table 5, including the dummy variable introduced to capture the impact of the sanctions imposed by the EU, which is positive, even though it is close to zero. The impact of the past errors on the current conditional variance is larger than for the Brent crude oil GARCH(1,1) model. The GARCH coefficient indicates a high degree of persistence, namely that high volatility tends to be followed by elevated volatility.
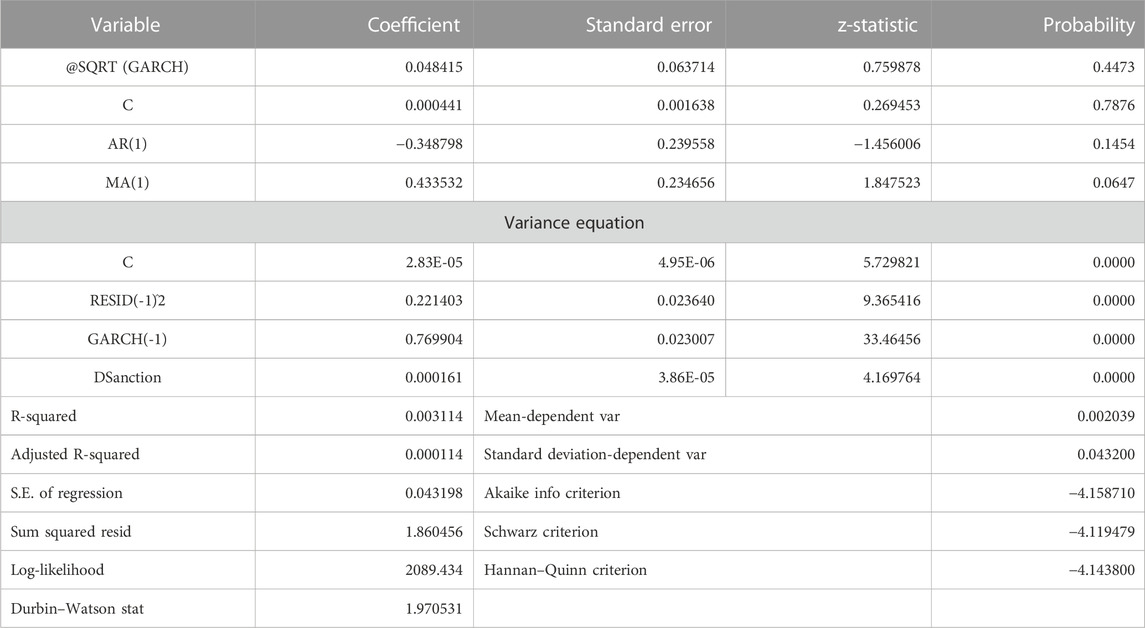
TABLE 5. TTF natural gas estimation output—GARCH(-M).
The variance equation contains statistically significant coefficients for the UK natural gas GARCH(1,1) model at the 1% threshold, as depicted in Table 6. The dummy variable related to the sanctions is positive and statistically significant, as it was for the TTF natural gas model. The GARCH term indicates a strong persistence of volatility, as was the case for the previous models. The past volatility has a significant impact on the present volatility, indicating persistence in the volatility process.

TABLE 6. UK natural gas estimation output—GARCH(1,1).
The conditional variances are depicted in Figure 2 for the three energy commodities based on the GARCH models. The conditional variance ranges within a narrow range for Brent crude oil, indicating a relatively low volatility in the returns of the Brent series as compared to the TTF natural gas volatility. The estimated volatility of TTF natural gas returns experiences more significant fluctuations. The range of values for UK natural gas returns is lower than both Brent crude oil and TTF natural gas, suggesting less-pronounced fluctuations and lower volatility.
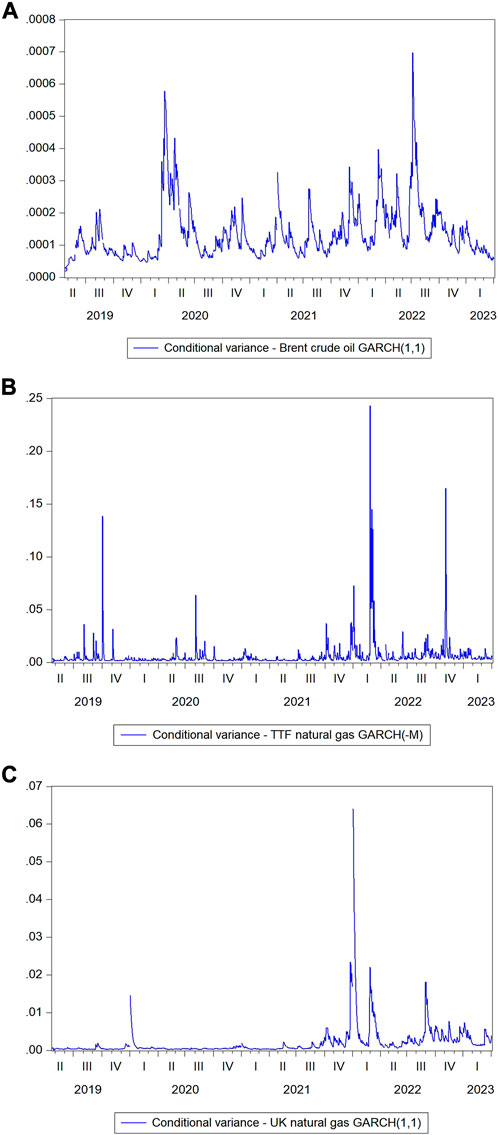
FIGURE 2. The conditional variance of the prices for Brent crude oil (A), TTF natural gas (B), and UK natural gas (C).
5 Discussion and policy implications
First, the empirical analysis provides consistent estimates for the volatility during the observed period using GARCH models. The GARCH models permit a comparative assessment of the conditional variance. The presence of market volatility generated by the Russian invasion of Ukraine was also documented in previous studies for various asset classes (Chen et al., 2023; Sokhanvar and Bouri, 2023; Lo et al., 2022). Second, the empirical analysis enables us to address the implications for a wide range of economic activities and governmental policies. Policy recommendations are also formulated in this chapter that may contribute to the mitigation of the potential impacts of the war on the energy sector.
As the results from the empirical analysis illustrate, the Russian–Ukrainian war caused concerns in the energy markets and impacted the economy and society in various manners. The implications of the energy crisis for the final consumers will be described, and subsequently, the formulation of policy implications will be conducted.
The spike in the volatility of energy prices, especially for natural gas, depicts the vulnerability at that certain timeframe for the European energy market and the dependence on Russian gas. The lack of resilience of the energy policy across the EU states and the dependency on foreign gas determined the transmission of a volatility shock due to the Russian invasion of Ukraine, which affected profoundly the energy markets and caused concerns for citizens and investors. Out of the three energy commodities analyzed, TTF gas exhibited the most significant fluctuations and the highest range for the conditional variance, as identified by the GARCH-M model, indicating the dependence of the EU on Russian gas.
The GARCH terms of all the models applied identify that the volatility is persistent during the observed period. The tendency for volatility clustering is present for the returns of energy assets, namely, that a period with high volatility is likely to be followed by other periods of high volatility. Therefore, a shock affecting energy assets is naturally associated with prolonged periods of turbulence if no mitigation measures are put in place.
From an investment perspective, the slow decay of the GARCH term may affect the expectations of investors since they may demand higher returns as compensation for the risks associated with persistent volatility. Various studies have been recently published to illustrate the implications of geopolitical risk on the volatility of energy prices. For instance, it was noted that the volatility of volatility took a longer time to decrease in the S&P GSCI natural gas index compared to the period before the war (Chen et al., 2023). Furthermore, the exclusion of several Russian banks from the SWIFT banking system might reduce Russian exports of commodities, which, in turn, may contribute to the persistence of volatility in energy prices in the short term (Sokhanvar and Bouri, 2023).
The sixth package of sanctions was included as a variance regressor in the variance equation for all the GARCH models applied since the EU tried to punish Russia for the aggression and to ensure the stability of the energy sector. The GARCH models provide evidence that the imposition of sanctions minimally affects the volatility of TTF natural gas and UK natural gas, given the low coefficient at the 1% threshold for the dummy variable introduced in the variance equation.
The small positive coefficient of the sanction dummy indicates that the imposition of sanctions is associated with an increase in the volatility of the energy assets, although this effect is minimal since the coefficients are close to zero. It may be observed in Figure 2 that at the end of the second quarter and the beginning of the third quarter in 2022, the conditional variance increased, which corresponds to the period when the sixth package of sanctions was introduced. The small coefficient of the sanctions may be attributed to the delayed application of the sixth package, which, even though it was introduced in June 2022, had restrictions applied from 5 December 2022 for crude oil and from 5 February 2023 for other refined petroleum products.
As stated in the literature, the effectiveness of economic sanctions is mixed. Most studies found that the majority of sanctions fail to achieve the intended objectives, especially when imposed on authoritarian countries (Brooks, 2002). Another study suggests a partial economic impact on the sanctioned countries (Shin et al., 2016). Our result regarding the imposition of sanctions on Russia is consistent with prior findings, with the sanctions failing to be effective measures in the short term for stabilizing the energy markets. This could be due to the delayed application of the sixth package. Another possible cause could be the European reliance on Russian energy imports, which incurs high costs of disrupting these trade flows, which would likely generate opposition from European firms and voters (Bělín and Jan 2021). In the same study, the lack of effectiveness of the sanctions imposed by the Western countries on Russia was also indicated earlier in the literature regarding the trade flows for the extraction of oil and natural gas after Western countries applied sanctions to Russia in 2014. Consequently, the lagged response of the sixth package of sanctions was also observed by examining the empirical results of GARCH models, where volatility exhibited persistent behavior.
The increase in energy prices on the financial market affected the final consumers in various manners, all of them concerning the diminishing of purchasing power and causing inflationary pressure in the economy. The cost of heating and cooling the homes increased, with the main concern being the increase in the cost of heating, which reduced the disposable income of European people. Furthermore, an increase in the prices of gasoline and diesel caused a surge in transportation costs, which subsequently determined companies to externalize the costs and lead to a spike in prices for food, clothing, and other consumer goods.
Not only has the war affected the final consumers in multiple ways but it also serves as a crucial point regarding the future of the EU’s climate-related targets. The threats to the United Nations Sustainable Development Goals amid the Russian–Ukrainian conflict were analyzed in the study by Pereira et al. (2022). It was also identified that reducing dependence on Russian imports is necessary in the medium term to achieve net zero targets and food security (Girardone, 2022). Therefore, the geopolitical context may serve as an opportunity for substantial changes to policies for achieving a net zero scenario (Steffen and Patt, 2022).
Next, policy recommendations will be formulated to ensure a secure and affordable energy supply for the EU while respecting sustainability commitments.
The existing set of energy policies focuses on diminishing greenhouse gas emissions by promoting the use of renewable energy sources and increasing energy efficiency. However, prior to the Russian invasion of Ukraine, the EU was heavily dependent on Russian natural resources, especially Russian gas, which affected its energy independence and made it more prone to disruptions in the energy supply during periods characterized by geopolitical turmoil.
Consequently, diversifying the energy supply is of foremost importance for reducing the EU’s dependence on energy products, especially natural gas, which may be achieved by investing in new gas pipelines from other countries. For instance, the Southern Gas Corridor and the initiative of the European Commission to establish a gas supply route to import gas from the Caspian and Middle East regions may provide a reliable method to diversify the energy supply.
Another policy recommendation for the EU energy policy is the investment in liquefied natural gas (LNG) terminals, which may increase the existing capacity for importing and storing LNG from other suppliers, such as Australia and the United States. From a geopolitical point of view, both of the aforementioned suppliers may prove reliable suppliers for the EU. The downside is that energy prices may increase considering transportation costs; however, ensuring a stable supply of gas during turbulent periods represents a priority and may justify paying the increased transportation costs.
Similarly, another policy recommendation is to invest in renewable energy, which is already binding for each EU member state through the Renewable Energy Directive. Increasing the share of renewable energy represents a good measure to reduce the reliance on traditional fossil fuels, including imported energy products. The target established by the EU regarding the share of renewable energy in final energy consumption is 32% by 2030.
The commitment to renewable energy may be doubled, considering the necessity of reducing the reliance on Russian gas. Renewable energy sources such as solar, wind, and hydropower may reduce the reliance on fossil fuels, with substantial benefits for decreasing pollution. Financial incentives and subsidies should be considered to increase the share of renewable sources of energy. However, given the intermittent nature of renewable energy sources, namely, the lack of predictability and consistency, backup capacity from other energy sources is required to ensure a reliable energy supply.
The Russian–Ukrainian war also may imply repercussions regarding the achievement of energy commitments, namely, the European Green Deal, which consists of a set of policy measures aimed toward achieving climate neutrality in Europe by 2050. The achievement of climate neutrality is based on the improvement of energy efficiency, increasing the share of renewable energy in total energy consumption, and reducing greenhouse gas emissions. Initially, when the invasion of Ukraine by Russia occurred, potential delays to the coal phase-out emerged. The supply disruptions and the enhanced prices for energy products increased the attractiveness of using coal from an economic point of view to the determinant of the environment. However, considering the stringent measures adopted by the EU to achieve climate neutrality, it is unlikely that the Russian–Ukrainian conflict would derail the long-term trend of the EU toward achieving a sustainable economy.
Another policy recommendation that is applicable at the EU and country level is to improve energy efficiency in buildings, industries, and transport by providing financial incentives. This objective is included in the Clean Energy Package (CEP), which addresses five main dimensions related to energy policy: energy security, internal energy markets, energy efficiency, decarbonization of the economy, fostering research, innovation, and competitiveness. At the EU level, the objective of improving energy efficiency is also stipulated by the energy efficiency directive, which establishes that large companies should be energy audited regularly and energy-saving targets for the countries.
At the individual country level, national programs for upgrading old appliances to newer and more efficient products should be promoted, which implies higher upfront costs from the national budgets, which, however, provide subsequent benefits. Similar programs may be adequate for older vehicles that do not comply with newer Euro pollution regulations. This country-level measure also aims at improving the satisfaction of final consumers, who will be using new, efficient products, and their bills will be diminished.
Furthermore, another policy recommendation for the EU is to support and fund research and innovation in new energy technologies. The EU should support the existing research and innovation programs, especially Horizon Europe, which may lead to the development of efficient, new energy technologies that will lead the transition to a sustainable future. For instance, the improvement of carbon capture and storage facilities, the establishment of hydrogen fuel cells, increasing the capacities of batteries, and advancements in nuclear reactors may serve as instruments in the energy transition.
Similarly, another policy recommendation is related to the emissions trading system (ETS), which is an essential measure for combating climate change. Not only should the current ETS be maintained and enforced but the cap on emissions must also be more rigorously reduced to ensure the achievement of the EU’s climate goals. Currently, a restricted number of industries and gases are covered by the ETS. For instance, the shipping sector is not monitored adequately at the EU level and the global level, although the maritime sector is a substantial polluter. The inclusion of the maritime sector in the ETS, as it was proposed by the European Commission, is an adequate measure to address shipping pollution.
Equally important measures related to the ETS are represented by increasing the carbon price paid by the companies and reducing the number of allowances. As a consequence of this measure, companies will be encouraged to reduce their negative impact on the environment and invest in cleaner technologies.
On another note, apart from environmental consequences, the Russian–Ukrainian war has implications regarding the Common Foreign and Security Policy (CFSP). Strengthening the CFSP is necessary to improve the response of the EU regarding possible security threats and establish intervention measures for conflicts and crises. A pro-integrationist point of view may suggest the establishment of a common European army that might reduce the dependence on the US army and be the main component of NATO. However, divergent opinions may arise for such a measure, and considering the importance of the security policy, a thorough analysis is required to identify the benefits and the risks associated.
One limitation of the study is the short-term nature of the data availability in the aftermath of the Russia-Ukraine conflict, which may not permit us to capture the long-term effects on energy policy and volatility. Understanding the real impact of the conflict may require analysis over a longer timeframe. Furthermore, even though policy measures were introduced in the study, implementation of such measures may face resistance from certain stakeholders that may hinder or delay the implementation of the measures.
The research on energy volatility and policy formulation in the context of the Russia–Ukraine war can be expanded in the future by capturing non-linear and asymmetric relationships. This line of research can be explored by using non-linear models such as Markov-switching GARCH or threshold GARCH. Furthermore, another future direction of research may incorporate high-frequency data, such as intraday data, to assess the real-term impact of policy decisions. This is facilitated by the fact that high-frequency data are becoming increasingly available. Last, examining the impact of the sanctions on Russia could be extended to specific sectors to identify how various sectors were affected by the sanctions, especially sectors that were targeted by the measures. It is also worth analyzing the countermeasures implemented by Russia as a response to the sanctions, which may affect the effectiveness of the sanctions.
Data availability statement
The data analyzed in this study are subject to the following licenses/restrictions: the data obtained from Refinitiv Eikon may include limitations on redistribution, commercial use, or sharing with third parties. Requests to access these datasets should be directed to A-GE, YWRyaWFuLmVuZXNjdUB1bml0YnYucm8=.
Author contributions
All authors listed made a substantial, direct, and intellectual contribution to the work and approved it for publication.
Conflict of interest
The authors declare that the research was conducted in the absence of any commercial or financial relationships that could be construed as a potential conflict of interest.
Publisher’s note
All claims expressed in this article are solely those of the authors and do not necessarily represent those of their affiliated organizations, or those of the publisher, the editors, and the reviewers. Any product that may be evaluated in this article, or claim that may be made by its manufacturer, is not guaranteed or endorsed by the publisher.
References
Adekoya, O. B., Oliyide, J. A., Yaya, O. S., and Al-Faryan, M. A. S. (2022). Does oil connect differently with prominent assets during war? Analysis of intra-day data during the Russia-Ukraine saga. Resour. Policy 77, 102728. doi:10.1016/j.resourpol.2022.102728
Ahn, D. P., and Ludema, R. D. (2020). The sword and the shield: the economics of targeted sanctions. Eur. Econ. Rev. 130, 103587. doi:10.1016/j.euroecorev.2020.103587
Andersen, T. G., and Bollerslev, T. (1998). Answering the skeptics: yes, standard volatility models do provide accurate forecasts, 885–905.Int. Econ. Rev.
Andersen, T. G., Bollerslev, T., Diebold, F. X., and Labys, P. (2003). Modeling and forecasting realized volatility. Econometrica 71 (2), 579–625. doi:10.1111/1468-0262.00418
Bělín, M., and Jan, H. (2021). Which sanctions matter? Analysis of the EU/Russian sanctions of 2014. J. Comp. Econ. 49 (1), 244–257. doi:10.1016/j.jce.2020.07.001
Blair, B. J., Poon, S.-H., and Taylor, S. J. (2001). Modelling S&P 100 volatility: the information content of stock returns. J. Bank. finance 25 (9), 1665–1679. doi:10.1016/s0378-4266(00)00157-6
Bland, J. M., and Altman, D. G. (1999). Measuring agreement in method comparison studies. Stat. methods Med. Res. 8 (2), 135–160. doi:10.1177/096228029900800204
Boubaker, S., Goodell, J. W., Pandey, D. K., and Kumari, V. (2022). Heterogeneous impacts of wars on global equity markets: evidence from the invasion of Ukraine. Finance Res. Lett. 48 (2022), 102934. doi:10.1016/j.frl.2022.102934
Boungou, W., and Yatié, A. (2022). The impact of the Ukraine–Russia war on world stock market returns. Econ. Lett. 215, 110516. doi:10.1016/j.econlet.2022.110516
Brooks, C. (1998). Predicting stock index volatility: can market volume help? J. Forecast. 17 (1), 59–80. doi:10.1002/(sici)1099-131x(199801)17:1<59:aid-for676>3.0.co;2-h
Brooks, R. A. (2002). Sanctions and regime type: what works, and when? Secur. Stud. 11 (4), 1–50. doi:10.1080/714005349
Chan, J. C. C., and Angelia, L. G. (2016). Modeling energy price dynamics: GARCH versus stochastic volatility. Energy Econ. 54, 182–189. doi:10.1016/j.eneco.2015.12.003
Chen, S., Bouteska, A., Sharif, T., and Abedin, M. Z. (2023). The Russia–Ukraine war and energy market volatility: a novel application of the volatility ratio in the context of natural gas. Resour. Policy 85 (2023), 103792. doi:10.1016/j.resourpol.2023.103792
Choudhry, T. (2010). World war II events and the Dow Jones industrial index. J. Bank. Finance 34 (5), 1022–1031. doi:10.1016/j.jbankfin.2009.11.004
Corsi, F. (2009). A simple approximate long-memory model of realized volatility. J. Financial Econ. 7 (2), 174–196. doi:10.1093/jjfinec/nbp001
Deng, M., Leippold, M., Wagner, A. F., Wang, Q., et al. (2022). Stock prices and the Russia-Ukraine war: sanctions. energy ESG. Available at: https://ssrn.com/abstract=4121382.
Dickson, P., and Munishi, E. (2022). Volatility shocks in energy commodities: the influence of COVID-19. Int. J. Res. Bus. Soc. Sci. (2147-4478) 2, 214–227. doi:10.20525/ijrbs.v11i2.1614
Drezner, D. W. (2000). Bargaining, enforcement, and multilateral sanctions: when is cooperation counterproductive? Int. Organ. 54 (1), 73–102. doi:10.1162/002081800551127
Drury, A. C. (1998). Revisiting economic sanctions reconsidered. J. Peace Res. 35 (4), 497–509. doi:10.1177/0022343398035004006
Engle, R. F. (1982). Autoregressive conditional heteroscedasticity with estimates of the variance of United Kingdom inflation. Econ. J. Econ. Soc. 50, 987–1007. doi:10.2307/1912773
Fang, Y., and Shao, Z. (2022). The Russia-Ukraine conflict and volatility risk of commodity markets. Finance Res. Lett. 50, 103264. doi:10.1016/j.frl.2022.103264
Franses, P. H., and van Dijk, D. (1996). Forecasting stock market volatility using (non-linear) Garch models. J. Forecast. 15 (3), 229–235. doi:10.1002/(sici)1099-131x(199604)15:3<229:aid-for620>3.0.co;2-3
Frey, B., and Kucher, M. (2001). Wars and markets: how bond values reflect the second world war. Economica 68, 317–333. doi:10.1111/1468-0335.00249
Frey, B. S., and Kucher, M. (2000). World War II as reflected on capital markets. Econ. Lett. 69 (2), 187–191. doi:10.1016/s0165-1765(00)00269-x
Fuertes, A.-M., Izzeldin, M., and Kalotychou, E. (2009). On forecasting daily stock volatility: the role of intraday information and market conditions. Int. J. Forecast. 25 (2), 259–281. doi:10.1016/j.ijforecast.2009.01.006
Girardone, C. (2022). Russian sanctions and the banking sector. Br. J. Manag. 33, 1683–1688. doi:10.1111/1467-8551.12656
Hansen, P. R., and Lunde, A. (2005). A forecast comparison of volatility models: does anything beat a GARCH (1, 1)? J. Appl. Econ. 20 (7), 873–889. doi:10.1002/jae.800
Hudson, R., and Urquhart, A. W. (2015). War and stock markets: the effect of World War Two on the British stock market. Int. Rev. Financial Analysis 40, 166–177. doi:10.1016/j.irfa.2015.05.015
Johannesson, J., and Clowes, D. (2022). Energy resources and markets–perspectives on the Russia–Ukraine war. Eur. Rev. 30 (1), 4–23. doi:10.1017/s1062798720001040
Kaempfer, W. H., and Lowenberg, A. D. (1999). Unilateral versus multilateral international sanctions: a public choice perspective. Int. Stud. Q. 43, 37–58. doi:10.1111/0020-8833.00110
Lee, C-C., Olasehinde-Williams, G., and Saint Akadiri, S. (2021). Are geopolitical threats powerful enough to predict global oil price volatility? Environ. Sci. Pollut. Res. 28, 28720–28731. doi:10.1007/s11356-021-12653-y
Lo, G-D., Marcelin, I., Bassène, T., and Sène, B. (2022). The Russo-Ukrainian war and financial markets: the role of dependence on Russian commodities. Finance Res. Lett. 50, 103194. doi:10.1016/j.frl.2022.103194
Lyócsa, Š., and Plíhal, T. (2022). Russia’s ruble during the onset of the Russian invasion of Ukraine in early 2022: the role of implied volatility and attention. Finance Res. Lett. 48, 102995. doi:10.1016/j.frl.2022.102995
Mahlstein, K., McDaniel, C., Schropp, S., and Tsigas, M. (2022). Estimating the economic effects of sanctions on Russia: an allied trade embargo. World Econ. 45 (11), 3344–3383. doi:10.1111/twec.13311
Mansfield, E. D. (1995). International institutions and economic sanctions. World Polit. 47 (4), 575–605. doi:10.1017/s0043887100015227
McNeil, A. J., Frey, R., and Paul, E. (2015). Quantitative risk management: concepts, techniques and tools-revised edition. Princet. Univ. press.
Nerlinger, M., and Utz, S. (2022). The impact of the Russia-Ukraine conflict on energy firms: a capital market perspective. Finance Res. Lett. 50, 103243. doi:10.1016/j.frl.2022.103243
Pereira, P., Zhao, W., Symochko, L., Inacio, M., Bogunovic, I., and Barcelo, D. (2022). The Russian-Ukrainian armed conflict will push back the sustainable development goals. Geogr. Sustain. 3, 277–287. doi:10.1016/j.geosus.2022.09.003
Rigobon, R., and Sack, B. (2005). The effects of war risk on US financial markets. J. Bank. finance 29 (7), 1769–1789. doi:10.1016/j.jbankfin.2004.06.040
Schwert, G. W. (1990). Stock market volatility. Financial analysts J. 46 (3), 23–34. doi:10.2469/faj.v46.n3.23
Shah, W. U. S., Hao, G., Yan, H., Nan, Z., Yasmeen, R., and Dincă, G. (2023b). Role of renewable, non-renewable energy consumption and carbon emission in energy efficiency and productivity change: evidence from G20 economies. Geosci. Front., 101631. doi:10.1016/j.gsf.2023.101631
Shah, W. U. S., Hao, G., Yan, H., Yasmeen, R., et al. (2023a). Energy efficiency evaluation, changing trends and determinants of energy productivity growth across south asian countries: SBM-DEA and malmquist approach. Environ. Sci. Pollut. Res. 30, 19890–19906. doi:10.1007/s11356-022-23484-w
Shin, G., Choi, S-W., and Luo, S. (2016). Do economic sanctions impair target economies? Int. Political Sci. Rev. 37 (4), 485–499. doi:10.1177/0192512115590203
Sokhanvar, A., and Bouri, E. (2023). Commodity price shocks related to the war in Ukraine and exchange rates of commodity exporters and importers. Borsa Istanb. Rev. 23, 44–54. doi:10.1016/j.bir.2022.09.001
Sokhanvar, A., Çiftçioğlu, S., and Lee, C-C. (2023). The effect of energy price shocks on commodity currencies during the war in Ukraine. Resour. Policy 82, 103571. doi:10.1016/j.resourpol.2023.103571
Steffen, B., and Patt, A. (2022). A historical turning point? Early evidence on how the Russia-Ukraine war changes public support for clean energy policies. Energy Res. Soc. Sci. 91 (2022), 102758. doi:10.1016/j.erss.2022.102758
Umar, M., Riaz, Y., and Imran, Y. (2022). Impact of Russian-Ukraine war on clean energy, conventional energy, and metal markets: evidence from event study approach. Resour. Policy 79, 102966. doi:10.1016/j.resourpol.2022.102966
Wang, L., Ma, F., Liu, J., and Yang, L. (2020). Forecasting stock price volatility: new evidence from the GARCH-MIDAS model. Int. J. Forecast. 36 (2), 684–694. doi:10.1016/j.ijforecast.2019.08.005
White, E. P., Enquist, B. J., and Green, J. L. (2008). On estimating the exponent of power-law frequency distributions. Ecology 89 (4), 905–912. doi:10.1890/07-1288.1
Keywords: energy volatility, policy implications, energy policy of the EU, energy commitments, Russia–Ukraine conflict, Russian sanctions
Citation: Enescu A-G and Szeles MR (2023) Discussing energy volatility and policy in the aftermath of the Russia–Ukraine conflict. Front. Environ. Sci. 11:1225753. doi: 10.3389/fenvs.2023.1225753
Received: 19 May 2023; Accepted: 31 July 2023;
Published: 15 August 2023.
Edited by:
Muhammad Abdul Kamal, Abdul Wali Khan University Mardan, PakistanReviewed by:
Mucahit Aydin, Sakarya University, TürkiyeLuis Rodrigo Mendieta Muñoz, University of Cuenca, Ecuador
Rizwana Yasmeen, Panzhihua University, China
Copyright © 2023 Enescu and Szeles. This is an open-access article distributed under the terms of the Creative Commons Attribution License (CC BY). The use, distribution or reproduction in other forums is permitted, provided the original author(s) and the copyright owner(s) are credited and that the original publication in this journal is cited, in accordance with accepted academic practice. No use, distribution or reproduction is permitted which does not comply with these terms.
*Correspondence: Adrian-Gabriel Enescu, YWRyaWFuLmVuZXNjdUB1bml0YnYucm8=