 Ophelie Fovet
 François Meric
 Alain Crave
 Jean-Michel Cador3
- 1Institut National de Recherche pour l’Agriculture, l’Alimentation et l’Environnement, Institut Agro, UMR SAS, Rennes, France
- 2Centre National de la Recherche Scientifique, UMR Geosciences Rennes, Observatoire des Sciences de l’Univers de Rennes, Universite Rennes, Rennes, France
- 3Centre National de la Recherche Scientifique, UMR 6266 IDEES, Universite de Caen, Caen, France
- 4Centre National de la Recherche Scientifique, UMR LETG, Universite de Rennes, Rennes, France
The Water Framework Directive set for European Union countries the objective of restoring the ecological and/or sediment continuity of rivers, as the latter is relevant for providing suitable habitats for the former. Indeed, abiotic fluxes and variables shape riverine ecological habitats and are likely to be modified by barriers such as dams. Two dams were removed from the Selune River (northwestern France) from spring 2017 to summer 2022. The objective of this study was to describe and quantify how the dams modified abiotic parameters and fluxes, as well as the dynamics of these fluxes during dam removal. We monitored coarse and fine sediments, water temperature and nutrient concentrations in the Selune River from upstream to downstream of the dams from 2015 to 2023. The results showed that coarse sediments of the riverbed are a legacy and that current hydrodynamic conditions are not sufficient to move them much, with or without the dams. In addition, it appears that at this early stage after the removal some downstream parameters, especially nutrient concentrations and water temperature, have already converged towards upstream signals, while fine sediment stored in the dam’s reservoirs are still destocking. Restoring ecological continuity of the Selune River will involve dynamics of abiotic parameters over longer time scales, in response to removal of the dams, and over larger spatial scales, in response to climate and other global changes.
1 Introduction
Many environmental policies, such as the Water Framework Directive set for European Union (EU) countries the objective of restoring river ecological and sediment continuity. Dams, especially large ones, alter the geomorphology of rivers by deposition of bed and suspended sediments upstream from them which causes a sediment deficit that commonly leads to incision and development of a river bed sediment coarsening (pavement) downstream from them (Kondolf, 1997; Brandt, 2000; Rollet et al., 2014). However, predicting effects of dam removal on geomorphology remain difficult because i) these effects depend on local configurations (Foley et al., 2017a), ii) few references are available (Bellmore et al., 2017) and iii) time scales of response are uncertain but likely to be on the order of decades (Pizzuto, 2002; Graf, 2005). The recovery trajectories are known to be dynamic and likely to lead to ecological conditions similar or different to the ones before impoundment (Bellmore et al., 2019). A meta-analysis on dam removal studies over the United States that include pre-removal and post-removal data emphasized the large influence of landscape features on the biophysical response to dam removal and highlighted the limitation of our understanding due to a limited range of landscapes in the existing studies (Foley et al., 2017b).
Based on data from dam removals in the United States (United States), Foley et al. (2017a) concluded that physical variables generally changed rapidly after the removal of large dams, and that physical connectivity quickly became effective again. In the Elwha River (United States), dam removal was managed to use the river to naturally erode and transport sediments (Warrick et al., 2012). After 2 years of monitoring this emblematic removal operation, Warrick et al. (2015) estimated that 90% of the sediments initially stored in the former reservoir had been flushed to coastal waters, some of which had been deposited in the river’s mouth. They also observed that the deposition was dominated by coarse and sandy sediments, but also contained large amounts of fine sediments. Additional monitoring for the next 3 years showed that the first 2 years contained most of the sediment and geomorphic signal (Ritchie et al., 2018). Dam removal is expected to reverse the disturbances the dam created by eroding sediments stored in the upstream reservoir and transporting and depositing them in downstream reaches (Brandt, 2000; Doyle et al., 2005). Fine sediments are expected to respond more rapidly than coarse sediments (Doyle et al., 2005). Dams influence river water temperature greatly (Poirel, 2010; Olden and Naiman, 2010). Depending on how reservoir water is released, downstream water can be either cooled (release of deep layers of stratified water) or warmed (release of the surface layer). Reservoirs also tend to smooth out daily and/or annual temperature variations (Ward, 1985). These disturbances of the thermal signal are observed directly downstream of a reservoir and can persist for several tens of km depending on factors such as the structure of the dam or riparian vegetation cover (ZaidelCaissie, 2006; 2021).
Other abiotic parameters are also likely to respond strongly to dam removal (Bednarek, 2001; Doyle et al., 2005), such as nutrients that are retained by dams, including nitrogen (N) (mainly due to denitrification) (Stanley and Doyle, 2002; von Schiller et al., 2016) and phosphorus (P) (usually trapped in reservoirs) (Doyle et al., 2003; Fovet et al., 2020). Geomorphologic changes can modify these retentions by modifying particle deposition (and thus P retention), the extent of the water-sediment interface, the size of particles and the potential to denitrify N (Stanley and Doyle, 2002; Doyle et al., 2003). For instance, 14 days after dam removal in the Chishui River (China), Lei et al. (2023) observed an increase in P concentration and a decrease in N concentration, suggesting higher N retention soon after the removal, when active erosion was observed. Doyle et al. (2003) concluded that removing small dams from the Koshkonong River (United States) decreased P retention in the reach that contained the former reservoir, but did not stop it completely, and increased the P concentration downstream. Bohrerova et al. (2016) measured concentrations in the reach of the Olentangy River (United States) upstream of the Fifth Avenue Dam before and after it was removed, and highlighted higher in nitrate concentrations and lower phosphate concentrations when the impounded portion was restored as running water. Velinsky et al. (2006) observed no significant effects of a small dam on Manatawny Creek (United States) or its removal on the concentrations and forms of carbon (C), N or P; they concluded that the residence times were too short and the thermal stratification too weak to influence nutrient cycling. Abbott et al. (2022) monitored dissolved oxygen concentration continuously for 3 weeks in summer at 15 river sites in the United States before and after removal of their small dams; they found that the reservoir’s oxygen signal returned to the upstream reference at 80% of sites within 1 year of the removal. Riggsbee et al. (2012) used experiments to quantify nutrient fluxes before and after removal of a dam on the Little River (United States) and identified that vegetation had a significant influence on N and P leaching during the first growing season after removal and that it likely would have a larger influence in the long term.
These studies of effects of dam removal on abiotic parameters are less common than those of effects on biotic parameters (Pizzuto, 2002; Bellemore et al., 2017), limited in space (reservoir and downstream), or limited to a few abiotic parameters, especially sediment dynamics (Warrick et al., 2012; Foley et al., 2017a; Basilico et al., 2021). The present study’s objective was thus to measure the response of a variety of abiotic parameters, including coarse and fine sediments, temperature and nutrient concentrations, to the removal of two consecutive dams on the Selune River, a lowland low-energy river in northwestern France. This study provided 1) reference data on effects of dam removal, 2) evidence to help interpret and understand the processes involved in ecological restoration of the Selune River after dam removal and 3) a complete monitoring program that helped understand abiotic parameters, especially sediment dynamics.
2 Materials and methods
2.1 Study site
The Selune River flows for 91 km into the Bay of Mont Saint-Michel (Figure 1). It drains a watershed area of 1,083 km2 and once had two hydroelectric dams: Vezins and Roche-Qui-Boit (RQB) (36 and 16 m high, respectively) (Table 1). The watershed’s climate is oceanic, with a low temperature amplitude and rainfall distributed throughout the year. The annual mean (± standard deviation) rainfall is 794 (±209) mm (2015–2022). Rainfall is highest in December (111 ± 68 mm) and lowest in July (39 ± 29 mm). Rainfall and evapotranspiration variations cause seasonal fluctuations: a period of high flow in winter and low flow in summer. Mean monthly discharge at Ducey (39°38′22.4545″E, 12°13′9.7918″S, WGS84) is equal to 10.9 m3 s-1 in average and varies between 4 m3 s-1 in September and 21.1 m3 s-1 in February.
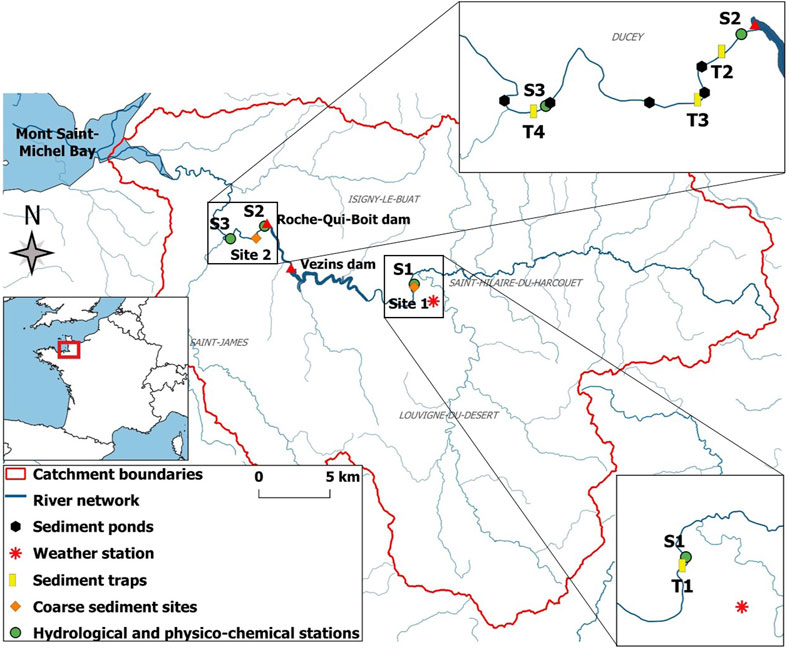
FIGURE 1. Map of the Selune River watershed and location of stations. The inset maps show only sediment traps and ponds.
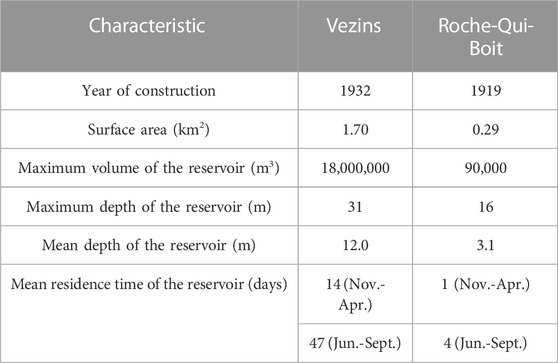
TABLE 1. Characteristics of the 2 dams removed from the Selune River, from (SEPIA CONSEIL, 2002). Mean residence times were computed by averaging over each period the daily residence times obtained by dividing the reservoir volume (in m3, measured and provided by the dam manager) by the average daily discharge measured downstream the dam (in m3.day-1, measured by us or the dam manager).
The watershed’s Armorican bedrock consists of Brioverian sedimentary formations in the center (schists and sandstones) surrounded by granitic layers to the north and south (Cadomian). Due to the low permeability of this substrate, groundwater bodies are particularly shallow, which results in hydromorphic soils in bottomlands. The hillsides have well-drained Cambisols. Most slopes are moderate and less than 3%, but can reach 13% in the river gorge and in the valleys of some tributaries. The watershed is dominated (89% of the area) by agriculture, with arable land and grassland for mixed (summer/winter) crops and livestock.
In 2009, the French government decided to remove the 2 dams. Removal operations on the Vezins dam began in March 2017, and the dam was dismantled from April 2019 to June 2020. The RQB dam was dismantled from June 2022 to January 2023. Hydro-sedimentary continuity of the river was effective in May 2022.
The amount of sediments stored in the 2 dam reservoirs was estimated as 1,800,000 m3 (IDRA, 2012). To keep this massive amount of sediments from moving and clogging the river downstream, much of it was dredged and stored in ponds built with gabions and dykes made from in-situ sediments (Berrée, 2019). After the reservoirs had emptied and the sediments had dried, the gabions were removed. To our knowledge, this kind of sediment management using heavy civil engineering was unprecedented in the history of dam removal (French Water Agency, personal communication; Germaine and Lespez, 2017; Schiermeier, 2018).
A multidisciplinary scientific program (https://programme-selune.com/fr/) was established in 2012 to assess impacts of removal of the dams on the river and its restoration. An observation network was established in 2015 to monitor physical and chemical parameters and fluxes of water, sediments and dissolved elements.
2.2 Coarse-sediment measurement and transport monitoring
Coarse sediments of the riverbed were traced using 150 RFID transponders. Two injection sites were selected, one upstream of the Vezins dam (site 1) and the other downstream of the RQB dam (site 2) (Figure 1). Difficulty in accessing certain sections (in particular because of the steep valley), preference for sectors with shallow water to allow for prospection on foot and difficulty in finding sites without direct human influence (i.e., weirs) led us to select sites with slightly different geomorphological characteristics. Site 1 had a significantly lower slope than site 2 (Table 2).
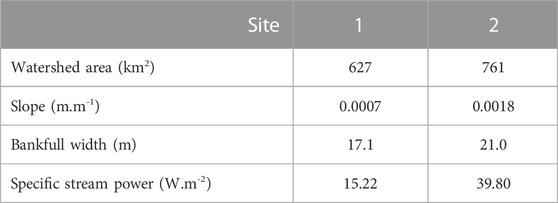
TABLE 2. Characteristics of the coarse-sediment tracing sites upstream of the Vezins dam (site 1) and downstream of the Roche-Qui-Boit dam (site 2).
Sediments equipped with a transponder had a median particle size similar to that measured at the two sites (D50 of 39–55 mm). Only particles smaller than 22 mm, which represented 10% (site 1) and 23% (site 2) of the particles on the riverbed, were too small to be used. Tracers were injected in July 2015 along 2 transects at the 2 sites, spaced 20 cm apart, taking care to mimic the natural intermingling of the sediments as well as possible. Thus, 50 and 100 tracers were injected at sites 1 and 2, respectively. They were surveyed annually, over seven water years from 2015 to 2022 (denoted P0 to P6 in Figure 2), and their location was recorded using DGPS (Differential Global Positioning System). Given the diameter of the detection antenna (50 cm) and the precision of DGPS (3 cm after processing), the mean margin of error, after several tests, was 1 m. We thus considered the tracers that moved more than 1 m per year to be mobile.
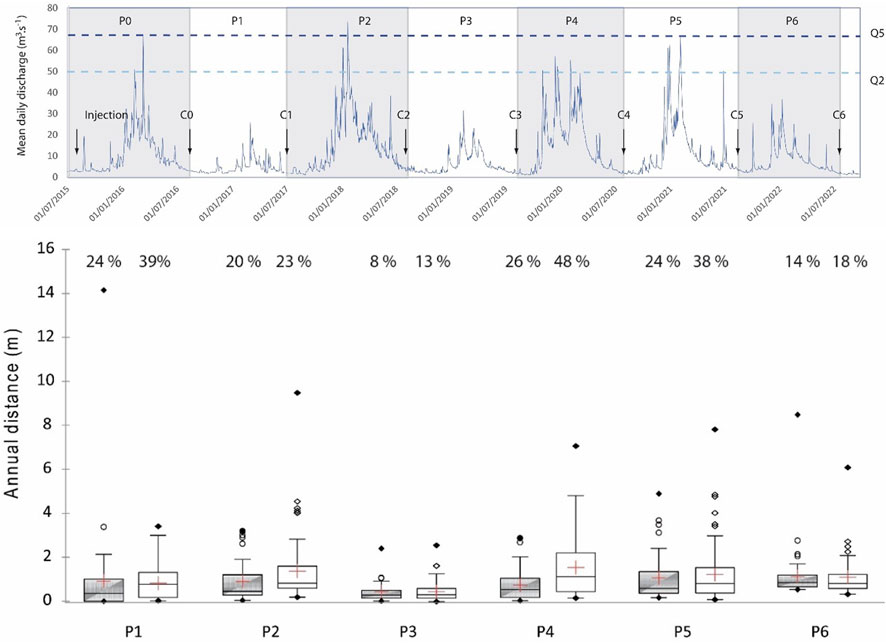
FIGURE 2. (top) Stream flow dynamics during the monitoring period and tracer-monitoring surveys (C0-C6) performed at the end/start of hydrological years (P0-P6) and (bottom) tracer mobility results at the upstream site (Site 1 - Virey) (grey box plots) and downstream site (Site 2 - Pont de Bateau) (white box plots) for each survey. The percentages over the box plots indicate the annual sediment mobility rate. Whiskers indicate 1.5 times the interquartile range.
Travel distances were measured using GIS. The locations of the tracers were projected on a central line of the channel, and only the longitudinal movements were measured. Given the low representativeness of the movements recorded during the first year after injection (due to the risk of overexposure of sediments and imperfect nesting), only monitoring results obtained beginning in August 2016 are presented. The hydrological characteristics of the monitoring periods were obtained from the Signy measuring station S3 (described below) (Figures 1, 2).
2.3 Monitoring physico-chemical variables and fluxes
The monitoring scheme is the result of a collaboration between research units, the EDF group that was in charge of energy production via the dams, and the Regional Directorate of the Environment (DREAL 50). Two stations, one upstream and one downstream of the dams (Figure 1), have been equipped with sensors since 2015 to continuously monitor the water level (pressure sensor with ceramic cell PLS, OTT HydroMet), water temperature (PLS, OTT HydroMet), turbidity (Solitax ts-line sc, 0.001-4000 FNU/NTU, TSS: 0.001 mg L-1–50 g L-1, HACH) and conductivity (C4E, 4 electrode measurement, AQUALABO). River discharge was estimated using a rating curve established for each station by DREAL 50. The upstream station, Virey (S1), which is managed by EDF, is located 14.7 km upstream of the Vezins dam and drains a watershed area of 629 km2. Its sensors take measurements every 1 h. The downstream station, Signy (S3), which we managed, is located 4 km downstream of the RQB dam and drains 777 km2. Its sensors take measurements every 6 min. Turbidity and water-level data from the EDF station located immediately downstream of the RQB dam (Pont de Bateau, S2), whose sensors take measurements every 1 h, were also used in this study.
Since 2015, 1 L grab-samples of water have been taken once per week at the upstream and downstream stations (S1 and S3). These stations also have automatic samplers (ISCO) that sample several flood events per year. These samples are analyzed at the analytical laboratory. Of each sample, 500 mL are filtered at 0.45 µm, dried and then weighed to determine the concentration of suspended sediments (SS) (ISO, 2019b). From half of the samples, a subsample is filtered through a fiberglass membrane and then used to measure C and N concentrations using an elemental analyzer (CN FLASH EA 1112, Thermo Finnigan). For each sample, a bottle of unfiltered water is used to measure the total P concentration via colorimetry (ISO, 2018). Finally, for each sample, a subsample is filled with 0.45 µm filtered water to measure the concentrations of major ions (Cl−, NO3− SO42-) via ionic chromatography (ICS-3000, DIONEX) (ISO, 2021) and PO43- (ISO, 2018), ammonium (ISO, 2019a) and dissolved silica (Si) (AFNOR T90-007) by colorimetry (SmartChem 200, AMS Alliance). Since April 2022, ca. 28 grab-samples of water have also been taken at station S2, four of them during flood events, to measure concentrations of SS. Hourly rainfall data were provided by Météo France from the station in Saint-Hilaire-Du-Harcouet (no. 50484002).
2.4 Data analysis
2.4.1 Data acquisition and treatment
This study examined different phases of the removal project. For the pre-removal period, data from 2015 to March 2017 were used. The dams had not yet been completely dismantled, but hydro-sedimentary continuity of the River Selune was recovered (May 2022) when most of the RQB dam was removed. Monitoring continues, and measurements collected until 1 March 2023 were included in this study. However, emptying of the reservoir behind the RQB dam (from 15 May to 1 September 2022) displaced a large volume of stored sediments. This period was therefore considered separately when analyzing the turbidity signal and calculating sediment loads.
The high-frequency data acquired by the sensors were visualized, examined and validated using the OTT software Hydras 3 (version 2.91.0). Punctual outliers due to factors such as micro-cuts (i.e., shorter than 30 min) were removed and replaced by the mean of the previous and subsequent values. If a sensor drifted for several hours or days, the period was removed. For station S3, hourly time series were extracted from the original data (6-min measurements) for homogeneity with the other stations. For concentrations of chemical elements measured by laboratory analyses, extreme values below or above the 1st and 99th percentiles, respectively, were removed.
Statistical analyses were performed using the stats package (version 4.2.2) of R software (version 4.2.2) (R Core Team, 2022). Graphs were made using the ggplot2 package (version 3.4.1).
2.4.2 Relation between suspended sediment concentration and turbidity
Turbidity represents the cloudiness of water due to SS smaller than 1 mm in size. It is related mainly to the concentration of SS (SSC) but also on the size and type of the particles. Turbidimeter probes are more sensitive to concentrations of fine particles, while measurements of SSC are related mainly to the mass of suspended loads (Thollet et al., 2013). Fine suspended loads were calculated from high-frequency turbidity measurements using a relation calculated between in-situ measurements of SSC and turbidity. To establish this equation between turbidity and SSC, a simple linear regression was used (see, e.g., Minella et al., 2007; Gray and Landers, 2014; Vongvixay et al., 2018):
where
One SSC-turbidity relation was determined per station by selecting relevant events: a regression was calculated for each flood event and selected for the station’s regression if its coefficient of determination (R2) exceeded 0.6. Uncertainty in the calibration equations was calculated as a 95% confidence interval. As the removal operations (e.g., sediment management, dismantling) may have directly influenced the downstream station, data from the pre-removal and removal periods were separated, and one SSC-turbidity relation was determined for each.
2.4.3 Monitoring the emptying of the reservoir behind the RQB dam
Sediment loads at station S3 from 15 May-1 September 2022 were calculated separately from those for the rest of the year, for several reasons. First, the turbidity during the emptying was higher than that usually observed (up to 1,400 nephelometric turbidity units). Second, the particles resuspended by removing the dam likely differed from those that crossed the RQB dam. Finally, a large amount of turbidity data (ca. 1 month in total) was missing at S3 during this period due to technical problems and because the probe became buried under massive sediment deposits. During this period, sediment loads were estimated at the two stations downstream of the dam (S2 and S3) to estimate the amount of sediment that left the dam immediately and that was deposited along the 4 km between the two stations.
A SSC-turbidity relation was established for each station from the samples from this period (6 SSC-turbidity pairs for S2 and 26 for S3). The turbidity data were then divided into four periods (i.e., phases) that had different dynamics: increase, plateau, recession and stabilization. When turbidity data were missing, we used a relation between SSC at stations S2 and S3 established from SS data of the same phase. The mean temporal shift between the two stations, estimated as 3 h, was considered in this relation (Supplementary Figure S1).
2.4.4 Measurement of sand and suspended-solid particle sizes
To highlight effects of dams on the particle-size distribution of sediments that moved downstream, one of two protocols was applied depending on the mode of movement. For SS, water samples at S1 and S3 were analyzed before and after dam removal. The particle-size distribution of SS was measured using a laser particle-size meter (CILAS 1180). Before measurement, each sample was passed through a 1 mm sieve, and an H2O2 solution was added to dissolve the organic matter. Once dissolved, a hexametaphosphate solution was added to prevent particles from aggregating, and an ultrasonic treatment was applied to the bath of the particle-size meter for 1 min.
To sample sediments that moved a few cm above the riverbed, we built sediment traps that were fixed to the riverbed and collected every 2 weeks if the water level was sufficiently low. The traps were made from plastic bottles, which slowed the water flow. Each bottle contained a honeycomb structure that trapped the sediments that passed through. As the inlet of the bottle had a diameter of 3 cm, only small gravel or sand could be trapped, but in practice, the largest sediment caught was a few mm in size. The sediment caught in each trap was dried in an oven and then passed through a set of 6 sieves (from 50 to 2 mm). Traps were installed at S1 in September 2021, before hydro-sedimentary continuity had been restored, and at T1-T4 after May 2022, to assess sediment trapping by large pools downstream of RQB (Figure 1). As the velocity of water passing through the traps was not measured, the sand concentration or mass flow could not be calculated. The size of sand particles in the traps was thus considered as a qualitative indicator of the size of particles that moved near the riverbed.
3 Results
3.1 Coarse sediments are a legacy and moved little
Hydrological conditions varied greatly during the monitoring period. The 2 years flood - Q2 (50.3 m3 s-1) was exceeded during 3 of the 6 observation periods, and the 5-years flood - Q5 (67.2 m3 s-1) was exceeded during 2 of the periods. However, no extreme flows (decennial or greater) were recorded after injecting the tracers (Figure 2). The tracers’ recovery rates during the surveys (92%-100%) were much higher than those reported in the literature, due to their low mobility, regardless of the site or period considered (Figure 2). Despite floods at which morphogenic processes can theorically occur (>2 years flood), all mobility rates were lower than 40%, which indicated partial mobilization of the bottom of the riverbed, even for flows that reached those of a 5-year flood. Once mobilized, 75% of the tracers moved less than 2 m y-1. Even when considering the maximum distances, mobility behaviors differed little among periods and did not exceed 15 m. Despite this low mobility, hydrology and tracer mobility were correlated. The median distances were slightly higher during periods P2, P4 and P5, which experienced either more intense floods (P2 and P5) or more frequent floods (P4). Mobility rates and annual distances changed simultaneously at both sites as a function of discharge, which appeared to be the dominant controlling factor (Figure 2). Finally, sediment had slightly higher mobility at site 2 than at site 1 due to the difference in specific stream power.
3.2 Water temperature and solute concentrations recovered their upstream signals quickly after removal
Water temperature usually increased from upstream (S1) to downstream (S3), especially in summer (Figure 3), and the usually negative difference between them (S1 minus S3) decreased in 2022 once the Selune River flowed freely (Figure 3). In autumn and winter (September to March), the mean difference in water temperature between S1 and S3 relative to mean water temperature at S1 was −9.8% for the pre-removal period and 0.61% for the 2022-2023 hydrological year. Variations in water temperature at S3 were also much lower during the pre-removal period, with a mean daily relative amplitude (i.e., daily maximum minus daily minimum, divided by the daily mean) equal to 11.6%, while for 2022–2023 it reached 18.8% (Figure 3A).
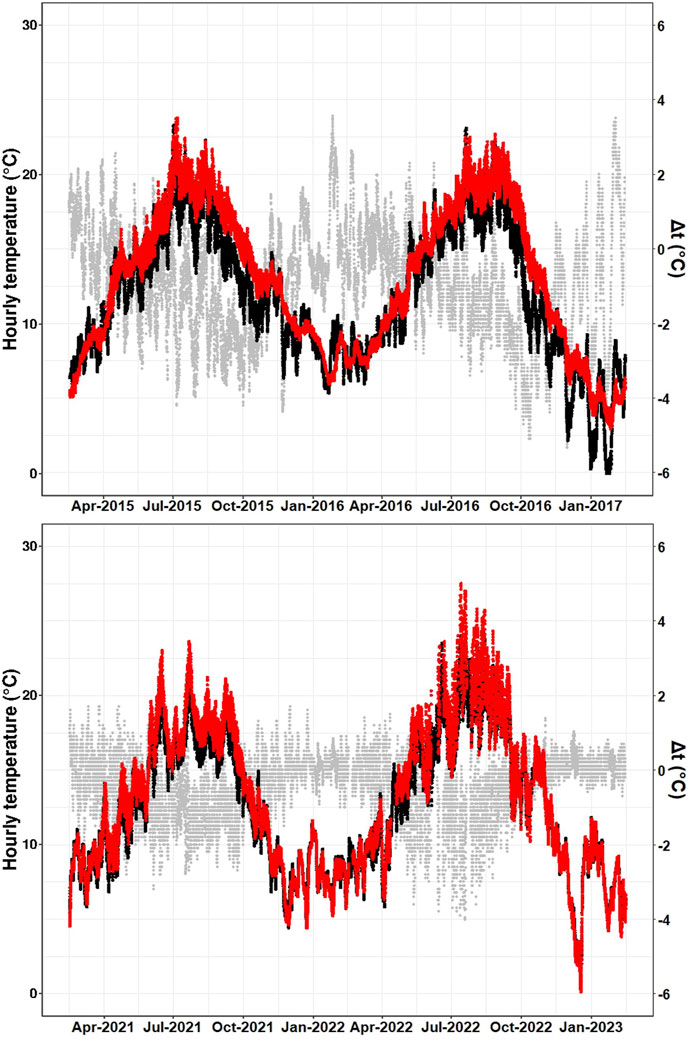
FIGURE 3. Water temperature at stations S1 (black dots) and S3 (red dots), and the difference between them (S1 minus S3) (grey dots), for the period (top) before dam removal (2015–2017) and (bottom) after dam removal (2021–2023).
Before the dams were removed, nitrate and dissolved Si concentrations differed between stations S1 and S3, while after removal, concentration dynamics at S3 rapidly converged towards those at S1 (Figure 4). The concentration dilutions observed for all flow events at S1 were absent at S3 before removal but became similar after removal (Figure 4). Baseline concentrations were slightly lower at S3 than at S1 in spring/summer for nitrate and much lower for dissolved Si. These baseline concentrations differed between S1 and S3 in summer 2015 (29.8 vs. 28.4 mg NO3. L-1 and 7.6 vs. 5.2 mg Si. L-1, respectively) and summer 2016 (34.1 vs. 31.0 mg NO3. L-1 and 7.6 vs. 4.2 mg Si. L-1, respectively). Such differences did not occur after dam removal began, since the dissolved concentrations at S3 became similar to those at S1. In contrast, river discharge differed little between the two stations (Figure 4).
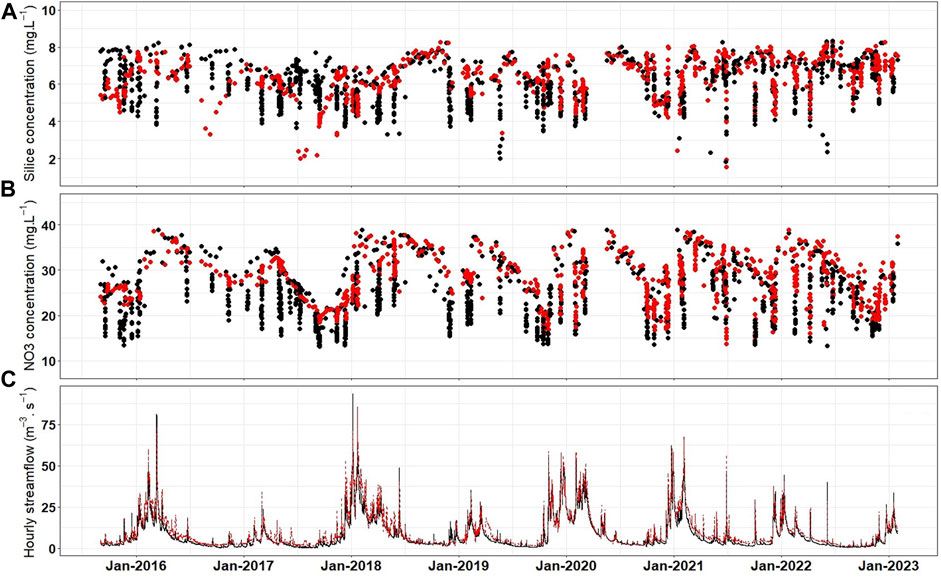
FIGURE 4. Time series of (A) dissolved silica concentration, (B) nitrate concentration and (C) river discharge at stations S1 (black dots) and S3 (red dots).
3.3 Toward full recovery of sediment transfer
3.3.1 Impact of the dams on sediment loads
Before the dams were removed, SS and turbidity signals at S3 were lower than those at S1 (Figure 5; Supplementary Figure S2). In particular, SSC usually peaked during storm events at S1, while no peaks were observed regularly at S3 before May 2022. Only the most intense storm events increased turbidity and SSC at S2 and S3. Similarly, the annual suspended load varied from 4,089–41,954 t (6.6–66.6 t km-2 y-1) at S1 and 1,476–14,297 t (1.9–18.8 t km-2 y-1) at S3, proportional to the annual rainfall and specific runoff (Figure 6; Supplementary Figure S3). On average, 73% (±6%) of the suspended load was stored in the reservoirs from 2015 to 2021. This estimate did not consider fluxes of sand (>50 µm) that moved near the riverbed, since the monitoring equipment could not quantify this component of the sediment flux accurately. However, reservoirs effectively trap sediments larger than 20 µm. Analysis of the SS particle-size distribution at S1 and S3 highlighted that sediment larger than 20 µm did not cross the dams (Figure 7). Assuming that 10% of the total volume of sediment (1,800,103 m3) that settled in the two reservoirs in the past 90 years was larger than 50 µm (IDRA, 2012), the annual sand flux at S1 could be estimated. Based on sample data (IDRA, 2012) and a sediment density of 1.5 g cm-3 (to convert sediment volume to mass), we estimated a time-averaged sand flux at S1 of 3,000 t y-1 (4.8 t km-2 y-1).
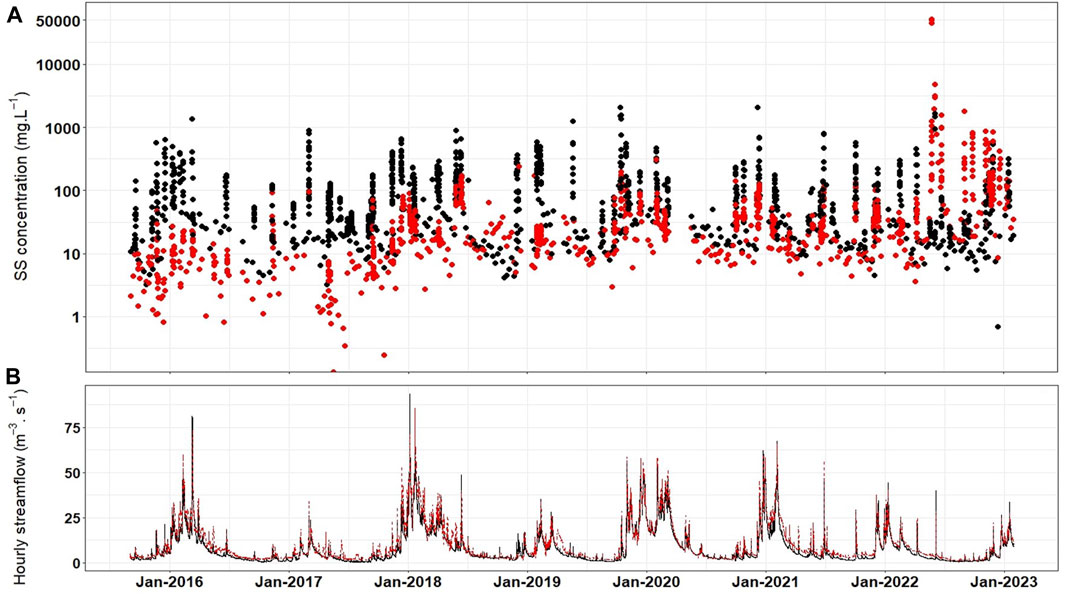
FIGURE 5. Time series of (A) suspended sediment (SS) concentrations (note the log10 scale) and (B) river discharge at stations S1 (black dots) and S3 (red dots), combining weekly grab-samples with flow-event samples from auto-samplers.
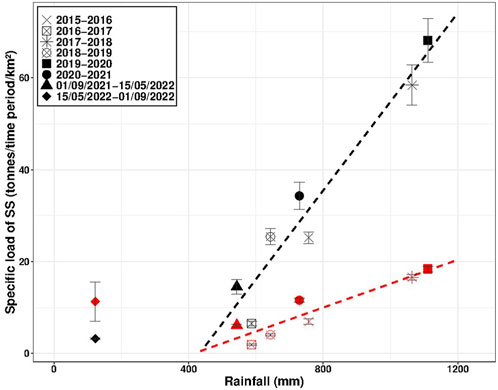
FIGURE 6. Estimated annual specific fluxes of suspended sediment at stations S1 (black symbols) and S3 (red symbols) as a function of annual rainfall for successive hydrological years from 2015 to 2022. Each symbol form corresponds to a given period, usually a water year: e.g., 2015-2016 stands for 1 September 2015 -31 August 2016. The period 1 September 2021-15 May 2022 was that before the last dam was dismantled, while 15 May-1 September 2022 was the period when hydro-sedimentary continuity became effective.
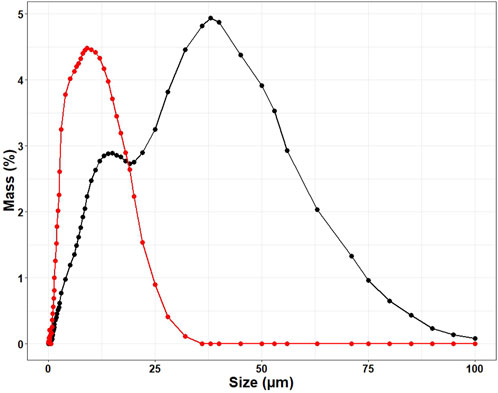
FIGURE 7. Particle-size distribution of suspended sediments at the Virey and Signy stations before the dams were removed.
3.3.2 Initial period of physical continuity
After hydro-sedimentary continuity was restored (15 May 2022), high peaks of SS and turbidity were observed at S2 and S3 (Figure 5, Supplementary Figures S1, 2), without similar dynamics at S1. Estimated fluxes of suspended load for 15 May–September 2022 were 3.2, 17.9 and 11.3 t km-2 at S1, S2 and S3, respectively, which did not follow the linear relation between suspended load and specific discharge observed at S1. Therefore, they could not have come from a sediment source in the upper part of the watershed. Although these estimates had high uncertainties, they highlighted deposition of large amounts of fine sediments between S2 and S3. Six weeks after removal, the turbidity at S3 stabilized to values similar to those at S1. Nevertheless, large deposits of fine sediments are still being observed along the banks of the Selune downstream from the dismantled dams (Figure 8). Hydrological conditions varied little during winter 2022–2023 (Figure 5). After 15 May 2022, sandy sediments were also trapped at T2 but not at T1 (Supplementary Figure S4). Because there was no major storm event from 15 May-15 September 2022, the main sediment source at T2 and T4 during this period corresponded to the finite and easily mobilizable sediment that had been stored behind the RQB dam.
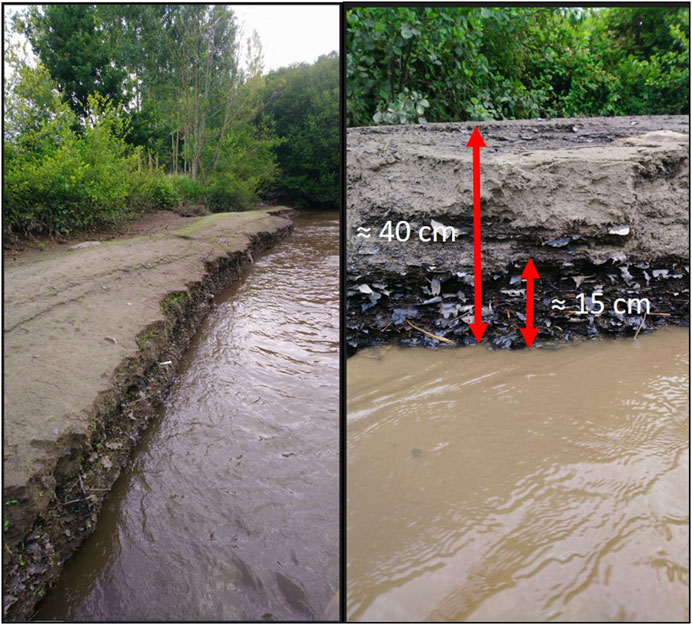
FIGURE 8. Photographs of fine-sediment deposits along the banks of the Selune River in June 2022 downstream from the dismantled dams (between S2 and S3). The presence of decomposing leaves trapped below the sediment layer indicates that the deposits were not associated with a hydrological event.
4 Discussion
4.1 Restoring sediment continuity vs. increasing the turbidity of habitats
The Water Framework Directive lies at the heart of decisions to remove dams, since they are removed to restore ecological and sedimentary continuity; however, bed-load and fine-sediment issues of the latter are rarely distinguished. Restoration of the bed load is targeted because the bed load strongly influences the morphodynamic equilibrium of rivers (Kondolf, 1997) and creates the river forms that support ecological diversity (Pitlick and Wilcock, 2001; Thomson et al., 2001). However, increased fine sediment transfer is associated with the risk of clogging and pollutant transfers, whether in urban or agricultural watersheds (Taylor and Owens, 2009). Tracing coarse-sediment load revealed that the riverbed of the Selune River has low mobility. Furthermore, no morphological indicators (e.g., sediment size, geometry) downstream of the dams indicated that the river had changed in response to a sediment deficit, as observed in many contexts (Kondolf, 1997; Brandt, 2000; Phillips, 2003). This low mobility of the riverbed resulted from two factors: the low energy of this type of river (mean specific power <30 W m2) and its particularly coarse bottom sediment (D50 of 45–50 mm), which it inherited from the Pleistocene (Beauchamp, 2018). Similar sedimentary functioning has also been observed in other rivers in granitic hydrological areas in Normandy (e.g., Orne River, Vire River), whose inherited bottom load no longer corresponds to current hydraulic conditions and thus has low mobility. These rivers now have nearly no coarse sediment input, as their watersheds have produced essentially only fine matter since they were transformed for agriculture in the Middle Ages (Beauchamp, 2018). Moreover, these types of rivers correspond to the “stable bed aggrading bank” model developed by Brown and Keough (1992) and demonstrated by Beauchamp (2018) for the Selune River. Consequently, the banks, little eroded, contain only fine sediments and cannot serve as sources of coarse-sediment load. Thus, concerns about restoring the sediment load and their dynamics in these rivers are low.
4.2 Rapid recovery of abiotic parameters: implications for future resilience of the river
The results show that the dynamics of most nutrient concentrations and water temperature have become more similar between S1 and S3 since the dismantling started. Removing the dams decreased the warming of the downstream sections in warmer seasons, even during summer 2022, which was the hottest summer of the monitoring period. This result is of interest for ecological continuity, especially in the context of climate change. Moulin et al. (2022) identified this warming effect of the dam by decomposing the water temperature signal using independent component analysis. They concluded that the warming caused by the heat accumulated in the reservoirs was associated more with the Vezins dam than the RQB dam. They distinguished seasonal and daily components, and the former had the highest contribution and amplitude. Particular attention must be paid to the amplitude of this seasonal component, especially maximum temperatures in summer, since many organisms do not tolerate high temperatures well, such as Atlantic salmon. Warm season co-occurs with spawning migration (during spring to autumn) of adults for which critical temperature are estimated closed to 25°C (Breau, 2013) and which are likely to be physiologically affected by the warming of river (Lennox et al., 2018). One strategy for surviving heat waves could be to migrate further upstream the main river course (Frechette et al., 2018) where the water is cooler, which is possible now that continuity has been restored.
Nutrient concentration dynamics recovered rapidly at both the event and seasonal scales. Like for water temperature, the Vezins dam had the larger and more biologically active reservoir (Fovet et al., 2020; Rodriguez-Perez et al., 2021); thus, as soon as removal operations started, they directly modified the levels of the reservoirs and changed their biological activity. These dynamics of nutrient concentrations are important for downstream ecosystems, which respond to nutrient ratios (especially the C:N:P:Si ratio) until reaching the ocean (Winton et al., 2019). For instance, Fried and Wuest (2002) illustrated such effects on diatom communities in the Danube River (Germany). Although the chemical continuity of the Selune River seems to have been restored, the fine sediments deposited along it downstream of the dismantled dams are now a source of P. The fate of this stored P will depend strongly on that of the fine sediments, along with pH and variations in redox and temperature, which control the mobilization of P (Parsons, 2017; Gu et al., 2019).
4.3 Long-term monitoring is needed to understand the restoration process
These early results after removal of the Selune dams highlight the relevance of long-term monitoring of abiotic parameters, especially fine-sediment fluxes. The remaining issue for the final phase of restoration is the fate of the sediments that were dredged and stored at the former reservoirs or/and that were deposited downstream at S2 after the reservoir behind RQB was emptied. It is likely that the time required to reach similar dynamics of fine-sediment fluxes between upstream and downstream sections will depend on the hydrological conditions (e.g., Martinez-Carreras et al., 2012; Misset et al., 2019). The frequency of extreme events will strongly influence how rapidly fine-sediment fluxes are restored. Given the locations of S1, S2 and S3, the dynamics of multiple sediment stocks can be monitored. Eventually, S1, S2 and S3 should have similar responses of annual specific suspended load (load divided by the watershed area). The winter of 2022–2023 was relatively calm hydro-dynamically and dry. Indeed, rainfall in Normandy was 28% lower than the winter mean for 1991–2020 (Météo France 2023). Monitoring needs to continue to determine whether this stock will be mobilized within a winter, a year, or a longer period. Additionally, we have begun to analyze sediment tracers using particulate organic markers (Jeanneau et al., 2018), which should help identify remobilization of the deposited sediment more precisely. In particular, it could help distinguish whether sediments come from drained land, riverbanks or eroding reservoir storage.
The results of this study are likely limited to similar rivers (Foley et al., 2017a), first because the response to dam removal also depends on specific characteristics of the dam’s reservoir. For instance, N retention was not high in this study, but other reservoirs can act as active N sinks (Friedl and Wuest, 2002). Second, the response also depends on geomorphological dynamics of the river; as a lowland low-energy river, the Selune River is typical of other hydrosystems in northwestern France (Rollet et al., 2014). Thus, although the river’s coarse sediments were not mobile with or without the dams, it already has favorable habitats for aquatic ecosystems and migratory species.
5 Conclusion
In the Selune River, a lowland low-energy and relatively turbid river in northwestern France, we found the following:
i) coarse sediments moved little before or after the dams were removed
ii) water temperature and solute concentrations downstream of the dams recovered their upstream signals quickly after dam removal
iii) fine sediments responded rapidly, with large amounts mobilized and deposited downstream of the former reservoir and stabilization of water turbidity after 6 weeks
iv) the need to observe the restoration process over periods longer than a year to determine the dynamics and fate of fine sediments, both those dredged and stored in ponds upstream and those mobilized and deposited during the rapid response.
Respectively, they could have the following implications for ecological dynamics during restoration:
i) little influence of coarse sediments, since favorable habitats in aquatic communities are already present
ii) improvement in the river’s water temperature, since removing the dams decreases exposure of downstream reaches to overwarming in the context of climate change
iii) yet-to-be-determined influence of fine sediments, since increased transfer of fine sediments, even punctual, risks clogging habitats.
Data availability statement
The datasets presented in this study can be found in online repositories. The names of the repository/repositories and accession number(s) can be found below: https://geosas.fr/geonetwork/srv/fre/catalog.search#/metadata/6c581e6a-dfd1-4d33-877d-3cd7b302f428.
Author contributions
OF, AC, and A-JR designed the study. FM and OF wrote the first outline of the manuscript. FM, A-JR, and J-MC acquired most of the data with the support of AC, OF and other contributors (see the acknowledgements). FM created the figures and performed the statistical analyses. FM, AC, A-JR, and OF wrote the first draft. All authors contributed to the article and approved the submitted version.
Funding
This project was funded by Agence de l’Eau Seine Normandie (convention no. 1033863, 1044888, 1052504, 1066353, 1074268, 1085100 and 1095128).
Acknowledgments
This study was initiated under the supervision of Catherine Grimaldi, with the technical support of Nicolas Gilliet. We thank Claude Legonidec, Mamadou Ndom, Vincent Stubbe, Beatrice Trinkler, Mathilde Rochoir and Alban Vallet, who helped greatly in acquiring the data used in this study. We benefitted from the support and expertise of Mikael Faucheux for managing and repairing the monitoring stations. Celine Bouillis and Yannick Fauvel performed the chemical analyses via chromatography, colorimetry and elemental analysis at the analytical laboratory of UMR SAS. We thank the current and past coordination teams of the Selune program for their support. Finally, we thank Jeffrey Duda, Guest Associated Editor of this Special Issue and the two reviewers for the constructive and careful review the three of them performed on our manuscript.
Conflict of interest
The authors declare that the research was conducted in the absence of any commercial or financial relationships that could be construed as a potential conflict of interest.
Publisher’s note
All claims expressed in this article are solely those of the authors and do not necessarily represent those of their affiliated organizations, or those of the publisher, the editors and the reviewers. Any product that may be evaluated in this article, or claim that may be made by its manufacturer, is not guaranteed or endorsed by the publisher.
Supplementary material
The Supplementary Material for this article can be found online at: https://www.frontiersin.org/articles/10.3389/fenvs.2023.1231721/full#supplementary-material
References
Abbott, K. M., Zaidel, P. A., Roy, A. H., Houle, K. M., and Nislow, K. H. (2022). Investigating impacts of small dams and dam removal on dissolved oxygen in streams. PLOS ONE 17, e0277647. doi:10.1371/journal.pone.0277647
AFNOR T90-007 (2001). Determination of soluble silicates - method by molecular absorption spectrometry. Available at: https://pubs.acs.org/doi/10.1021/i560096a007.
Basilico, L., Roussel, J-M., Peress, J., Corinne, R., and Stephane, F. (2021). Quand les rivières reprennent leur cours. Notes sur l’effacement de barrages et de seuils, sur la sélune et ailleurs. Vincennes (94): Béatrice Gentil-Salasc (OFB).
Beauchamp, A. (2018). Impacts des aménagements hydrauliques sr les systems fluviaux bas-normands depuis 2000 ans. Impacts of river management on normandy rivers over 2000 years: An geomorphologic and geoarchaeologic approach (PhD). Caen: Université de Caen Normandie.
Bednarek, A. T. (2001). Undamming rivers: A review of the ecological impacts of dam removal. Environ. Manag. 27, 803–814. doi:10.1007/s002670010189
Bellmore, J. R., Pess, G. R., Duda, J. J., O’Connor, J. E., East, A. E., Foley, M. M., et al. (2019). Conceptualizing ecological responses to dam removal: If you remove it, what's to come? BioScience 69, 26–39. doi:10.1093/biosci/biy152
Bellmore, R. J., Duda, J. J., Craig, L. S., Greene, S. L., Torgersen, C. E., Collins, M. J., et al. (2017). Status and trends of dam removal research in the United States. WIREs Water 4, e1164. doi:10.1002/wat2.1164
Berrée, G. (2019). Selune dam removals operation. European Rivers Network international conference on dam removal: Selune valley revival Rennes. Available at: https://www.rivernet.org/general/dams/decommissioning_fr_hors_poutes/pdf/2431-GBERREE_OperationEffacementsBarragesSelune_colloqueSELUNE2019_bd.pdf.
Bohrerova, Z., Park, E., Halloran, K., and Lee, J. (2017). Water quality changes shortly after low-head dam removal examined with cultural and microbial source tracking methods. River Res. Appl. 33, 113–122. doi:10.1002/rra.3069
Brandt, S. A. (2000). Classification of geomorphological effects downstream of dams. CATENA 40, 375–401. doi:10.1016/s0341-8162(00)00093-x
Breau, C. (2013). Knowledge of fish physiology used to set water temperature thresholds for inseason closures of Atlantic salmon (Salmo salar) recreational fisheries. Canada: Fisheries and Oceans Canada, Canadian Science Advisory Secretariat, 24.
Brown, A. G., and Keough, M. (1992). Holocene floodplain metamorphosis in the midlands, United Kingdom. Geomorphology 4, 433–445. doi:10.1016/0169-555x(92)90037-o
Caissie, D. (2006). The thermal regime of rivers: A review. Freshw. Biol. 51, 1389–1406. doi:10.1111/j.1365-2427.2006.01597.x
Doyle, M. W., Stanley, E. H., and Harbor, J. M. (2003). Hydrogeomorphic controls on phosphorus retention in streams. Water Resour. Res. 39. doi:10.1029/2003wr002038
Doyle, M. W., Stanley, E. H., Orr, C. H., Selle, A. R., Sethi, S. A., and Harbor, J. M. (2005). Stream ecosystem response to small dam removal: Lessons from the heartland. Geomorphology 71, 227–244. doi:10.1016/j.geomorph.2004.04.011
Foley, M. M., Bellmore, J. R., O'Connor, J. E., Duda, J. J., East, A. E., Grant, G. E., et al. (2017a). Dam removal: Listening in. Water Resour. Res. 53, 5229–5246. doi:10.1002/2017wr020457
Foley, M. M., Magilligan, F. J., Torgersen, C. E., Major, J. J., Anderson, C. W., Connolly, P. J., et al. (2017b). Landscape context and the biophysical response of rivers to dam removal in the United States. PLOS ONE 12, e0180107. doi:10.1371/journal.pone.0180107
Fovet, O., Ndom, M., Crave, A., and Pannard, A. (2020). Influence of dams on river water-quality signatures at event and seasonal scales: The Sélune River (France) case study. sélune river (france) case study River Res. Appl. 36, 1267–1278. doi:10.1002/rra.3618
Frechette, D. M., Dugdale, S. J., Dodson, J. J., and Bergeron, N. E. (2018). Understanding summertime thermal refuge use by adult atlantic salmon using remote sensing, river temperature monitoring, and acoustic telemetry. Can. J. Fish. Aquatic Sci. 75, 1999–2010. doi:10.1139/cjfas-2017-0422
Friedl, G., and Wüest, A. (2002). Disrupting biogeochemical cycles - consequences of damming. Aquat. Sci. 64, 55–65. doi:10.1007/s00027-002-8054-0
Germaine, M-A., and Lespez, L. (2017). The failure of the largest project to dismantle hydroelectric dams in europe? (sélune river, France, 2009-2017). Water Altern. 10, 655–676.
Graf, W. L. (2005). Geomorphology and American dams: The scientific, social, and economic context. Sci. Soc. Econ. context Geomorphol. 71, 3–26. doi:10.1016/j.geomorph.2004.05.005
Gray, J. R., Landers, M. N., and Ahuja, S. (2013). 1.10 - measuring suspended sediment. In: Comprehensive water quality and purification. (Waltham: Elsevier).
Gu, S., Gruau, G., Dupas, R., Petitjean, P., Li, Q., and Pinay, G. (2019). Respective roles of fe-oxyhydroxide dissolution, ph changes and sediment inputs in dissolved phosphorus release from wetland soils under anoxic conditions. Geoderma 338, 365–374. doi:10.1016/j.geoderma.2018.12.034
IDRA (2012). Étude idra environnement pour la préfecture de la manche. Effacement des barrages de la sélune, gestion des sédiments contaminés et plan de gestion – phase 1 synthèse des données et état des lieux du site.
ISO (2019a). Determination of ammonium nitrogen — method by flow analysis (cfa and fia) and spectrometric detection. ISO 11732:2005.
ISO (2021). Determination of dissolved anions by liquid chromatography of ions — part 1: Determination of bromide, chloride, fluoride, nitrate, nitrite, phosphate and sulfate. ISO 10334-1:2007.
ISO (2018). Determination of orthophosphate and total phosphorus contents by flow analysis (fia and cfa) — part 2: Method by continuous flow analysis (cfa). ISO 15681-2:2018.
ISO (2019b). Determination of suspended solids by filtration through glass-fibre filters. ISO 11923:1997.
Jeanneau, L., Rowland, R., and Inamdar, S. (2018). Molecular fingerprinting of particulate organic matter as a new tool for its source apportionment: Changes along a headwater drainage in coarse, medium and fine particles as a function of rainfalls. Biogeosciences 15, 973–985. doi:10.5194/bg-15-973-2018
Kondolf, G. M. (1997). Profile: Hungry water: Effects of dams and gravel mining on river channels. Environ. Manag. 21, 533–551. doi:10.1007/s002679900048
Lei, Y., Dong, F., Liu, X., Ma, B., and Huang, W. (2023). Short-term variations and correlations in water quality after dam removal in the chishui river basin. J. Environ. Manag. 327, 116917. doi:10.1016/j.jenvman.2022.116917
Lennox, R. J., Eliason, E. J., Havn, T. B., Johansen, M. R., Thorstad, E. B., Cooke, S. J., et al. (2018). Bioenergetic consequences of warming rivers to adult atlantic salmon salmo salar during their spawning migration. Freshw. Biol. 63, 1381–1393. doi:10.1111/fwb.13166
Martinez-Carreras, N., Krein, A., Gallart, F., Iffly, J. F., Hissler, C., Pfister, L., et al. (2012). The influence of sediment sources and hydrologic events on the nutrient and metal content of fine-grained sediments (attert river basin, Luxembourg). Water Air Soil Pollut. 223, 5685–5705. doi:10.1007/s11270-012-1307-1
Minella, J. P. G., Merten, G. H., Reichert, J. M., and Clarke, R. T. (2008). Estimating suspended sediment concentrations from turbidity measurements and the calibration problem. Hydrol. Process. 22, 1819–1830. doi:10.1002/hyp.6763
Misset, C., Recking, A., Legout, C., Valsangkar, N., Bodereau, N., Zanker, S., et al. (2019). The dynamics of suspended sediment in a typical alpine alluvial river reach: Insight from a seasonal survey. Water Resour. Res. 55, 10918–10934. doi:10.1029/2019wr025222
Moulin, N., Gresselin, F., Dardaillon, B., and Thomas, Z. (2022). River temperature analysis with a new way of using independant component analysis. Front. Earth Sci. 10. doi:10.3389/feart.2022.1033673
Olden, J. D., and Naiman, R. J. (2010). Incorporating thermal regimes into environmental flows assessments: Modifying dam operations to restore freshwater ecosystem integrity: Incorporating thermal regimes in environmental flows assessments. Modifying dam operations restore Freshw. Ecosyst. Integr. Freshw. Biol. 55, 86–107. doi:10.1111/j.1365-2427.2009.02179.x
Parsons, C. T., Rezanezhad, F., O'Connell, D. W., and Van Cappellen, P. (2017). Sediment phosphorus speciation and mobility under dynamic redox conditions. Biogeosciences 14, 3585–3602. doi:10.5194/bg-14-3585-2017
Phillips, J. D. (2003). Toledo Bend reservoir and geomorphic response in the lower Sabine River. River Res. Appl. 19, 137–159. doi:10.1002/rra.702
Pitlick, J., and Wilcock, P. (2001). Relations between streamflow, sediment transport, and aquatic habitat in regulated rivers. Geomorphic Process. riverine habitat 4, 0185–0198. doi:10.1029/WS004p0185
Pizzuto, J. (2002). Effects of dam removal on river form and process: Although many well-established concepts of fluvial geomorphology are relevant for evaluating the effects of dam removal, geomorphologists remain unable to forecast stream channel changes caused by the removal of specific dams. BioScience 52, 683–691. doi:10.1641/0006-3568(2002)052[0683:eodror]2.0.co;2
Poirel, A., Gailhard, J., and Capra, H. (2010). Influence des barrages-réservoirs sur la température de l’eau: Exemple d’application au bassin versant de l’Ain. La Houille Blanche 96, 72–79. doi:10.1051/lhb/2010044
R Core Team (2022). R: A language and environment for statistical computing. Vienna, Austria: R Foundation for Statistical Computing.
Riggsbee, J. A., Wetzel, R., and Doyle, M. W. (2012). Physical and plant community controls on nitrogen and phosphorus leaching from impounded riverine wetlands following dam removal. River Res. Appl. 28, 1439–1450. doi:10.1002/rra.1536
Ritchie, A. C., Warrick, J. A., East, A. E., Magirl, C. S., Stevens, A. W., Bountry, J. A., et al. (2018). Morphodynamic evolution following sediment release from the world’s largest dam removal. Sci. Rep. 8, 13279. doi:10.1038/s41598-018-30817-8
Rodríguez-Pérez, H., Pannard, A., Gorzerino, C., Pellan, L., Massé, S., Bouger, G., et al. (2021). Ecological consequences of consecutive river damming for three groups of bioindicators. Ecol. Indic. 131, 108103. doi:10.1016/j.ecolind.2021.108103
Rollet, A. J., Piégay, H., Dufour, S., Bornette, G., and Persat, H. (2014). Assessment of consequences of sediment deficit on a gravel river bed downstream of dams in restoration perspectives: Application of a multicriteria. hierarchical spatially explicit diagnosis River Res. Appl. 30, 939–953. doi:10.1002/rra.2689
Schiermeier, Q. (2018). Europe is demolishing its dams to restore ecosystems. Nature 557, 290–291. doi:10.1038/d41586-018-05182-1
Stanley, E. H., and Doyle, M. W. (2002). A geomorphic perspective on nutrient retention following dam removal: Geomorphic models provide a means of predicting ecosystem responses to dam removal. BioScience 52, 693–701. doi:10.1641/0006-3568(2002)052[0693:agponr]2.0.co;2
Taylor, K. G., and Owens, P. N. (2009). Sediments in urban river basins: A review of sediment–contaminant dynamics in an environmental system conditioned by human activities. J. Soils Sediments 9, 281–303. doi:10.1007/s11368-009-0103-z
Thollet, F., Le Coz, J., Antoine, G., François, P., Saguintaah, L., Launay, M., et al. (2013). Influence de la granulométrie des particules sur la mesure par turbidimétrie des flux de matières en suspension dans les cours d’eau. Influ. grain size changes Turbid. Meas. suspended solid fluxes watercourses 99, 50–56. doi:10.1051/lhb/2013033
Thomson, J. R., Taylor, M. P., Fryirs, K. A., and Brierley, G. (2001). A geomorphological framework for river characterization and habitat assessment. Conservation Mar. Freshw. Ecosyst. 11, 373–389. doi:10.1002/aqc.467
Velinsky, D. J., Bushaw-Newton, K. L., Kreeger, D. A., and Johnson, T. E. (2006). Effects of small dam removal on stream chemistry in southeastern Pennsylvania. J. North Am. Benthol. Soc. 25, 569–582. doi:10.1899/0887-3593(2006)25[569:eosdro]2.0.co;2
von Schiller, D., Aristi, I., Ponsatí, L., Arroita, M., Acuña, V., Elosegi, A., et al. (2016). Regulation causes nitrogen cycling discontinuities in Mediterranean rivers. Sci. Total Environ. 540, 168–177. doi:10.1016/j.scitotenv.2015.07.017
Vongvixay, A., Grimaldi, C., Dupas, R., Fovet, O., Birgand, F., Gilliet, N., et al. (2018). Contrasting suspended sediment export in two small agricultural catchments: Cross-influence of hydrological behaviour and landscape degradation or stream bank management. Land Degrad. Dev. 29, 1385–1396. doi:10.1002/ldr.2940
Ward, J. V. (1985). Thermal characteristics of running waters. Hydrobiologia 125, 31–46. doi:10.1007/bf00045924
Warrick, J. A., Bountry, J. A., East, A. E., Magirl, C. S., Randle, T. J., Gelfenbaum, G., et al. (2015). Large-scale dam removal on the Elwha River, Washington, USA: Source-to-sink sediment budget and synthesis. Geomorphology 246, 729–750. doi:10.1016/j.geomorph.2015.01.010
Warrick, J. A., Duda, J. J., Magirl, C. S., and Curran, C. A. (2012). River turbidity and sediment loads during dam removal. Trans. Am. Geophys. Union 93, 425–426. doi:10.1029/2012eo430002
Winton, R. S., Calamita, E., and Wehrli, B. (2019). Reviews and syntheses: Dams, water quality and tropical reservoir stratification. Biogeosciences 16, 1657–1671. doi:10.5194/bg-16-1657-2019
Keywords: sediments, biogeochemistry, water temperature, nutrients, river restoration
Citation: Fovet O, Meric F, Crave A, Cador J-M and Rollet A-J (2023) Early assessment of effects of dam removal on abiotic fluxes of the Selune River, France. Front. Environ. Sci. 11:1231721. doi: 10.3389/fenvs.2023.1231721
Received: 30 May 2023; Accepted: 26 July 2023;
Published: 04 August 2023.
Edited by:
Jeffrey J. Duda, Western Fisheries Research Center, United StatesReviewed by:
Michal Habel, Kazimierz Wielki University, PolandShreeram Inamdar, University of Delaware, United States
Copyright © 2023 Fovet, Meric, Crave, Cador and Rollet. This is an open-access article distributed under the terms of the Creative Commons Attribution License (CC BY). The use, distribution or reproduction in other forums is permitted, provided the original author(s) and the copyright owner(s) are credited and that the original publication in this journal is cited, in accordance with accepted academic practice. No use, distribution or reproduction is permitted which does not comply with these terms.
*Correspondence: Ophelie Fovet, b3BoZWxpZS5mb3ZldEBpbnJhZS5mcg==, ZnJhbmNvaXMubWVyaWNAaW5yYWUuZnI=