 Jonathan Nogales
 Carlos Rogéliz-Prada
 Miguel A. Cañon
 Andres Vargas-Luna
- 1The Nature Conservancy, Bogotá, Colombia
- 2Department of Civil Engineering, Master in Hydrosystems, Pontificia Universidad Javeriana, Bogotá, Colombia
Introduction: Although freshwater ecosystems encompass 12% of all known species, their study has achieved less progress in systematic conservation planning exercises compared with terrestrial and marine ecosystems. Moreover, little attention has been given to ecosystem services and cultural and spiritual values, which are pivotal in the long-term preservation of freshwater ecosystems. Conservation, restoration, and sustainable management actions within freshwater systems are currently addressed individually, underscoring the necessity of comprehensive methodological frameworks that holistically address the questions of where and how to conserve while integrating ecosystem services and cultural factors as conservation values.
Methods: We propose a new methodological framework for the conservation of freshwater ecosystems that incorporates these elements and fulfills six prioritization criteria: 1) representativeness, 2) integrity, 3) importance, 4) rarity, 5) complementarity, and 6) connectivity. To illustrate the application of this approach, we conducted a regional study in the Caquetá River basin in Colombia.
Results: By applying our methodological framework, we demonstrated that the Caquetá River basin hosts 518 distinct freshwater groups with unique characteristics that contribute to the maintenance of ecosystems and the preservation of their inherent values. Additionally, our analysis revealed that protection is the most effective conservation strategy for 77.4% of the Caquetá River basin, whereas restoration and sustainable management are suitable for 4.7% and 17.9% of the basin, respectively. The prioritized portfolio for the Caquetá River basin encompasses 80.1% of all freshwater groups, effectively meeting The Nature Conservancy’s proposed conservation objectives.
Conclusion: This novel methodological framework provides a pragmatic approach to systematic conservation planning and answers the questions of both where and how to conserve.
1 Introduction
Systematic conservation planning (SCP) is a process aimed at identifying and preserving areas with high conservation value (Kukkala and Moilanen, 2013; Beyer et al., 2016). The most significant progress in SCP has been made in terrestrial and marine ecosystems (Darwall et al., 2011); SCP in freshwater ecosystems has lagged (Nogueira et al., 2023) despite their high species richness (∼12% of all known species) in a very small fraction of Earth’s surface area (∼2%) (Garcia-Moreno et al., 2014; Román-Palacios et al., 2022). The amount of scientific research focused on aquatic systems, including freshwater ecosystems, increased by 60% between 2010 and 2017 (Di Marco et al., 2017), reflecting the need for research on SCP to strengthen decision-making and help counteract the degradation these ecosystems are exposed to (Harrison et al., 2018; Grill et al., 2019; Desforges et al., 2022).
SCP efforts have prioritized defining protected areas to preserve biodiversity (Hermoso et al., 2011; 2018; Tognelli et al., 2019; Dorji et al., 2020; Linke and Hermoso, 2022; Nogueira et al., 2023), overlooking other equally important aspects, such as ecosystem services and cultural and spiritual values, which support societal wellbeing. Recently, Higgins et al. (2021) proposed a conceptual methodological framework to guide the development of more effective conservation strategies for freshwater ecosystems. According to these authors, durable conservation of freshwater ecosystems must incorporate ecosystem services and cultural and spiritual values as conservation values. Doing so will enable the integration of community-driven conservation strategies through the management of common resources, thereby enhancing conservation outcomes (Campos-Silva and Peres, 2016; Garnett et al., 2018; Fa et al., 2020).
Higgins et al. (2021) also argued that the essential characteristics of ecosystems, or key ecological attributes (KEAs), must be identified to maintain the persistence of conservation values (e.g., hydrological regime, connectivity, water quality, physical structure). According to the authors, identifying KEAs also allows for the precise identification of threats to freshwater ecosystems and can guide the selection of appropriate conservation actions and mechanisms to reduce or mitigate these threats in the long term. SCP has attempted to answer fundamental conservation questions, including what should be prioritized for conservation and where it is most cost-effective to do so (Dorji et al., 2020; Pienkowski et al., 2021). However, the question of how to conserve has, so far, been addressed separately (Howard et al., 2018; Mu et al., 2022). Though numerous researchers have focused on defining areas for protection (Tognelli et al., 2019; Szabolcs et al., 2022; Valencia-Rodríguez et al., 2022; Nogueira et al., 2023), SCP frameworks must include other strategies, such as restoration and sustainable management. The freshwater biodiversity emergency recovery plan (Tickner et al., 2020) recognizes the importance of restoration and sustainable management as necessary actions for the conservation of biodiversity, cultural values, and ecosystem services (Janishevski et al., 2015; Arthington, 2021; Mu et al., 2022). Therefore, as stated by Higgins et al. (2021), SCP exercises must integrate different conservation actions with protection to expand the options for selecting legal mechanisms for conservation and the criteria for designing specific conservation activities.
Riato et al. (2020) proposed a multi-scale methodological approach that links KEAs and their threats through an integrity index, which is used to prioritize protection, restoration, and sustainable management actions in rivers and streams, particularly for benthic communities. Other authors have also made valuable contributions; for example, Mu et al. (2022) proposed a methodological framework based on SCP theories to identify optimal sites for cost-effective protection and restoration that consider ecosystem services, such as water yield and carbon storage, as conservation values. Furthermore, Cattarino et al. (2015) proposed a novel algorithm for prioritizing multiple conservation actions within the same site, assuming that threats to freshwater ecosystems can be mitigated by selecting a specific conservation action. This algorithm also considers the inherent connectivity of freshwater ecosystems, building upon the advances by Hermoso et al. (2011). The proposal presented by Riato et al. (2020) stands out among these methodologies by including the concept of basin integrity. This proposal is particularly interesting given its multi-scale approach to the identification of conservation actions, as it inherently evaluates the basin’s capacity (based on its integrity) to support a particular action. Furthermore, the scheme proposed by Riato et al. (2020) is highly adaptable because it does not depend on a specific tool or dataset, giving it great practicality and operability (Riato et al., 2020; 2023).
The efforts mentioned above that incorporate one or several of the criteria described by Higgins et al. (2021) highlight the need for new methodological frameworks that comprehensively address the questions of where and how to conserve. However, although Higgins et al. (2021) described the criteria that should be considered to achieve durable protection of freshwater ecosystems, they did not specify how these criteria should be applied within the context of an SCP process to provide an integrated response to these questions. Therefore, we aimed to develop a new methodological framework for freshwater ecosystem conservation that consolidates and articulates the concepts proposed by Higgins et al. (2021) in an SCP environment. Furthermore, we include the methodological scheme proposed by Riato et al. (2020) to simultaneously address the questions of where and how to conserve.
To achieve our goal, we integrated various models and analytical tools to employ a set of indexes with six prioritization criteria: i) representativeness, ii) integrity, iii) importance, iv) rarity, v) complementarity, and vi) connectivity. Given the Amazon is one of the few megadiverse regions in the world where freshwater biodiversity remains relatively healthy, we used the dam-free Caquetá River basin in the Amazon region of Colombia as a case study (Albert et al., 2011; Anderson et al., 2018; He et al., 2018; Caldas et al., 2023). The Amazon is also home to several Indigenous and local communities that have deep social, cultural, and economic connections with the intricate network of freshwater ecosystems (Campos-Silva and Peres, 2016; Garnett et al., 2018; Fa et al., 2020).
2 Methodological framework
The methodological framework we propose for the SCP of freshwater ecosystems incorporates six criteria commonly used for prioritization (Kukkala and Moilanen, 2013; Linke and Hermoso, 2022; Valencia-Rodríguez et al., 2022): i) representativeness, which prioritizes ecosystems not already under a conservation figure (e.g., protected areas); ii) integrity, which favors ecosystems with less pressure on their KEAs; iii) importance, which prioritizes ecosystems with greater conservation values; iv) rarity, which promotes the selection of unique ecosystems; v) complementarity, which accounts for existing conservation zones; and vi) connectivity, which promotes the connection between ecosystems. Figure 1 schematically depicts the proposed methodological framework, which uses indexes to quantify each of the established prioritization criteria.
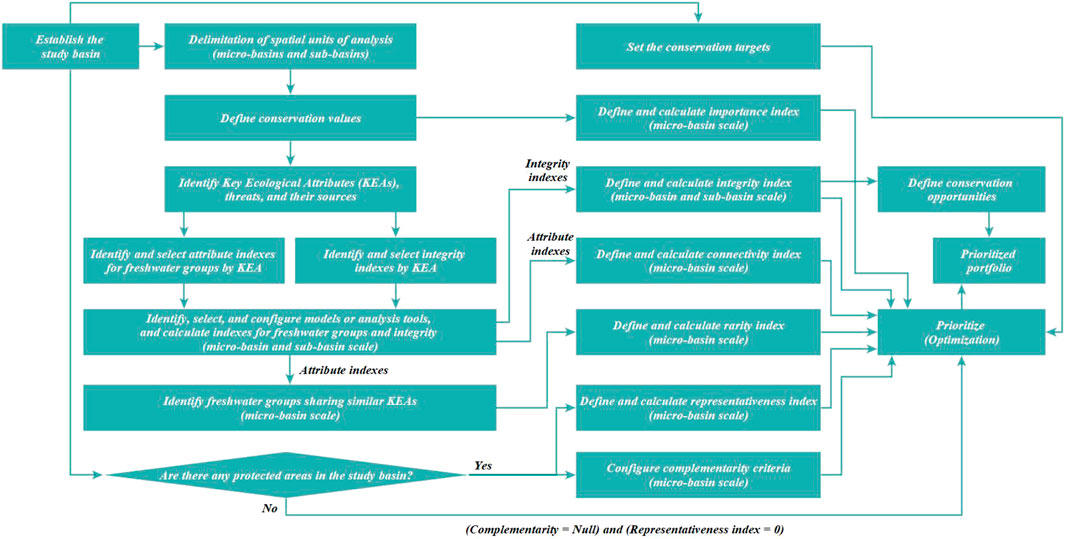
FIGURE 1. Proposed methodological framework for integrated planning of freshwater ecosystems.
We selected the indexes following the criteria described by Higgins et al. (2021). All indexes were estimated at the micro-basin scale, as this is the planning unit considered for the portfolio. Specifically, for the criterion of integrity, our methodology involves calculating this index at two scales: i) micro-basin and ii) sub-basin. These two scales are linked through the framework proposed by Riato et al. (2020), with which we selected the best conservation opportunities (actions).
Finally, the indexes are integrated into a mathematical optimization scheme to select priority areas. The resulting prioritized conservation portfolio combines the priority areas with conservation opportunities. Each of the steps in our methodological proposal is detailed below.
2.1 Establishing the study basin
The first phase of our methodology involves defining the study area, gathering all the secondary information, and defining the field campaigns necessary for the study. At this stage, it is also important to identify the existence of previously established protected areas in the study area as the criteria for representativeness and complementarity depend on this information.
2.2 Setting the conservation targets
Defining conservation objectives serves several purposes. For example, it facilitates the selection of the minimum area necessary to represent and ensure the persistence of conservation values (Linke et al., 2011). These objectives may be established considering the economic constraints related to investment in actions, or they may simply be a product of the specific goals of an organization or group of organizations (Téllez et al., 2011). In this methodological framework, the conservation objectives are set as input criteria for prioritization (see Step 2.17), allowing conservationists to address specific questions or interests.
2.3 Delimitation of spatial units of analysis
Following the proposal by Riato et al. (2020) to select conservation actions (see Step 2.16) using the integrity criterion, our framework uses micro-basins and sub-basins as the scales of analysis. We based our scales on basins as they are appropriate units for the SCP of freshwater ecosystems (Tognelli et al., 2019; Dorji et al., 2020; Linke and Hermoso, 2022; Nogueira et al., 2023). This stage of our proposal consists of automatically delimiting these units using a digital terrain elevation model (DEM), which allows us to obtain the units of analysis and the river segments between two consecutive nodes or within the units. This approach produces a graph representation of the study area that defines the connectivity between the units, which facilitates efficient cumulative calculations (important aspects for Steps 2.8, 2.11, and 2.17).
2.4 Defining conservation values
According to Higgins et al. (2021), conservation values refer to various aspects, such as species, ecosystem services (cultural, provisioning, supporting, and regulating), as well as cultural and spiritual values that are important to a particular community. In our methodology, it is possible to consider one or several of these elements; the number of values to consider will depend on their level of relevance in the selected study area. At the end of the process, conservation values are condensed into a numerical index that we have defined as an index of importance (in Step 2.13).
2.5 Identification of KEAs, threats, and their sources
KEAs are essential characteristics for the maintenance of freshwater ecosystems and, therefore, for the conservation values (Higgins et al., 2021). Existing research has identified the hydrological regime, sediment transport, water quality, physical structure, and connectivity as the main determinants of the physical habitat and biotic communities of freshwater ecosystems (Poff et al., 1997; Castello et al., 2013; Zeiringer et al., 2018; Higgins et al., 2021). In turn, these characteristics shape the social dynamics of communities that depend on these ecosystems for their livelihoods. Therefore, this methodology prioritizes these KEAs for analysis.
Threats, on the other hand, are factors that generate stress on KEAs—e.g., climate change, deforestation, pollution, and dam construction (Poff et al., 1997; Castello et al., 2013; Dudgeon, 2014; Alho et al., 2015; Arthington et al., 2016; Zeiringer et al., 2018)—resulting in ecosystem degradation (Higgins et al., 2021). Therefore, the KEAs, the threats to the KEAs, and the sources of the threats must be selected depending on the study basin. This step is crucial because these decisions will determine the indexes, models, or analysis tools to be used in the study.
2.6 Identification and selection of attribute indexes for freshwater groups by KEA
A freshwater group is a set of planning units, or micro-basins, that possess similar KEAs. In this sense, freshwater groups can be understood as collections of habitats within a basin. Our proposed framework employs simple characteristics and indexes for each KEA, allowing for precise differentiation of areas with unique KEAs without requiring extensive amounts of information for their configuration. The freshwater groups are of great importance in our proposal because we understand them as the freshwater habitats present in the basin. Additionally, the rarity and representativeness criteria are derived from these groups.
2.7 Identification and selection of integrity indexes by KEA
Our methodology considers integrity as the capacity of a basin to support and maintain the broad range of ecological processes and functions essential for both biodiversity sustainability and the resources and services that the basin provides to society (Flotemersch et al., 2016). Based on this definition, our framework uses a set of indexes to assess how the identified threats (in Step 0) may impact the KEAs in the study basin, in turn affecting ecosystem integrity.
2.8 Identification, selection, and configuration of models or analysis tools and calculation of indexes for freshwater groups and integrity
The selection of models and analysis tools is based on the indexes defined for the freshwater and integrity groups. The selected tools must be sensitive to the threats identified in each KEA. Our framework is flexible and allows for the adoption of different approaches and strategies, such as a conceptual approach (Thornbrugh et al., 2018), machine learning (Giri et al., 2019), empirical models, or a combination of these (Einheuser et al., 2013). Moreover, it is possible to select individual tools for each KEA or to use the same tool to model multiple KEAs.
Once the models and analysis tools have been chosen, this stage also includes collecting and processing the information needed to build the models, configuring and running the selected models, and calculating the indexes corresponding to the river and integrity groups.
2.9 Identification of freshwater groups sharing similar KEAs
In this step, the defined attribute indexes are used to group the planning units to identify freshwater clusters. Different clustering approaches can be used to achieve this, including hierarchical, partitional, grid, density-based, or model-based methods (Saxena et al., 2017). The choice of method will depend on the characteristics (qualitative or quantitative) of the attribute indexes selected in Step 2.6. Our goal in identifying freshwater group clusters is to generate connected corridors of high–conservation value micro-basins that host the greatest possible diversity of freshwater groups (representativeness criterion) and include the rarest freshwater groups (rarity criterion).
2.10 Defining and calculating the rarity index
In our methodology, rarity is a measure of the uniqueness or scarcity of a given freshwater group within the study basin, or the proportion or area occupied by that group compared with the rest of the groups present in the basin. Rarity is a criterion in the prioritization process, as described in Step 2.17. Thus, in this phase, we construct an index that reflects the rarity of each freshwater group in the basin using a formula that considers the proportion or relative area occupied by the group in relation to all the groups present. This process produces a numerical index that captures the rarity of each group, enabling the subsequent comparison and prioritization of the groups in the basin.
2.11 Defining and calculating the connectivity index
Because impacts on aquatic ecosystems are cumulative, we seek to foster connectivity in the prioritized micro-basins due to the importance of connectivity for freshwater ecosystems (Saura et al., 2017; Herrera-Pérez et al., 2019). Therefore, in this step, we construct an index that reflects the degree of connection between two micro-basins to prioritize corridors of connected micro-basins linking headwater rivers (see Step 2.17). This index is based on the proximity between micro-basins, measured from their centroids or across their river segments. Key references for the construction of this index were Hermoso et al. (2011, 2018), Cattarino et al. (2015), Wohl (2017), and Dorji et al. (2020).
2.12 Defining and calculating the integrity index
In our proposal, integrity plays a fundamental role in both prioritization (see Step 2.17) and the definition of conservation opportunities (see Step 2.16). Both steps require a single index ranging from 0 to 1, where 0 represents low integrity and 1 represents high integrity. Therefore, this step involves constructing an integrity index that groups the indexes defined in Step 2.7 and calculated in Step 2.8. This can be accomplished using aggregation methods, such as geometric or arithmetic aggregation (Juwana et al., 2012), or multiplicative approaches, such as those used by Thornbrugh et al. (2018).
2.13 Defining and calculating the importance index
The concept of importance in our methodology is closely related to the quantity of conservation values present in a micro-basin. As described in the prioritization section (see Step 2.17), our methodology seeks to maximize importance while achieving the conservation target. In this phase, we construct a numerical index ranging from 0 to 1, where 0 denotes the total absence of conservation values and 1 represents a high concentration of conservation values. One possible approach is to assign a relative weight (between 0 and 1) to each conservation value identified in Step 2.4 and calculate a weighted average of these values. This would provide an index that reflects the overall importance of the conservation values present in the micro-basin.
2.14 Defining and calculating the representativeness index
Our methodological framework defines representativeness as a measure of the presence of freshwater groups in the network of existing protected areas in the study area. The representativeness index can be constructed by considering the area of the freshwater group and the area covered within the protected areas (Duarte et al., 2016). If there are no protected areas in the study area, this index will have a value of 0 for all the micro-basins.
2.15 Configuring complementarity criteria
Complementarity in our methodology refers to the inclusion in the priority portfolio of those freshwater groups that are not represented in protected areas. This concept is closely related to that of representativeness. Therefore, our methodology incorporates this criterion as a constraint in the prioritization process (see Step 2.17) to ensure that the priority portfolio includes existing protected areas in the study area. If there are no protected areas in the study area, this criterion is not considered in the prioritization.
2.16 Defining conservation opportunities
We followed the proposal of Riato et al. (2020) to define conservation opportunities, including protection, restoration, and sustainable management, using the integrity index estimated at the micro-basin and sub-basin levels. The process begins by contrasting the indexes on a 2D scatterplot (both indexes should be scaled between 0 and 1, where 0 represents low integrity and 1 represents high integrity). Then, four quadrants are defined, centered on the 0.5 value of each index. If both the micro-basin and sub-basin indexes show values greater than 0.5, the ecosystem is in good condition; thus, it would be best to consider a protection action because doing so would require minimal intervention. If, instead, the index at the sub-basin scale is greater than 0.5 but the index at the micro-basin scale is less than 0.5, it would be more appropriate to consider restoration as the best conservation opportunity because a healthy sub-basin can support this action. However, if both indexes have values below 0.5, sustainable management would be the best option. In this case, protection and restoration would require considerable effort and resources because they would not be supported by good conditions at either scale.
2.17 Prioritization and optimization
SCP aims to maximize the representation of conservation objects. In our case, it involves identifying the network of micro-basins that maximizes conservation values (importance) while i) promoting the highest representativeness of freshwater groups, ii) connecting the largest number of rare freshwater groups, iii) including micro-basins with high integrity, and iv) generating corridors of connected micro-basins. To achieve this, we relied on the proposal by Hermoso et al. (2011) to formulate the following optimization objective function
We propose using the integrity, rarity, representativeness, and connectivity indexes as penalties (with equal weights) along with a constraint that ensures the selection of micro-basins located within existing conservation areas. Thus, micro-basins with lower integrity, higher abundance of a freshwater group, and representation in existing conservation areas will be penalized more significantly.
2.18 Prioritized portfolio
The conservation portfolio is composed of the priority areas resulting from the optimization process and the conservation opportunities identified from the 2D scatterplot proposed by Riato et al. (2020), which must be addressed to achieve the established conservation objectives.
3 Materials and methods
3.1 Study area
For the application of our methodological framework, we considered the Caquetá River basin, which covers an area of 148,763 km2 and represents 31% of the Colombian Amazon biome (Figures 2A–C). This region has an altitudinal gradient of 4,200–60 masl (Figure 2D), generating a spatially variable annual precipitation range of 790–4,924 mm. The climate is characterized by two rainy seasons per year in the mountain zone (March–May and October–December) and one season in the central and foothill zones (April–June). These climatic conditions foster a wide range of cold to warm tropical environments.
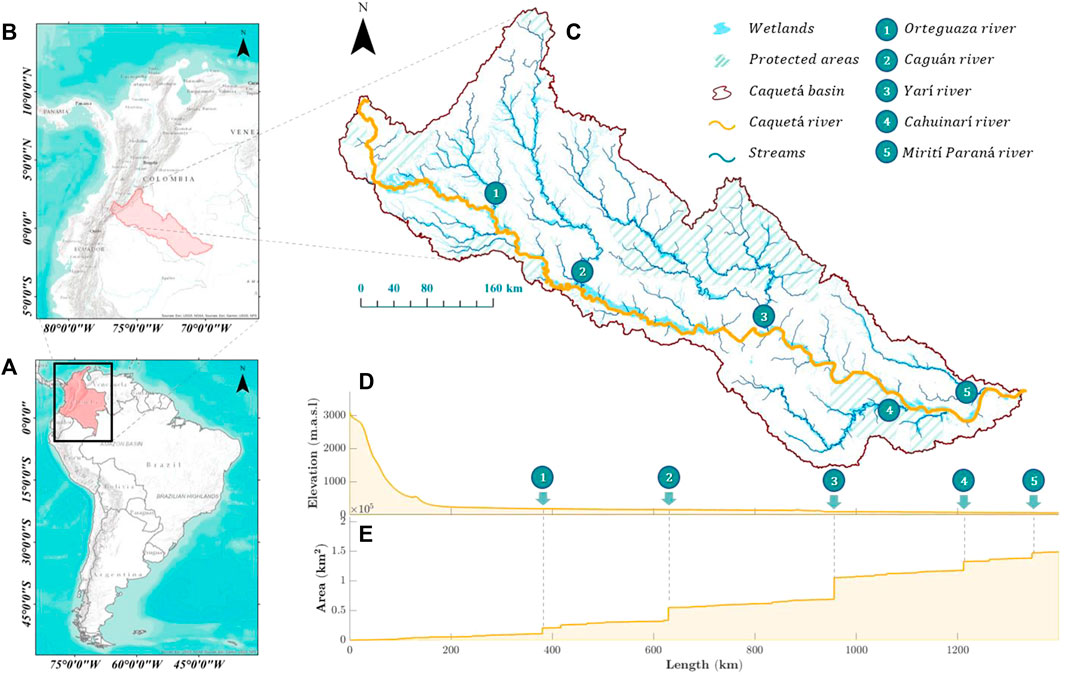
FIGURE 2. Caquetá River basin. (A) Location in South America. (B) Location in Colombia. (C) Hydrographic map of the Caquetá River basin and main rivers. (D) Elevation profile of the Caquetá River. (E) Profile of accumulated area (tributaries) on the Caquetá River.
The Caquetá River is 1,400 km in length and collects the waters from other important rivers, such as Orteguaza (696 m3/s), Caguán (1,142 m3/s), Yarí (2,138 m3/s), Cahunarí (986 m3/s), and Mirití Paraná (654 m3/s), reaching an average annual flow of 10,100 m3/s. Approximately 13% of its drainage area is wetlands, of which 18% have been intervened on or transformed by anthropic actions (Ministerio de Ambiente Desarrollo Sostenible, 2021). Currently, 21% of the basin is protected by 10 natural parks (Figure 2C) (Parques Nacionales Naturales de Colombia, 2020).
The characteristics of the Caquetá River basin support biodiversity in its freshwater ecosystems. More than 400 fish species have been recorded in the different tributaries (Celis-Granada et al., 2022). The Caquetá River is also an important migratory corridor for 23 species, including turtles (e.g., Podocnemis expansa), fish (e.g., Brachyplatystoma rousseauxii), and dolphins (e.g., Sotalia fluviatilis) (He et al., 2018; 2021; Caldas et al., 2023). Cultural richness is also a distinctive feature of this area, which is home to Indigenous, peasant, and Raizales communities (Agencia Nacional de Tierras, 2023). Indigenous communities have a greater presence in the territory, with 96 legally constituted Indigenous reserves occupying 43% of the total area and bringing together peoples such as the Murui-Muinane, Yucuna, Andoque, Inga, and Coreguaje, among others (Agencia Nacional de Tierras, 2023). There is also recorded evidence of uncontacted isolated communities in this region (Seifart and Echeverri, 2014; Walker et al., 2016; Walker and Hamilton, 2019).
3.2 Conservation targets
Recognizing the global importance of the Amazon River basin for the conservation of freshwater biodiversity and the communities that depend on it, The Nature Conservancy has prioritized this area in its conservation vision for 2030 (The Nature Conservancy, 2022). As part of this commitment, they have embarked on a conservation planning process to establish a roadmap for their future work, thereby helping to preserve the biodiversity and the values it supports. To achieve this, The Nature Conservancy developed a conservation plan for the Amazon River basin with the following objectives, which we have considered for the Caquetá River basin.
• Conserve 80% of the main rivers (large and very large; flow >100 m3/s), ensuring connected corridors that remain functional/healthy.
• Conserve 30% of the headwater rivers (small and medium-sized; flow ≤100 m3/s), ensuring connected corridors to the main channels that remain functional/healthy.
The materialization of these objectives by The Nature Conservancy would contribute to Target 3 of the United Nations Convention on Biological Diversity: to protect and effectively manage 30% of the world’s terrestrial, inland waters, and coastal and marine areas by 2030 (ONU, 2022).
3.3 Spatial units of analysis
To delimit the micro- and sub-basins of the Caquetá River basin, we used the Shuttle Radar Topography Mission DEM with a 90-m resolution (Jarvis et al., 2008). We processed the DEM using ArcGIS 10.7 and ArcHydro Tools. To delimit micro-basins, we used an area accumulation threshold of 2.8 km2. However, in areas where the river profile showed a steeper slope than the adjacent segments, known as knickpoints, we performed an additional segmentation. For this subdivision, we considered the geomorphological conditions of the areas and the habitats they provide (Ross et al., 2001) and used the algorithm proposed by Hayakawa and Oguchi (2006) to detect the knickpoints. We defined the sub-basins according to the delimitations established by the environmental authority, Corporación para el Desarrollo Sostenible del Sur de la Amazonia (Corpoamazonía), so the proposed conservation portfolio can be effectively integrated with territorial planning instruments.
3.4 Conservation values
We considered the following conservation values for the Caquetá River basin:
Species: i) We obtained information on 55 species of fish, 47 species of amphibians, and 102 species of aquatic birds from the collaborative BioModelos system of the Alexander Von Humboldt Institute (Velásquez-Tibatá et al., 2019). ii) We considered the distribution of four species (Pteronura brasiliensis, S. fluviatilis, Tapirus terrestres, Tapirus pinchaque) in danger of extinction as reported by the IUCN (2022). iii) Data on megafauna species and their migratory corridors were taken from Caldas et al. (2023) and He et al. (2018), respectively.
Ecosystem services: Recreation and tourism were integrated based on the distribution of recreation person-days, which we generated using the InVEST Visitation: Recreation and Tourism model (Natural Capital Project, 2022).
Cultural areas: Ninety-six Indigenous reserves were included from two areas of the Raizales community and one peasant reserve, using the information reported by Agencia Nacional de Tierras (2023).
Spiritual areas: Sacred and spiritual sites for Indigenous communities were defined according to Organización Nacional de los Pueblos Indígenas de la Amazonia Colombiana (2017), considering the importance they represent for the cosmovision of Indigenous peoples (The Nature Conservancy and The Amazon Conservation Team, 2019).
3.5 KEAs, threats, and their sources
In Amazonian freshwater ecosystems, including the Caquetá River basin, deforestation is primarily driven by agricultural and livestock expansion. These activities are also sources of phosphorus and nitrogen pollution resulting from the fertilization of pastures and crops. Other sources of pollution include oil and gas concessions and legal and illegal mining activities, the latter of which is primarily associated with mercury contamination from gold extraction (Castello et al., 2013). According to Diaz et al. (2020), Colombia is among the countries that use the greatest amount of mercury to produce one ton of gold (4.19 Hg/ton). Moreover, climate change has reduced precipitation and increased temperatures in the Amazon (Killeen and Solórzano, 2008). The Caquetá basin does not currently have hydropower development modifying water and sediment flows or disrupting the river network. Table 1 summarizes the main threats and the sources that we considered in our analysis, according to the selected KEAs.
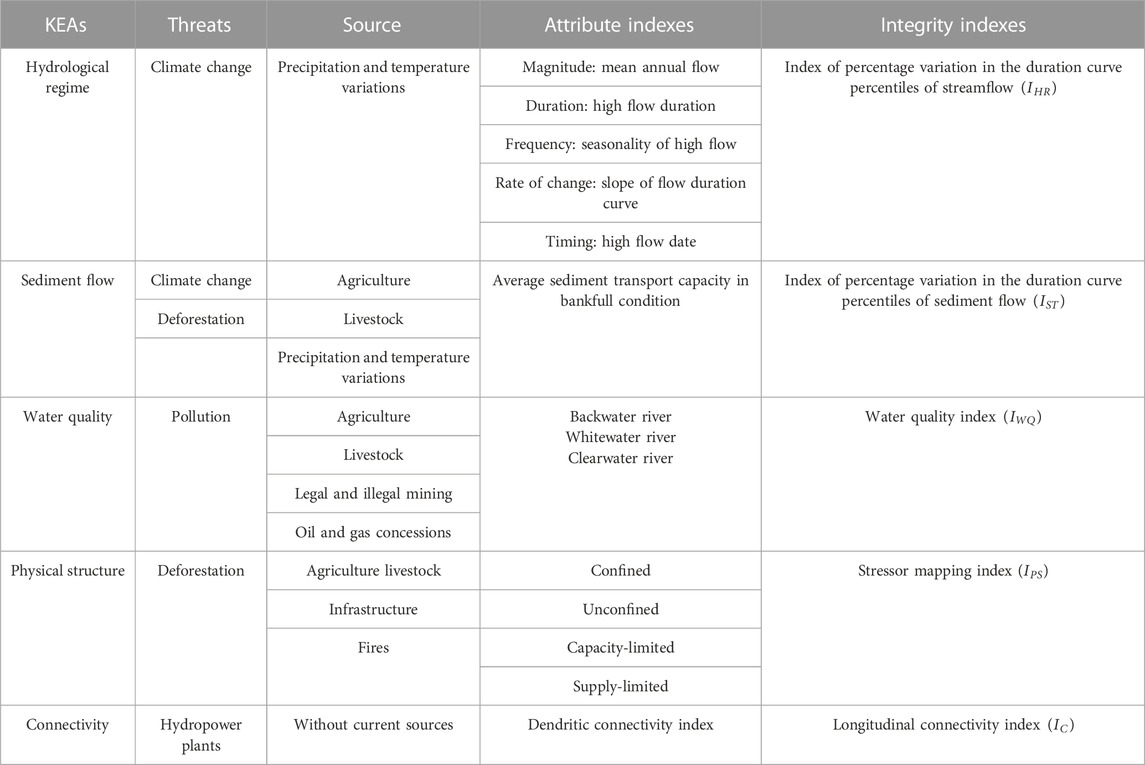
TABLE 1. Key ecological attributes (KEAs), main threats, their sources and attribute and integrity indexes selected for the Caquetá River basin.
3.6 Freshwater group indexes
Here, we describe the indexes selected for each KEA in the case study.
Hydrological regime: We considered the components of the hydrological regime (magnitude, frequency, duration, timing, and rate of change) using the following hydrological signatures of the Caquetá River (McMillan, 2020; 2021): i) mean annual flow (magnitude), ii) high flow duration (duration), iii) frequency of peak flow (frequency), iv) slope of the flow duration curve (rate of change), and v) mean half flow date (timing) (Table 1).
Sediment transport: We estimated the sediment transport capacity under bankfull conditions as an index for this KEA (Table 1).
Water quality: For Amazonian environments, three types of water have been defined in terms of chemical composition (Ríos-Villamizar et al., 2013): i) blackwater rivers, ii) clearwater rivers, and iii) whitewater rivers (see Table 1).
Physical structure: Considering the importance of biotic productivity (Venarsky et al., 2018) and available habitats in freshwater ecosystems (Flores et al., 2006; Buffington and Montgomery, 2022), we selected the following indexes to assess the study area’s physical structure: i) the morphological configuration of the river, which can be confined or unconfined, and ii) the specific stream power, which can be capacity- or supply-limited (Table 1).
Connectivity: Connectivity is an essential attribute of freshwater ecosystems (Saura et al., 2017; Herrera-Pérez et al., 2019), particularly for fish that perform migratory movements in the Caquetá River basin, such as the B. rousseauxii catfish (Córdoba et al., 2013). For this KEA, we have selected the dendritic connectivity index, as proposed by Cote et al. (2009) (Table 1).
Step 3.9. details how we used these attribute indexes to identify freshwater groups.
3.7 Integrity indexes
Hydrological regime and sediment transport: Based on the hydrological alterations concept by Poff et al. (2010), we created an index that allows us to evaluate the impact of the climate change threat on the hydrological regime and sediment transport. The mass flow index (
where
Water quality: We considered the following water quality index
where
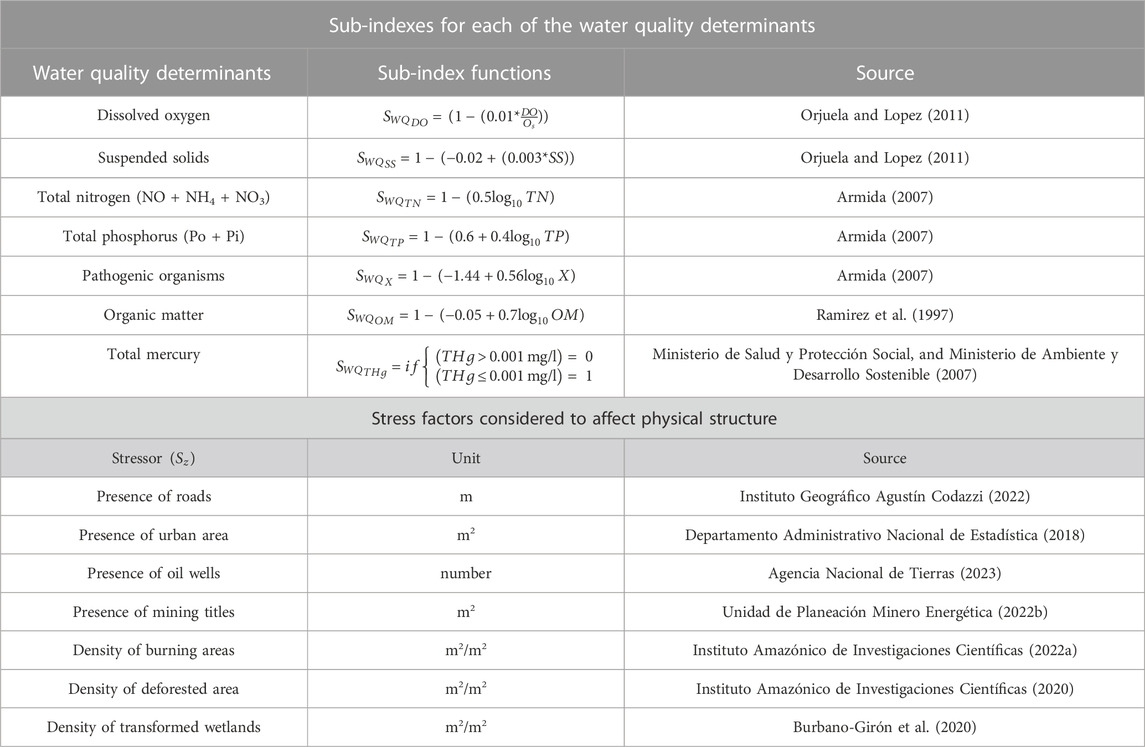
TABLE 2. Sub-indexes considered for each of the water quality determinants considered in the water quality index and stress factors considered to affect physical structure.
In Table 2,
Physical structure: We adapted a stressor mapping index
where
The stressors we refer to are anthropogenic disturbances that degrade ecosystems and, therefore, their functions (Flotemersch et al., 2016) (e.g., human-caused forest fires, agricultural land use, urban areas, and road density). To calculate the
Connectivity: We constructed a longitudinal connectivity index
where
3.8 Models and analysis tools
To estimate the two groups of considered indexes—freshwater group indexes and river integrity indexes—we configured a set of models and analysis tools for each KEA. The purpose and objectives of these tools are outlined in the following sections. The Supplementary Material provides the technical details of the configuration, inputs, and outputs of the models.
3.8.1 KEA: Hydrological regime
We used the aggregated conceptual hydrological model GR4J (Perrin et al., 2003) to generate a time series of daily mean discharge in each of the micro-basins and sub-basins defined for the Caquetá River basin. We selected this model for its parsimonious structure, low data requirements for configuration, and good performance in tropical basins (Carvajal and Roldán, 2007; Anshuman et al., 2019; Carlos et al., 2023). For its configuration, we used data generated by the hydro-climatological monitoring network of the Instituto de Hidrología, Meteorología y Estudios Ambientales (IDEAM), which consists of 104, 92, and 11 stations that record precipitation, temperature (maximum, minimum, and mean), and discharge, respectively. We used the Grubbs test (Grubbs, 1950), the Tukey test (Tukey, 1977), and the double median absolute deviation test (Prabhakar et al., 2022) to detect and remove outliers. We filled in missing precipitation and temperature records using the inverse distance weighting method (Shepard, 1968) and ordinary least squares method (Stahl et al., 2006), respectively. To calibrate the hydrological model, we applied the dynamically dimensioned search optimization algorithm proposed by Tolson and Shoemaker (2007) and selected the Nash-Sutcliffe efficiency coefficient as the objective function (Nash and Sutcliffe, 1970). The calibration and validation periods for the 11 selected discharge stations were 1985–2005 and 2005–2020, respectively.
To evaluate climate change, we relied on projected precipitation and temperature data between 2020 and 2050 from six global circulation models (Table 3). These data were generated under a shared socioeconomic pathway of fossil-fuel-driven development to reach a radiative forcing condition of 8.5 W/m2 by 2,100 (most critical scenario) (Almazroui et al., 2021). We corrected bias in the data using the bias-corrected statistical disaggregation method (Wood et al., 2004; Gupta et al., 2019; Ratri et al., 2019). We used the adjusted series to run the GR4J model, generating six discharge series, which were then ensemble-averaged at each time step.
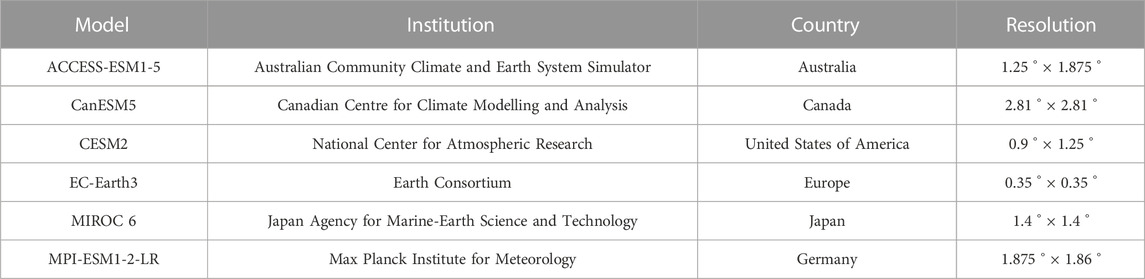
TABLE 3. CMIP6 global circulation models evaluated in the study.
Using the toolbox for streamflow signatures in hydrology (Gnann et al., 2021) and the discharge series generated with the GR4J hydrological model for the historical condition, we assessed the selected hydrological signatures to determine the freshwater groups.
With the same tool, we constructed flow duration curves for both the historical and climate change conditions and calculated the hydrological integrity index,
3.8.2 KEA: Sediment transport
We used a modified version of the Catchment Sediment Connectivity and Delivery tool (Schmitt et al., 2016) to represent sediment flow and provenance in the Caquetá River basin. To configure the tool, we divided the micro-basins into those with sandy riverbeds and reaches with gravel beds, assuming that the former is capacity-limited (slope ≤0.025 m/m) and the latter are supply-limited (slope >0.025 m/m), using the criterion proposed by Flores et al. (2006).
We determined the bankfull hydraulic conditions (width, depth, and velocity) and the mean sediment size (D50) by solving the equations proposed by Wilkerson and Parker (2011) (sand beds) and Parker et al. (2007) (gravel beds) based on the approach used by Schmitt et al. (2016). We verified the estimation results for micro-basins with sandy beds using D50 data from six sediment samplings we gathered from the main channel of the Orteguaza and Caquetá Rivers. The number of samplings was limited due to safety conditions in the Caquetá River basin. We adjusted both equations by introducing correction factors—one for slope in the sections with sandy beds and another for width in the channels with gravel beds—both of which depend on the bankfull discharge of the micro-basins.
We also adjusted the bankfull widths in sites with rapids or geological confinement using the rapid sites reported in the Instituto Geográfico Agustín Codazzi (2022) national base mapping and the corresponding 2020 satellite images from Google Earth. The bankfull discharge considered for the analysis corresponds to a 2.33-year return period. Finally, to calculate sediment transport, we used the equations by Engelund and Hansen (1967) and Wong and Parker (2006) for sections with sandy and gravel beds, respectively.
To calculate the contributions of suspended sediment, we used the InVEST sediment delivery ratio model (Natural Capital Project, 2022), which utilizes the revised universal soil loss equation (Renard et al., 1996) to estimate the annual amount of soil loss and, through the sediment delivery ratio (Vigiak et al., 2012a), estimates the proportion of soil loss reaching the river. For its configuration, we used the information presented in Table 4. We validated the simulated sediment delivery ratio values with the suspended sediment records reported by Instituto de Hidrología Meteorología y Estudios Ambientales (2019).
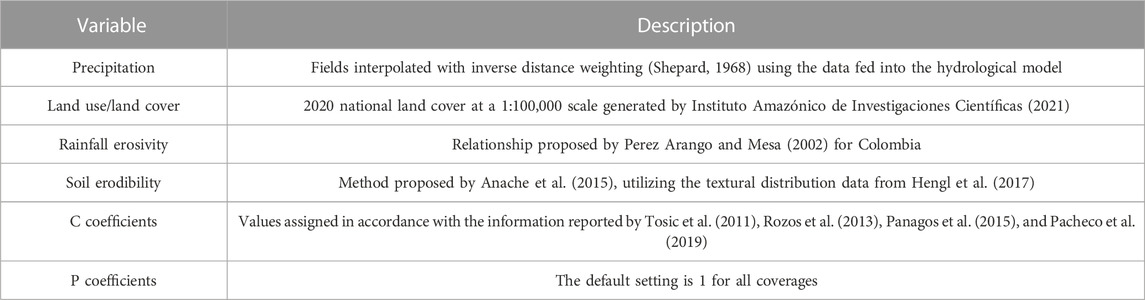
TABLE 4. Information used to configure the sediment delivery ratio in the Caquetá River basin.
Once we configured the models, we used climate data, specifically the multi-year annual average precipitation and the bankfull discharge in the historical condition, to estimate the sediment transport capacity (an index for freshwater groups).
Similarly, we use climate data and discharge data associated with the flow duration percentiles of both the baseline and climate change scenarios to construct the sediment flow duration curve. Using the curve data, we estimated the integrity index
3.8.3 KEA: Water quality
Based on the assimilation factor concept proposed by Chapra (2008), we constructed a steady-state water quality model that allowed us to estimate 14 water quality determinants (WQD) for the entire Caquetá River basin: temperature (T), conductivity (Co), organic nitrogen (NO), ammoniacal nitrogen (NH4), nitrates (NO3), organic phosphorus (Po), inorganic phosphorus (Pi), organic matter (MO), dissolved oxygen (O), suspended solids (SS), pathogenic organisms (X), elemental mercury (Hg0), divalent mercury (Hg2), and methyl mercury (MeHg). The equations for the assimilation factors were derived from the ADZ-QUASAR water quality model (Lees et al., 1998), as addressed by Correa-Caselles (2022), Mamani (2022), Navas (2016), and Rojas (2011). The computational implementation of the assimilation factors was carried out in MATLAB using object-oriented programming. Our model was designed to operate at the topological network level under a recursive accumulation scheme, allowing us to analyze large topological networks in minutes with low memory consumption. Additionally, our model assimilates inputs from point and diffuse loads of different WQD.
Considering the identified agricultural sources of contamination (Table 1), we used the 2020 national coverages at a 1:100,000 scale generated by Instituto Amazónico de Investigaciones Científicas (2022b) to assign fertilization loads to crop areas. For fertilization with different forms of nitrogen, we assigned a fertilizer with proportions of 50% NO3 and 50% NH4. For grassland areas, we assigned organic fertilization (manure) with a proportion of 40% NO, 30% NO3, and 30% NH4 (Sociedad de Agricultores de Colombia, 2002). We obtained annual nitrogen load values per fertilizer from the British Survey of Fertiliser Practice (2018). For phosphorus, we assigned a fertilizer with a proportion of 70% Pi and 30% Po (Wade et al., 2007; Whitehead et al., 2011; Jackson-Blake et al., 2016), and we gathered annual phosphorus load values from Pérez-Vélez (2014). To estimate diffuse loads from livestock, we used information from bovine censuses (ICA, 2021) and the suggested loads by Iglesias-Martínez (1994). For coliform loads, we consulted Heras-Sierra et al. (2016). We used the connectivity index (Vigiak et al., 2012b) suggested in the Nutrient Delivery Ratio model (Natural Capital Project, 2022) to determine the proportion of nutrient delivery to the channel.
We gathered population data by population center (IGAC, 2022) from the National Population and Housing Census Departamento Administrativo Nacional de Estadística (2018) and presumptive loads for the WQD as defined by Ministerio de Vivienda Ciudad y Territorio (2017) for Colombia. For oil well concessions, we used data on producing oil wells reported by Agencia Nacional de Hidrocarburos (2022). For each well, we estimated the loads of the DWQ using the permissible discharge limits established by Ministerio de Ambiente Desarrollo Sostenible (2021). The quantities of water discharged per well were inferred from the water use factors for the production phases of hydrocarbons defined by Instituto de Hidrología Meteorología y Estudios Ambientales (2010). We quantified mercury discharges from legal and illegal gold mining using Colombia’s gold production information for 2022 Unidad de Planeación Minero Energética (2022a) and the reported mercury use ratios by Diaz et al. (2020). To determine the distribution of the different forms of mercury, we used the proportions reported by Sanchéz and Cañon (2010) and previously implemented by Correa-Caselles (2022). The spatial distribution of the estimated mercury loads was performed using legally established mining titles (Unidad de Planeación Minero Energética, 2022b) and illegal mining sites reported by (RAISG, 2020). We validated the orders of magnitude of the modeled conventional determinants with data reported by Torres et al. (2021) and verified the mercury distributions with the results reported by Correa-Caselles (2022).
We used the modeled values of suspended solids, nutrients (nitrogen and phosphorus), and organic matter concentrations according to the ranges established by Maco-García (2006) to generate the attribute index for the freshwater groups (Table 1). We adjusted the result with information on Amazonian water types developed by Ríos-Villamizar et al., 2013; Ríos-Villamizar et al., 2020a; Ríos-Villamizar et al., 2020b), Wildlife Conservation Society (2020), and expert opinions from professionals with extensive experience in the study area. Based on the results obtained from the model, we calculated the sub-indexes corresponding to each water quality determinant, which allowed us to estimate the integrity index
3.8.4 KEA: Physical structure
For physical structure, we chose to use two indexes that do not require the construction of a mathematical model, diverging from the processes used for the previously described KEAs. Instead, we used an attribute-based approach for the freshwater group indexes and spatial analysis through stressor mapping to calculate the integrity index
Calculation of freshwater group indexes: We determined the degree of river confinement by evaluating the relationship between the width of the floodplain or active channel area
Calculation of integrity index: Following the approach proposed by Flotemersch et al. (2016), we calculated the maximum value for each selected stressor per analysis unit. Considering that the Amazon’s resilience is declining (Boulton et al., 2022), we assumed that the ecosystem response to stressors is one of low resilience. Therefore, we used a logistic function to represent the behavior shown by Flotemersch et al. (2016) and, in this way, estimated the
3.8.5 KEA: Connectivity
By delimiting the micro-basins using a DEM, we obtained the river lengths between consecutive nodes or fluvial connections, which allowed us to define the topological relationships between the micro-basins using a graphical approach. From this information, the paths from each micro-basin to the mouth of the basin were calculated to construct the established attribute and integrity indexes (Table 1).
3.9 Freshwater groups
To identify the freshwater groups in the Caquetá River basin, we clustered the micro-basins based on the similarity of the KEAs using the indexes defined in Step 3.6 (Table 1). For this process, we used an agglomerative hierarchical clustering method and selected the inconsistency coefficient as the metric for determining the clusters (Saxena et al., 2017). During the clustering process, we categorized the indexes according to their ranges of variation, as shown in Table 5, and used these categories as the basis for clustering to define the freshwater groups.
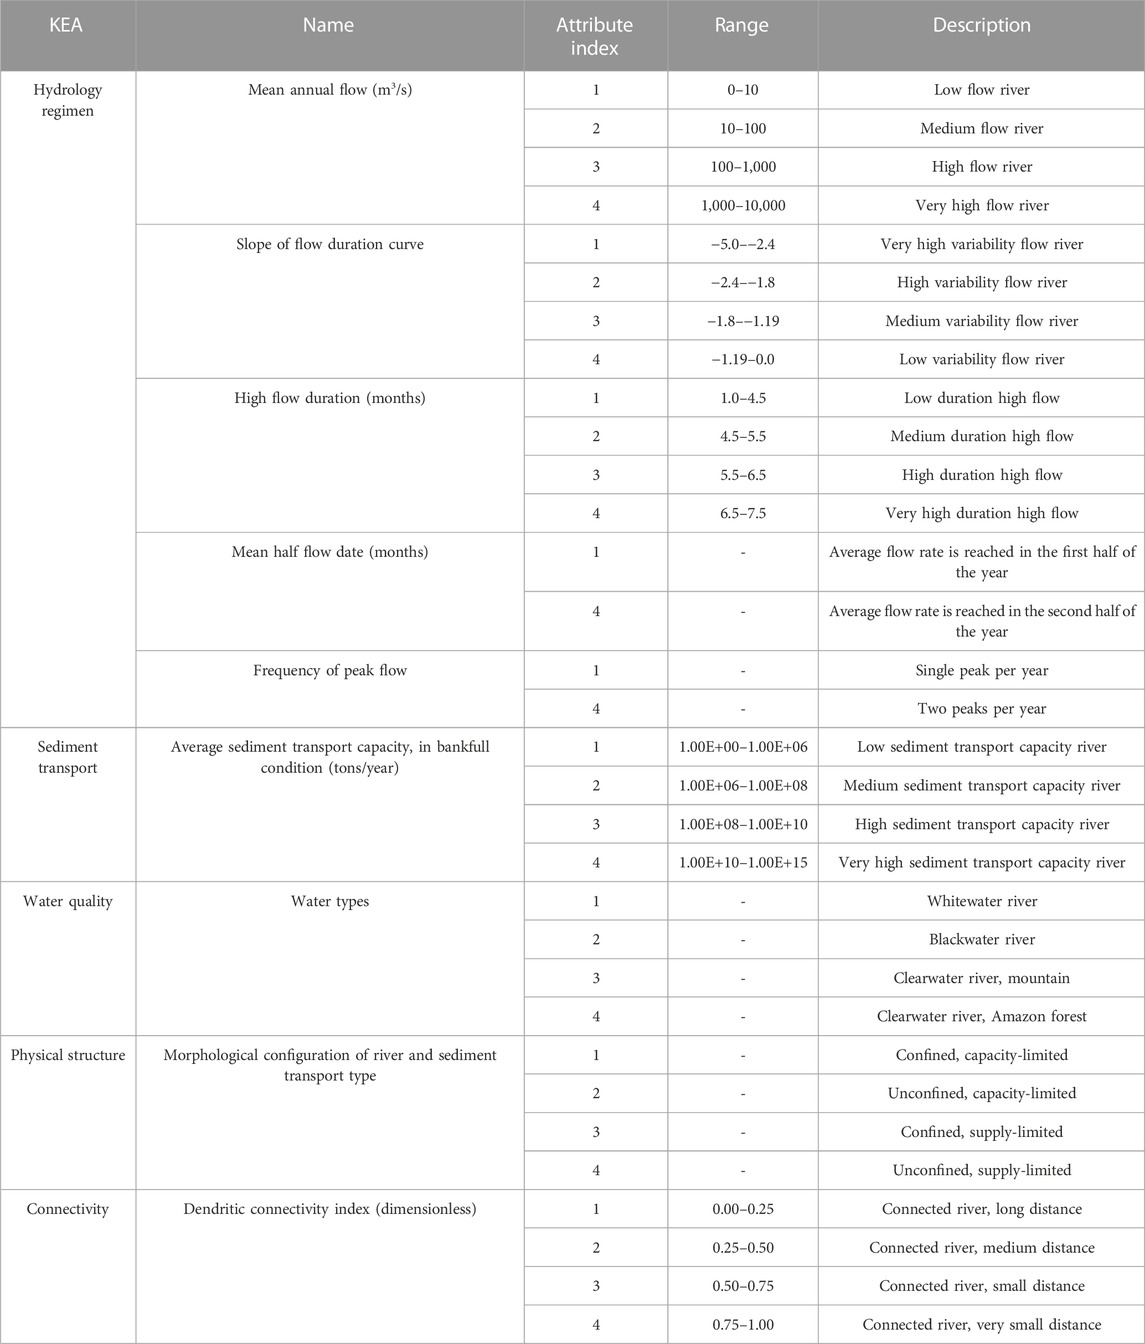
TABLE 5. Ranges and values of attribute indexes per key ecological attribute (KEA) defined for the grouping of freshwater groups in the Caquetá River basin.
3.10 Rarity index
We calculated the rarity
where
where
3.11 Connectivity index
To calculate the connectivity index, we constructed a directional upstream adjacency matrix (Wohl, 2017) that includes, for each unit, the degree of connectivity defined by the proximity between micro-basins, measured using the length of the main channel of each micro-basin. As an example, consider that the study area is segmented into five micro-basins, each of which has a river segment with a length of 5 km. The directional upstream adjacency matrix for the micro-basins would be represented by
3.12 Integrity index
For the Caquetá River basin, we developed a global integrity index
In this equation, we normalize each
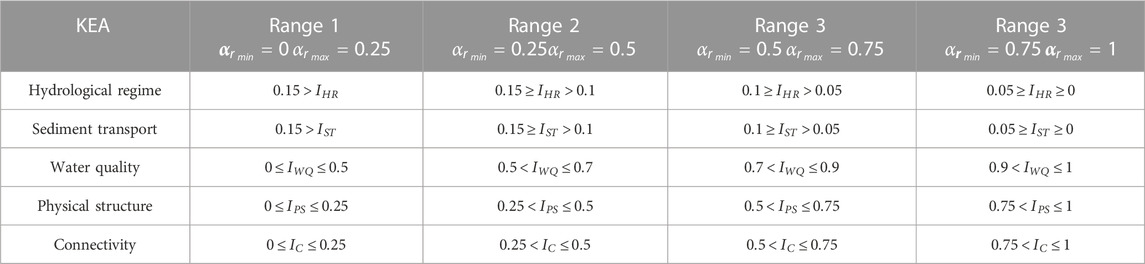
TABLE 6. Scaling ranges of integrity indexes.
The ranges used correspond to integrity index categories: low integrity
3.13 Importance index
We constructed an importance index
For fish, amphibians, reptiles, and waterbirds, we used the normalized values of the rarity-weighted richness index
where
For the remaining conservation values (see Table 7) we constructed a sub-index
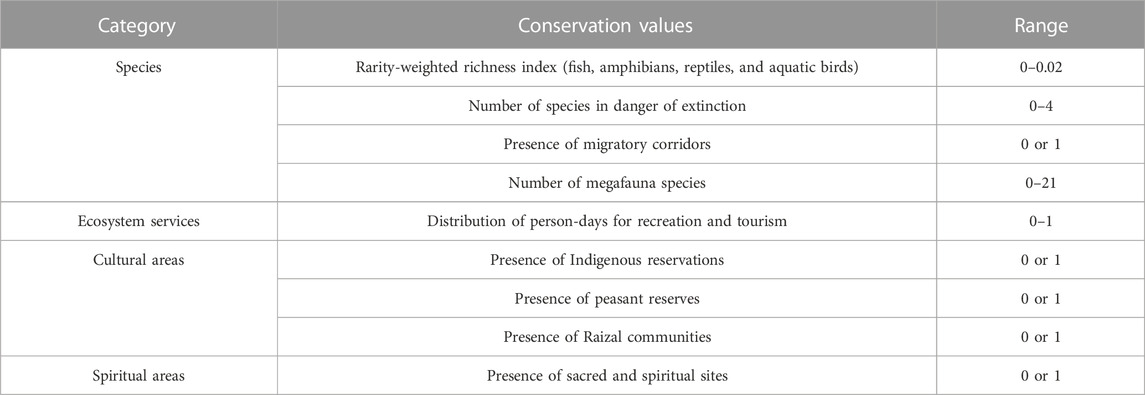
TABLE 7. Conservation values identified for the Caquetá River.
Table 7 summarizes the sub-indices for the selected conservation values in the Caquetá River basin and presents the numerical ranges for each conservation value. Note that all values are scaled from 0 to 1 using the equation above. The Supplementary Material details the calculation of the conservation values sub-indexes.
3.14 Representativeness index
The representativeness index
where
3.15 Complementarity criteria
To ensure complementarity in prioritization, we selected the areas of the natural parks as reported by Parques Nacionales Naturales de Colombia (2020). The Caquetá River basin currently contains 10 conservation areas representing 21% of the total area of the basin (Figure 2).
3.16 Definition of conservation opportunities
We used MATLAB Release 2019b to construct the 2D scatterplot of the Caquetá River basin to identify conservation opportunities. This platform allowed us to analyze and visualize the data and generate graphical outputs.
3.17 Prioritization
We solved the optimization problem for the Caquetá River basin by using the prioritizr package v8.0.2.1 (Hanson et al., 2023) to find an accurate, optimal solution in conjunction with Gurobi solver v10.0, which provides solvers based on integer linear programming. This combination of packages is computationally efficient compared with packages such as Marxan, which generates nearly optimal solutions (Beyer et al., 2016).
4 Results
4.1 Spatial analysis units
Figure 3 presents the spatial units of analysis obtained for the Caquetá River basin. We delineated 30,028 micro-basins and 320 sub-basins for the study area (Figure 3A). Considering the large number of delimited micro-basins, Figure 3 shows example distributions of the micro-basins within the sub-basins of the Mamansoya and Peneya Rivers, located in the middle and upper part of the Caquetá River basin, respectively (see Figure 3B). Approximately 61% of the defined micro-basins are smaller than 5 km2, and only 2.4% are larger than 15 km2 (see Figure 3C).
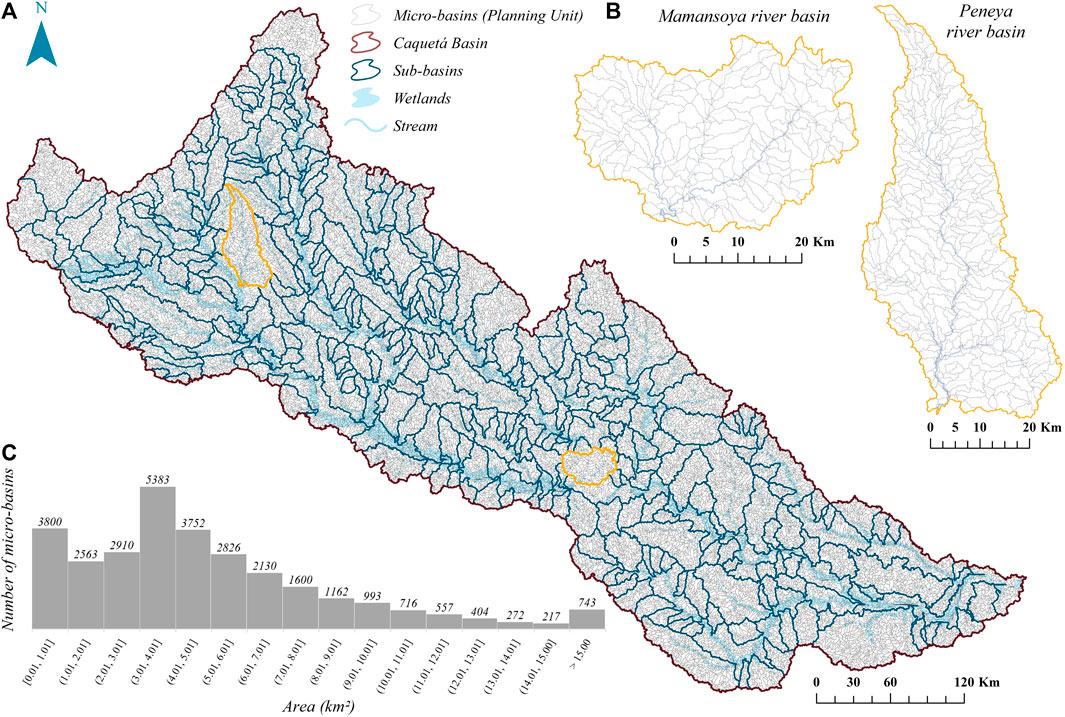
FIGURE 3. Caquetá River basin. (A) Spatial analysis units defined for the Caquetá River basin. (B) Distribution of micro-basins in the sub-basins of the Mansoya and Peneya Rivers. (C) Size frequencies of micro-basins.
4.2 Freshwater groups
We identified 518 freshwater groups with unique ecological characteristics (Figure 4); 28.4% of these are found in large and very large rivers (flow >100 m3/s), and 71.6% are present in medium and small rivers (flow ≤100 m3/s). Thirty percent of the identified groups are in the mountainous zone, which encompasses 11% of the entire Caquetá River basin. We also determined that 70% of the basin is occupied by only 4.2% of the identified freshwater groups.
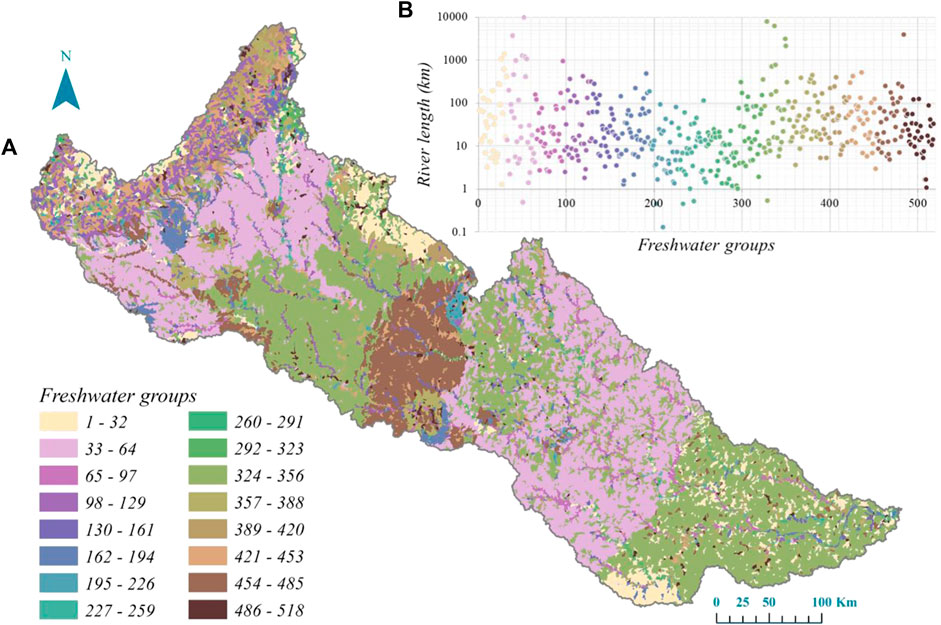
FIGURE 4. (A) Distribution of freshwater groups with unique key ecological attributes in the Caquetá River basin. (B) Length of rivers for freshwater groups.
4.3 Importance index
Figure 5A provides a spatial representation of the importance index in the Caquetá River basin, highlighting that the micro-basins that make up the main waterways were assigned the highest importance values. This is reasonable considering that these tributaries are migratory corridors for approximately 23 species of megafauna, including S. fluviatilis (He et al., 2018; 2021; Caldas et al., 2023), and other important species, such as B. rousseauxii (Córdoba et al., 2013). Moreover, the basin’s structure does not currently contain river network interruptions.
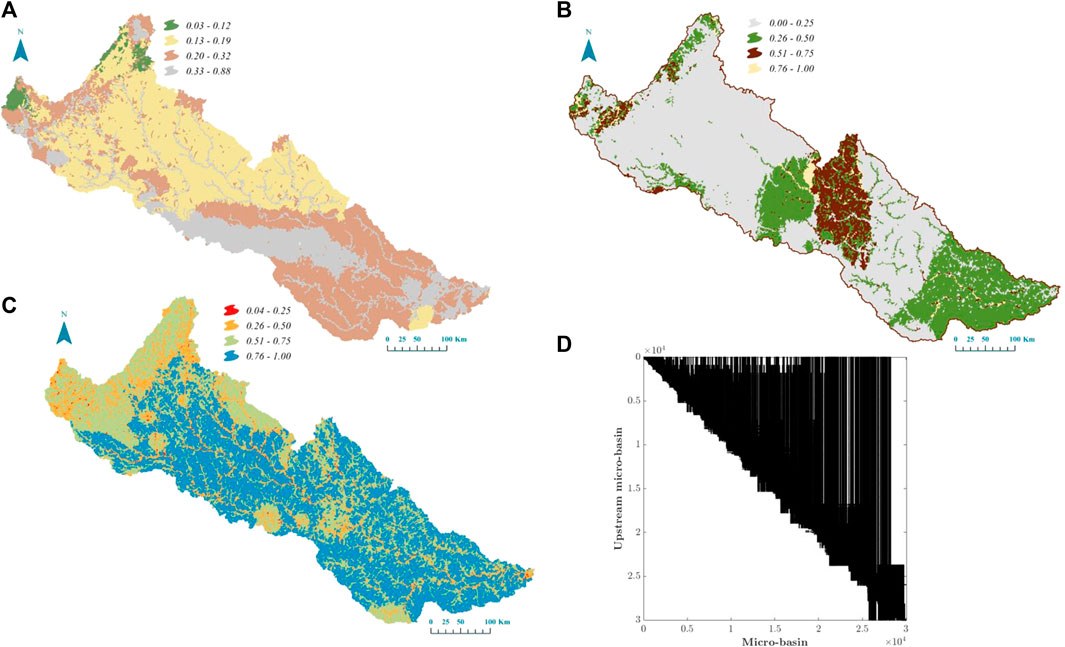
FIGURE 5. (A) Importance index. (B) Representativeness index. (C) Rarity index, and (D) Connectivity index.
High importance was assigned to the middle and lower zones of the Caquetá River basin, given the significant concentration of cultural values stemming from the presence of the Murui-Muinane, Yucuna, Andoque, Inga, and Coreguaje peoples (who occupy 43% of the entire basin area). These ethnic groups maintain a profound connection with the territory, as, in accordance with their worldview, they conceive the world as an entity encompassing the spiritual, material, and social dimensions. Consequently, they regard rivers as vital sources for their communities, providing them with sustenance through artisanal fishing and facilitating transportation within and beyond their territories (The Nature Conservancy and The Amazon Conservation Team, 2019). Additionally, areas of high importance were identified in the Andean region due to species abundance and the high provision of ecosystem-cultural services associated with recreation and tourism activities.
4.4 Representativeness and rarity indexes
We found that 46.7% of the identified freshwater groups in the Caquetá River basin are located within the 10 existing protected areas
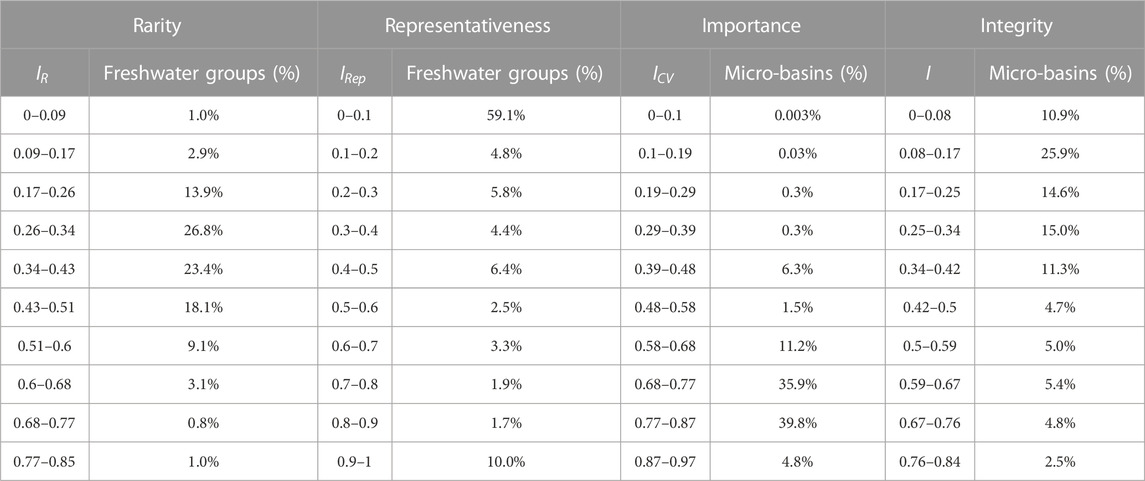
TABLE 8. Frequency distribution of rarity, representativeness, importance, and integrity indexes.
4.5 Connectivity index
Figure 5D illustrates the graphical scheme of the connectivity index for the Caquetá River basin as an adjacency matrix. In this matrix, the asymmetry to the left indicates the direction of the connections between the micro-basins, showing the flow of water and interrelationships from the upper areas (upstream) to the lower areas (downstream).
4.6 Integrity
We found that 5.5% of the micro-basins presented low integrity values, 14.8% showed medium integrity values, 33.7% exhibited a high level of integrity, and 46% had a very high integrity rating (Figure 6A). The lowest integrity values were recorded in the upper part of the Caquetá River, especially in the Orteguaza and Caguán River basins (Figure 6A), which face the highest number of threats to the KEAs. Upon analyzing the integrity in the main channels of these rivers, we observed dispersed behavior with an increasing trend as the accumulated flow increases (Figure 6B), which translates into an increase in integrity downstream. However, in the lower part of the main channel of the Caquetá River, integrity values tend to decrease despite remaining high. Of the sub-basins, 1.7% had low integrity, 16.2% had moderate integrity, 33.4% exhibited high integrity, and 48.7% received a very high integrity rating (Figure 6C).
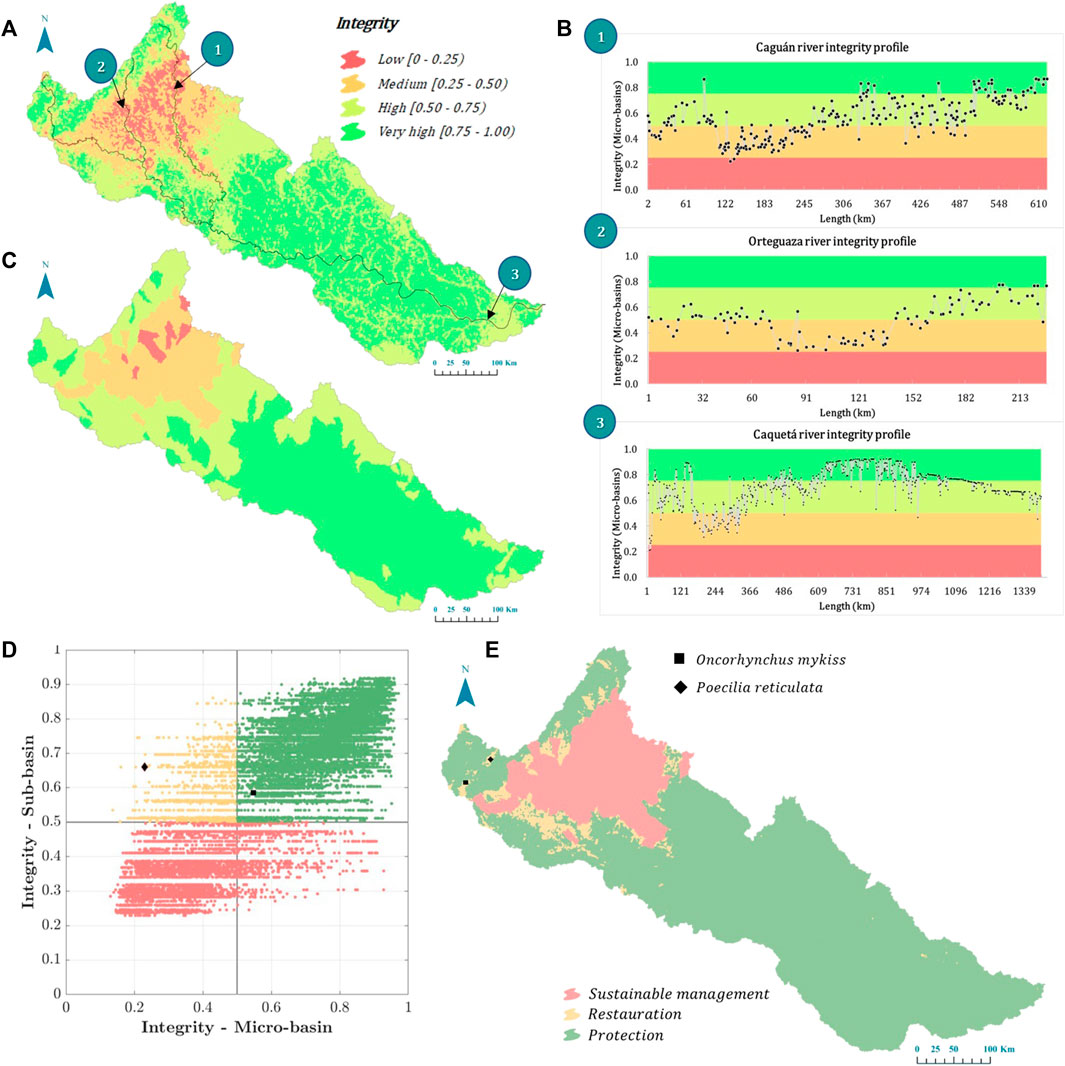
FIGURE 6. (A) Integrity at the micro-basin level. (B) Integrity profile of the Caquetá, Orteguaza, and Caguán Rivers at the micro-basin level, starting from their headwaters. (C) Integrity at the sub-basin level; (D) 2D scatterplot following Riato et al. (2020). (E) Conservation opportunities. The black diamond and square denote the presence of invasive alien species.
4.7 Conservation opportunities
The 2D scatterplot (Figure 6D) showed that the best opportunity to conserve 77.4% of the basins is through protection actions. This action shows a primarily continuous spatial pattern in the middle and lower zones of the basin, whereas the pattern is more scattered in the upper zone. Restoration presents a better opportunity in 4.7% of the basin, specifically in the upper, piedmont, and upper-middle zones. According to the integrity values, sustainable management should be implemented in 17.9% of the basin. The pattern of this action is primarily continuous and is present in the piedmont and upper-middle zones of the basin (Figure 6E). Furthermore, the results reveal that the established protection areas in the basin present the best opportunity for conservation, which we anticipated.
4.8 Prioritized portfolio
The spatial distribution of the prioritized portfolio is mainly concentrated in existing protected areas, specifically in the Serranía de Chiribiquete National Natural Park (Figure 7A), which is consistent with the selected criteria. The prioritized portfolio shows high connectivity between micro-basins, which generates corridors, as well as between existing protected areas. It is noteworthy that the prioritized portfolio includes the Caguán River despite its reduced integrity values in some sections. The portfolio managed to represent 96% of the freshwater groups identified in the large and very large river categories and 74% of the freshwater groups identified in medium and small rivers. According to the defined conservation objective, the prioritized portfolio achieves representation of 80.1% of all the freshwater groups identified in the Caquetá River basin. We found that 91.9% of the prioritized micro-basins present opportunities for conservation through protection, 3% through restoration, and 5.1% through sustainable management (Figure 7B).
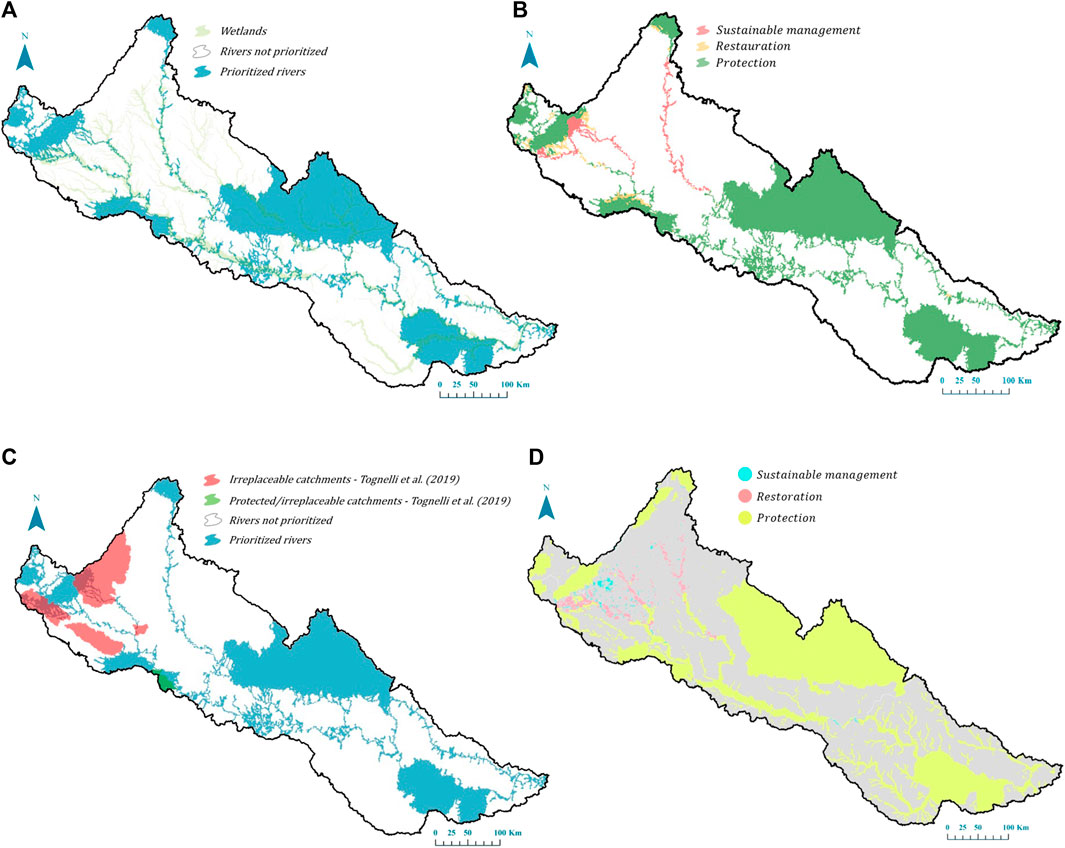
FIGURE 7. (A) Prioritized portfolio for the Caquetá River basin and (B) conservation opportunities for the prioritized areas. (C) Comparison of the prioritized portfolio with the sites identified by Tognelli et al. (2019) and (D) the Essential Life Support Areas in Colombia mapped by Corzo et al. (2021).
5 Discussion
In this study, we present a methodological framework that allows prioritization of freshwater ecosystems (micro-basins) and concurrently identifies the best conservation opportunities. The framework considers six criteria: representativeness, integrity, importance, rarity, complementarity, and connectivity. It is highly flexible in its configuration for each of the mentioned criteria. It has the capability to adapt to the specific characteristics of each region where it is to be applied, including modeling schemes and analytical tools for characterizing key ecological attributes, indexes, conservation values, data provided to establish criteria, and their relative weights.
The proposed framework contributes to improving the conservation strategies of freshwater ecosystems (challenge number 10, according to Olden et al., 2010). This approach goes beyond conventional SCP paradigms that prioritize areas based solely on unique or multiple species presence (Hermoso et al., 2018; Tognelli et al., 2019; Linke and Hermoso, 2022; Nogueira et al., 2023). For instance, the framework allows for the incorporation of critical elements for biodiversity maintenance and persistence, such as ecosystem services and cultural values, emerging as crucial factors to ensure effective long-term conservation (Higgins et al., 2021). The integration of culturally relevant values for communities becomes critically important as it facilitates understanding and acceptance of conservation actions, in addition to enhancing community engagement by ensuring appropriate representation.
As detailed in step 2.17, the prioritization scheme (optimization) was set up so that micro-basins of greater significance (with lower conservation value occurrences) are prioritized first, while those of lesser significance are relegated, regardless of the level of overlap in feature distributions (freshwater groups). This suggests that micro-basins with high ecosystem service provision and a high concentration of cultural values could be prioritized first, even if they have a low biological value. Such an outcome is consistent within our framework since it focuses on freshwater ecosystems and not on a specific species.
Within the framework, it is possible to incorporate a variety of conservation values into the significance criterion. In the specific context of the Caquetá river basin, our consideration encompassed recreation and tourism as cultural ecosystem services. However, this importance index has the potential for expansion to include provisioning, supporting, and regulating ecosystem services; or to cover other forms of cultural values beyond the scope of this study. Nonetheless, depending on the quantity, configuration, and weighting given to conservation values, the spatial distribution of prioritized micro-basins may shift. Yet, considering that cultural and social values are related to areas of biological importance, it would be expected that this variation would not be significant, as evidenced by Whitehead et al. (2014) in terrestrial ecosystems.
Integrating cultural relevant values for communities is essential for enhancing SCP as it facilitates the understanding and acceptance of conservation actions, in addition to bolstering community participation, which in turn increases the likelihood of success of these actions (Geist, 2015; Corrigan et al., 2018; Hoffmann, 2022). Furthermore, incorporating ecosystem services into conservation strategy formulation allows for the design of financial mechanisms grounded in these services (Boulton et al., 2016), such as recreation and tourism. These approaches motivate communities to conserve freshwater ecosystems. The inclusion of these elements not only aids in devising more effective conservation strategies but also establishes robust funding sources that support the long-term protection of ecosystems.
The integration of connectivity in SCP exercises has been highlighted as a key criterion for the conservation of freshwater ecosystems, given their interconnected nature (Hermoso et al., 2011). Consequently, it has been increasingly incorporated into SCP frameworks (Linke and Hermoso, 2022; Nogueira et al., 2023). In our framework, connectivity is addressed not only as a desirable characteristic in the conservation portfolio but also as an attribute for defining freshwater groups and assessing their integrity. This, in turn, impacts the selection of conservation opportunities and the prioritization process.
Another significant aspect of our framework is that representativeness and rarity are properly directed towards freshwater groups, recognizing that KEAs shape and organize the physical habitat and biotic communities of freshwater ecosystems (Poff et al., 1997; Castello et al., 2013; Zeiringer et al., 2018; Higgins et al., 2021). Therefore, our approach aims to prioritize micro-basins with differentiated KEAs (freshwater groups) that are not yet represented in a protected area and are unique within the basin. It also takes into account the pressures to which freshwater groups are exposed through the integrity criterion. Although we favor healthy (high-integrity) ecosystems and those with high conservation values, this does not preclude the selection of areas with low integrity as long as the greatest diversity of freshwater ecosystems is guaranteed, according to the proposed goal. In the case of the Caquetá River, we achieved a high representation of ecosystems with differentiated KEAs in the prioritized portfolio even though the search margin was limited to less than 11% of the area of the micro-basins in the Caquetá basin, considering that 21% of the Caquetá basin is currently under protection.
Our prioritized portfolio results (Figure 7A) in the Andean zone of the upper Caquetá River, upper Orteguaza River basin, and between the mouth of the Orteguaza River and the Caguán River, show agreement with the irreplaceable conservation areas identified by Tognelli et al. (2019) for freshwater fishes in the tropical Andes region of South America, threatened and vulnerable to climate change (Figure 7C). This alignment is attributed to our methodological framework’s primary criterion, emphasizing endemic and threatened fish species. However, disparities are noticeable in specific regions, stemming from Tognelli et al. (2019) utilization of a traditional CPS scheme with Marxan, centered on individual species, while our approach is specifically tailored to freshwater ecosystems. Notably, Tognelli et al. (2019) did not account for rarity, ecosystem services, and cultural values in their assessments.
Furthermore, Tognelli et al. (2019) incorporated Marxan’s Boundary Length Modifier (BLM) to derive interconnected solutions. However, their methodology did not encompass an evaluation of longitudinal connectivity, leaving room for future extensions in research. Consequently, the solution proposed by Tognelli et al. (2019) does not delineate areas forming connected basin corridors, which is a significant distinction from our approach.
Our conservation opportunity results (Figure 7B) are very similar to the Essential Life Support Areas (ELSA) mapped by Corzo et al. (2021) for Colombia following the United Nations Convention on Biological Diversity, Framework Convention on Climate Change, and Sustainable Development Goals (Figure 7D). ELSA identifies regions for conservation, restoration, and sustainable management through land use zoning, leveraging environmental diagnostics and assessments of environmental supply and demand. This methodology involves evaluating anthropogenic pressures affecting the given territory. In our study, we conducted an integrity analysis within our methodological framework, which corresponds to the approach taken by ELSA. However, it is important to note that ELSA incorporates aspects of public policy that are not integrated into our framework, leading to variations in proposed conservation activities across certain regions.
The identification of protected areas has been another focus of SCP analysis (Dorji et al., 2020; Hermoso et al., 2011; Linke & Hermoso). Instead of considering protection as the lone conservation option, our methodology applies the framework of Riato et al. (2020) and assesses the integrity of KEAs according to their threats to generate micro-basin-level spatial guidance regarding which ecosystems should be conserved using protection, restoration, or sustainable management. In the case of the Caquetá River basin, sustainable management and restoration opportunities were identified in sites with land overuse compared with the predominant vocation, e.g., due to productive activities such as livestock and agriculture (Guerrero, 2020). Protection, on the other hand, prevailed in some areas of the basin lacking strong anthropic pressures.
In certain regions, mercury contamination is a growing threat due to illegal gold mining (Matapí, 2015; Instituto Amazónico de Investigaciones Científicas, 2022b), which, in the future, could change the patterns of conservation opportunities for restoration, especially in the Caquetá River’s main channel. This result is consistent with the findings of Corzo et al. (2021), who analyzed 100 geographic layers from 18 different institutions to identify conservation opportunities. Thus, a simple approach, such as that used by Riato et al. (2020) can i) allow conservation managers to determine specific actions according to each ecosystem’s threats and capacity to support such actions (Riato et al., 2020; 2023) and ii) guide detailed exercises for resource allocation, as in Cattarino et al. (2015) and Mu et al. (2022).
Using an index-based approach, our proposal can link additional criteria to those presented in this research. Moreover, we have identified an opportunity for improvement in our methodology: we can include a KEA that specifically addresses biotic interactions and thus develop an index that adequately captures these processes. This will allow us to broaden the understanding of ecological and biological aspects within our approach, providing a more complete view of freshwater systems and how to conserve them. These interactions are crucial for maintaining natural diversity and ecological processes and understanding the dynamics of the distribution and abundance of freshwater species, especially in the presence of exotic invasive species that pose a threat to aquatic ecosystems (Castello et al., 2013; Zeiringer et al., 2018).
A recent study by Nogueira et al. (2023) demonstrated that relying solely on species presence data may be insufficient to address ecological needs. The presence of two invasive exotic species, Oncorhynchus mykiss (rainbow trout) and Poecilia reticulata (guppy), has been recorded in the Villalobos and Mocoa Rivers, located in the upper part of the Caquetá River basin. These invasive species are found in micro-basins where we identified restoration and protection as the best conservation opportunities (Figure 6). The presence of these species has significant implications for restoration processes, from both ecological and social perspectives. Actions such as eradication and control can involve the community capturing and consuming these species, generating social, economic, and environmental benefits. We, therefore, advise incorporating an index that highlights biotic interactions, thus expanding the specific measures related to these interactions.
There are multiple challenges involved in the implementation of the Convention on Biological Diversity (Chandra and Idrisova, 2011), especially for the 30 × 30 target, including Indigenous issues or the increasing degradation rate of ecosystem services (Chandra and Idrisova, 2011). According to the analyses conducted by Moreno et al. (2020), Indigenous reserves are vulnerable to ecosystem degradation processes. In the case of the Caquetá River basin, 43% of the basin’s area corresponds to Indigenous reserves (Agencia Nacional de Tierras, 2023), and our results show that these areas are good candidates for conservation. Promoting environmental governance in Indigenous reserves is fundamental to reducing biodiversity loss in the Amazon (Moreno et al., 2020). This highlights the importance of our contribution, as our methodology considers Indigenous communities and their cultural values. This step forward will allow for the development and long-term sustainability of conservation strategies, especially in Amazonian basins, such as the Caquetá River, where Indigenous communities have an important presence.
6 Conclusion
In this study, we present a methodological scheme of SCP for freshwater ecosystems that simultaneously answers the questions of where and how to conserve. Our framework considers basins as planning units; incorporates integrity from the perspective of the functional characteristics of the ecosystem as a criterion for prioritization and selection of conservation opportunities; assesses the impact of threats to ecosystems; includes species, ecosystem services, and cultural and spiritual values as conservation values; considers existing conservation efforts; and recognizes the unique components and connectivity of freshwater ecosystems.
The proposed framework provides a pertinent technical instrument for optimizing the interventions of conservation organizations and, in turn, assisting Colombia in achieving its 30 × 30 target set by the Convention on Biological Diversity. By identifying priority freshwater ecosystems in the Caquetá River basin, we offer a tangible foundation upon which future decisive conservation actions in the Colombia can be based. Although our framework suggests an integrative capacity at the national level, it is crucial that subsequent research strengthens and broadens these findings. In summary, the defined methodological framework stands as an essential tool for decision-making regarding conservation, especially when considering ethnocultural territorial contexts.
The research community must continue to generate methodological frameworks in which SCP exercises of freshwater ecosystems incorporate conservation actions into the portfolios. We also encourage researchers to further strengthen our proposed methodological framework by analyzing how KEAs and biotic structure/composition respond to threats while also constructing and incorporating new KEAs, conservation values, and indexes that capture synergistic components at local scales and cumulative impacts at the basin level. In addition, we believe that our framework can be adapted to other geographies and scales of analysis, so we encourage future studies to corroborate this.
Data availability statement
The original contributions presented in the study are included in the article/supplementary material, further inquiries can be directed to the corresponding author.
Author contributions
JN: Conceptualization, Data curation, Methodology, Writing–original draft, Writing–review and editing. CR-P: Conceptualization, Methodology, Writing–review and editing. MC: Data curation, Writing–review and editing. AV-L: Methodology, Writing–review and editing.
Funding
The author(s) declare financial support was received for the research, authorship, and/or publication of this article. This work was supported by the Elevating Impact Fund of The Nature Conservancy.
Acknowledgments
The authors would like to extend their thanks to all the researchers who provided constructive comments that improved this paper, especially OPIAC, Paulo Petry, Tomas Walschburger, Juliana Delgado, Jaime Burbano, and the Community-Based Conservation and Integrated Water Resource Management team of The Nature Conservancy, for their contributions to and support of this research.
Conflict of interest
The authors declare that the research was conducted in the absence of any commercial or financial relationships that could be construed as a potential conflict of interest.
Publisher’s note
All claims expressed in this article are solely those of the authors and do not necessarily represent those of their affiliated organizations, or those of the publisher, the editors and the reviewers. Any product that may be evaluated in this article, or claim that may be made by its manufacturer, is not guaranteed or endorsed by the publisher.
References
Abell, R., Thieme, M., Ricketts, T. H., Olwero, N., Ng, R., Petry, P., et al. (2011). Concordance of freshwater and terrestrial biodiversity. Conserv. Lett. 4, 127–136. doi:10.1111/j.1755-263X.2010.00153.x
Agencia Nacional de Hidrocarburos (2022). Pozos petroleros. Agencia Nac. Tierras. Available at: https://geovisor.anh.gov.co/tierras/(Accessed May 10, 2022).
Agencia Nacional de Tierras, (2023). Zonas de reservas campesinas, Resguardos Indigenas y consejos comunitarios. Agencia Nac. Tierras. Available at: https://data-agenciadetierras.opendata.arcgis.com/(Accessed February 1, 2023).
Akhtar, N., Ishak, M. I. S., Ahmad, M. I., Umar, K., Md Yusuff, M. S., Anees, M. T., et al. (2021). Modification of the water quality index (wqi) process for simple calculation using the multi-criteria decision-making (mcdm) method: a review. Water (Basel) 13, 905. doi:10.3390/w13070905
Albert, J. S., Carvalho, T. P., Petry, P., Holder, M. A., Maxime, E. L., Espino, J., et al. (2011). Aquatic biodiversity in the Amazon: habitat specialization and geographic isolation promote species richness. Animals 1, 205–241. doi:10.3390/ani1020205
Alho, C. J. R., Reis, R. E., and Aquino, P. P. U. (2015). Amazonian freshwater habitats experiencing environmental and socioeconomic threats affecting subsistence fisheries. Ambio 44, 412–425. doi:10.1007/s13280-014-0610-z
Almazroui, M., Ashfaq, M., Islam, M. N., Rashid, I. U., Kamil, S., Abid, M. A., et al. (2021). Assessment of CMIP6 performance and projected temperature and precipitation changes over South America. Earth Syst. Environ. 5, 155–183. doi:10.1007/s41748-021-00233-6
Anache, J. A. A., Bacchi, C. G. V., Panachuki, E., and Sobrinho, T. A. (2015). Assessment of methods for predicting soil erodibility in soil loss modeling. Geosciences= Geociências 34, 32–40. Available at: https://dialnet.unirioja.es/servlet/articulo?codigo=7861376 (Accessed August 29, 2022)
Anderson, E. P., Jenkins, C. N., Heilpern, S., Maldonado-Ocampo, J. A., Carvajal-Vallejos, F. M., Encalada, A. C., et al. (2018). Fragmentation of Andes-to-Amazon connectivity by hydropower dams. Sci. Adv. 4, eaao1642. doi:10.1126/sciadv.aao1642
Anshuman, A., Kunnath-Poovakka, A., and Eldho, T. I. (2019). Towards the use of conceptual models for water resource assessment in Indian tropical watersheds under monsoon-driven climatic conditions. Environ. Earth Sci. 78, 282. doi:10.1007/s12665-019-8281-5
Armida, O. (2007). Diagnóstico nacional de la calidad sanitaria de las aguas superficiales de El Salvador. Available at: http://rcc.marn.gob.sv/handle/123456789/163 (Accessed November 9, 2022).
Arthington, A. H. (2021). Grand challenges to support the freshwater biodiversity emergency recovery plan. Front. Environ. Sci. 9. doi:10.3389/fenvs.2021.664313
Arthington, A. H., Dulvy, N. K., Gladstone, W., and Winfield, I. J. (2016). Fish conservation in freshwater and marine realms: status, threats and management. Aquat. Conserv. 26, 838–857. doi:10.1002/aqc.2712
Beechie, T. J., Liermann, M., Pollock, M. M., Baker, S., and Davies, J. (2006). Channel pattern and river-floodplain dynamics in forested mountain river systems. Geomorphology 78, 124–141. doi:10.1016/j.geomorph.2006.01.030
Beyer, H. L., Dujardin, Y., Watts, M. E., and Possingham, H. P. (2016). Solving conservation planning problems with integer linear programming. Ecol. Modell. 328, 14–22. doi:10.1016/j.ecolmodel.2016.02.005
Boulton, A. J., Ekebom, J., and Gíslason, G. már (2016). Integrating ecosystem services into conservation strategies for freshwater and marine habitats: a review. Aquat. Conserv. 26, 963–985. doi:10.1002/aqc.2703
Boulton, C. A., Lenton, T. M., and Boers, N. (2022). Pronounced loss of Amazon rainforest resilience since the early 2000s. Nat. Clim. Chang. 12, 271–278. doi:10.1038/s41558-022-01287-8
Bsfp, (2018). The British survey of fertiliser practice: Fertiliser use on farm crops for crop year 2017. Food and Rural Affairs: Department for Environment.
Buffington, J. M., and Montgomery, D. R. (2022). “Geomorphic classification of rivers: an updated review,” in Treatise on geomorphology (Elsevier), 1143–1190. doi:10.1016/B978-0-12-818234-5.00077-8
Burbano-Girón, J., Molina Berbeo, M. A., Gutierrez Montoya, C., Ochoa-Quintero, J. M., Ayazo Toscano, R. A., and Cardona Hernández, D. (2020). “Estado de conservación y transformación de los humedales en Colombia,” in Biodiversidad 2020 Estado y tendencias de la biodiverisdad continental de Colombia.
Caldas, B., Thieme, M. L., Shahbol, N., Coelho, M. E., Grill, G., Van Damme, P. A., et al. (2023). Identifying the current and future status of freshwater connectivity corridors in the Amazon Basin. Conserv. Sci. Pract. 5. doi:10.1111/csp2.12853
Campodónico, H., Chinchay, A., Avilés, M., Valcárcel, D., Chinchay, A., Avilés, M., et al. (2006). Tipos de ambientes acuáticos en la Amazonía peruana. Revista Folia amazónica-Instituto de investigación de la Amazon\’\ia Peruana, 134–135.
Campos-Silva, J. V., and Peres, C. A. (2016). Community-based management induces rapid recovery of a high-value tropical freshwater fishery. Sci. Rep. 6, 34745. doi:10.1038/srep34745
Carlos, A. M., Giovene, P. C., and María, P. C. (2023). Hydrological modeling for daily step flood forecasts with a semi distributed approach using the GR4J model - camaná River Basin – arequipa. Civ. Eng. Archit. 11, 1137–1145. doi:10.13189/cea.2023.110303
Carvajal, L., and Roldán, E. (2007). Calibración del modelo lluvia-escorrentia agregado GR4J aplicación: cuenca del río Aburrá. Año 74, 73–87. Available at: http://www.scielo.org.co/pdf/dyna/v74n152/a07v74n152.pdf (Accessed May 29, 2023).
Castello, L., McGrath, D. G., Hess, L. L., Coe, M. T., Lefebvre, P. A., Petry, P., et al. (2013). The vulnerability of Amazon freshwater ecosystems. Conserv. Lett. 6, 217–229. doi:10.1111/conl.12008
Cattarino, L., Hermoso, V., Carwardine, J., Kennard, M. J., and Linke, S. (2015). Multi-action planning for threat management: a novel approach for the spatial prioritization of conservation actions. PLoS One 10, e0128027. doi:10.1371/journal.pone.0128027
Celis-Granada, M. S., Correa-Guarnizo, L. M., Velasquez-Valencia, A., Ossa-Calderón, D., and Chala-Velásquez, Y. (2022). Peces del complejo lagunar Peregrinos, río Caquetá, municipio de Solano, Caquetá, Colombia. Rev. Acad. Colomb. Cienc. Exactas Fis. Nat. 46, 460–469. doi:10.18257/raccefyn.1596
Chandra, A., and Idrisova, A. (2011). Convention on Biological Diversity: a review of national challenges and opportunities for implementation. Biodivers. Conserv. 20, 3295–3316. doi:10.1007/s10531-011-0141-x
Córdoba, E. A., León, Á. V. J., Bonilla-Castillo, C. A., Petrere Junior, M., Peláez, M., and Duponchelle, F. (2013). Breeding, growth and exploitation of brachyplatystoma rousseauxii castelnau, 1855 in the caqueta river, Colombia. Neotropical Ichthyol. 11, 637–647. doi:10.1590/S1679-62252013000300017
Correa-Caselles, D. (2022). Metodología para la estimación del destino y transporte de mercurio presente en los ríos de Colombia. Available at: https://repositorio.uniandes.edu.co/handle/1992/54564 (Accessed November 30, 2022).
Corrigan, C., Bingham, H., Shi, Y., Lewis, E., Chauvenet, A., and Kingston, N. (2018). Quantifying the contribution to biodiversity conservation of protected areas governed by indigenous peoples and local communities. Biol. Conserv. 227, 403–412. doi:10.1016/j.biocon.2018.09.007
Corzo, L., Rodríguez-Buriticá, S., Ochoa, D., Batista, M. F., Fonseca, C., Marigo, M., et al. (2021). “Mapeo de áreas esenciales para el soporte de la vida-ELSA-en Colombia,” in Biodiversidad 2020 Estado y tendencias de la biodiversidad continental de Colombia.
Cote, D., Kehler, D. G., Bourne, C., and Wiersma, Y. F. (2009). A new measure of longitudinal connectivity for stream networks. Landsc. Ecol. 24, 101–113. doi:10.1007/s10980-008-9283-y
Darwall, W. R. T., Holland, R. A., Smith, K. G., Allen, D., Brooks, E. G. E., Katarya, V., et al. (2011). Implications of bias in conservation research and investment for freshwater species. Conserv. Lett. 4, 474–482. doi:10.1111/j.1755-263X.2011.00202.x
Departamento Administrativo Nacional de Estadística (2018). Censo Nacional de Población y Vivienda 2018. DANE. Available at: https://www.dane.gov.co/index.php/estadisticas-por-tema/demografia-y-poblacion/censo-nacional-de-poblacion-y-vivenda-2018 (Accessed August 17, 2022).
Desforges, J. E., Clarke, J., Harmsen, E. J., Jardine, A. M., Robichaud, J. A., Serré, S., et al. (2022). The alarming state of freshwater biodiversity in Canada. Can. J. Fish. Aquatic Sci. 79, 352–365. doi:10.1139/cjfas-2021-0073
Diaz, F. A., Katz, L. E., and Lawler, D. F. (2020). Mercury pollution in Colombia: challenges to reduce the use of mercury in artisanal and small-scale gold mining in the light of the Minamata Convention. Water Int. 45, 730–745. doi:10.1080/02508060.2020.1845936
Di Marco, M., Chapman, S., Althor, G., Kearney, S., Besancon, C., Butt, N., et al. (2017). Changing trends and persisting biases in three decades of conservation science. Glob. Ecol. Conserv. 10, 32–42. doi:10.1016/j.gecco.2017.01.008
Dorji, T., Linke, S., and Sheldon, F. (2020). Freshwater conservation planning in the context of nature needs half and protected area dynamism in Bhutan. Biol. Conserv. 251, 108785. doi:10.1016/j.biocon.2020.108785
Duarte, I., Rego, F. C., Casquilho, J. P., and Arsénio, P. (2016). A relevance index for the habitat areas of natura 2000 network based on their rarity and representativeness. Ecol. Indic. 61, 202–213. doi:10.1016/j.ecolind.2015.09.015
Dudgeon, D. (2014). “Threats to freshwater biodiversity in a changing world,” in Global environmental change (Dordrecht: Springer Netherlands), 243–253. doi:10.1007/978-94-007-5784-4_108
Einheuser, M. D., Nejadhashemi, A. P., Wang, L., Sowa, S. P., and Woznicki, S. A. (2013). Linking biological integrity and watershed models to assess the impacts of historical land use and climate changes on stream health. Environ. Manage 51, 1147–1163. doi:10.1007/s00267-013-0043-7
Engelund, F., and Hansen, E. (1967). A monograph on sediment transport in alluvial streams. Technical University of Denmark 0stervoldgade 10, Copenhagen K. Available at: https://repository.tudelft.nl/islandora/object/uuid:81101b08-04b5-4082-9121-861949c336c9?collection=research (Accessed July 31, 2022).
Fa, J. E., Watson, J. E., Leiper, I., Potapov, P., Evans, T. D., Burgess, N. D., et al. (2020). Importance of indigenous peoples’ lands for the conservation of intact forest landscapes. Front. Ecol. Environ. 18, 135–140. doi:10.1002/fee.2148
Flores, A. N., Bledsoe, B. P., Cuhaciyan, C. O., and Wohl, E. E. (2006). Channel-reach morphology dependence on energy, scale, and hydroclimatic processes with implications for prediction using geospatial data. Water Resour. Res. 42. doi:10.1029/2005WR004226
Flotemersch, J. E., Leibowitz, S. G., Hill, R. A., Stoddard, J. L., Thoms, M. C., and Tharme, R. E. (2016). A watershed integrity definition and assessment approach to support strategic management of watersheds. River Res. Appl. 32, 1654–1671. doi:10.1002/rra.2978
Gallant, J. C., and Dowling, T. I. (2003). A multiresolution index of valley bottom flatness for mapping depositional areas. Water Resour. Res. 39. doi:10.1029/2002WR001426
Garcia-Moreno, J., Harrison, I. J., Dudgeon, D., Clausnitzer, V., Darwall, W., Farrell, T., et al. (2014). “Sustaining freshwater biodiversity in the anthropocene,” in The global water system in the anthropocene (Cham: Springer International Publishing), 247–270. doi:10.1007/978-3-319-07548-8_17
Garnett, S. T., Burgess, N. D., Fa, J. E., Fernández-Llamazares, Á., Molnár, Z., Robinson, C. J., et al. (2018). A spatial overview of the global importance of Indigenous lands for conservation. Nat. Sustain 1, 369–374. doi:10.1038/s41893-018-0100-6
Geist, J. (2015). Seven steps towards improving freshwater conservation. Aquat. Conserv. 25, 447–453. doi:10.1002/aqc.2576
Giri, S., Zhang, Z., Krasnuk, D., and Lathrop, R. G. (2019). Evaluating the impact of land uses on stream integrity using machine learning algorithms. Sci. Total Environ. 696, 133858. doi:10.1016/j.scitotenv.2019.133858
Gnann, S. J., Coxon, G., Woods, R. A., Howden, N. J. K., and McMillan, H. K. (2021). TOSSH: a toolbox for streamflow signatures in hydrology. Environ. Model. Softw. 138, 104983. doi:10.1016/j.envsoft.2021.104983
Grill, G., Lehner, B., Thieme, M., Geenen, B., Tickner, D., Antonelli, F., et al. (2019). Mapping the world’s free-flowing rivers. Nature 569, 215–221. doi:10.1038/s41586-019-1111-9
Grubbs, F. E. (1950). Sample criteria for testing outlying observations. Ann. Math. Statistics 21, 27–58. doi:10.1214/aoms/1177729885
Guerrero, M. (2020). El conflicto por el uso de la tierra en Colombia como precursor del aumento de su degradación. Available at: https://repository.unimilitar.edu.co/bitstream/handle/10654/37298/GuerreroRiveraMariaAlejandra2020.pdf?sequence=1&isAllowed=y (Accessed March 3, 2023).
Gupta, R., Bhattarai, R., and Mishra, A. (2019). Development of climate data bias corrector (CDBC) tool and its application over the agro-ecological zones of India. Water (Basel) 11, 1102. doi:10.3390/w11051102
Hanson, J., Schuster, R., Morrell, N., Strimas-Mackey, M., Edwards, B., Watts, M., et al. (2023). Prioritizr: systematic conservation prioritization in R. Available at: https://prioritizr.net, https://github.com/prioritizr/prioritizr. [Accessed April 3, 2023].
Harrison, I., Abell, R., Darwall, W., Thieme, M. L., Tickner, D., and Timboe, I. (2018). The freshwater biodiversity crisis. Sci. (1979) 362, 1369. doi:10.1126/science.aav9242
Hayakawa, Y. S., and Oguchi, T. (2006). DEM-based identification of fluvial knickzones and its application to Japanese mountain rivers. Geomorphology 78, 90–106. doi:10.1016/j.geomorph.2006.01.018
He, F., Bremerich, V., Zarfl, C., Geldmann, J., Langhans, S. D., David, J. N. W., et al. (2018). Freshwater megafauna diversity: patterns, status and threats. Divers Distrib. 24, 1395–1404. doi:10.1111/ddi.12780
He, F., Langhans, S. D., Zarfl, C., Wanke, R., Tockner, K., and Jähnig, S. C. (2021). Combined effects of life-history traits and human impact on extinction risk of freshwater megafauna. Conserv. Biol. 35, 643–653. doi:10.1111/cobi.13590
Hengl, T., Mendes de Jesus, J., Heuvelink, G. B. M., Ruiperez Gonzalez, M., Kilibarda, M., Blagotić, A., et al. (2017). SoilGrids250m: global gridded soil information based on machine learning. PLoS One 12, e0169748. doi:10.1371/journal.pone.0169748
Heras-Sierra, T., Enríquez-Verdugo, I., Rubio, Ja., Anne-Marie, P., and Barajas-Cruz, R. (2016). Comportamiento de Escherichia coli en heces de vacas adicionadas con taninos hidrolizables. Abanico Veterinario 6. doi:10.21929/abavet2016.63.4
Hermoso, V., Filipe, A. F., Segurado, P., and Beja, P. (2018). Freshwater conservation in a fragmented world: dealing with barriers in a systematic planning framework. Aquat. Conserv. 28, 17–25. doi:10.1002/aqc.2826
Hermoso, V., Linke, S., Preda, J., and Possinghan, H. P. (2011). Addressing longitudinal connectivity in the systematic conservation planning of fresh waters. Freshw. Biol. 56, 57–70. doi:10.1111/j.1365-2427.2009.02390.x
Herrera-Pérez, J., Parra, J. L., Restrepo-Santamaría, D., and Jiménez-Segura, L. F. (2019). The influence of abiotic environment and connectivity on the distribution of diversity in an andean fish fluvial network. Front. Environ. Sci. 7. doi:10.3389/fenvs.2019.00009
Higgins, J., Zablocki, J., Newsock, A., Krolopp, A., Tabas, P., and Salama, M. (2021). Durable freshwater protection: a framework for establishing and maintaining long-term protection for freshwater ecosystems and the values they sustain. Sustainability 13, 1950. doi:10.3390/su13041950
Hoffmann, S. (2022). Challenges and opportunities of area-based conservation in reaching biodiversity and sustainability goals. Biodivers. Conserv. 31, 325–352. doi:10.1007/s10531-021-02340-2
Howard, J. K., Fesenmyer, K. A., Grantham, T. E., Viers, J. H., Ode, P. R., Moyle, P. B., et al. (2018). A freshwater conservation blueprint for California: prioritizing watersheds for freshwater biodiversity. Freshw. Sci. 37, 417–431. doi:10.1086/697996
ICA (2021). Censos pecuarios nacional - censo de Bovinos 2021. Inst. Colomb. Agropecu. Available at: https://www.ica.gov.co/areas/pecuaria/servicios/epidemiologia-veterinaria/censos-2016/censo-2018 (Accessed August 7, 2022).
IDEAM (2019). Estudio Nacional del Agua 2018. Bogotá Available at: https://www.andi.com.co/Uploads/ENA_2018-comprimido.pdf (Accessed October 9, 2022).
IGAC (2022). Cartografía base escala 1:100.000. Available at: https://www.colombiaenmapas.gov.co/?e=-82.43784778320864,-0.17644239911865092,-71.23179309571162,9.90326984502256,4686&b=igac&u=0&t=23&servicio=205 (Accessed October 9, 2022).
Iglesias-Martínez, L. (1994). El estiércol y las prácticas agrarias respetuosas con el medio ambiente. Ministerio de Agricultura, Pesca y Alimentación, Madrid (España). Available at: https://www.mapa.gob.es/ministerio/pags/biblioteca/hojas/hd_1994_01.pdf (Accessed August 7, 2022).
Instituto Amazónico de Investigaciones Científicas (2020). Escala 1:100.000 - 2002 - 2020. Available at: https://datos.siatac.co/pages/coberturas (Accessed May 22, 2022).Capa consolidada multitemporal de degradación de bosque de la Amazonia colombiana
Instituto Amazónico de Investigaciones Científicas (2021). Coberturas de la Tierra del año 2020 de la Región de la Amazonia escala 1:100.000. Available at: https://sinchi.maps.arcgis.com/home/item.html?id=054930af104f427398cddb7d0d676a86# (Accessed October 9, 2022).
Instituto Amazónico de Investigaciones Científicas (2022a). Cicatrices de quema por región (Histórico). Escala: 1:100.000. Available at: https://datos.siatac.co/datasets/cicatrices-de-quema-por-regi%C3%B3n-hist%C3%B3rico-escala-1100-000/explore (Accessed May 22, 2023).
Instituto Amazónico de Investigaciones Científicas (2022b). Contaminación por mercurio río Caquetá, comunidades Bora y Miraña. Bogotá D.C.
Instituto de Hidrología Meteorología y Estudios Ambientales (2010). Estudio Nacional del Agua 2010. Bogotá D.C: ideam 420. Available at: https://www.andi.com.co/Uploads/ENA_2010.compressed.pdf (Accessed July 13, 2022).
Instituto Geográfico Agustín Codazzi (2022). Cartografía Base Escala 1:100.000. Available at: https://www.colombiaenmapas.gov.co/?e=-82.43784778320864,-0.17644239911865092,-71.23179309571162,9.90326984502256,4686&b=igac&u=0&t=23&servicio=205 (Accessed October 9, 2022).
Jackson-Blake, L. A., Wade, A. J., Futter, M. N., Butterfield, D., Couture, R.-M., Cox, B. A., et al. (2016). The INtegrated CAtchment model of phosphorus dynamics (INCA-P): description and demonstration of new model structure and equations. Environ. Model. Softw. 83, 356–386. doi:10.1016/j.envsoft.2016.05.022
Janishevski, L., Santamaria, C., Gidda, S., Cooper, H., and Brancalion, P. (2015). Ecosystem restoration, protected areas and biodiversity conservation. Unasylva 245, 19–28. Available at:. https://esalqlastrop.com.br/img/publicacoes/CBD%20Unasylva.pdf. (Accessed. February. 23. 2023).
Jarvis, A., Reuter, H. I., Nelson, A., and Guevara, E. (2008). Hole-filled SRTM for the globe version 4.CGIAR-CSI SRTM 90 m database. https://srtm.csi.cgiar.org.
Juwana, I., Muttil, N., and Perera, B. J. C. (2012). Indicator-based water sustainability assessment — a review. Sci. Total Environ. 438, 357–371. doi:10.1016/j.scitotenv.2012.08.093
Killeen, T. J., and Solórzano, L. A. (2008). Conservation strategies to mitigate impacts from climate change in Amazonia. Philosophical Trans. R. Soc. B Biol. Sci. 363, 1881–1888. doi:10.1098/rstb.2007.0018
Kukkala, A. S., and Moilanen, A. (2013). Core concepts of spatial prioritisation in systematic conservation planning. Biol. Rev. 88, 443–464. doi:10.1111/brv.12008
Lees, M. J., Camacho, L., and Whitehead, P. (1998). Extension of the QUASAR river water quality model to incorporate dead-zone mixing. Hydrol. Earth Syst. Sci. 2, 353–365. doi:10.5194/hess-2-353-1998
Linke, S., and Hermoso, V. (2022). “Biodiversity conservation of aquatic ecosystems,” in Encyclopedia of inland waters (Elsevier), 641–652. doi:10.1016/B978-0-12-819166-8.00202-4
Linke, S., Turak, E., and Nel, J. (2011). Freshwater conservation planning: the case for systematic approaches. Freshw. Biol. 56, 6–20. doi:10.1111/j.1365-2427.2010.02456.x
MADS (2015). Resolución 631 de 2015 - por la cual se establecen los parámetros y los valores límites máximos permisibles en los vertimientos puntuales a cuerpos de aguas superficiales y a los sistemas de alcantarillado público y se dictan otras disposiciones. Minist. Ambiente Desarro. Sosten. Available at: http://www.emserchia.gov.co/PDF/Resolucion631.pdf (Accessed June 10, 2022).
Mamani, J. A. (2022). Desarrollo de un modelo numérico de calidad del agua en un marco probabilístico de soporte a las decisiones a escala nacional. Available at: https://repositorio.uniandes.edu.co/handle/1992/60182 (Accessed November 30, 2022).
Matapí, D. (2015). La minería en el medio río Caquetá. Rev. Colomb. Amaz. 8, 153–161. Available at:. https://www.sinchi.org.co/files/publicaciones/revista/pdf/8/8%20la%20minera%20en%20el%20medio%20ro%20caquet.pdf. (Accessed. March. 3. 2023).
McMillan, H. (2020). Linking hydrologic signatures to hydrologic processes: a review. Hydrol. Process 34, 1393–1409. doi:10.1002/hyp.13632
McMillan, H. K. (2021). A review of hydrologic signatures and their applications. WIREs Water 8. doi:10.1002/wat2.1499
Ministerio de Ambiente Desarrollo Sostenible (2021). Humedal versión 2 (versión histórica). Minist. Medioambiente Desarro. Sosten. Available at: https://siac-datosabiertos-mads.hub.arcgis.com/datasets/a499da66b2814db48888343283b57cdb/about (Accessed October 9, 2022).
Ministerio de Salud y Protección Social, and Ministerio de Ambiente y Desarrollo Sostenible (2007). Por medio de la cual se señalan características, instrumentos básicos y frecuencias del sistema de control y vigilancia para la calidad del agua para consumo humano. Colombia, Bogotá D.C. Available at: https://scj.gov.co/sites/default/files/marco-legal/Res_2115_de_2007.pdf (Accessed February 27, 2023).
Moreno, L. A., Andrade, G. I., Didier, G., and Hernández-Manrique, O. L. (2020). “Biodiversidad 2020 Estado y tendencias de la biodiversidad continental de Colombia,”Instituto de Investigación de Recursos Biológicos Alexander von Humboldt.
Mu, Y., Guo, Y., Li, X., Li, P., Bai, J., Linke, S., et al. (2022). Cost-effective integrated conservation and restoration priorities by trading off multiple ecosystem services. J. Environ. Manage 320, 115915. doi:10.1016/j.jenvman.2022.115915
MVCT (2017). Resolución 0330 - "Por la cual se adopta el reglamento Ténico para el Sector de Agua Potable y Saneamiento Básico - RAS y se derogan las resoluciones 1096 de 2000, 0424 de 2001, 0668 de 2003, 1459 de 2005. Bogotá. 1447 de 2005 y 2320 de 2009.
Nash, J. E., and Sutcliffe, J. V. (1970). River flow forecasting through conceptual models part I — a discussion of principles. J. Hydrol. (Amst) 10, 282–290. doi:10.1016/0022-1694(70)90255-6
Natural Capital Project (2022). InVEST 3.13.0.post6+ug.g6b07b42 User’s Guide. Available at: http://releases.naturalcapitalproject.org/invest-userguide/latest/en/index.html (Accessed October 9, 2022).
Navas, A. (2016). Factores de asimilación de carga contaminante en ríos - una herramienta para la identificación de estrategias de saneamiento hídrico en países en desarrollo. Available at: https://repositorio.uniandes.edu.co/handle/1992/13945 (Accessed November 30, 2022).
Nogueira, J. G., Lopes-Lima, M., Beja, P., Filipe, A. F., Froufe, E., Gonçalves, D. V., et al. (2023). Identifying freshwater priority areas for cross-taxa interactions. Sci. Total Environ. 864, 161073. doi:10.1016/j.scitotenv.2022.161073
Olden, J. D., Kennard, M. J., Leprieur, F., Tedesco, P. A., Winemiller, K. O., and García-Berthou, E. (2010). Conservation biogeography of freshwater fishes: recent progress and future challenges. Divers Distrib. 16, 496–513. doi:10.1111/j.1472-4642.2010.00655.x
ONU (2022). Kunming-Montreal Global biodiversity framework - draft decision submitted by the President. Available at: www.cbd.int/doc/c/e6d3/cd1d/daf663719a03902a9b116c34/cop-15-l-25-en.pdf.[Accessed January 31, 2023].
Organización Nacional de los Pueblos Indígenas de la Amazonia Colombiana (2017). Sistema de Información escuela de Formación política - opiac. OPIAC. Available at: https://www.opiacescuela-copaiba.info/visor-geografico (Accessed June 21, 2022).
Orjuela, L., and Lopez, M. (2011). Índice de calidad del agua en corrientes superficiales (ICA). Bogotá Subdirección Hidrolog\’\ia y Subdirección de Ecosistemas e Información Ambiental 1–10. Available at: http://www.ideam.gov.co/documents/11769/646961/3.02+HM+%C3%8Dndice+Calidad+Agua.pdf/310580af-1ed1-4cbf-ade3-9d8c529c4220 (Accessed September 13, 2022).
Pacheco, H. A., Cevallos, R. X., and Vinces, C. J. (2019). Cálculo del factor C de la RUSLE, en la cuenca del r\’\io Carache, Trujillo-Venezuela usando imágenes del Satélite Miranda VRSS-1. Revista Espacios 40. Available at: www.revistaespacios.com/a19v40n03/a19v40n03p06.pdf (Accessed July 20, 2022).
Panagos, P., Borrelli, P., Meusburger, K., Alewell, C., Lugato, E., and Montanarella, L. (2015). Estimating the soil erosion cover-management factor at the European scale. Land use policy 48, 38–50. doi:10.1016/j.landusepol.2015.05.021
Parker, G., Wilcock, P. R., Paola, C., Dietrich, W. E., and Pitlick, J. (2007). Physical basis for quasi-universal relations describing bankfull hydraulic geometry of single-thread gravel bed rivers. J Geophys Res Earth Surf 112, F04005. doi:10.1029/2006JF000549
Parques Nacionales Naturales de Colombia (2020). Límite Parques Nacionales. Parques Naturales Nacionales de Colombia. Available at: https://www.parquesnacionales.gov.co/portal/es/servicio-al-ciudadano/datos-abiertos/(Accessed September 10, 2022).
Perez Arango, J., and Mesa, O. (2002). “Estimación del factor de erosividad de la lluvia en Colombia,” in Conference: Simposio Latinoamericano de Control de Erosion.
Pérez-Vélez, J. P. (2014). Uso de los fertilizantes y su impacto en la producción agríicola. Escuela de Biociencias.
Perrin, C., Michel, C., and Andréassian, V. (2003). Improvement of a parsimonious model for streamflow simulation. J Hydrol (Amst) 279, 275–289. doi:10.1016/S0022-1694(03)00225-7
Pienkowski, T., Cook, C., Verma, M., and Carrasco, L. R. (2021). Conservation cost effectiveness: a review of the evidence base. Conserv Sci Pract 3. doi:10.1111/csp2.357
Poff, N. L., Allan, J. D., Bain, M. B., Karr, J. R., Prestegaard, K. L., Richter, B. D., et al. (1997). The natural flow regime. Bioscience 47, 769–784. doi:10.2307/1313099
Poff, N. L., Richter, B. D., Arthington, A. H., Bunn, S. E., Naiman, R. J., Kendy, E., et al. (2010). The ecological limits of hydrologic alteration (ELOHA): a new framework for developing regional environmental flow standards. Freshw Biol 55, 147–170. doi:10.1111/j.1365-2427.2009.02204.x
Prabhakar, P., Arora, S., Khosla, A., Beniwal, R. K., Arthur, M. N., Arias-Gonzáles, J. L., et al. (2022). Cyber security of smart metering infrastructure using median absolute deviation methodology. Security and Communication Networks 2022, 1–9. doi:10.1155/2022/6200121
RAISG (2020). Minería ilegal. Red Amazónica de Información Socioambiental Georreferenciada. Available at: https://mineria.amazoniasocioambiental.org/(Accessed May 20, 2022).
Ramirez, A., Restrepo, R., and Viña, G. (1997). Cuatro índices de contaminación para caracterización de aguas continentales. Formulaciones y aplicación. CT&F-Ciencia, Tecnolog\’\ia y Futuro 1, 135–153. Available at: http://www.scielo.org.co/scielo.php?script=sci_arttext&pid=S0122-53831997000100009 (Accessed July 29, 2022).
Ratri, D. N., Whan, K., and Schmeits, M. (2019). A comparative verification of raw and bias-corrected ECMWF seasonal ensemble precipitation reforecasts in java (Indonesia). J Appl Meteorol Climatol 58, 1709–1723. doi:10.1175/JAMC-D-18-0210.1
Renard, K. G., Foster, G. R., Weesies, G. A., McCool, D. K., Yoder, D. C., and coordinators, (1996). Predicting soil erosion by water: a guide to conservation planning with the Revised Universal Soil Loss Equation (RUSLE). Agriculture handbook 703. Available at: https://www.ars.usda.gov/arsuserfiles/64080530/rusle/ah_703.pdf (Accessed October 29, 2022).
Riato, L., Leibowitz, S. G., and Weber, M. H. (2020). The use of multiscale stressors with biological condition assessments: a framework to advance the assessment and management of streams. Science of The Total Environment 737, 139699. doi:10.1016/j.scitotenv.2020.139699
Riato, L., Leibowitz, S. G., Weber, M. H., and Hill, R. A. (2023). A multiscale landscape approach for prioritizing river and stream protection and restoration actions. Ecosphere 14. doi:10.1002/ecs2.4350
Ríos-Villamizar, E. A., Adeney, J. M., Junk, W. J., and Piedade, M. T. F. (2020a). Physicochemical features of Amazonian water typologies for water resources management. IOP Conf Ser Earth Environ Sci 427, 012003. doi:10.1088/1755-1315/427/1/012003
Ríos-Villamizar, E. A., Adeney, J. M., Piedade, M. T. F., and Junk, W. J. (2020b). New insights on the classification of major Amazonian river water types. Sustain Water Resour Manag 6, 83. doi:10.1007/s40899-020-00440-5
Ríos-Villamizar, E. A., Piedade, M. T. F., Da Costa, J. G., Adeney, J. M., and Junk, W. J. (2013). “Chemistry of different Amazonian water types for river classification: a preliminary review,” in WATER AND SOCIETY 2013, 17–28. doi:10.2495/WS130021
Rojas, A. (2011). Aplicación de factores de asimilación para la priorización de la inversión en sistemas de saneamiento hídrico en Colombia. Available at: https://repositorio.unal.edu.co/handle/unal/7652 (Accessed November 30, 2022).
Román Palacios, C., Moraga López, D., and Wiens, J. J. (2022). The origins of global biodiversity on land, sea and freshwater. Ecol Lett 25, 1376–1386. doi:10.1111/ele.13999
Ross, S. T., O’Connell, M. T., Patrick, D. M., Latorre, C. A., Slack, W. T., Knight, J. G., et al. (2001). Stream erosion and densities of Etheostoma rubrum (Percidae) and associated riffle-inhabiting fishes: biotic stability in a variable habitat. Copeia 2001, 916–927. doi:10.1643/0045-8511(2001)001[0916:SEADOE]2.0.CO;2
Rozos, D., Skilodimou, H. D., Loupasakis, C., and Bathrellos, G. D. (2013). Application of the revised universal soil loss equation model on landslide prevention. An example from N. Euboea (Evia) Island, Greece. Environ Earth Sci 70, 3255–3266. doi:10.1007/s12665-013-2390-3
Sanchéz, D., and Cañon, J. (2010). Análisis documental del efecto de vertimientos domésticos y mineros en la calidad del agua del río condoto (Chocó, Colombia). Gestión y Ambiente 13, 115–130. Available at: https://www.redalyc.org/pdf/1694/169419996009.pdf (Accessed November 29, 2022).
Saura, S., Bastin, L., Battistella, L., Mandrici, A., and Dubois, G. (2017). Protected areas in the world’s ecoregions: how well connected are they? Ecol Indic 76, 144–158. doi:10.1016/j.ecolind.2016.12.047
Saxena, A., Prasad, M., Gupta, A., Bharill, N., Patel, O. P., Tiwari, A., et al. (2017). A review of clustering techniques and developments. Neurocomputing 267, 664–681. doi:10.1016/j.neucom.2017.06.053
Schmitt, R. J. P., Bizzi, S., and Castelletti, A. (2016). Tracking multiple sediment cascades at the river network scale identifies controls and emerging patterns of sediment connectivity. Water Resour Res 52, 3941–3965. doi:10.1002/2015WR018097
Seifart, F., and Echeverri, J. A. (2014). Evidence for the identification of carabayo, the language of an uncontacted people of the Colombian Amazon, as belonging to the tikuna-yurí linguistic family. PLoS One 9, e94814. doi:10.1371/journal.pone.0094814
Shepard, D. (1968). “A two-dimensional interpolation function for irregularly-spaced data,” in Proceedings of the 1968 23rd ACM national conference on (New York, New York, USA: ACM Press), 517–524. doi:10.1145/800186.810616
Sociedad de Agricultores de Colombia, (2002). Guía ambiental para las plantas del beneficio del ganado. Vivienda y Desarrollo Territorial: Ministerio de Ambiente.
Stahl, K., Moore, R. D., Floyer, J. A., Asplin, M. G., and McKendry, I. G. (2006). Comparison of approaches for spatial interpolation of daily air temperature in a large region with complex topography and highly variable station density. Agric For Meteorol 139, 224–236. doi:10.1016/j.agrformet.2006.07.004
Szabolcs, M., Kapusi, F., Carrizo, S., Markovic, D., Freyhof, J., Cid, N., et al. (2022). Spatial priorities for freshwater biodiversity conservation in light of catchment protection and connectivity in Europe. PLoS One 17, e0267801. doi:10.1371/journal.pone.0267801
Téllez, P., Petry, P., Walschburger, T., Higgins, J., and Apse, C. (2011). Portafolio de Conservación de Agua Dulce para la Cuenca del Magdalena - cauca. Bogotá D.C. Available at: https://www.nature.org/media/latinamerica/portafolio-de-conservacion.pdf (Accessed June 9, 2022).
The Nature Conservancy, and The Amazon Conservation Team (2019). Pensando, planificando y manejando el territorio: guía para la construcción de Planes de Manejo Ambientales y Culturales. Colombia Available at: https://www.nature.org/content/dam/tnc/nature/en/documents/AFC_Guia_Planes_manejo_pagina_Baja.pdf (Accessed May 21, 2022).
Thornbrugh, D. J., Leibowitz, S. G., Hill, R. A., Weber, M. H., Johnson, Z. C., Olsen, A. R., et al. (2018). Mapping watershed integrity for the conterminous United States. Ecol Indic 85, 1133–1148. doi:10.1016/j.ecolind.2017.10.070
Tickner, D., Opperman, J. J., Abell, R., Acreman, M., Arthington, A. H., Bunn, S. E., et al. (2020). Bending the curve of global freshwater biodiversity loss: an emergency recovery plan. Bioscience 70, 330–342. doi:10.1093/biosci/biaa002
Tognelli, M. F., Anderson, E. P., Jiménez-Segura, L. F., Chuctaya, J., Chocano, L., Maldonado-Ocampo, J. A., et al. (2019). Assessing conservation priorities of endemic freshwater fishes in the Tropical Andes region. Aquat Conserv 29, 1123–1132. doi:10.1002/aqc.2971
Tolson, B. A., and Shoemaker, C. A. (2007). Dynamically dimensioned search algorithm for computationally efficient watershed model calibration. Water Resour Res 43. doi:10.1029/2005WR004723
Torres, S., Carvajal, A., Quiroga, J., and Navisoy, J. (2021). Resultados del monitoreo del agu en fuentes hídricas priorizadas del departamento del Caquetá. Mocoa.
Tosic, R., Dragicevic, S., Kostadinov, S., and Dragovic, N. (2011). Assessment of soil erosion potential by the USLE method: case study, Republic of Srpska - BiH. Fresenius Environ Bull 20, 1910–1917. Available at: https://gery.gef.bg.ac.rs/handle/123456789/449 (Accessed August 12, 2022).
UPME (2022a). Producción de Oro Colombia. Unidad de Planeación Minero Energética. Available at: https://www1.upme.gov.co/simco/Cifras-Sectoriales/Paginas/oro.aspx (Accessed July 10, 2022).
Unidad de Planeación Minero Energética (2022b). Titulos Mineros de Colombia. Unidad de Planeación Minero Energética. Available at: http://sig.simec.gov.co/UPME_MI_minas/ (Accessed May 11, 2022).
Valencia-Rodríguez, D., Jiménez-Segura, L., Rogéliz, C. A., and Parra, J. L. (2022). A simple and extensible framework to identify key areas for the conservation of single vulnerable freshwater species. Biol Conserv 273, 109672. doi:10.1016/j.biocon.2022.109672
Velásquez-Tibatá, J., Olaya-Rodríguez, M. H., López-Lozano, D., Gutiérrez, C., González, I., and Londoño-Murcia, M. C. (2019). BioModelos: a collaborative online system to map species distributions. PLoS One 14, e0214522. doi:10.1371/journal.pone.0214522
Venarsky, M. P., Walters, D. M., Hall, R. O., Livers, B., and Wohl, E. (2018). Shifting stream planform state decreases stream productivity yet increases riparian animal production. Oecologia 187, 167–180. doi:10.1007/s00442-018-4106-6
Vigiak, O., Borselli, L., Newham, L. T. H., McInnes, J., and Roberts, A. M. (2012a). Comparison of conceptual landscape metrics to define hillslope-scale sediment delivery ratio. Geomorphology 138, 74–88. doi:10.1016/j.geomorph.2011.08.026
Vigiak, O., Borselli, L., Newham, L. T. H., McInnes, J., and Roberts, A. M. (2012b). Comparison of conceptual landscape metrics to define hillslope-scale sediment delivery ratio. Geomorphology 138, 74–88. doi:10.1016/j.geomorph.2011.08.026
Wade, A. J., Butterfield, D., Griffiths, T., and Whitehead, P. G. (2007). Eutrophication control in river-systems: an application of INCA-P to the River Lugg. Hydrol Earth Syst Sci 11, 584–600. doi:10.5194/hess-11-584-2007
Walker, R. S., and Hamilton, M. J. (2019). Machine learning with remote sensing data to locate uncontacted indigenous villages in Amazonia. PeerJ Comput. Sci 5, e170. doi:10.7717/peerj-cs.170
Walker, R. S., Kesler, D. C., and Hill, K. R. (2016). Are isolated indigenous populations headed toward extinction? PLoS One 11, e0150987. doi:10.1371/journal.pone.0150987
Whitehead, A. L., Kujala, H., Iver, C. D., Gordon, A., Lentini, P. E., Wintle, B. A., et al. (2014). Integrating biological and social values when prioritizing places for biodiversity conservation. Conservation Biology 28, 992–1003. doi:10.1111/cobi.12257
Whitehead, P. G., Jin, L., Baulch, H. M., Butterfield, D. A., Oni, S. K., Dillon, P. J., et al. (2011). Modelling phosphorus dynamics in multi-branch river systems: a study of the Black River, Lake Simcoe, Ontario, Canada. Science of The Total Environment 412–413, 315–323. doi:10.1016/j.scitotenv.2011.09.073
Wilkerson, G. V., and Parker, G. (2011). Physical basis for quasi-universal relationships describing bankfull hydraulic geometry of sand-bed rivers. Journal of Hydraulic Engineering 137, 739–753. doi:10.1061/(asce)hy.1943-7900.0000352
Williams, P., Gibbons, D., Margules, C., Rebelo, A., Humphries, C., and Pressey, R. (1996). A comparison of richness hotspots, rarity hotspots, and complementary areas for conserving diversity of British birds. Conservation Biology 10, 155–174. doi:10.1046/j.1523-1739.1996.10010155.x
Wohl, E. (2017). Connectivity in rivers. Progress in Physical Geography Earth and Environment 41, 345–362. doi:10.1177/0309133317714972
Wong, M., and Parker, G. (2006). Reanalysis and correction of bed-load relation of meyer-peter and müller using their own database. Journal of Hydraulic Engineering 132, 1159–1168. doi:10.1061/(asce)0733-9429(2006)132:11(1159)
Wood, A. W., Leung, L. R., Sridhar, V., and Lettenmaier, D. P. (2004). Hydrologic implications of dynamical and statistical approaches to downscaling climate model outputs. Clim Change 62, 189–216. doi:10.1023/B:CLIM.0000013685.99609.9e
Keywords: Caquetá River, durable freshwater protection, integrity, representativeness, importance, prioritization, systematic conservation planning, Amazon
Citation: Nogales J, Rogéliz-Prada C, Cañon MA and Vargas-Luna A (2023) An integrated methodological framework for the durable conservation of freshwater ecosystems: a case study in Colombia’s Caquetá River basin. Front. Environ. Sci. 11:1264392. doi: 10.3389/fenvs.2023.1264392
Received: 20 July 2023; Accepted: 17 October 2023;
Published: 08 November 2023.
Edited by:
Wei Wang, Chinese Research Academy of Environmental Sciences, ChinaCopyright © 2023 Nogales, Rogéliz-Prada, Cañon and Vargas-Luna. This is an open-access article distributed under the terms of the Creative Commons Attribution License (CC BY). The use, distribution or reproduction in other forums is permitted, provided the original author(s) and the copyright owner(s) are credited and that the original publication in this journal is cited, in accordance with accepted academic practice. No use, distribution or reproduction is permitted which does not comply with these terms.
*Correspondence: Jonathan Nogales, am9uYXRoYW4ubm9nYWxlc0B0bmMub3Jn