 Fang Wan
 Wenhao Han
 Qiubo Long2*
 Guoqing Wang
- 1North China University of Water Resources and Electric Power, Zhengzhou, China
- 2Engineering Technology Research Center of Dongting Lake Flood Control and Water Resources Protection of Hunan Province, Changsha, China
- 3The National Key Laboratory of Water Disaster Prevention, Nanjing Hydraulic Research Institute, Nanjing, China
- 4Cooperative Innovation Center for Water Safety and Hydro Science, Hohai University, Nanjing, China
- 5Yangtze Institute for Conservation and Development, Nanjing, China
Studying the propagation law and response relationship between meteorological elements and hydrological drought is conducive to exploring the propagation mechanism and transmission time of drought, and providing a basis for reasonable and efficient drought relief work. In this paper, the area above Xiangtan station is taken as the research area, and the temperature and precipitation are selected as the meteorological elements. The standardized flow index (SDI) is used to characterize the hydrological drought. The linear regression method and Mann-Kendall trend test are used to analyze the evolution sequence of meteorological elements and hydrological drought at different scales. The characteristics and laws of drought propagation are revealed, and the hydrological drought is divided into stages by combining the ordered cluster analysis method and the sliding t-test method. The Pearson correlation analysis method is used to analyze the stage correlation degree between meteorological elements and hydrological drought, reflecting the response relationship between meteorological elements and hydrological drought under different types and different scales, and the response period of hydrological drought to meteorological elements at different time scales is obtained. Studying the development trend and evolution law of meteorological elements and hydrological drought, and deeply exploring the phased response relationship are conducive to improving the drought resistance ability and drought disaster reduction management ability of Xiangtan area.
1 Introduction
In the past century, with the rapid development of human civilization and the intensification of global warming, the impact of drought on human survival and development has become more and more obvious (Zhang et al., 2020). In general, the development of drought is characterized by frequent, continuous and concurrent, and there is obvious differentiation in time series and spatial distribution (Dai and Zhao, 2017). At present, the global losses caused by drought account for about 55% of the total losses of natural disasters, making 30% of the world‘s land and 20% of the population threatened by drought (Xu, 2014). This paper takes the area above Xiangtan Station as the research area. Xiangjiang River Basin is an important commodity grain and industrial raw material producing area. In recent years, with the influence of climate change and human activities (population density increase, urbanization level increase, etc.), drought has a deepening impact on economic and social development, making water shortage, desertification, ecological and environmental deterioration and other negative effects (Ling et al., 2023). Therefore, it is necessary to study the evolution trend of hydrological and meteorological factors in Xiangtan area and their phased response relationship, which is of great value in drought risk assessment and drought prevention and disaster reduction planning measures.
Drought evolution is a hot topic in current academic research. It mainly explores the characteristics and laws of multi-type drought evolution by optimizing methods and constructing more scientific and effective drought indicators. For example, Wang et al. (2023) constructed the joint distribution of hydrological drought variables based on Copula function to explore the evolution law of return period and drought; Jiang et al. (2023) standardized the precipitation evapotranspiration index, and optimized the combination of run theory, wavelet theory, Copula function and other methods to analyze the spatial and temporal evolution and periodic characteristics of drought. Zheng et al. (2023) combined the distributed hydrological model with the attribution analysis method, and used the binary water cycle optimization model to explore the impact of human society on the evolution of hydrological drought. Tian et al. (2023) established a multivariate drought index to characterize drought. At the same time, combined with meteorological factors and hydrological factors, a standardized drought index capable of characterizing meteorology and hydrology was constructed to evaluate and study the spatial and temporal evolution of drought in the Xijiang River Basin. The results show that the drought index can fully reflect the drought situation. Gu et al. (2023) selected the standardized precipitation index, combined with a linear regression method, Mann-Kendall rank test and other methods to analyze the evolution direction and persistence of meteorological drought; Liang et al. (2023) analyzed and compared the calculation results of Pearson correlation method and cross wavelet method, and obtained the strongest correlation factor among many climatic factors, revealing the main reasons for the intensification of regional drought; Ribeiro Neto et al., 2022 developed a new method of drought cycle analysis to predict and evaluate the occurrence and evolution of drought events; By improving the spatial hierarchical clustering method, Li et al. (2020a) comprehensively divided the characteristics of drought evolution from the perspective of time and space. Most of the above studies studied the evolution of drought from the perspective of optimizing drought indicators, improving methods and theories, and rarely analyzed the evolution of hydrological and meteorological factors from a multi-scale perspective, and there were few studies on the stage of multi-type drought response.
In this paper, the area above Xiangtan station is taken as the research area. The linear regression method and Mann-Kendall trend test method are used to analyze the evolution characteristics of hydrological drought and meteorological elements in the area above Xiangtan station. The standardized flow index (SDI) is used to study the evolution trend of hydrological drought. The orderly cluster analysis method and the sliding t-test method are used to divide the hydrological drought into stages (Li et al, 2020b; Lu and Li, 2020). The Pearson correlation analysis method is used to study the response relationship between multi-type meteorological elements and multi-scale hydrological drought in different stages. It provides a new direction and idea for the study of drought propagation law and drought control in this area.
1.1 Overview of the study area
Xiangjiang River is an important tributary of the Yangtze River and the largest river in the Dongting Lake system. It spans four provinces: Hunan, Guangxi, Jiangxi and Guangdong (Figure 1). The basin area of each province accounts for 90.22%, 8.17%, 1.51% and 0.10% (Luo, 2020) of the total basin area, respectively. The Xiangjiang River Basin has a subtropical monsoon humid climate. The climate is mild and the rainwater is relatively concentrated. The summer and autumn seasons are dry and the high temperature period is long. The average annual temperature of the basin is 17.4°C, the average annual evaporation is 1275.5 mm, and the average annual precipitation is 1,441 mm (Comprehensive Planning of Xiangjiang River Basin, 2015). Since 2000, the frequency of hydrological drought in Xiangtan area has increased significantly, and hydrological drought occurred every 2 years on average from 2003 to 2013 (Wu et al., 2023). Xiangtan area is the region with the strongest intensity of hydrological drought in Xiangjiang River Basin. The longest duration of hydrological drought is 10 months, and the main occurrence periods are summer, autumn and winter (Wen et al., 2021; Luo, 2020). The total length of the mainstream of the Xiangjiang River Basin is about 850 km, and the runoff is unevenly distributed during the year, and the interannual variation is small (Development Planning Office of Hunan Development and Reform Commission, 2013). Due to the influence of monsoon, the spatial and temporal distribution of rainfall is not balanced. April to June is the Meiyu season, and the precipitation in 3 months accounts for more than 40% of the annual precipitation. The unbalanced distribution of precipitation makes drought events occur frequently (Comprehensive Planning of Xiangjiang River Basin, 2015). Xiangjiang River is an important water source in Hunan Province. More than 60% of the water used by industrial enterprises in Hunan Province comes from Xiangjiang River. In the past 50 years, the urbanization rate has increased by about 45%, and the continuous improvement of social and economic needs has aggravated the degree of drought (Liu, 2020).
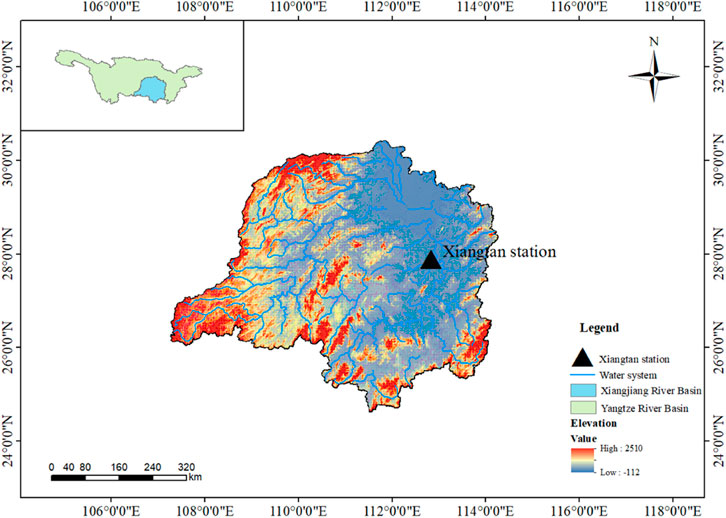
FIGURE 1. Xiangjiang river basin Zoning map.
The hydrometeorological data in this paper are derived from the Hydrological Yearbook and the geospatial data cloud website. The meteorological element data are monthly series data (January 1959∼December 2010), and the hydrological data are monthly series data (January 1959∼December 2013). The time range of the final drought stage is unified from January 1959 to December 2010.
2 Research methods
2.1 Hydrological and meteorological evolution characteristics
Based on the monthly data of temperature, precipitation and flow in the study area from 1959 to 2010, combined with the linear regression method and Mann-Kendall trend test method, the inter-annual and annual evolution characteristics of meteorological elements in the area above Xiangtan station were analyzed. At the same time, the evolution law of multi-scale sequence of hydrological drought index was analyzed, which provided a basis for the study of the relationship between meteorology and hydrological response. The linear regression method is widely used and not specifically introduced. The calculation steps of the Mann-Kendall trend test method are as follows:
Let a data sequence
Among them,
When
The following standardized test statistic
When
2.2 Stage division and response relationship
Combined with the ordered cluster analysis method and the sliding t-test method, the mutation points of the hydrological drought index sequence were analyzed, and the hydrological drought was divided into stages. The correlation analysis method was used to analyze the response relationship between hydrological drought and multi-type meteorological factors in different stages. The correlation analysis method is widely used, and the specific principle is not described.
(1) Ordered cluster analysis. The ordered cluster analysis method is to estimate the mutation point and find the optimal segmentation point. For the sample sequence x, the main points of the optimal bipartition method are as follows:
Assuming that the possible mutation point is t, then the sum of squares of deviations before and after the mutation point is:
In the formula:
The
(2) Sliding t-test. The sliding t-test method is to identify the mutation point by testing whether the difference between the mean values of the two random sample sequences before and after the sliding point is significant. A random sample sequence
In the formula:
3 Evolution analysis of hydrological drought and meteorological factors
The meteorological elements (temperature and precipitation) are divided into two scales: annual and inter-annual. The linear regression method and Mann-Kendall trend test method are used to analyze the time-history evolution characteristics. At the same time, the evolution law of multi-scale hydrological drought index (SDI) is studied. The sequential cluster analysis method and the sliding t-test method are used to calculate the mutation point of SDI1 sequence, and the stage division of hydrological drought evolution is carried out.
3.1 Hydrological drought evolution law and stage division
3.1.1 Evolution law of hydrological drought
Based on the data and evolution characteristics of the flow series, the standardized flow index (SDI) was standardized to characterize the hydrological index series, and the hydrological drought conditions in the study area were evaluated based on different time scales. Four scales of SDI1, SDI3, SDI6 and SDI12 were selected to study the evolution of hydrological drought. Figure 2 is the evolution of SDI sequence at four scales. Figure 3 is the cumulative months of different drought levels in SDI series at four scales.
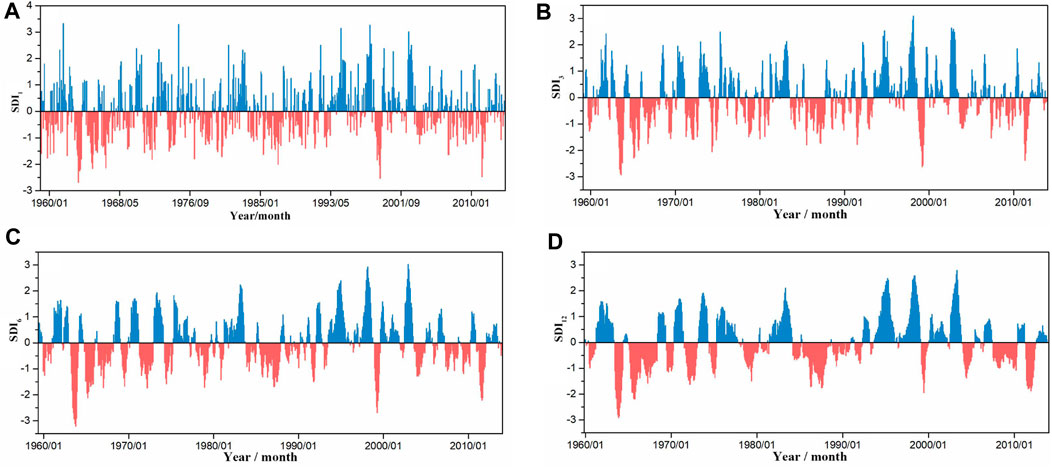
FIGURE 2. Evolution of SDI sequence at four scales.
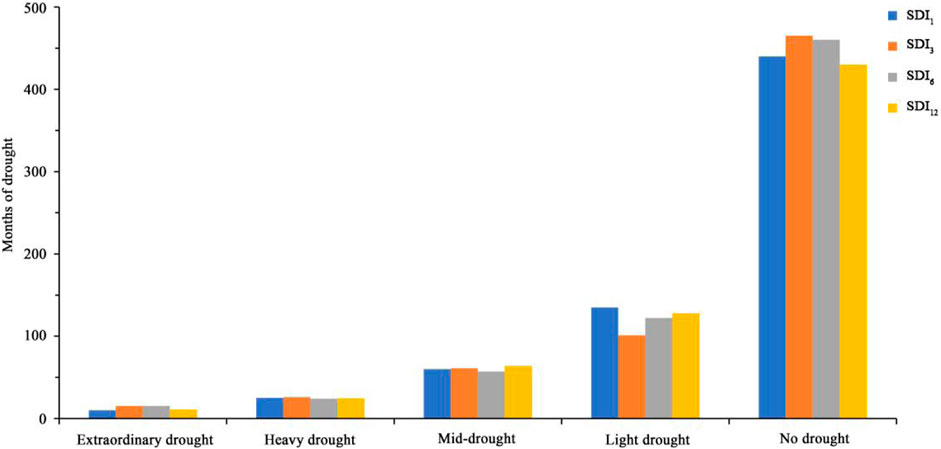
FIGURE 3. Cumulative months of different drought levels in SDI series at four scales.
It can be seen from Figures 2, 3 that the cumulative months of no drought, light drought, moderate drought, severe drought and extreme drought in SDI1, SDI3, SDI6 and SDI12 scale sequences were relatively close, and the average frequencies of five drought grades in four scales were 68.55%, 16.32%, 9.33%, 3.67% and 1.83%, respectively. The 2-month drought events occurred more frequently in SDI1, with a total of 42 drought events. The 4-month drought events occurred more frequently in SDI3, with a total of 41 drought events. SDI6 had the highest number of 6-month drought events, with a total of 29 drought events. SDI12 had the highest number of drought events in 3, 9, and 12 months, with a total of 18 drought events.
3.1.2 Division of evolution stages
According to the mutation point of SDI1 drought index sequence, SDI1 is divided into stages, and the stage characteristics of hydrological drought are analyzed, which provides a basis for further study on the stage characteristics of multi-type response relationship. Figure 4 is the ordered clustering and sliding t-test analysis chart.
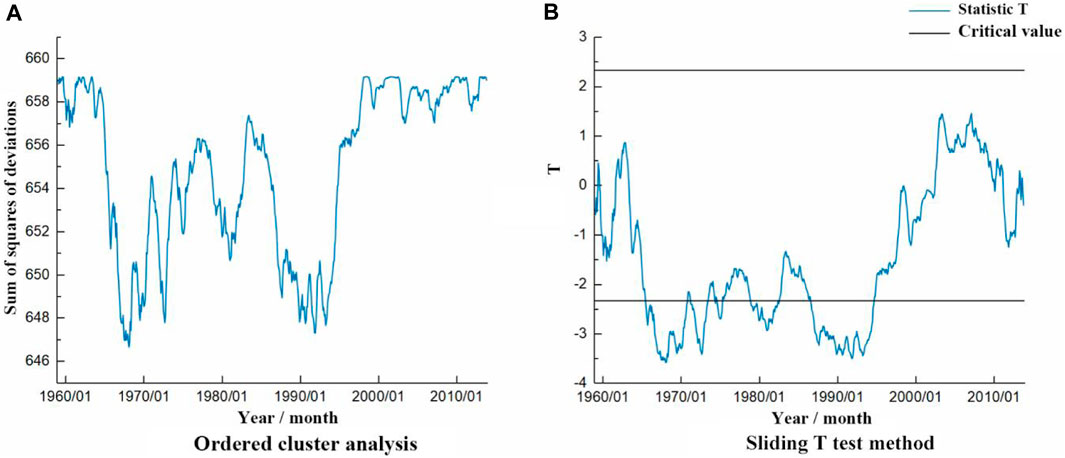
FIGURE 4. Ordered clustering and sliding t-test analysis chart.
In this paper, the segmentation point is judged according to the diagnostic results of the ordered cluster analysis method and the square of the sequence deviation. If the square of the sequence deviation has a minimum value and the absolute value of the T value is greater than the critical value, it passes the t-test and is the optimal two-segmentation point. It can be seen from Figure 4A that the sum of squared deviations of SDI drought index sequence reached the minimum value in February 1968, that is, the optimal two-segmentation point. December 1991, September 1972, July 1969, September 1987 and January 1980 correspond to the minimum values, respectively, which are the mutation points. After the mutation point is tested by sliding t-test, the absolute value of T value at all mutation points in Figure 4B is greater than the critical value T0.05 (n−2) (n is the sequence length), that is, all mutation points pass the significance test of α = 0.05. It is divided into six stages: January 1959 to February 1968, March 1968 to September 1972, October 1972 to January 1980, February 1980 to September 1987, October 1987 to December 1991, January 1992 to December 2010.
Table 1 divides the period from 1959 to 2010 into six stages on a monthly scale. The longest duration (228 months) was stage 6 (January 1992∼December 2010), and the shortest duration (51 months) was stage 5 (October 1987∼December 1991). The average duration was 104 months, and the duration of stage range was 177 months. The characteristics of hydrological drought are staged, which provides a basis for further research on the stage characteristics of multi-type response relationships.
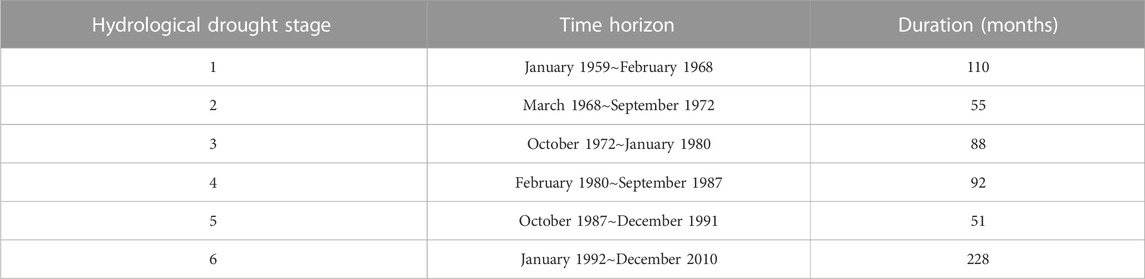
TABLE 1. Hydrological drought stage division.
3.2 Evolution characteristics of meteorological elements
Taking temperature and precipitation as meteorological elements, the evolution characteristics of annual and inter-annual are studied by linear regression method and Mann-Kendall trend test method. Figure 5 is the trend of precipitation change in the four seasons of the year. Figure 6 is the trend of temperature change in the four seasons of the year. Table 2 is the trend characteristics and significance of annual and inter-annual precipitation and temperature.
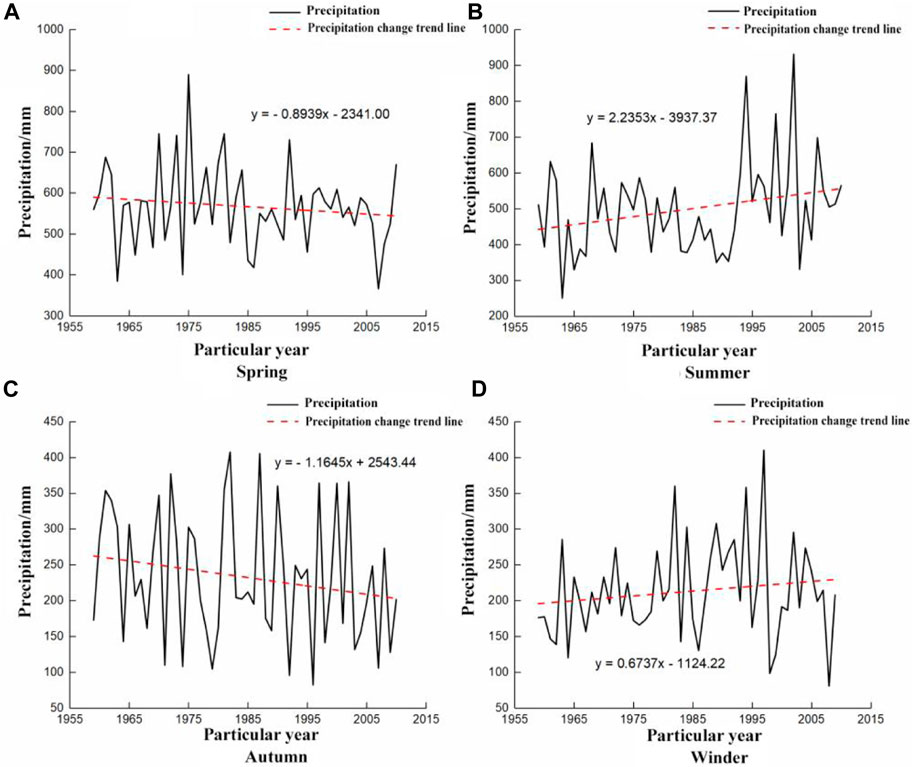
FIGURE 5. The trend of precipitation changes in the four seasons of the year.
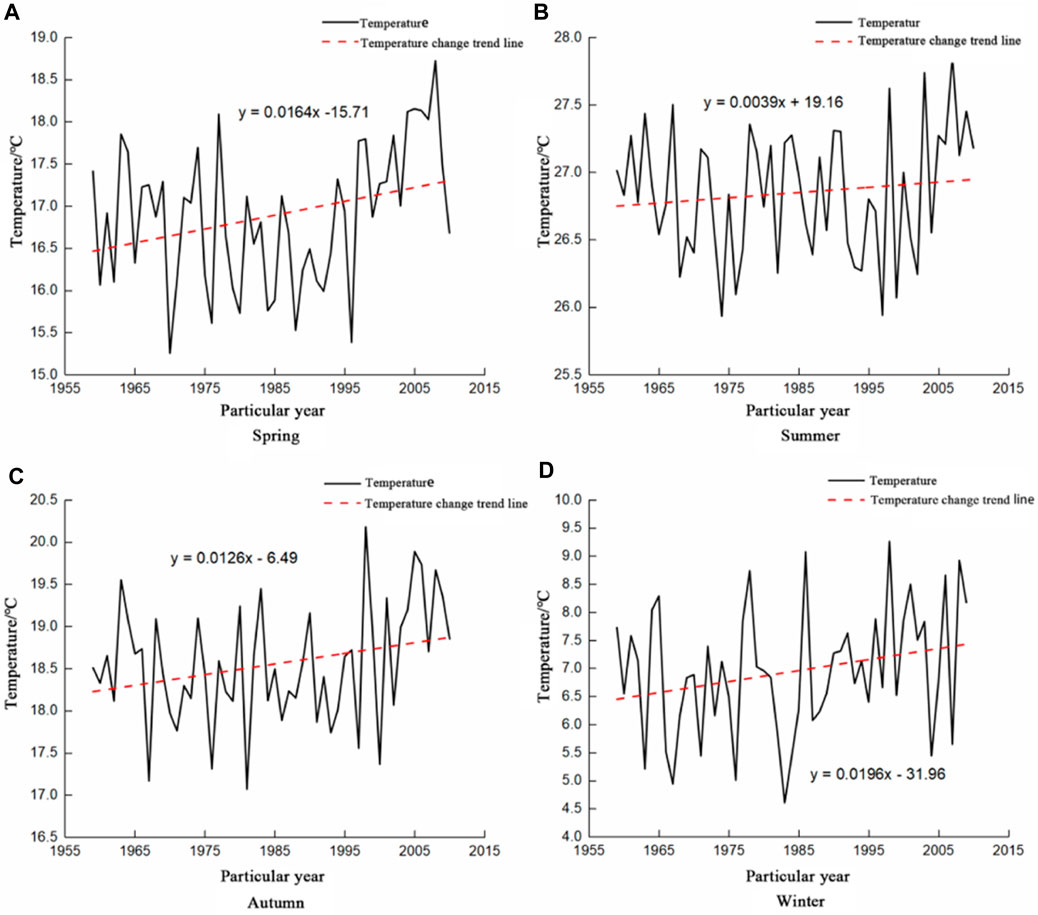
FIGURE 6. The trend of temperature change in the four seasons of the year.
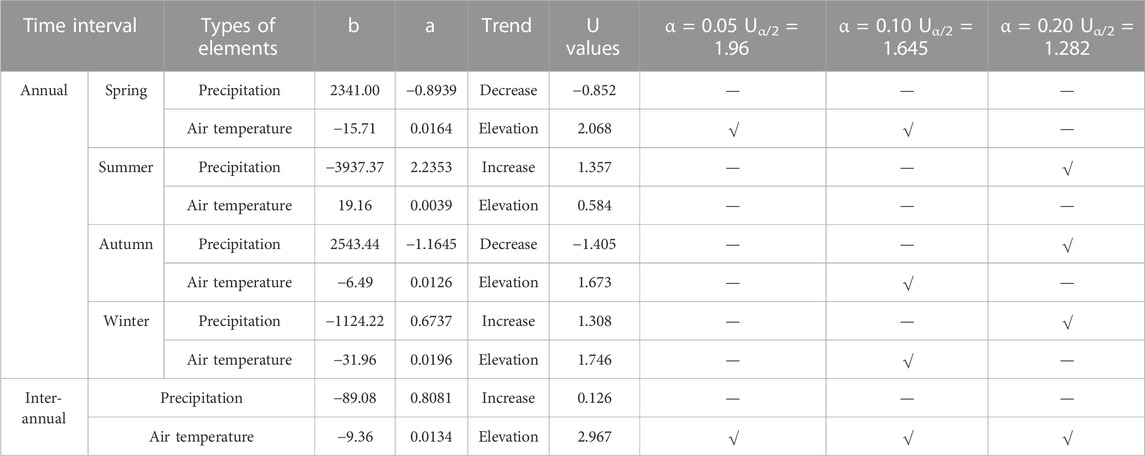
TABLE 2. Trend characteristics and significance of annual and inter-annual precipitation and temperature.
It can be seen from Figure 5 that the linear change rate of precipitation during the year is the largest in summer, 2.2 mm/a, −1.2 mm/a in autumn and 0.7 mm/a in winter. Due to the influence of the monsoon, the summer precipitation changes dramatically. The maximum precipitation (931.4 mm) is 3.7 times of the minimum precipitation (249.3 mm). The precipitation in spring also changes greatly. The maximum precipitation (890.0 mm, 1975) is 2.4 times of the minimum precipitation (365.9 mm, 2007). The variation of seasonal precipitation in autumn and winter is small, ranging from 50 to 400 mm. It can be seen from Figure 6 that the average temperature difference in the four seasons is small. The average temperature in spring and autumn is close to 17°C, the average temperature in summer is 26.9°C, and the average temperature in winter is 6.9°C. The overall temperature of the four seasons shows an upward trend, and the upward trend of winter temperature is the most obvious, with a linear change rate of 0.20°C/10a.
It can be seen from Table 2 that except for summer, the annual temperature in other seasons has passed the significance test of 0.10, and the rising trend of temperature in spring and winter is more obvious. The precipitation during the year showed a decreasing trend in spring and autumn, and an increasing trend in summer and winter. Except for spring, the other seasons passed the significance test of 0.20. The average annual temperature was 17.3°C, and the average annual maximum temperature (18.4°C) and the average annual minimum temperature (16.2°C) appeared in 2007 and 1984, respectively. The overall annual average temperature showed an upward trend, with a linear change rate of 0.13°C/10a, and the upward trend passed the significance test of 0.05. The annual average annual precipitation was 1515 mm. The annual maximum precipitation (2121.9 mm) and the annual minimum precipitation (1118.3 mm) appeared in 2002 and 1963, respectively. The range multiple was 1.9 times, and there was no significant change trend in general.
4 Response relationship between hydrological drought and meteorological factors
4.1 Multi-type response relationship analysis
Pearson correlation coefficient is used to represent the correlation between annual and inter-annual climatic factors (temperature, precipitation) and multi-time scale Standardized flow index (SDI), and the correlation between the two is verified by significance test. Table 3 is the correlation status of annual and inter-annual temperatures with Standardized flow index (SDI) at different time scales, and Table 4 is the correlation status of annual and inter-annual precipitation with Standardized flow index (SDI) at different time scales.
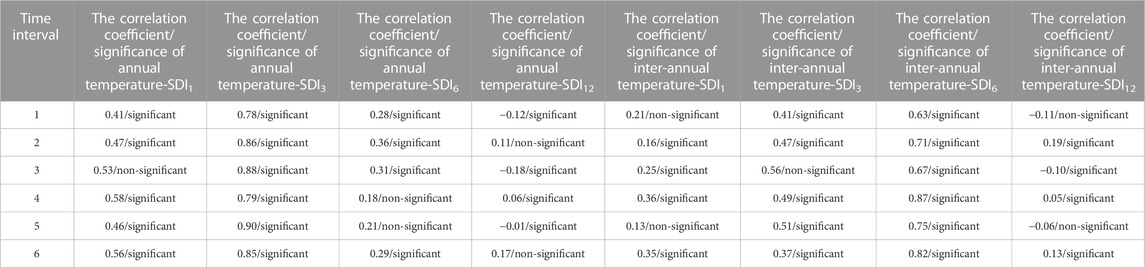
TABLE 3. The correlation between annual and inter-annual temperature and standardized flow index (SDI) at different time scales.
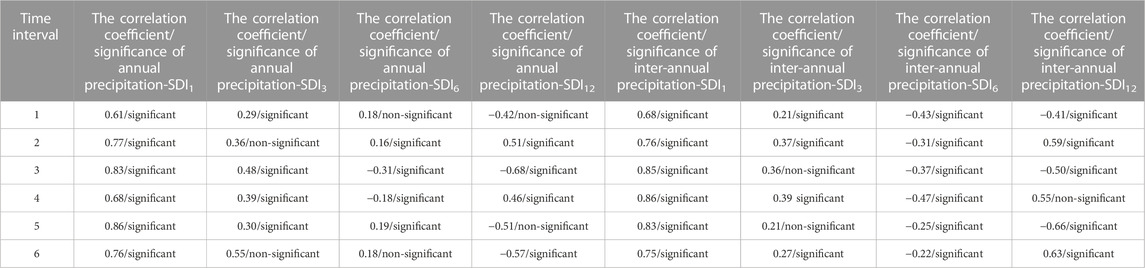
TABLE 4. The correlation between annual and inter-annual precipitation and standardized flow index (SDI) at different time scales.
It can be seen from Tables 3, 4 that on the whole, the correlation intensity of all periods in each type is basically the same, and most of them conform to the significant test. The following analysis will regard the six periods as a whole. It can be seen from Table 3 that the correlation between annual temperature and SDI1, SDI3, SDI6 and SDI12 is moderate positive correlation, strong positive correlation, weak positive correlation and moderate negative correlation, respectively. Among them, the correlation between annual temperature and SDI at 3-month scale is the strongest, and it passes the significance level test. It shows that with the increase of time scale, the annual temperature is the most sensitive to SDI at 3-month scale, and the response period of hydrological drought to annual temperature is 3 months. At the same time, the correlation between annual temperature and SDI1, SDI3, SDI6, SDI12 was weak or irrelevant, moderate positive correlation, strong positive correlation, extremely weak or irrelevant, respectively. Among them, the correlation between annual temperature and SDI at 6-month scale was the strongest, which passed the significance test, indicating that the annual temperature was most sensitive to SDI at 6-month scale, and the response period of hydrological drought to annual temperature was 6 months.
It can be seen from Table 4 that the correlation between annual precipitation and SDI1, SDI3, SDI6 and SDI12 is strong positive correlation, weak or moderate positive correlation, weak negative or irrelevant, moderate negative correlation, respectively. Among them, the correlation between annual precipitation and SDI at 1-month scale is the strongest, which has passed the significance level test. The annual precipitation is most sensitive to SDI at 1-month scale, that is, the response period of annual precipitation to SDI at 1-month scale is 1 month, and the response duration is short and the influence is strong. The correlation between annual precipitation and SDI1, SDI3, SDI6, SDI12 were strong positive correlation, weak positive correlation, weak or moderate negative correlation, moderate or strong negative correlation, respectively. The correlation between annual precipitation and SDI at 1-month scale was the strongest, which passed the significance test. Inter-annual precipitation was also most sensitive to SDI at 1-month scale. The response period of annual precipitation to SDI at 1-month scale was 1 month. Precipitation has a great influence on hydrological drought, and the response period is short.
4.2 Discussion
Based on the monthly temperature, precipitation and flow data from 1959 to 2010, this paper divides six periods to study the response of hydrological drought to meteorological factors. The correlation strength of each period is consistent, and the significance in each type is significant as a whole. It shows that the correlation between meteorological element data sequence (temperature, precipitation) and hydrological drought index sequence (SDI) is strong. Therefore, it can accurately verify the correlation degree of multi-type response relationship and scientifically evaluate the response characteristics of hydrological drought to meteorological factors.
The response periods of annual temperature and inter-annual temperature to hydrological drought were 3 months and 6 months, respectively, which passed the significance test. From the annual scale to the inter-annual scale, the sensitivity of drought response weakened, so the response period also became longer. The response period of annual precipitation and inter-annual precipitation to hydrological drought is 1 month. Precipitation has a direct and main influence on hydrological drought, and the response of hydrological drought is affected by multi-level and multi-directional complex effects (such as underlying surface changes, accelerated urbanization, etc.). At the same time, there are differences in spatial and temporal characteristics in different regions, so the response period of annual precipitation and inter-annual precipitation to hydrological drought is short.
Among the data studied in this paper, the years with higher temperature are 1963 (17.99°C), 1998 (18.24°C) and 2007 (18.38°C), and the years with less precipitation are 1963 (1118.3 mm), 1971 (1204.4 mm), 1986 (1237.0 mm) and 2003 (1171.9 mm). According to the records of “China Meteorological Disaster Canon · Hunan Volume,” “China Water Disaster Prevention: Strategy, Theory and Practice · Drought Disaster Prevention” and “Yearbook of Meteorological Disasters in China,” serious drought events occurred in the above mentioned years. Therefore, based on the results of series of data calculation, this paper can scientifically reflect the rationality of the evolution characteristics of meteorological elements and the evolution law of hydrological drought, and then can accurately obtain the response relationship between hydrological drought and meteorological elements, and provide scientific value for the study of drought evolution and transmission in the region.
5 Conclusion
Based on the evolution characteristics and laws of meteorological elements and hydrological drought, this paper analyzes and studies the response of hydrological drought to meteorological elements in the area above Xiangtan station. The correlation of six periods in each type is basically the same. The response periods of annual temperature and inter-annual temperature to hydrological drought were 3 and 6 months, respectively. The response periods of annual precipitation and inter-annual precipitation to hydrological drought were both 1 month. The correlation coefficients reached the strongest positive correlation and passed the significance test. By scaling meteorological elements and hydrological drought indicators, the response characteristics of hydrological drought to climate factors can be fully reflected through the analysis of multi-type response relationships. The area above Xiangtan station needs to plan drought response measures and drought forecast plan in 1, 3, and 6 months of drought response period. With global warming, the drought response period will be shortened, and the trend of shortening will increase the frequency of drought. The decision-making departments of drought prevention and disaster reduction need to adjust the drought relief plan in time to improve the efficiency and level of drought control. The results of this paper provide a favorable value for the study of drought response and drought remediation in the region. However, in practice, the propagation and response of drought are affected by multiple factors and multi-level interference and influence, and the driving factors of drought response can be further studied in the future.
Data availability statement
The datasets presented in this article are not readily available because Data is confidential. Requests to access the datasets should be directed to https://www.resdc.cn/NewsInfo.aspx?NewsID=9; http://www.dsac.cn/DataProduct/Detail/200800; http://data.cma.cn/.
Author contributions
FW: Writing–original draft, Conceptualization. WH: Conceptualization, Writing–original draft. QL: Writing–original draft, Investigation, Supervision. WW: Writing–original draft, Supervision. GW: Writing–original draft, Formal Analysis, Investigation. FZ: Writing–original draft, Methodology.
Funding
The authors declare financial support was received for the research, authorship, and/or publication of this article. The Research was Supported by the Open Research Fund of Science and Technology Innovation Platform of Engineering Technology Research Center of Dongting Lake Flood Control and Water Resources Protection of Hunan Province, Hunan Water Resources and Hydropower Survey, Design, Planning and Research Co., Ltd (HHPDI-KFKT-202304); Water Resources Science and Technology Program of Hunan Province (XSKJ2021000-05); Water Resources Science and Technology Program of Hunan Province (XSKJ2023059-06); Open Fund of Key Laboratory of Flood & Drought Disaster Defense, the Ministry of Water Resources (KYFB202307260036); Major Science and Technology Special Projects in Henan Province (201300311400).
Conflict of interest
The authors declare that the research was conducted in the absence of any commercial or financial relationships that could be construed as a potential conflict of interest.
Publisher’s note
All claims expressed in this article are solely those of the authors and do not necessarily represent those of their affiliated organizations, or those of the publisher, the editors and the reviewers. Any product that may be evaluated in this article, or claim that may be made by its manufacturer, is not guaranteed or endorsed by the publisher.
References
Comprehensive Planning of Xiangjiang River Basin (2015). Changsha: hunan water resources and hydropower Survey, Design. Planning and Research CO., LTD. Available at: http://www.hunan.gov.cn/hnszf/xxgk/fzgh/201403/t20140304_4902771.html.
Dai, A., and Zhao, T. (2017). Uncertainties in historical changes and future projections of drought. Part I: estimates of historical drought changes. Clim. Change 144 (3), 519–533. doi:10.1007/s10584-016-1705-2
Development Planning Office of Hunan Development and Reform Commission (2013). Overall plan for scientific development of Xiangjiang River Basin. http://www.hnfgw.gov.cn/hgzh/qygh/37668.html.
Gu, G., Li, H., and Huo, S. (2023). Analysis of evolution characteristics of meteorological drought in fuxian lake basin from 1964 to 2021. Pearl River 44 (S1), 27–32. doi:10.3969/j.issn.1001-9235.2023.S1.006
Jiang, Z., Xu, G., and Zhang, K. (2023). Spatiotemporal variation and bivariate regional frequency analysis of meteorological droughts inGuizhou Province based on SPEI. J. Water Resour. Water Eng. 34 (05), 20–31. doi:10.11705/j.issn.1672-643X.2023.05.03
Li, L., Lu, T., Liu, M., Hu, L., and Wang, S. (2020b). Characteristics of hydrological drought based on standardized flow index in Shiyang River Basin of China. J. Desert Res. 40 (04), 24–33. doi:10.7522/j.issn.1000-694X.2020.00010
Li, M., Cao, F., Wang, G., Chai, X., and Zhang, L. (2020a). Evolutional characteristics of regional meteorological drought and their linkages with southern oscillation index across the loess plateau of China during 1962–2017. Sustainability 12 (18), 7237. doi:10.3390/su12187237
Liang, X., Yuan, S., and Wang, J. (2023). Progress and prospects of research on causes of meteorological drought in different regions in China. J. Arid Meteorology 41 (01), 1–13. doi:10.11755/j.issn.1006-7639
Ling, M., Guo, X., Zhang, Y., Yu, L., and Xia, Q. (2023). Drought evolution in the Haihe River basin during 1960–2020 and the correlation with global warming, sunspots, and atmospheric circulation indices. J. Water Clim. Change 14 (1), 369–386. doi:10.2166/WCC.2022.510
Liu, Q. (2020). Study on the impact of climate variability and human activities on the shortage of blue/green water resources in the Xiangjiang River Basin based on SWAT model. Changsha, China: Hunan University. doi:10.27135/d.cnki.ghudu.2020.004009
Lu, T., and Li, L. (2020). Study on hydrological drought characteristics in the middle reaches of Shiyang River Basin based on SDI. Agric. Science-Technology Inf. (06), 41–43. doi:10.15979/j.cnki.cn62-1057/s.2020.06.019
Luo, Y. (2020). Satellite-based soil moisture and precipitation for drought monitoring and prediction in Xiang River Basin. Dhaka, Bangladesh: Southeast University. doi:10.27014/d.cnki.gdnau.2020.002509
Luo, Y. (2022). Drought monitoring in Xiangjiang River Basin based on remote sensing soil moisture and remote sensing precipitation. Southeast University. doi:10.27014/d.cnki.gdnau.2020.002509
Ribeiro Neto, G. G., Melsen, L. A., Martins, E. S. P. R., Walker, D. W., and van Oel, P. R. (2022). Drought cycle analysis to evaluate the influence of a dense network of small reservoirs on drought evolution. Water Resour. Res. 58 (1). doi:10.1029/2021WR030799
Tian, Q., Fei, W., Yu, T., Yunzhong, J., Peiyao, W., and Jinbei, L. (2023). Copula-based comprehensive drought identification and evaluation over the Xijiang River Basin in south China. Ecol. Indic., 154. doi:10.1016/j.ecolind.2023.110503
Wang, X., Tao, P., Ying, B. X., Bojuan, L., Xiaohua, D., Jiali, G., et al. (2023). Evolution characteristics of hydrological drought in the middle reaches of the Han River before and after Danjiangkou reservoir. Resour. Environ. Yangtze Basin 32 (07), 1479–1490. doi:10.11870/cjlyzyyhj202307011
Wen, X., Zhou, J., Liu, S., Ma, Y., Xu, Z., and Ma, J. (2021). Spatio-temporal characteristics of surface evapotranspiration in source region of rivers in Southwest China based on multi-source products. Water Resour. Prot. 37 (03), 32–42. doi:10.3880/j.issn.1004-6933.2021.03.006
Wu, Z., Zhang, J., Cheng, D., Fan, S. Q., He, H., and Li, Y. (2023). Study of comprehensive drought in dex based on water deficits of surface, soil, and crop. Water Resour. Prot. 39 (03), 55–64. doi:10.3880/j.issn.1004-6933.2023.03.007
Xu, C. (2014). The spatial and temporal features of drought in the five provinces of southwest China from 1961 to 2012. Nanjing, China: Nanjing Agricultural University. doi:10.7666/d.Y2974372
Zhang, Q., Yao, Y., Li, Y., Huang, J., Ma, Z., Wang, Z., et al. (2020). Causes and changes of drought in China: research progress and prospects. J. Meteorological Res. 34 (3), 460–481. doi:10.1007/s13351-020-9829-8
Keywords: evolution law, response relationship, meteorological element, hydrological drought, Xiangtan area
Citation: Wan F, Han W, Long Q, Wang W, Wang G and Zhang F (2023) Study on the evolution law and stage response relationship between meteorological elements and hydrological drought in Xiangtan area. Front. Environ. Sci. 11:1327622. doi: 10.3389/fenvs.2023.1327622
Received: 25 October 2023; Accepted: 30 November 2023;
Published: 20 December 2023.
Edited by:
Jing Liu, University of Birmingham, United KingdomCopyright © 2023 Wan, Han, Long, Wang, Wang and Zhang. This is an open-access article distributed under the terms of the Creative Commons Attribution License (CC BY). The use, distribution or reproduction in other forums is permitted, provided the original author(s) and the copyright owner(s) are credited and that the original publication in this journal is cited, in accordance with accepted academic practice. No use, distribution or reproduction is permitted which does not comply with these terms.
*Correspondence: Qiubo Long, bG9uZ3FpdWJvMTdAMTI2LmNvbQ==