 Yuqing Mao
 Jiao Liu2*
- 1Nanjing Meteorological Observatory, Nanjing, China
- 2Nanjing Meteorological Service Center, Nanjing, China
Based on multi-source observation data such as lightning locator, atmospheric electric field instrument and hourly precipitation data from automatic stations, the lightning characteristics of the strong convective weather process under the influence of the northeast cold vortex in Nanjing Jiangsu Province on 15 June 2020 was analyzed in depth, and the relationship between the lightning activity and the precipitation was obtained. The results show that this strong convective weather process is formed by the cold air from the back of the northeast cold vortex along the front of the high-pressure ridge and the back of the transverse through southward to the middle and lower reaches of the Yangtze River, which makes the cold and warm air currents converge along the south of the Yangtze River to form the heavy precipitation, and is accompanied by the strong lightning activity in the process of this heavy precipitation. The local thunderstorm electric field in Nanjing is mainly characterized by negative increasing type, positive and negative alternating type, and multi-single thunderstorm electric field, and the thunderstorm activity is mainly dominated by negative ground flashes. During this strong thunderstorm, the stronger precipitation periods corresponded to the stronger lightning frequency periods, and the lightning and precipitation fallout areas showed a consistent spatial distribution. The correlation between the lightning activity and precipitation was analyzed by linear fitting, and the correlation between them is 0.946.
1 Introduction
Lightning is a long-distance instantaneous discharge phenomenon in thunderstorm weather. The strong current, high temperature and electromagnetic pulse radiation generated during lightning discharge often endanger all aspects of people’s lives. The disasters caused by lightning have caused serious economic losses and social impacts on human beings (Rakov and Uman, 2003; Christian et al., 2003). Therefore, it is of great significance to conduct in-depth and meticulous scientific research on the characteristics of lightning occurrence and development activities and its early warning and forecasting work for reducing the loss of people’s lives and property caused by lightning.
For a long time, the research on lightning is mainly based on Doppler weather radar, lightning location instruments, atmospheric electric field instruments and other detection equipment. Relevant researchers in China and other countries have done a lot of in-depth research work on the electrical characteristics of thunderstorm clouds and precipitation and lightning in the process of severe convective weather, and have achieved fruitful research results (Gungle and Krider, 2006; Holle et al., 1994; Dayeh et al., 2021; Jin et al., 2022; Zhu et al., 2023; Liu et al., 2022; Wang et al., 2016; Li et al., 2022; MacGorman and Morgenstem, 1998; Chatterjee and Das, 2020; Zhang et al., 2015). Serge and Serge, (2001) obtained the relationship between lightning and precipitation through the study of lightning location data, and found that lightning and precipitation are highly consistent in space. The precipitation corresponding to positive CG (cloud-to-ground) lightning is often higher than that corresponding to negative CG lightning. Battan (1965) found that with the development of precipitation, the corresponding lightning frequency also increases. Piepgrass et al. (1982) found that the peak of lightning frequency has a positive time advance compared with the peak of precipitation intensity. The specific characteristics of lightning occurrence and precipitation proposed in the above studies are also of great warning significance for strong convective weather warnings. In addition, relevant scholars also use lightning location systems and radar observation data to observe many severe convective weather processes, and find that there is a certain positive correlation between CG lightning and radar echo intensity. CG lightning frequency can be used to predict precipitation. Lightning data can not only predict the occurrence and development of convective activities, but also predict floods (Petersen et al., 1996; Holle and Bennett, 1997). However, there are still some difficulties in the thunderstorm warning work during the local extreme heavy precipitation weather in practice. A large number of observations and studies have shown that in different formation and development environments, the characteristics of lightning activity show diversity, and the formation mechanism of its electric field is also very different (Latha, 2003; Qie et al., 2005; Qie et al., 2009; Chapman et al., 2017; Pustovalov and Nagorskiy, 2018; Sabri et al., 2019). The northeast cold vortex is an important impact system that causes weather disasters such as thunderstorms, strong winds, and hail. The strong convective weather caused by cold air moving south often has an important impact on the Jianghuai region, and it is imperative to strengthen the analysis and research on the specific characteristics of such typical cases and then provide technical support and reference for the early warning of strong convective weather in Jiangsu (Shen et al., 2021; Shen et al., 2022; Cao et al., 2023; Shen et al., 2023; Song et al., 2023; Zhao et al., 2023). However, due to the sudden occurrence and development of strong convective weather and its strong local characteristics, it has always been difficult in forecasting services. Therefore, strengthening the research and application of multi-source observation data in short-term and imminent forecasting services and improving the ability of forecasting and early warning is still the future direction of relevant staff. At present, the research and application of weather radar observation data have achieved fruitful results in the short-term and imminent forecasting service. However, the effective use of radar in the short-term and imminent lightning warnings needs to be further improved because of its wide detection range.
In recent years, new types of detection data have been put into wide application and achieved fruitful research results in the proximity warning of short-term heavy precipitation weather. Shi et al. (2023) evaluated the results of joint assimilation of AGRI infrared radiance and ground-based MWR (microwave radiometer) data in short-term heavy precipitation prediction, and found that the joint assimilation of AGRI radiance and MWR data improves the simulation of the 6-hourly cumulative precipitation effectively and improves the precipitation prediction significantly in the Beijing area; Van et al. (2022) measured the relationship between raindrop distribution and rainfall intensity by using an optical raindrop spectral rangefinder and derived relevant metrics. At present, in terms of short-term early warning, the atmospheric electric field instrument of the new detection instrument such as short data aging and far smaller than radar detection range, can make up for the shortcomings of radar detection data in time and space resolution, and also provide technical support for severe convective weather monitoring and early warning to some extent. Meanwhile, with the wide use of detection equipment such as atmospheric electric field meters and lightning locators in many places, it also provides technical support and support for lightning monitoring and early warning to a certain extent.
In order to explore the specific characteristics of thunderstorms characteristics during severe convective weather in Jiangsu Province and the relationship between lightning and precipitation, this paper uses radar, atmospheric electric field instrument, lightning location and other multi-source observation data, combined with a strong thunderstorm weather process under the background of northeast cold vortex on June 15th, analyzes the atmospheric electric characteristics of thunderstorm clouds in transit, summarizes the lightning activity change law in the process of severe convective weather under the influence of northeast cold vortex and its relationship with precipitation, and further refines the application of multi-source observation data in short-term and imminent warning. This not only provides some scientific basis and experience reference for forecasters in the short-term forecast of severe convective weather under the background of northeast cold vortex weather, but also has important significance in improving the forecast service level of extremely heavy precipitation weather and disaster prevention and mitigation work.
2 Data and method
The materials used in this paper are as follows.
(1) The electric field data was observed by the atmospheric electric field instrument (Pre-storm2.0) at Nanjing stations (Nanjing Station, Jiangning Station, Kunlun Road Station, and Olympic Sports Center Station) on 15 June 2020. The location distribution of the instruments for the atmospheric electric field at each station in Nanjing is shown in Figure 1. The detection radius of the atmospheric electric field instrument is 15–20 km. The detection range of the electric field is-300–300 kv/m, and the detection frequency of the electric field is once/5 m.
(2) The lightning data in this paper are collected from the lightning location system of Jiangsu Province, which consists of nine detection stations, using the ADTD lightning detection structure developed by the Institute of Space Science and Applications of the Chinese Academy of Sciences. The detection range of a single station of the lightning detection system is about 150 km, and the location error is 1 km. Lightning location data includes information such as the time of occurrence of lightning, current amplitude, longitude and latitude at the time of lightning strike [24], etc. The lightning location data provides a detection range of (113°E ∼ 122°E) and (28.5°N ∼ 38°N).
(3) Radar data: The radar data in this paper is from the Doppler weather radar station in Nanjing (32.191°N, 118.697°E), and its detection range is 230 km. The radar data used in this paper is the data from the whole day on 15 June 2020. The measuring area of the atmospheric electric field meter at each station in Nanjing is within the detection range of the radar.
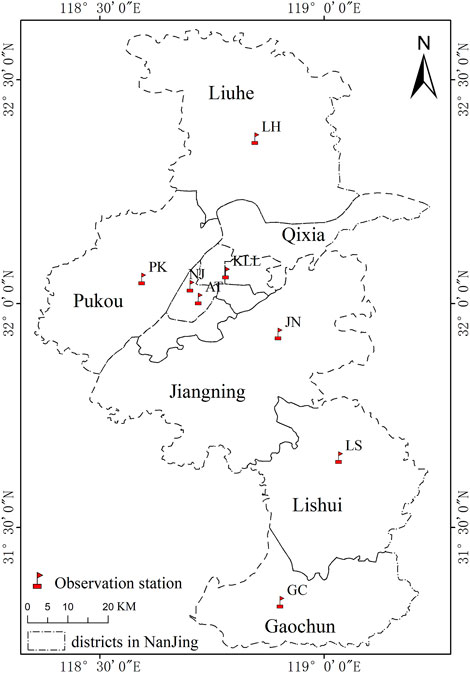
FIGURE 1. Station Distribution of the Atmospheric Electric Field instrument.
To ensure the accuracy and validity of the data, the processing methods of atmospheric electric field data, lightning location data and radar data are as follows: the atmospheric electric field data should correspond to the time interval of the radar data every 6 minutes in the use process. The electric field data missing at the time corresponding to the radar data is eliminated within the time range of the radar data every 6 minutes, which is to ensure that it can effectively dock with radar data. That is, if more than one-third of the electric field data in 6 min is missing, the data in 6 min is invalid.
To facilitate the calculation and analysis, this paper transforms the radar data stored in polar coordinates into the data in Cartesian coordinates. In the process of radar data gridding, it is found that the combination of the nearest neighbor method in the radial and azimuthal directions and the linear interpolation method in the vertical direction is a more effective method for radar data analysis. The reflectivity field obtained by this method is more continuous in the horizontal and vertical directions, and it also retains the original reflectivity structure characteristics of the volume scan data. Therefore, this paper uses the above method to interpolate the radar base data into three-dimensional grid field data with a horizontal resolution of 1 km × 1 km and height resolution of 0.5 km × 0.5 km. The radar product is generated every 6 min, the ground flash data and atmospheric electric field instrument data within 6 min when the radar map is generated can be selected to correspond to the radar data. Therefore, during the thunderstorm weather process in this paper, it can be guaranteed that all the observation data of the atmospheric electric field instrument and the data of the lightning locator are in one-to-one correspondence with the radar data without duplication.
3 Weather background analysis
3.1 Analysis of circulation situation condition
From June 10 to 14, 2020, the 500 hPa circulation in the middle and high latitudes was adjusted. The subtropical high was lifted northward, and the 588 lines were lifted northward from the coast of South China to the central part of Jiangsu and Anhui. At 20:00 on June 14, the ridge line of the subtropical high at 120°E reached 25°N. The 588 line was located in the Huaihe River Basin at 33°N. The northeast cold vortex is located at 130°E and 45°N, and there is a cold center of −16°Cbehind the cold vortex. The temperature trough and the height trough are almost overlapped. A small cold air stream behind the cold vortex is along the front of the ridge. And the rear part of the transverse trough moves southward to the middle and lower reaches of the Yangtze River (Figure 2). The subtropical high controls the eastern area south of the Yangtze River. The 588 line falls southward from 33°N to 31°N at 20:00 on the 14th. The ridge line of the 120°E subtropical high falls southward from 25°N to 23°N. Nanjing is located in the westerly airflow at the edge of the 588 lines of the subtropical high. The cold and warm air flows meet along the southern part of Jiangsu Province, which is conducive to the formation of heavy precipitation. Affected by the Meiyu front, a rainstorm occurred in the southern part of Jiangsu Province from June 14 to 15, 2020, with local heavy rainstorms to extremely heavy rainstorms. The center of the heavy rainfall was located in the line of Pukou Qiaolin, Jiangning Hengxi and Lishui Dongping in Nanjing. Meanwhile, the heavy rainfall was accompanied by strong lightning activities.
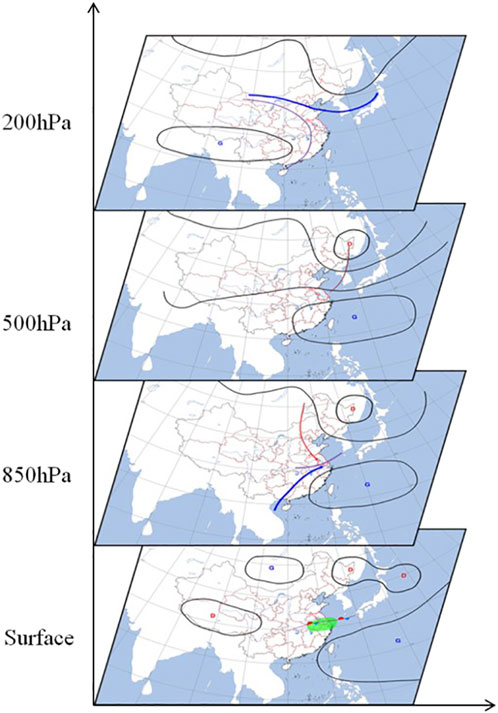
FIGURE 2. Conceptual analysis of the weather situation at 08:00, 15 June 2020.
At 700 hPa, from 20:00 on the 14th, there is a west-northwest wind cold shear between the Yangtze River and the Huaihe River. Nanjing is in the westerly jet on the south side of the shear. At 2:00 on the 15th, the southwest warm and humid airflow near Nanjing is strengthened, and the relative humidity is increased. With the eastward movement of the cold vortex, at 08:00 on the 15th, the northwest wind behind the bottom of the cold vortex strengthened and penetrated southward. The shear line pressed southward to the line along the Yangtze River. The southwest jet strengthened to 18 m/s. The relative humidity reached more than 90%, and the water vapor was abundant, corresponding to the beginning of heavy rainfall at this time; at 14:00, with the further southward pressure of the shear line, the precipitation weakened.
As shown in Figure 2, similar features also exist in the 850 hPa situation field. The shear line still exists between the Yangtze River and the Huaihe River. The southwest airflow is strong, and the low-level jet provides abundant water vapor for Nanjing and strengthens the dynamic lifting. At 08:00 on the 15th, the cold air at the rear of the bottom of the cold vortex penetrated. The shear line pressed southward to the south of the Yangtze River. The wind field turned to the northwest near Nanjing, and the southwest airflow on the south side increased significantly. Meanwhile, with the cooperation of high-humidity areas, the cold and warm air converged violently near Nanjing. Nanjing was located on the left side of the low-level jet and the right side of the entrance area of the high-level jet. The low-level convergence and high-level divergence strengthened the ascending movement. It is conducive to the development of convection, resulting in heavy precipitation (Simmonds et al., 1999; Zhang, 2001).
3.2 Analysis of environmental conditions
Environmental conditions play a key role in the charged activity and intensity of thunderstorm clouds. Effective liquid water content, convective available potential energy, 0°C, −10°C and −20°C layer heights and vertical wind shear intensity directly have an important impact on the thunderstorm cloud electrification mechanism (Zhang et al., 1995). Figure 3 shows the T-log p map of Nanjing Station at 08:00 on 15 June 2020. It can be seen from Figure 3 that the dew point temperature at 850 hPa is 18°C. The specific humidity is 15.64 g/kg and the wet layer extends to about 300 hPa. The effective liquid water content is high. The water vapor condition of the whole layer is good, which provides necessary conditions for the occurrence and development of heavy rainfall and thunderstorm cloud electrification process. The CAPE value was 171.1J/kg, showing a “slender” distribution, which belonged to a typical heavy precipitation-sounding state, and also reflected that there might be strong lightning activities during the precipitation process. The heights of 0 °C, −10°C and −20°C layers are 5. 2 km, 7.3 km, and 9 km, respectively.
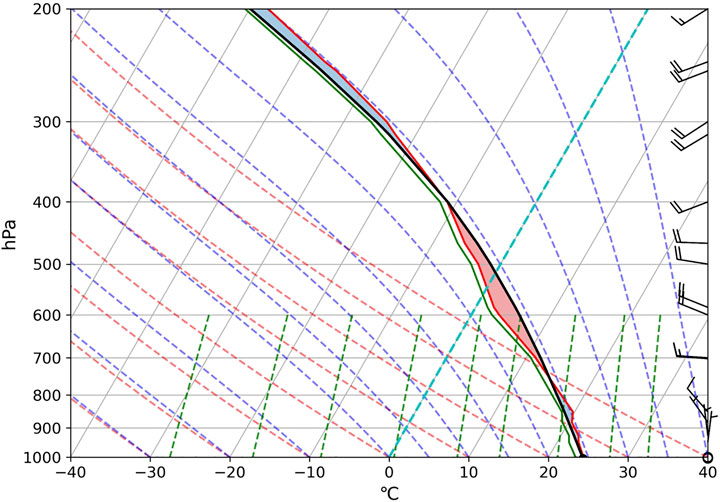
FIGURE 3. T-logp diagram of Nanjing Station at 08:00, 15 June 2020.
The warm cloud layer is deep and the mixed-phase region is high. The ice crystal particles associated with charging are distributed at higher altitudes. The main negative charge area in the cloud is deep, which will lead to the occurrence of a large number of negative lightning. From the T-log p diagram of Nanjing Station at 08:00, it can be seen that the height difference of 2 km is conducive to the occurrence of convection and electrification activities. To sum up, the environmental conditions of the station are conducive to the occurrence of heavy rainfall and lightning activities.
4 Actual precipitation and lightning
4.1 Overview of the study area and synoptic situation
Nanjing is located in the southwest of Jiangsu Province, in the lower reaches of the Yangtze River, at 31°14′-32°37′north latitude and 118°22′-119°14′east longitude. It belongs to the central region of the lower reaches of the Yangtze River, with the Yangtze River in the north, Taihu Lake in the south and the East China Sea in the south. In terms of climatic regionalization, Nanjing has a humid climate in the north subtropical zone, under the control of westerly circulation, with significant monsoon and distinct seasons. In summer, it is affected by the subtropical high, with hot weather and abundant rainfall. In early summer, affected by the frontal rain belt, Nanjing entered the plum rain season, during which severe convective weather caused by the southward movement of cold air from the rear of the northeast cold vortex occurred from time to time. Figure 4 shows the location map of the study area in China.
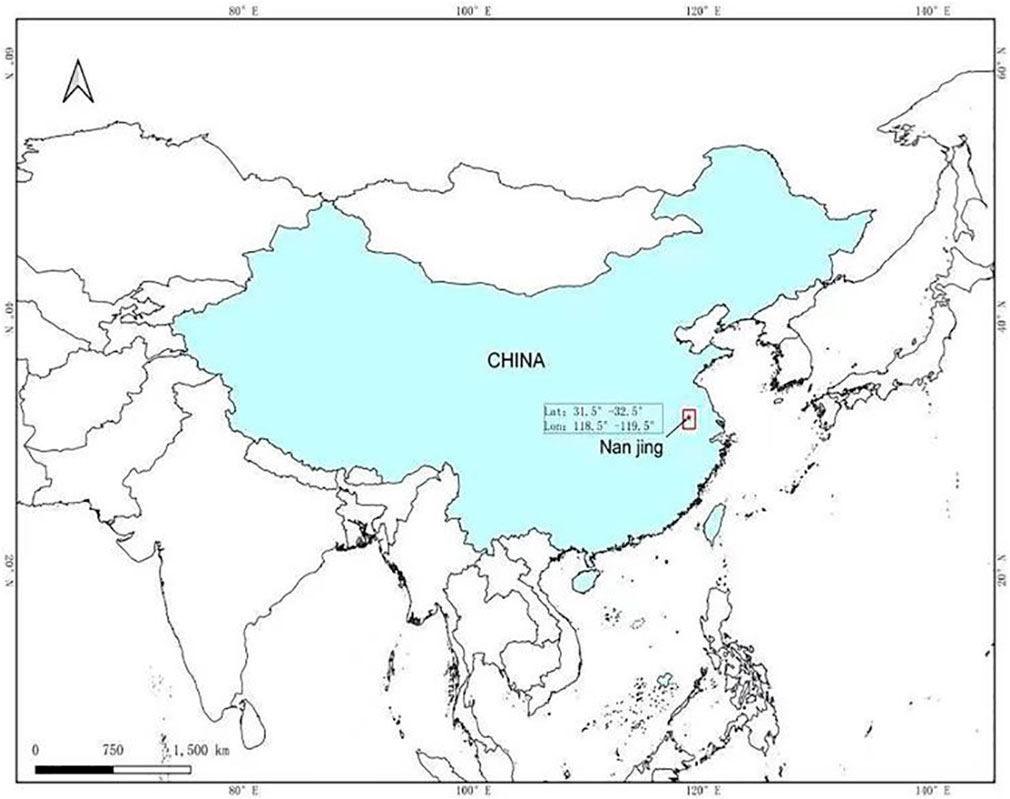
FIGURE 4. Map of China where the study area is located Nanjing (31.5°-32.5°N, 118.5°-119.5°E).
4.2 Precipitation status
On 15 June 2020, affected by the Meiyu front, a large-scale rainstorm occurred in southern Jiangsu Province, and some areas reached heavy rain to pelting rain. The northern part of the Yangtze River was mainly light to moderate rain, with local heavy to heavy rain. The heavy rainstorm area is mainly located in the line of Pukou, Qiaolin-Jiangning Hengxi-Lishui Dongping in Nanjing and the junction of Taizhou, Changzhou and Wuxi. From 20:00 on June 14 to 20:00 on June 15, 63 automatic stations in Nanjing had rainfall of more than 50 mm. 29 automatic stations had rainfall of more than 100mm, and the maximum rainfall was 271 mm (Jiangning Lulang Primary School Station), reaching the level of an extraordinary rainstorm, which was also the precipitation center of the whole province and even the whole country on that day (as shown in Figure 5).
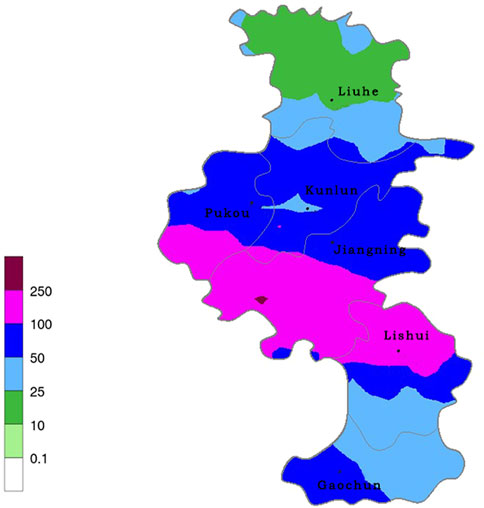
FIGURE 5. Distribution map of accumulated precipitation in Nanjing from 0:00 to 23:00 on 15 June2020.
The short-time heavy rainfall began at 5:00 on the 15th and occurred in the north of Pukou and Jiangbei New Area, with a local hourly rainfall intensity of more than 40 mm/h from 5:00 to 6:00. There were two short-time heavy rainfall centers from 6 a.m. to 7 a.m., located near Qiaolin in Pukou and Longgang Science and Technology Park in Qixia District. From 7:00 to 8:00, the range of short-term heavy rainfall area was expanded and the intensity was strengthened. The maximum rainfall intensity was 74 mm/h in Lulang, Jiangning. From 8:00 to 9:00, the western section of the heavy rainfall area was maintained, and the eastern section was southward to Lishui. Two automatic stations on Jiangning Street in the west of Jiangning observed about 72 mm/h hourly precipitation. The center of the second heavy rainfall was in the north of Lishui, with a rainfall intensity of 70 mm/h. From 9:00 to 10:00, the western section of the heavy rainfall area continued to maintain. Four automatic stations in Jiangning Street and Hengxi Street in the western part of Jiangning observed 72–78 mm/h rainfall intensity, while the eastern section of the heavy rainfall area slightly moved northward, with the maximum rainfall intensity of 64 mm/h (Airport Expressway Station). From 10:00 to 11:00, the short-term heavy precipitation area began to move southward to the north of Lishui. The precipitation intensity also weakened, with a maximum rainfall intensity of 49 mm/h (Lishui Development Zone). From 11:00 to 12:00, the short-term heavy precipitation area moved southward to Gaochun. The intensity continued to weaken, with the maximum rainfall intensity of 37 mm/h (Zhuanqiang Town).
4.3 Lightning activity in Nanjing on June 15
The heavy rainfall that occurred in Nanjing on 15 June 2020, was a rainstorm process at the edge of the subtropical high under the background of the northeast cold vortex. The low-level jet stream and low-level shear line provided water vapor and kinetic energy for the rainstorm. The surface convergence line plays an important role in triggering and maintaining the mesoscale convective system, and makes the precipitation form a “train effect”. As a result, continuous short-term heavy rainfall accompanied by strong thunder and lightning activities occurred along the line of Pukou Qiaolin, Jiangning Hengxi and Lishui Dongping in Nanjing. According to the statistical analysis of lightning location data in Jiangsu Province, there were 494 lightning strikes in the urban area when the thunderstorm passed through on 15 June 2020, of which 123 were positive and 371 were negative. Negative lightning predominates, indicating the passage of thunderstorm clouds, which exhibit predominantly positive and negative dipolar polarity structures (Zhang et al., 1998; Guo et al., 2007). Figure 6 show the distribution of positive and negative lightning during the passage of thunderstorm clouds on 15 June 2020, and the distribution characteristics of lightning at different times on that day.
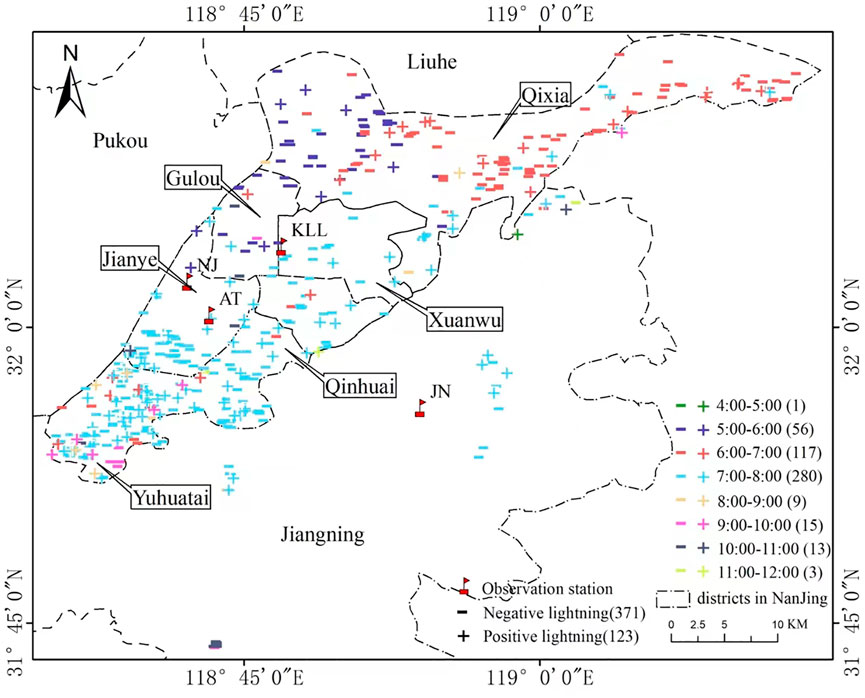
FIGURE 6. Lightning distribution characteristics of thunderstorm process on 15 June 2020.
4.4 Analysis of stage characteristics of electric field variation in the thunderstorm process
Figures 7A–D show the change characteristics of the ground electric field of Jiangning Station, Olympic Sports Center Station, Nanjing Station and Kunlun Road Station during the thunderstorm. In general, the electric field change characteristics of each station are negative increasing type, positive and negative alternating type, and multi-cell thunderstorm.
1) Negative increasing type: as shown in Figures 7A, the negative increasing type of the atmospheric electric field on the ground during a thunderstorm at Jiangning Station is shown. With the gradual accumulation of negative charges gathered at the bottom of the thunderstorm cloud, the atmospheric electric field intensity increases negatively.
2) Positive and negative alternating type: When the thunderstorm cloud has entered the warning range of the electric field instrument and discharges to the ground, the ground atmospheric electric field mainly fluctuates up and down irregularly as it approaches the station. As shown in Figures 7B, the positive and negative alternated electric field characteristics during a thunderstorm at Kunlun Road Station. When the ground electric field is positive, it indicates that there is a large amount of positive charge accumulating under the cloud and controlling the ground electric field, at this time, the electric field mainly shows positive changes; when the ground electric field is negative, it indicates that there is a large amount of negative charge accumulating under the cloud and controlling the ground electric field, at this time, the electric field mainly shows negative changes.
3) When a multi-cell thunderstorm is formed by the superposition of multiple single thunderstorms, the ground electric field will show the comprehensive effect of the frequent and rapid reversal of the electric field polarity when the multi-cell thunderstorm discharges to the ground at different stages of generation and extinction. As shown in Figure 7C, the electric field changes the characteristic curve of a multi-cell thunderstorm detected by Nanjing Station.
4) Although the electric field change of Kunlun Road does not present the form of a general atmospheric electric field change (shown in Figure 7D), it is found that the electric field still presents a violent discharge phenomenon from 8:00 to 12:00, which can be attributed to the fact that the local thunderstorm cloud cluster has been over the area where the station is located at that time. When the field strength reaches the breakdown field strength value, the obvious breakdown discharge phenomenon occurs. As shown in the figure, the needle-like convex structure appears around 09:35.
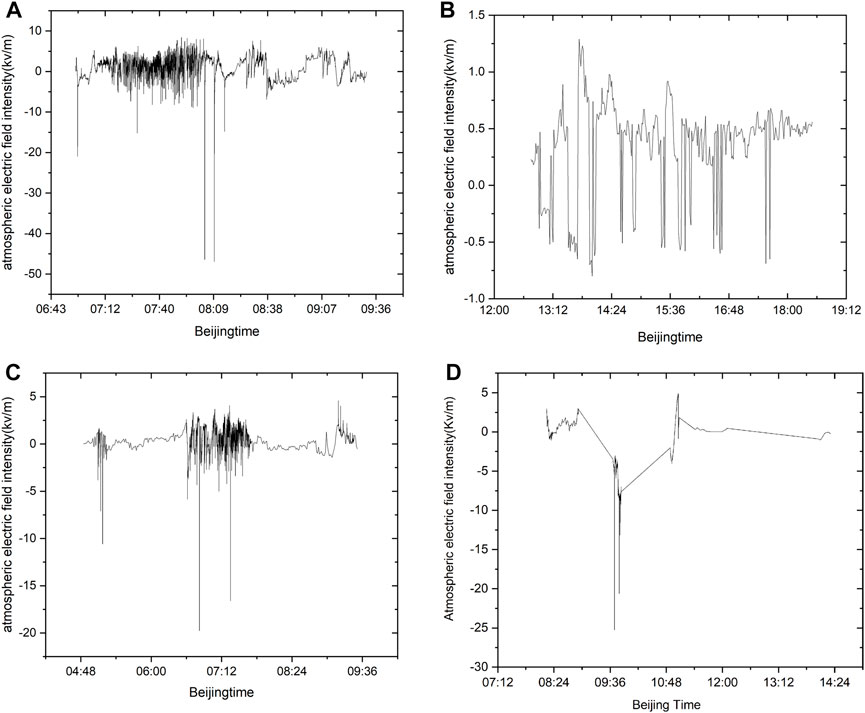
FIGURE 7. Variation of the atmospheric electric field at each station in Nanjing during the passage of a thunderstorm on 15 June 2020. (A) The negative increasing electric field of a thunderstorm passing through Jiangning Station. (B) Positive and negative alternating electric field during a thunderstorm in the Olympic Center. (C) Electric field of multi-cell thunderstorm process in Nanjing station. (D) The electric field of a thunderstorm passing through Kunlun Road Station.
Taking the electric field data of a thunderstorm process at Nanjing Station on 15 June 2020, as an example, which is shown in Figure 8. The variation characteristics of the electric field and its relationship with the occurrence of lightning during the thunderstorm passing process are analyzed in detail. Assuming that the time when the lightning locator detects the first strike within 15 km of an electric field meter station is t1, the time when it detects the first strike within 10 km of the station is t2, and the time when it detects the first stroke within 5 km of the station is t3. The change characteristics of the electric field curve at each stage are shown in Figure 3, t4 is the moment when this thunderstorm process enters the extinction phase, and the change of the electric field amplitude is also closely related to the approach of the thunderstorm cloud.
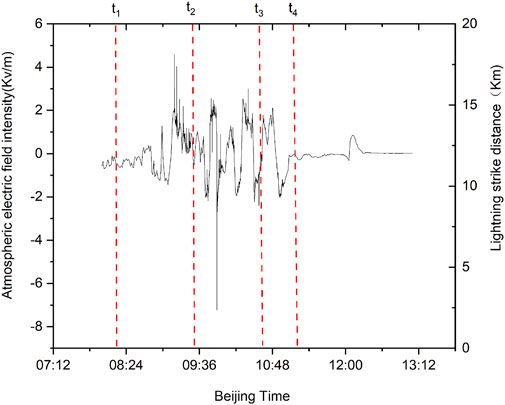
FIGURE 8. Waveform of electric field curve change during a thunderstorm at Nanjing Station on 15 June 2020.
Stage 1: When no thunderstorm cloud or lightning occurs far away from the electric field instrument, the fast-changing jitter of the electric field is mainly around the zero point, and the corresponding change in the amplitude of the electric field is not obvious. The time phase before 08:20 min corresponding to the t1 moment as shown in Figure 8. Stage 2: The t1-t2 time period in Figure 8. The thunderstorm cloud gradually approaches the observation station. Lightning occurs within 15 km, and the electric field amplitude gradually increases with the accumulation of charges gathered at the cloud base. When the leader lightning occurs, the polarity of the electric field reverses rapidly, and then with the further approach of the thunderstorm cloud, the electric field curve shows frequent jumps up and down. It can be seen from Figure 8 that before 08:00, the thunderstorm cloud gradually moves closer to the Nanjing station, and then the electric field increases in the opposite direction. When the thunderstorm cloud reaches the area near the station, the atmosphere has an obvious breakdown discharge phenomenon. The first lightning strike occurs at 08:57, 13.2 km away from the Nanjing station. Five lightning strikes are detected in this stage. The main manifestation is the more obvious needle-like pulse bulge in Figure 8. With the completion of the first charge and discharge, it can be seen from Figure 8 that many positive and negative ground flashes occurred subsequently, and the electric field also showed the characteristics of frequent fluctuation.
Stage 3: The t2-t3 time period and the t3-t4 time period in Figure 8. The thunderstorm cloud continued to develop and moved to the range of 5 km of the electric field instrument, and the electric field curve changed violently. With the approach of the lightning, at 10:34, the lightning locator detected that a lightning strike occurred 4.8 km away from the station. At this time, it entered the stage of thundercloud arrival.
Stage 4: The time period after the moment t4. It is the departure stage of thunderstorm clouds. After a period of oscillation, the amplitude of the ground electric field in this stage gradually returns to the value of the electric field on sunny days, and the thunderstorm process enters the extinction stage. As shown in Figure 8, after 11:04, is the dissipation stage of the thunderstorm cloud. After that, with the passage and departure of the thunderstorm cloud, the fluctuation of the electric field curve will gradually return to the vicinity of the zero axis (Song and Ma, 2008).
5 Analysis of the relationship between lightning and precipitation
5.1 Analysis of the temporal distribution of lightning and precipitation
On 15 June 2020, under the influence of the northeast cold vortex, heavy precipitation occurred in Nanjing, accompanied by strong thunder and lightning activities. It can be seen from the 700 hPa situation field that there is a cold shear of northwest wind and westerly wind between the Yangtze River and the Huaihe River from 20:00 on the 14th. Nanjing is in the westerly jet on the south side of the shear. With the eastward movement of the cold vortex, the northwest wind behind the bottom of the cold vortex strengthened and penetrated southward in the early morning of the 15th, the shear line pressed southward to the line along the Yangtze River, and the southwest jet strengthened to 18 m/s, the relative humidity reached more than 90%, and the water vapor was abundant, corresponding to the beginning of heavy rainfall at this time. The main concentrated period of this severe weather process is from 7:00 to 11:00. Figure 9A shows the hourly distribution of precipitation and lightning at Nanjing Station from 7:00 to 11:00 during this severe convective process. The actual data showed that during this period, the rainfall at Nanjing Station reached the maximum of 40 mm at 7:00; At the same time, 277 times of lightning occurred in this hour, including 204 times of negative CG lightning, accounting for 73.6% of the total number of lightning in this period, which shows that the intensity of negative CG lightning is positively correlated with the precipitation in this strong convection process, which is also consistent with the research results of Chen, (1995) in the hail and gale process in Beijing-Tianjin-Hebei region. The main reason for this phenomenon is that the occurrence and development of lightning and precipitation are closely related to the dynamic and physical processes in the cloud. The charging center in the cloud has a consistent corresponding relationship with the precipitation in some temperature regions in space (Krehbiel et al., 1979).
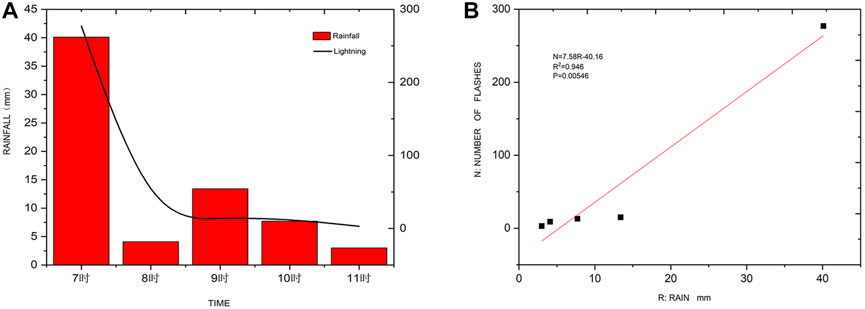
FIGURE 9. Lightning and Precipitation Distribution from 7:00 to 11:00 on 15 June 2020 (A) The Hourly distribution of precipitation and lightning at Nanjing Station from 7:00 to 11:00 on 15 June 2020. (B) A Correlation fitting analysis of precipitation and lightning at Nanjing Station from 7:00 to 11:00 on 15 June 2020.
With the continuous strengthening of the updraft, when the thunderstorm cloud develops to a certain intensity, its strong center can no longer be lifted upward by the upward movement. With the increasing scale of hydrometeors (water droplets, hail, etc.), the strong center begins to show a downward trend. At this time, the upward movement is further weakened and the downward movement appears. At this time, cloud-to-ground lightning is accelerated and active with the decline of hydrometeors carrying a large number of charges. Because the bottom of thunderstorm clouds carries a large number of negative charges, the polarity of cloud-to-ground lightning is mainly negative. From the analysis of the characteristics of the relationship between lightning and precipitation in the process of severe convective weather at Nanjing Station, it can be seen that the characteristic relationship between lightning and precipitation can provide some indicative significance in the forecasting of severe convective weather. It can be seen from the linear fitting diagram (Figure 9B) of the relationship between precipitation and lightning at Nanjing Station from 7:00 to 11:00 on June 15 that the correlation coefficient R2 between precipitation and lightning was 0.946 during the severe convection process, reflecting a close positive correlation between the two. This is related to the relevant scholars (Petersen et al., 1996; Zhou et al., 1999), that is, the intensity of lightning and convective precipitation is consistent in space, and the more frequent the lightning activity is, the greater the convective precipitation is.
To deeply explore the relationship between precipitation and lightning, every hour in the main concentrated period of the severe convective weather process (7: 00–11: 00) is divided by 6 min according to the radar scanning time. The corresponding relationship diagram between precipitation and lightning is obtained by 6 min per hour from 7: 00–11: 00, as shown in Figure 8 a-e. It can be seen that lightning always occurs ahead of heavy rainfall in periods 7, 10, and 11. The main reason for this phenomenon is that in the rapid development stage of thunderstorm clouds, with the continuous strengthening of the updraft, more and more supercooled water will be formed, which will lead to the rapid growth of soft hail, making more collisions between ice crystals and soft hail, thus forming more lightning in this period. When the updraft weakens and the sinking motion strengthens and develops, the surface heavy precipitation and sinking motion become the dominant force of the main body of thunderstorms in this stage.
If the rainfall-lightning ratio (RLR) is used to express the precipitation per unit of lightning. The precipitation of the unit thunderstorm varies with the type of the thunderstorm, local climatic conditions, convective mechanism, and even the frequency of thunderstorms. Even for the same thunderstorm, the temporal evolution of lightning and precipitation is not completely synchronized (Piepgrass et al., 1982; Serge and Serge, 2001), which is also one of the reasons for the large change in precipitation per unit lightning during a thunderstorm. As can be seen from the 6-min distribution of precipitation-lightning at 8:00 and 9:00 in Figure 10, the occurrence time of precipitation and lightning does not show a certain regularity in these two periods, and lightning does not always occur in advance of precipitation.
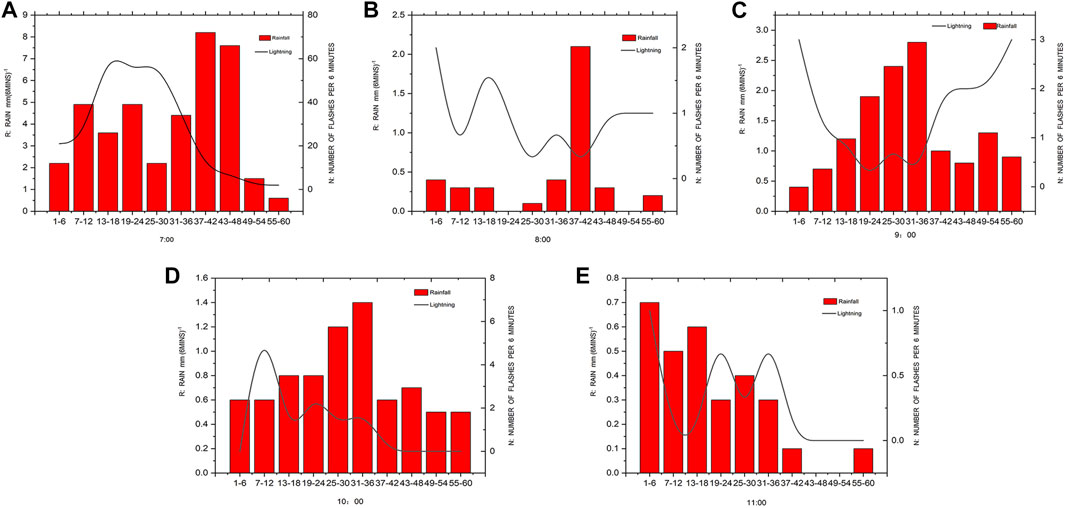
FIGURE 10. Hourly distribution of lightning and precipitation observed every 6 min at different times: (A) 7:00, (B) 8:00, (C) 9:00, (D) 10:00, and (E) 11:00 on 15 June 2020.
5.2 Relationship between lightning warning time and precipitation echo
Figure 11 shows the comparison between the radar echo characteristics of Nanjing Station when the atmospheric electric field instrument alarms at all levels were activated during the severe convective weather on 15 June 2020, and the radar echo characteristics of the first lightning strike when the lightning arrived at each warning area of Nanjing Station. The left column in the figure shows the changed characteristics of the radar echo at the time when the atmospheric electric field instrument sends out the warning at each warning stage of Nanjing Station. The right column in the figure shows the change of the radar echo at the time when the thunderstorm cloud reaches the above warning stage and corresponds to the actual lightning. The lower right corner of the figure indicates the time of each stage.
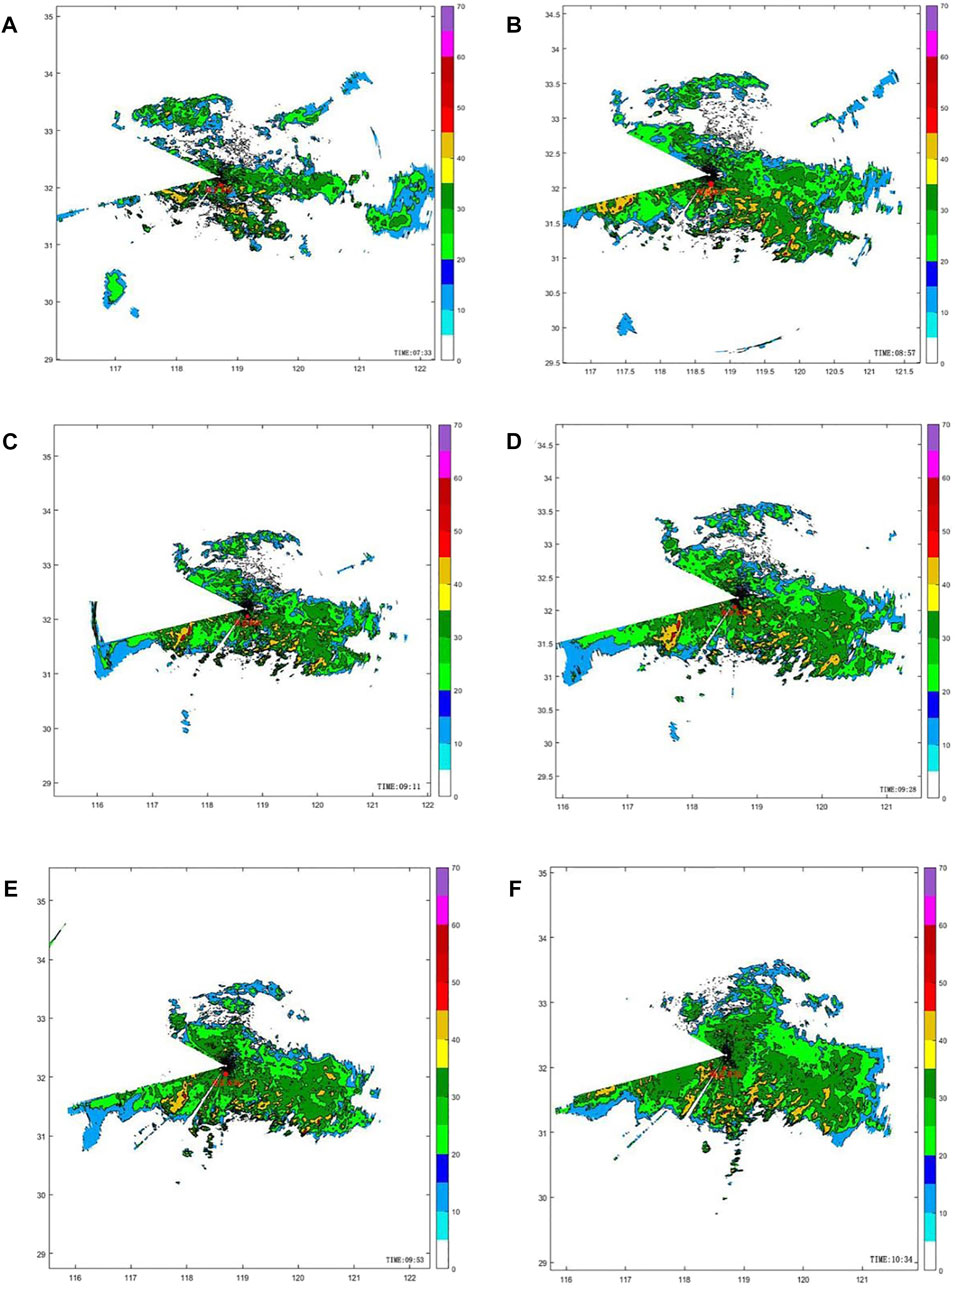
FIGURE 11. Comparison of radar echoes between the warning moment of the atmospheric electric field meter and the actual moment of lightning on 15 June 2020 at Nanjing station. (A): 07:33, radar echoes display in the first warning moment of the atmospheric electric field meter. (C): 09:11, radar echos display in the secondary early warning moment of the atmospheric electric field meter. (E): 09:53, radar echos display in the three level early warning moment of the atmospheric electric field meter. (B): 08:57, the actual moment of the first lightning strike within 15 km of the station. (D): 09:28, the actual moment of the first lightning strike within 10 km of the station. (F): 10:34, the actual moment of the first lightning strike within 5 km of the station.
Table 1 shows the distribution of warning time for the first time of ground flash and electric field meter at all levels in the warning range of 15∼5 km at Nanjing station. It can be seen from the Figure 11 that with the approaching of thunderstorm clouds, a strong echo has been generated and developed near the 15 km range of Nanjing Station before 8:00 in Figure 11A. After 7:30, the atmospheric electric field instrument of the station starts the first-level warning. At this time, the radar echo reflectivity factor of the area where the station is located reaches 16 dBz, and the precipitation echo is further approaching. At 8:57, the first blitzkrieg occurred within 15 km of the station, and the radar echo at the time of the blitzkrieg was relatively strong, reaching 32 dBz.
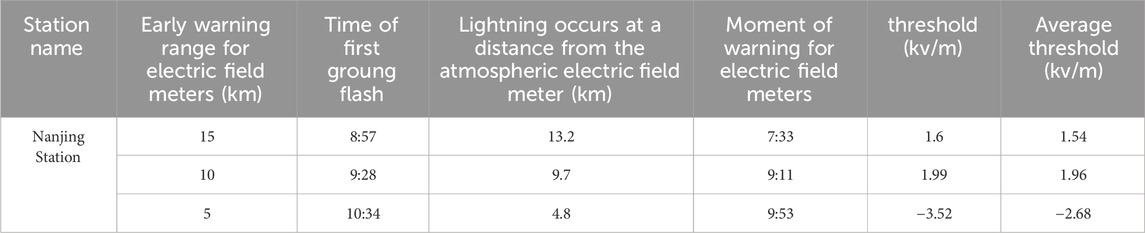
TABLE 1. Distribution of warning time for the first time of ground flash and electric field meter at all levels in the warning range of 15∼5 km at Nanjing Station.
Then the precipitation cloud cluster continued to move toward the station. With its further approach, the atmospheric electric field instrument at Nanjing station started the second level alarm at 9:11. From the echo display in Figure 11B, it can also be found that the radar echo reflectivity factor in the station area reached 30 dBz at this time. Due to its accelerated movement speed, the first blitzkrieg soon occurred at 9:28 within 10 km of the station. When the precipitation cloud cluster moves to a distance of only 5 km from the Nanjing station, the atmospheric electric field instrument of the station starts the third-level alarm at 9:53, and the radar echo reflectivity factor at this time is 25.5 dBz. With the thunderstorm cloud gradually moving away from the observation station, the lightning locator located that the last lightning occurred at 11:04. From the relevant radar echo map, it can be seen that after 11:00, the radar echo in the area where the station is located is also weakened. Corresponding to the fourth stage of the change of the electric field instrument in Figure 5, it can also be seen that this is the extinction stage of a thundercloud. The electric field variation curve also tends to be weakened and close to the zero axis. It can be seen that the characteristics of radar echo parameters at the warning time of each stage of the electric field instrument can play a warning role in the further development of lightning, and lightning and precipitation clouds show a consistent distribution in space.
6 Conclusion and discussion
Combined with hourly precipitation data, radar data, lightning locator, atmospheric electric field meter and other multi-source observation data of automatic weather station on the ground, the lightning characteristics of a severe convective weather process in Nanjing, Jiangsu Province under the influence of northeast cold vortex on 15 June 2020 are analyzed in detail, and the relationship between lightning activity and precipitation is analyzed, and the conclusions are as follows:
(1) A typical heavy rainfall process occurred in Nanjing, Jiangsu Province on 15 June 2020, which was caused by the cold air from the rear of the northeast cold vortex moving southward to the middle and lower reaches of the Yangtze River along the front of the ridge and the rear of the transverse trough, resulting in the convergence of cold and warm air currents along the southern part of Jiangsu Province, accompanied by strong lightning activities. In this severe convective weather process, the period of heavy precipitation corresponds to the period of strong lightning frequency, in which the negative ground lightning is dominant, indicating that the thunderstorm cloud is mainly positive at the top and negative at the bottom.
(2) In the aspect of short-term and imminent warning of the thunderstorm weather process by using the atmospheric electric field instrument, it was found that when the thunderstorm passed through the local thunderstorm electric field in Nanjing mainly showed the characteristics of negative growth, positive and negative alternation, and multi-cell thunderstorm electric field.
(3) When exploring the relationship between precipitation and lightning at Nanjing Station, it is found that the lightning activity and precipitation cloud cluster are consistent in space during the severe thunderstorm process. The more frequent the lightning activity is, the greater the convective precipitation will be. The stronger precipitation period corresponds to the stronger CG lightning frequency period. The correlation coefficient R2 of the relationship between precipitation and lightning at Nanjing Station is 0. 946, which reflects that there is a close positive correlation between them. On this basis, it is also found that the intensity of negative lightning is also positively correlated with the amount of precipitation, which further improves the research results of Petersen et al. (1996) and Zhou et al. (1999) and others.
(4) In this paper, the large-scale circulation background, vertical circulation structure, water vapor transport, unstable energy distribution and the relationship between the characteristics of lightning and precipitation intensity and their occurrence and development in the development stage of a typical thunderstorm process caused by the Northeast Cold Vortex are discussed. We hoped to further understand the characteristics of lightning and its specific relationship with precipitation in the process of strong convective weather in Jiangsu Province under the influence of northeast cold vortex, and then provide some experience reference for the short-term warning service of strong convective weather in Jiangsu Province. However, due to the influence of geographical location, physical parameters in clouds, charge structure, channel characteristics and other factors, the relationship between lightning and precipitation in different weather processes must be different. Due to the limited data, this study only focuses on the analysis of a typical case, and there is still a certain gap in guiding the same type of forecasting services. Therefore, more cases will be accumulated in the future to make a more specific analysis of the relationship between heavy rainfall and lightning activity under this weather background, and then systematically form the precipitation-lightning short-term and imminent warning index under the background of Northeast Cold Vortex in Jiangsu Province.
Data availability statement
The original contributions presented in the study are included in the article/supplementary material, further inquiries can be directed to the corresponding author (d2Vud2VubGl1amlhb0AxNjMuY29t.).
Author contributions
YM: Writing–original draft, Writing–review and editing, Writing–original draft, Writing–review and editing. JL: Writing–original draft, Writing–review and editing, Writing–original draft, Writing–review and editing. YJ: Writing–original draft, Writing–original draft. CL: Writing–review and editing, Writing–review and editing. ZH: Writing–review and editing, Writing–review and editing. QC: Writing–review and editing, Writing–review and editing.
Funding
The author(s) declare that financial support was received for the research, authorship, and/or publication of this article. This work was supported by the General Program of Jiangsu Meteorological Bureau (Grant No. KM201909 and Grant No. KM202310 and KM202409).
Acknowledgments
We acknowledge the support from the General Program of Jiangsu Meteorological Bureau (Grant No. KM201909 and Grant No. KM202310).
Conflict of interest
The authors declare that the research was conducted in the absence of any commercial or financial relationships that could be construed as a potential conflict of interest.
Publisher’s note
All claims expressed in this article are solely those of the authors and do not necessarily represent those of their affiliated organizations, or those of the publisher, the editors and the reviewers. Any product that may be evaluated in this article, or claim that may be made by its manufacturer, is not guaranteed or endorsed by the publisher.
References
Battan, L. J. (1965). Some factors governing precipitation and lightning from convective clouds. J. Atmos. Sci. 22 (1), 79–84. doi:10.1175/1520-0469(1965)022<0079:sfgpal>2.0.co;2
Cao, S., Wang, Y., Tan, J., Zhuang, X., Lu, R., Wei, F., et al. (2023). Application of multi-source data in a tornado process in Jiangsu province. Front.Earth Sci. 11, 1211062. doi:10.3389/feart.2023.1211062
Chapman, R., Marshall, T., Karunarathne, S., and Stolzenburg, M. (2017). Initial electric field changes of lightning flashes in two thunderstorms. J. Geophys. Res. 122 (7), 3718–3732. doi:10.1002/2016JD025859
Chatterjee, C., and Das, S. (2020). On the association between lightning and precipitation microphysics. J. Atmos. Sol. Terr. Phys. 207, 105350. 105350. doi:10.1016/j.jastp.2020.105350
Chen, Z. Z. (1995). Characteristics of cloud-to-ground lightning in hail and thunderstorm wind. Acta Meteorol. Sin. 53 (3), 367–374. (in Chinese)
Christian, H. J., Blakeslee, R. J., Boccippio, D. J., Boeck, W. L., Buechler, D. E., Driscoll, K. T., et al. (2003). Global frequency and distribution of lightning as observed from space by the Optical Transient Detector. J. Geophys.Res. 108 (D1), 4005. doi:10.1029/2002jd002347
Dayeh, M. A., Farahat, A., Ismail-Aldayeh, H., and Abuelgasim, A. (2021). Effects of aerosols on lightning activity over the Arabian Peninsula. Atmos. Res. 261, 105723. doi:10.1016/j.atmosres.2021.105723
Gungle, B., and Krider, E. P. (2006). Cloud-to-ground lightning and surface rainfall in warm-season Florida thunderstorms. J. Geophys. Res. 111, D19203. doi:10.1029/2005JD006802
Guo, F. X., Zhang, Y. J., and Yan, M. H. (2007). Numerical study and observation of the relationship between surface electric field and precipitation in thunderstorm over oinghai-xizang plateau. Plateau Meteorol. 26 (2), 257–262.
Holle, R. L., and Bennett, S. P. (1997). Lightning ground flashes associated with summer 1990 flash floods and streamflow in tucson Arizona: an exploratory study. Mon. Wea. Rev. 125 (7), 1526–1536. doi:10.1175/1520-0493(1997)125<1526:LGFAWS>2.0.CO;2
Holle, R. L., Watson, A. I., López, R. E., Macgorman, D. R., Ortiz, R., and Otto, W. D. (1994). The life cycle of lightning and severe weather in a 3–4 June 1985 PRE-STORM mesoscale convective system. Mon. Wea. Rev. 122 (8), 1798–1808. doi:10.1175/1520-0493(1994)122<1798:tlcola>2.0.co;2
Jin, C. L., Shu, Y., Han, Z. Q., Chen, Q., He, J., and Wang, S. (2022). Lightning disaster risk zoning in Jiangsu province of China based on the analytic hierarchy process and entropy weight method. Front. Environ. Sci. 10, 943000. doi:10.3389/FENVS.2022.943000
Krehbiel, P. R., Brook, M., and McCrory, R. A. (1979). An analysis of the charge structure of lightning discharges to ground. J. Geophys. Res. 84 (5), 2432–2456. doi:10.1029/JC084iC05p02432
Latha, R. (2003). Diurnal variation of surface electric field at a tropical station in different seasons: a study of plausible influences. Earth, Planets Space 55 (11), 677–685. doi:10.1186/bf03352474
Li, X., Song, N. N., Fan, Y. F., Liu, Y. P., Liu, Q., Guan, X. L., et al. (2022). Distribution characteristics and formula revision of lightning current amplitude and cumulative probability in zhejiang province. Front. Environ. Sci. 10, 880113. doi:10.3389/FENVS.2022.880113
Liu, Y. P., Jiang, Y. H., Gao, Q. S., Shi, Z., Jiang, Z. Y., and Hu, J. R. (2022). Characteristic analysis of lightning activities on the Yungui Plateau using ground-based remote sensing. Front. Environ. Sci. 10, 949271. doi:10.3389/FENVS.2022.949271
MacGorman, D. R., and Morgenstern, C. D. (1998). Some characteristics of cloud-to-ground lightning in mesoscale convective systems. J. Geophys. Res. 103 (D12), 14011–14023. doi:10.1029/97jd03221
Petersen, W. A., Rutledge, S. A., and Orville, R. E. (1996). Cloud-to-Ground lightning observations from TOGA COARE: selected results and lightning location algorithms. Mon. Wea. Rev. 124 (4), 602–620. doi:10.1175/1520-0493(1996)124<0602:CTGLOF>2.0.CO;2
Piepgrass, M. V., Krider, E. P., and Moore, C. B. (1982). Lightning and surface rainfall during Florida thunderstorms. J. Geophy. Res. 87 (13), 11193–11201. doi:10.1029/jc087ic13p11193
Pustovalov, K. N., and Nagorskiy, P. M. (2018). Response in the surface atmospheric electric field to the passage of isolated air mass cumulonimbus clouds. J. Atmos. Sol. Terr. Phys. 172, 33–39. doi:10.1016/j.jastp.2018.03.008
Qie, X., Kong, X., Zhang, G., Zhang, T., Yuan, T., Zhou, Y., et al. (2005). The possible charge structure of thunderstorm and lightning discharges in northeastern verge of Qinghai–Tibetan Plateau. Atmos. Res. 76 (1-4), 231–246. doi:10.1016/j.atmosres.2004.11.034
Qie, X. S., Zhang, T. L., Zhang, G. S., Zhang, T., and Kong, X. Z. (2009). Electrical characteristics of thunderstorms in different plateau regions of China. Atmos. Res. 91 (2-4), 244–249. doi:10.1016/j.atmosres.2008.04.014
Rakov, V. A., and Uman, M. A. (2003). Lightning: physics and effects. Cambridge,UK: Cambridge University Press.
Sabri, M. H. M., Ahmad, M. R., Esa, M. R. M., Periannan, D., Lu, G., Zhang, H., et al. (2019). Initial electric field changes of lightning flashes in tropical thunderstorms and their relationship to the lightning initiation mechanism. Atmos. Res. 226, 138–151. doi:10.1016/j.atmosres.2019.04.013
Serge, S., and Serge, C. (2001). Some aspects of the correlation between lightning and rain activities in thunderstorms. Atmos. Res. 56 (1), 355–373. doi:10.1016/s0169-8095(00)00086-7
Shen, F., Song, L., He, Z., Xu, D., Chen, J., and Huang, L. (2023). Impacts of adding hydrometeor control variables on the radar reflectivity data assimilation for the 6–8 August 2018 mesoscale convective system case. Atmos. Res. 295, 107012. doi:10.1016/J.ATMOSRES.2023.107012
Shen, F., Song, L., Li, H., He, Z., and Xu, D. (2022). Effects of different momentum control variables in radar data assimilation on the analysis and forecast of strong convective systems under the background of northeast cold vortex. Atmos. Res. 280, 106415. doi:10.1016/j.atmosres.2022.106415
Shen, F., Xu, D., Li, H., and Liu, R. (2021). Impact of radar data assimilation on a squall line over the Yangtze-Huaihe River Basin with a radar reflectivity operator accounting for ice-phase hydrometeors. Meteorol. Appl. 28 (2), 1967. doi:10.1002/MET.1967
Shi, Y. L., Luo, Z. X., Chen, X. G., Zhang, Q., Liu, Y., and Liu, C. (2023). Effects of joint assimilation of FY-4A AGRI and ground-based microwave radiometer on heavy rainfall prediction. Front. Environ. Sci. 11, 1083517. doi:10.3389/FENVS.2023.1083517
Simmonds, I., Bi, D., and Hope, P. (1999). Atmospheric water vapor flux and its association with rainfall over China in summer. J. Clim. 12 (5), 1353–1367. doi:10.1175/1520-0442(1999)012<1353:awvfai>2.0.co;2
Song, J. J., and Ma, Q. M. (2008). Development of DNDY surface electric field instrument and research on lightning monitoring and warning based on electric field data fusion. Beijing: Center for Space Science and Applied Research, Chinese Academy of Sciences, 40–41.
Song, T., Xu, D., Shen, F., Shu, A., and Song, L. (2023). Forecast and analysis of a rainstorm case in east China based on the blown-up theory. Atmosphere 14 (10), 1508. doi:10.3390/ATMOS14101508
Van, L. N., Le, X. H., Nguyen, G. V., Yeon, M., May, D. T. T., and Lee, G. (2022). Comprehensive relationships between kinetic energy and rainfall intensity based on precipitation measurements from an OTT Parsivel2 optical disdrometer. Front. Environ. Sci. 10, 985516. doi:10.3389/FENVS.2022.985516
Wang, J., Zhou, S. D., Yang, B., Meng, X., and Zhou, B. H. (2016). Nowcasting cloud-to-ground lightning over Nanjing area using S-band dual-polarization Doppler radar. Atmos. Res. 178-179, 55–64. doi:10.1016/j.atmosres.2016.03.007
Zhang, R. H. (2001). Relations of water vapor transport from Indian monsoon with that over east asia and the summer rainfall in China. Adv. Atmos.Sci. 18 (5), 1005–1017. doi:10.1007/BF03403519
Zhang, T. L., Zhao, G., Wei, C. X., Gao, Y., Yu, H., and Zhou, F. C. (2015). Relationships between cloud-to-ground flashes and hydrometeors in a thunderstorm in Fujian province. J. Atmos. Sol. Terr. Phys. 154, 226–235. doi:10.1016/j.jastp.2015.11.007
Zhang, Y. J., Ge, Z. M., and Chen, Z. P. (1998). Electrical characteristics of atmosphere in east area of oinghai-xizang plateau. Plateau Meteorol. 17 (2), 135–141.
Zhang, Y. J., Hua, G. Y., Yan, M. H., and An, X. M. (1995). The correlation analysis of electric activity, convection and precipitation in convective cloud and stratus. Plateau Meteorol. 14 (4), 396–405.
Zhao, H., Shu, Y., Mao, Y. Q., Liu, Y., and Yu, K. (2023). The assimilation effect of multi-new types observation data in the forecasts of meiyu-front rainstorm. Front. Rainstorm. Atmos. 14 (4), 693. doi:10.3390/atmos14040693
Zhou, J. J., Qie, X. S., Zhang, Y. J., Ge, Z. M., Chu, R. Z., Zhang, H. F., et al. (1999). Analysis of the relationship between cloud-to-ground lightning and precipitation in convective weather systems. Chin. J. Meteorology 57 (1), 103–111.
Keywords: northeast cold vortex, pelting rain, electric field characteristics, lightning, warning
Citation: Mao Y, Liu J, Jiang Y, Li C, Han Z and Chen Q (2024) Analysis of lightning activity characteristics and its relationship with precipitation in a strong convective weather process in Jiangsu Province. Front. Environ. Sci. 12:1375623. doi: 10.3389/fenvs.2024.1375623
Received: 24 January 2024; Accepted: 04 March 2024;
Published: 14 March 2024.
Edited by:
Feifei Shen, Nanjing University of Information Science and Technology, ChinaReviewed by:
Li Xia, Nanjing University of Information Science and Technology, ChinaGuo Guo, Nanjing University of Information Science and Technology, China
Copyright © 2024 Mao, Liu, Jiang, Li, Han and Chen. This is an open-access article distributed under the terms of the Creative Commons Attribution License (CC BY). The use, distribution or reproduction in other forums is permitted, provided the original author(s) and the copyright owner(s) are credited and that the original publication in this journal is cited, in accordance with accepted academic practice. No use, distribution or reproduction is permitted which does not comply with these terms.
*Correspondence: Jiao Liu, d2Vud2VubGl1amlhb0AxNjMuY29t; Youshan Jiang, anlzbmpzcXh0QDE2My5jb20=