 Xueguang Ma
 Zhihan Lin*
- Zhou Enlai School of Government, Nankai University, Tianjin, China
Since the 21st century, the world has increasingly focused on the issue of sustainable development, and the green transformation issues have become a new hot topic worldwide. Green and low-carbon transformation has become an international consensus. Urban agglomerations are important connections between urban development and regional coordination, as well as important spatial carriers for economic activities. They are not only the main source of carbon emissions, but also the main battlefield for energy conservation and emission reduction. As an important field for carbon reduction, the green transformation of cities is crucial for achieving the “dual carbon” goals. This article focuses on 48 cities in the three most mature and influential urban agglomerations in China from 2011 to 2019, namely, the Beijing-Tianjin-Hebei urban agglomeration, the Yangtze River Delta urban agglomeration, and the Pearl River Delta urban agglomeration. The three-stage DEA model and Malmquist index model are used to measure the green transformation efficiency of the three urban agglomerations from both dynamic and static perspectives, and a Tobit regression model is constructed to explore the influencing factors of green transformation efficiency in urban agglomerations. Research has found that: 1) From a static perspective, the overall efficiency of green transformation in the three major urban agglomerations is at a high level, but from a temporal perspective, it shows a downward trend. The Pearl River Delta urban agglomeration is known for its green development, with the highest average efficiency of green transformation, followed by the Yangtze River Delta urban agglomeration. The Beijing-Tianjin-Hebei urban agglomeration has the lowest level of green transformation; 2) From a dynamic perspective, technological progress is the main driving factor for improving the efficiency of green transformation in the three major urban agglomerations. Therefore, the government should pay special attention to the progressiveness of technology when formulating relevant policies to promote urban green transformation; 3) From the perspective of spatiotemporal differences, there are significant differences in the spatiotemporal characteristics of green transformation among the three major urban agglomerations, and there are significant differences in green transformation strategies among different urban agglomerations. Eliminating environmental factors and random interference is necessary for accurately measuring the efficiency of green transformation in urban agglomerations; 4) From the perspective of influencing factors, factors such as industrial structure upgrading, green innovation level, and environmental regulation intensity jointly affect the efficiency of green transformation in urban agglomerations. Based on this, we should pay attention to the differences between urban agglomerations and implement policies tailored to local conditions; Strengthen the network system of urban agglomerations and avoid conflicts between cities; Encourage green technology innovation, accelerate industrial structure upgrading, and so on. This article focuses on the issue of green transformation in urban agglomerations, and conducts research from three perspectives: efficiency measurement, influencing factors, and implementation mechanisms. A relatively systematic theoretical framework for green transformation in urban agglomerations is formed, and an evaluation index system for green transformation efficiency in urban agglomerations is constructed and optimized. The composition mechanism of the five dimensional evaluation system for transformation efficiency is analyzed, and the bottleneck and breakthrough direction of the three major urban agglomerations in China in the development process are grasped. It has a good demonstration effect on the green transformation of other urban agglomerations.
1 Introduction
Today China’s economic development has entered the New Normal, facing the challenges of speed change and structural adjustment. Economic development is hard constrained by resources and environment. The old model of “high input, high pollution” is no longer suitable for the challenges of high-quality development in the new era of China, and does not conform to China’s image of a big country that is responsible for the world and ecology. In the process of globalization, previous studies revealed the distinct possibility that the 21st century will witness an urbanization—primarily in developing countries—that proceeds on a scale more massive than has ever been seen before (Masanobu Kii, 2021), suggesting that alternative urban-policy strategies may be needed for long-term sustainability. China has realized that as a major economic development country and energy consuming country, it needs to shoulder greater responsibilities. The importance and urgency of green transformation are self-evident, and exploring the path of China’s green transformation is urgent.
Transformation is one of the important branches of development economics research, and the topic of transformation has been the most concerned research focus in the entire economic community for nearly half a century. Both the” Transition and Economics “written by a Belgian economist Gérard Roland (2002), and the” Theory of Transformation and Development “written by a Chinese economist Li Yining (1996) have provided a relatively complete description of the relevant issues of transformation. In the early stages, discussions on urban transformation often emerged alongside research on economic system transformation. Stark and Bruszt (1998) linked urban transformation with a large-scale process of institutional change, in fact referring to the transformation of economic system patterns. However, in recent years, there have been development constraints on resources and environment around the world, especially when the financial crisis affected the development of some resource-based cities. Not only has the development of traditional resource-based cities been difficult, but also the development of some economically sustainable cities has been frequently hindered. Therefore, the concept of green development and green transformation is gradually emerging, becoming a new breakthrough in urban economic development. Zhu Yuan (2020) pointed out that green transformation is a break from the previous model of relying solely on material scale extension to drive economic development. Instead, it constantly changes the trend of economic development while ensuring a good ecological environment. Li Zuojun (2012) believes that green transformation will become a new economic development model, shifting from resource waste and ecological environment destruction to a model of resource recycling and ecological environment friendly development. Collier et al. (2013) conducted research based on urban climate characteristics, urban facility utilization, and constraints on urban expansion, and pointed out that the use of collaborative methods can promote green and sustainable development of cities. Artmann et al. (2019) analyzed the limitations of spatial transformation on urban green development and proposed that the expansion of cities can be constrained by developing compact cities. At the same time, some foreign institutions, including Siemens (2019), have established the “Green City Index” to measure the green level of urban environmental development by dividing it into specific indicators such as carbon dioxide concentration, energy, transportation, waste, water, air, etc., and have launched tools to measure the green level of urban environmental development. Pan Haozhi et al. (2024a) examine the impacts of polycentricity as well as features of its spatial configurational on urban agglomeration efficiency, and develop an IRT-LI method to identify urban centers and sub-centers. And there are still the following areas that need to be expanded: In terms of research objects, there is a lack of comparison between multiple urban agglomerations, and there is no intersection, mixing, or integration of factors from different fields to obtain the effects, influencing factors, and specific paths of urban green transformation; In terms of research methods, common methods such as spatial Durbin model, SBM-DEA model, and DDF-SBM cannot eliminate external environmental and statistical noise interference factors in urban green transformation (Yuan Huaxi, 2020), and there is controversy over the reliability and authenticity of evaluation results; In terms of research content, the existing evaluation index system is not yet perfect.
Urban agglomerations utilize the advantages of agglomeration factors to achieve economic growth, but have not yet changed the previous inefficient and highly polluting extensive development model. Behind economic growth is the waste of resources and the displacement of the ecological environment (Jamsson A, 2013; Guo Yanhua et al., 2020). The economic benefits are often obvious, but the problem of ecological degradation accumulates over time, which reflects the importance of addressing the contradiction between economic development and environmental protection in urban agglomerations (Verhoef and Nijkamp, 2002). The relationship between environmental damage and urban agglomeration is a complex theoretical and empirical issue, on the one hand, urban agglomeration advantages may favour environmental quality, city size is by no means a negative predictor of environmental quality (Kourtit et al., 2020). On the other hand, agglomeration provides a key mechanism for the success of manufacturing, but it also generates negative environmental externalities (Pan Haozhi et al., 2024b). With external capital investment, significant resource consumption, transportation infrastructure installation, and the migration of environmentally polluting enterprises, it is more likely to exacerbate the pressure on regional ecosystems, leading to increasingly serious problems such as environmental pollution, land scarcity, and carbon emissions, resulting in more severe ecological externalities (Huang Yin et al., 2020b; Zhong Jing et al., 2021). At present, China has planned to construct 19 urban agglomerations, among which the three major urban agglomerations of Beijing-Tianjin-Hebei urban agglomeration (BTH), Yangtze River Delta urban agglomeration (YRD), and Pearl River Delta urban agglomeration (PRD) are in a leading position in the development of urban agglomerations in China. They are the most densely populated, economically developed, and well-constructed regions in China, representing the current level and future development direction of urban agglomerations in China. Studying the efficiency and influencing factors of its green transformation can objectively and accurately grasp the bottlenecks and breakthrough directions of China’s three major urban agglomerations, which has a good demonstration effect on the green transformation of other urban agglomerations (Yang Yuying et al., 2019; Fan Fei et al., 2021). This article focuses on the issue of green transformation in urban agglomerations, and conducts research from three perspectives: efficiency measurement, influencing factors, and implementation mechanisms. A relatively systematic theoretical framework for green transformation in urban agglomerations is formed, and an evaluation index system for green transformation efficiency in urban agglomerations is constructed and optimized. The composition mechanism of the five dimensional evaluation system for transformation efficiency is analyzed, and the bottleneck and breakthrough direction of the three major urban agglomerations in China in the development process are grasped. At the same time, it also provides a reference for the world to apply relevant theories to solve national practical problems, thereby improving the competitiveness and ecological environment of urban agglomerations, developing the economy and revitalizing them.
2 Material and methods
2.1 Model construction
(1) Three-Stage DEA Model
The three-stage DEA method was proposed by Fried et al. The essence of the model is to initially measure the efficiency of the research object in the first stage, and then introduce SFA regression analysis to isolate the impact of Confounding, so that the real efficiency value of green transformation can be measured in the third stage.
Stage 1: Traditional DEA-BCC model.
Where
Stage 2: Similar to SFA model.
Among them, Snm is the input relaxation variable, fm(zn, βm) is the corresponding random frontier function, and zn=(z1n,z2n, … zkn)represents external environmental factors, βm is the corresponding coefficient; vnm + unm is a mixed residual term, vnm representing random error and vnm
Since Fried did not explicitly give a formula for separating management inefficiency terms in his research, this paper uses the management inefficiency formula proposed by Jondrow (2012) to calculate the Estimator of unm and vnm. The separation formula is obtained as follows: γ = σ2u+σ2v/σ2u, the closer the γ is to 0, the greater the impact of random error; The closer the γ is to 1, the greater the impact of management inefficiency.
Stage 3: Adjusted DEA model. By applying the DEA-BCC model again to calculate the efficiency of the input variables and original output variables adjusted by SFA regression, the actual value of the green transformation efficiency of urban agglomerations, excluding external environmental factors and random errors, can be obtained. At this time, the actual efficiency value calculated is more rigorous and accurate compared to the results of the first stage.
(2) Malmquist Index Model
Due to the limitations of the three-stage DEA model, it is not possible to measure the dynamic trend of cross cycle efficiency values of decision-making units. Based on this, the Malmquist index model is introduced to evaluate the dynamic efficiency of green transformation in urban agglomerations.
According to the Malmquist index decomposition method proposed by Fare et al. (1994), if there are r decision units, t+1 periods, Xrt represents the input level of decision unit r in period t, Yrt represents the output level of decision unit r in period (
(3) Tobit Model
The Tobit model, also known as the truncated regression model or censored regression model, can be used as a type of limited dependent variable regression due to some observations having values of 0, although the values of the dependent variable are generally continuous numerically. Restricted dependent variable regression can be used to determine whether a specific dependent variable is related to another specific observation, and can determine whether the dependent variable will be affected by other factors based on these observations. This model was first proposed by James Tobin, the Nobel laureate in economics. At first, it was only used to analyze the expenditure of household durable goods. Later, it was gradually expanded to a variety of situations and was widely used.
The basic form of the Tobit model is as follows:
In this equation, Yi is the restricted dependent variable of the i group of samples, and Xi is the explanatory variable, β is a vectorized expression of variable parameters, where the random disturbance term μi follows a normal distribution,
The model can also be simplified as follows:
2.2 Variables and data
(1) Sample Selection
By 2019, the planning and layout of 19 urban agglomerations in China have been completed, and a new regional development model with urban agglomerations as the core for growth has been gradually implemented. Among them, the BTH, YRD, and PRD, relying on their unique geographical advantages and political preferences, have developed ahead of other urban agglomerations and become the most international and representative urban agglomerations in China. The BTH, YRD, and PRD are pioneers in China’s development. They have a clearer definition of concepts and policy planning, and have relatively close cooperation in various aspects such as actual economy and technology. Compared to other urban agglomerations that are in the planning or concept proposal stage, selecting these three major urban agglomerations as research objects is representative. Therefore, based on the national planning and the actual development of the eastern coastal urban agglomeration, this paper selects 48 cities in the BTH, YRD, and the PRD as the research objects, as shown1 in Figure 1.
(2) Indicators and Data Sources
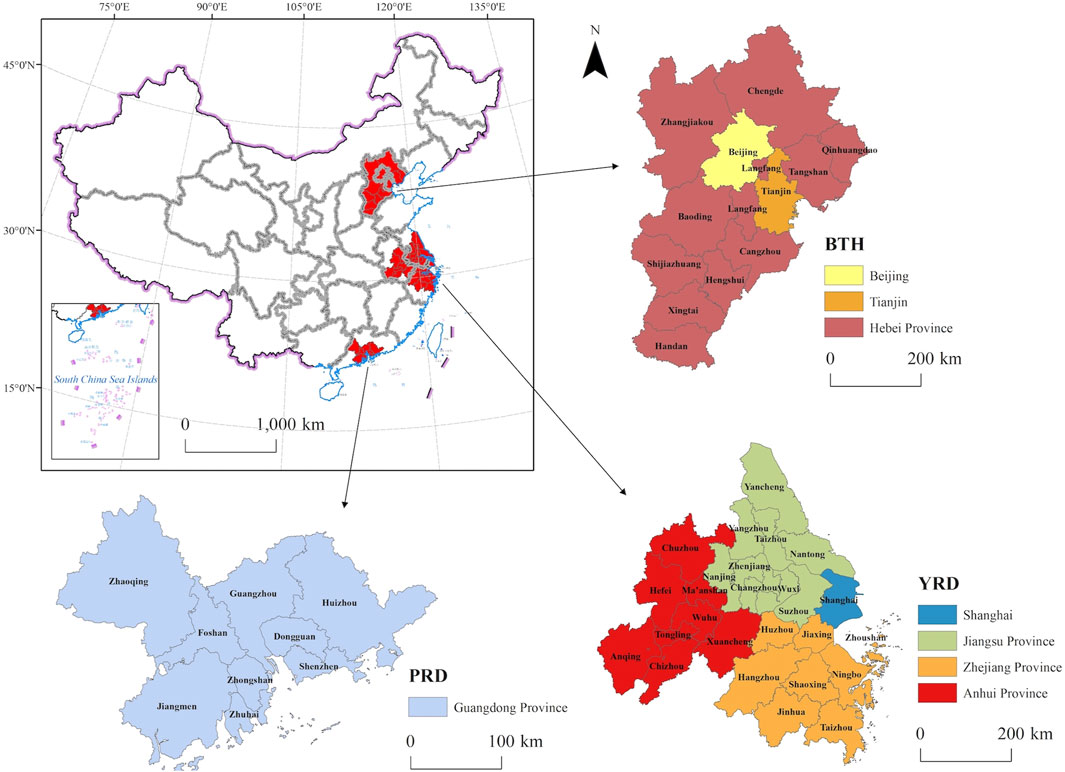
Figure 1. Geographical distribution map of the three major urban agglomerations in China.
Based on the existing research results and the dynamic behavior perspective of the implementation of green transformation in the three urban agglomerations, this paper determines the input variables of green transformation in the three urban agglomerations from the three dimensions of human investment, capital investment and land investment. These dimensions are represented by three indicators: total green investment, total green talents and green area.
Based on the basic connotation of the concept of green transformation, and ultimately realize the harmonious development of human, nature, economy and society, the output variables of this study are determined from five dimensions, including economic growth, industrial transformation, resource conservation, environmental friendliness and people’s livelihood improvement. In this study, seven indicators are used, namely, GDP growth rate, the proportion of added value of the tertiary industry, energy consumption per unit of GDP, per capita disposable income of urban residents, per capita green space area of urban parks, sulfur dioxide emissions and comprehensive utilization rate of industrial solid waste, which represent the above dimensions.
As for environmental variables, considering the impact of external factors such as economic and social factors, economic structure, energy consumption structure and technological innovation level are selected as the external environmental variables affecting the green transformation of urban agglomerations. These external variables are measured by three indicators: the proportion of added value of the secondary industry, the proportion of coal consumption in comprehensive energy consumption, and the number of patents approved per capita.
Therefore, the green transformation efficiency evaluation system of the three urban agglomerations preliminarily constructed in this paper is shown in Table 1. The selection of indicators follows the principles of comprehensiveness, balance, rationality and availability.
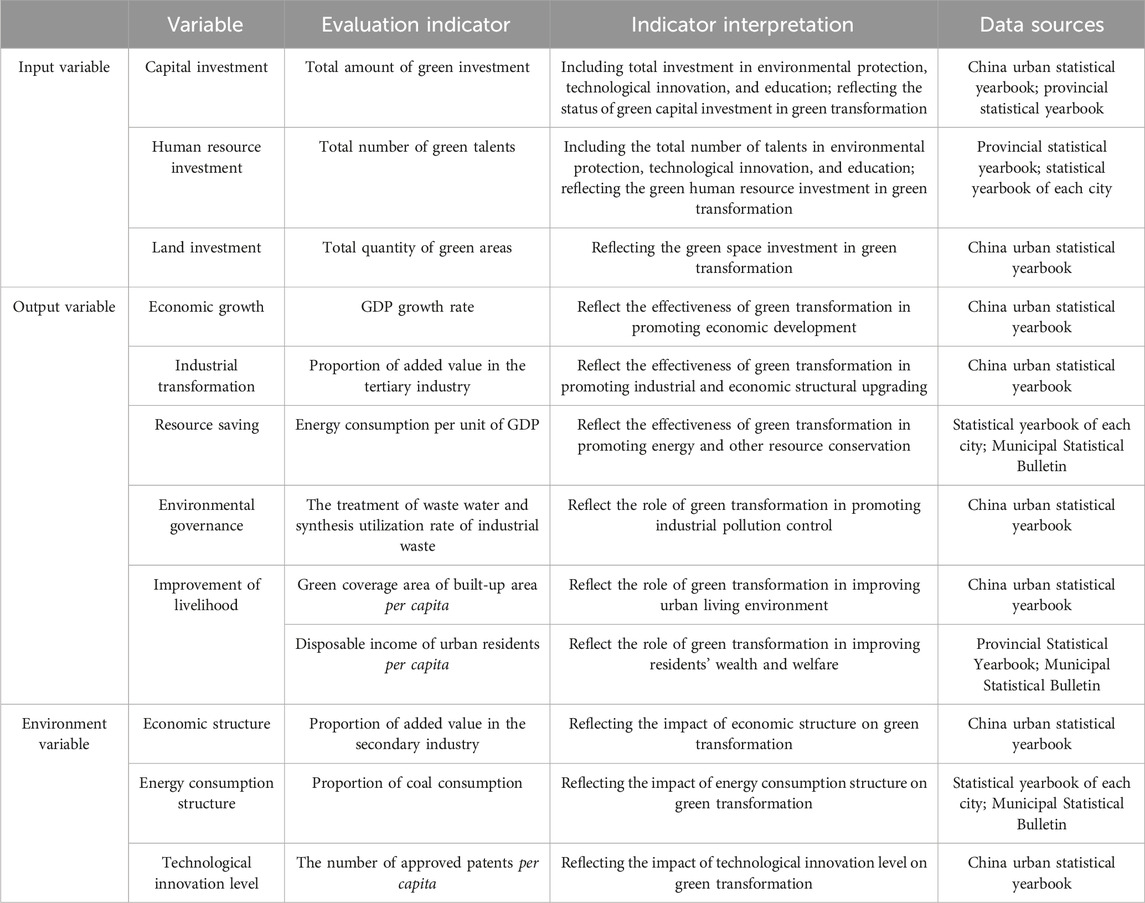
Table 1. Index system for measuring green transformation efficiency of three major urban agglomerations in China.
Considering the completeness and availability of data, as well as the significant impact of the pandemic fluctuations on research data from 2020, this article selects statistical data from the three major urban agglomerations in China from 2011 to 2019. The relevant data in the study comes from the statistical systems of various levels of government in China, including the China Urban Statistical Yearbook, Provincial Statistical Yearbook, Urban Statistical Yearbook, and National Economic and Social Development Statistical Bulletin. Some missing data is supplemented using interpolation method. Some index data are indirect data, which are calculated from the original data (Table 2).
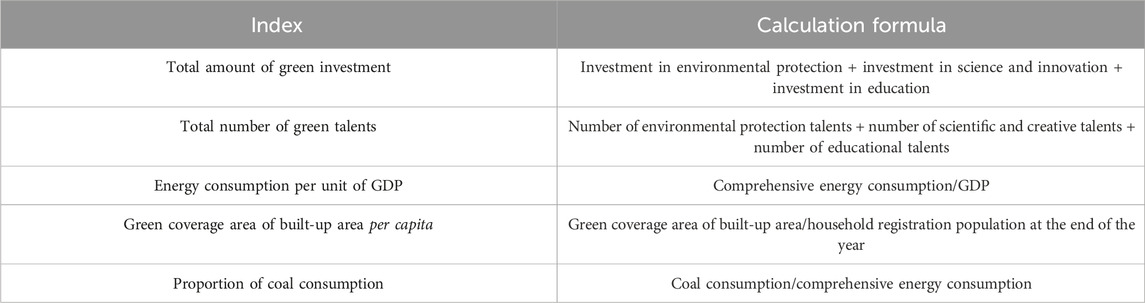
Table 2. Indicator calculation formula.
In scholars’ research on the influencing factors of urban green transformation, it is generally believed that factors such as industrial structure, technological progress, and institutional environment are closely related to urban green transformation. The industrial structure upgrade can further promote regional coordinated green development and high-quality development (Li Zihao and Mao jun, 2018; Peng Jizeng et al., 2020). Green innovation level is conducive to promoting the development of green economy in cities (LOREK S, 2014; Feng et al., 2019). Environmental regulatory measures will significantly increase the operating costs of enterprises, resulting in a “crowding out effect” and ultimately inhibiting urban green transformation (Yin et al., 2015). A sound infrastructure construction is the prerequisite and foundation for promoting urban green transformation (Wang et al., 2022). Most developed countries will transfer local high energy consuming and high emission enterprises to developing countries to suppress regional green development (Wu Chuanqing and Song Xiaoxiao, 2018). Referring to these studies and based on the principle of accessibility of statistical data, this article selects 5 influencing factors from two aspects: government dominant factors and objective environmental factors for analysis. From the perspective of government management, the upgrading of industrial structure, the level of green innovation, and the intensity of environmental regulations are selected as the government leading factors affecting the green transformation of urban agglomerations. From the perspective of external environment, infrastructure construction and the degree of openness are selected as objective environmental factors affecting the green transformation of urban agglomerations.
The key variables selected in this article are as follows (Table 3):
① Explanatory variable: urban green transformation. Measure the static efficiency value of green transformation in urban agglomerations.
② Explanatory variable: a. Industrial structure upgrade (ISU). Measured by the proportion of the tertiary industry in the city’s GDP. b. Green innovation level (GIL). Measured by the number of R&D personnel in the city. c. Environmental regulation intensity (ERI). Measured by the amount of industrial wastewater discharge in the city. d. Infrastructure construction (IC). Measured by the per capita postal and telecommunications business volume in the city. e. The extent of openness to the outside world (FDI). Measured by the total amount of foreign direct investmentin cities.
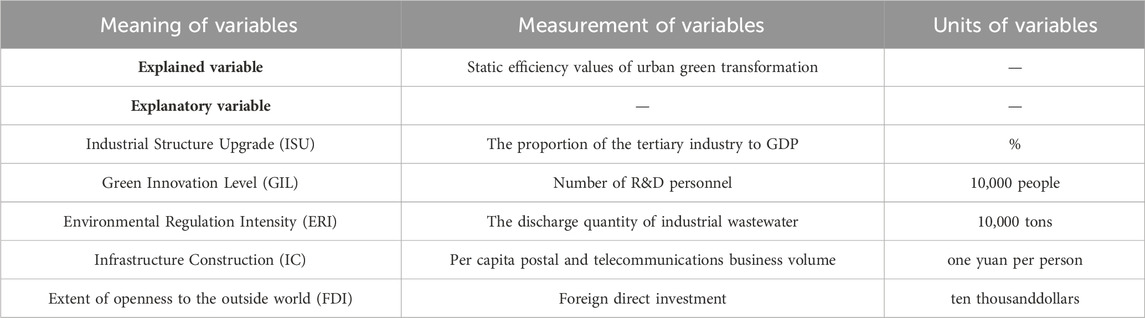
Table 3. Explanation of influencing factors and variables.
3 Empirical results
3.1 Static efficiency evaluation results
(1) Comprehensive efficiency evaluation results in the first stage
Firstly, the input-oriented BCC model was used to calculate the comprehensive efficiency of green transformation in 48 cities of China’s three major urban agglomerations (Table 4).
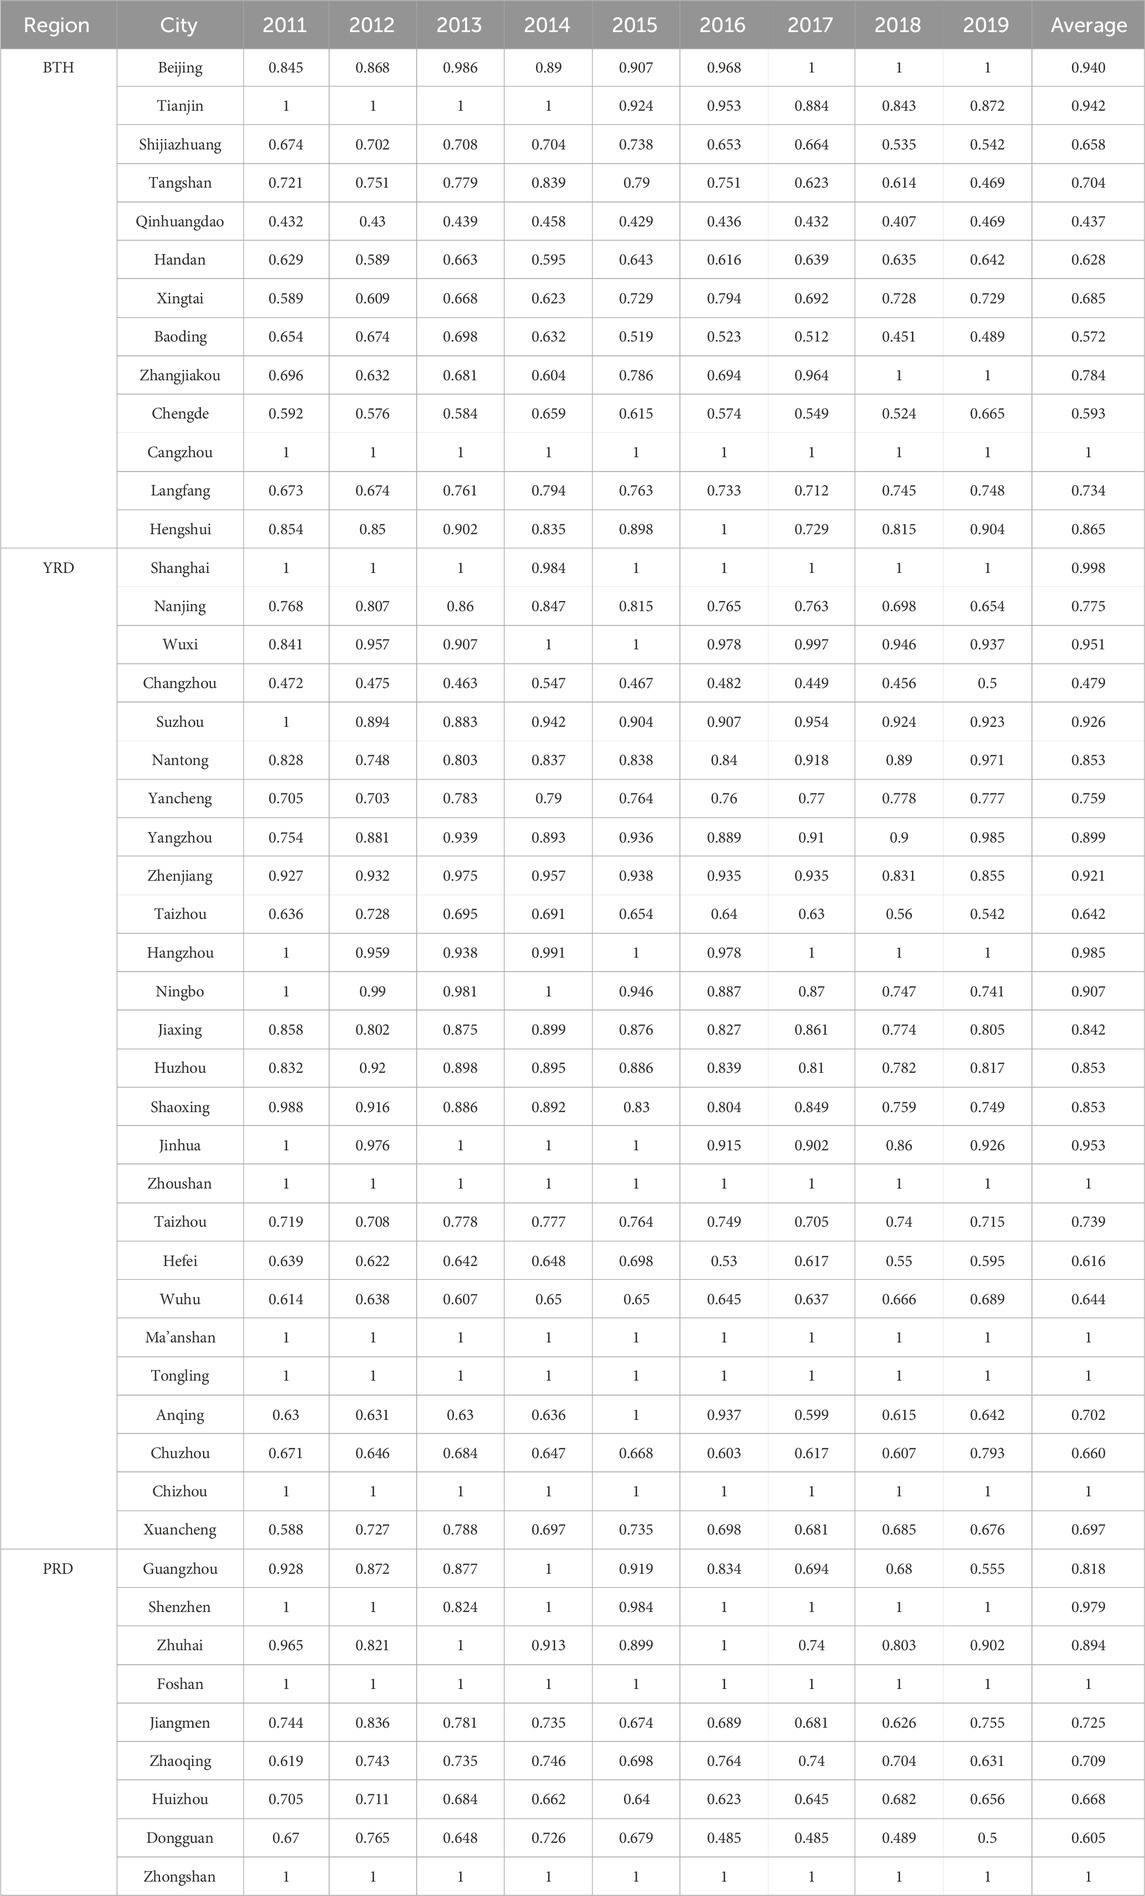
Table 4. Comprehensive efficiency of green transformation in China’s three major urban agglomerations from 2011 to 2019.
According to Table 4, among the three major urban agglomerations from 2011 to 2019, the green transformation efficiency of 48 cities in China’s three major urban agglomerations was almost all above 0.6, indicating that the overall green transformation level of the three major urban agglomerations is relatively high; Among them, the average comprehensive efficiency of green transformation in seven cities, Cangzhou, Zhoushan, Ma’anshan, Tongling, Chizhou, Foshan, and Zhongshan, reached 1, which is the highest among all comprehensive efficiency results, indicating that their green transformation level is superior to other cities. Among these seven cities with a comprehensive efficiency of 1, four are located in the YRD; Although the average efficiency values of green transformation in most cities are between 0.6 and 1, the efficiency values of Qinhuangdao City are 0.437, Baoding City is 0.572, Chengde City is 0.593, and Changzhou City is 0.479. They are the four cities with efficiency values below 0.6 among all cities. Qinhuangdao City, Baoding City, and Chengde City are located in the BTH, while Changzhou City is located in the YRD; In addition, although the overall green transformation comprehensive efficiency values of 48 cities in China’s three major urban agglomerations were relatively high from 2011 to 2019, the time trend is not optimistic. The average green transformation efficiency values of the YRD and PRD show a downward trend, while the efficiency values of the BTH have not changed much, but are at a lower level compared to the other two urban agglomerations. Overall, the PRD is known for its green development, with the highest average efficiency value of green transformation. This result has also been reflected in the research of other scholars or institutions, such as the “National New Urbanization Report 2016"; Secondly, the YRD has a similar level of green transformation to the PRD, as it covers multiple provinces and has always been a prosperous place with the highest economic output. At the same time, it is also a livable place with a good ecological environment; The BTH is centered around the two major super cities of Beijing and Tianjin, promoting the coordinated development of the urban agglomeration. However, the two cities’ dominant development has not achieved good agglomeration and central radiation effects. The above results indicate that the overall level of green transformation comprehensive efficiency in 48 cities of China’s three major urban agglomerations is relatively high, but it shows a slight downward trend in terms of time trend. Therefore, it is necessary to take more action plans to continuously improve the green transformation efficiency of cities.
Specifically, the comprehensive efficiency values of green transformation in the three major urban agglomerations from 2011 to 2019 were plotted as a line chart, as shown in Figure 2.
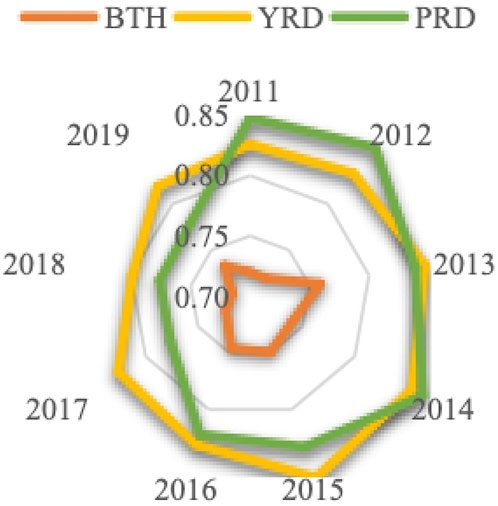
Figure 2. Trends in the comprehensive efficiency of green transformation in China’s three major urban agglomerations from 2011 to 2019.
There are significant differences in the comprehensive efficiency of green transformation among the three major urban agglomerations in China. Overall, the comprehensive efficiency of green transformation in the YRD and PRD is significantly higher than that in the BTH, both ranging from 0.75 to 0.9, indicating that the actual effect of green transformation in the YRD and PRD is good. However, the overall efficiency fluctuation of green transformation in the BTH is not significant, stable at around 0.73. Before 2014, the green transformation efficiency of the PRD was very high, but it began to sharply decline after reaching its peak in 2014 and reached its lowest level in 2018; The green transformation efficiency of the YRD slowly increased from 2011 to 2015, and also began to decline slightly after reaching its peak in 2015; The fluctuation trend of the BTH is not obvious. However, overall, the green transformation efficiency of the three major urban agglomerations showed a trend of first increasing and then decreasing between 2011 and 2018. However, after reaching the lowest level in 2018, the green transformation efficiency values of the three major urban agglomerations showed a significant rebound in 2019.
(2) Impacts of external environmental factors on the green transformation efficiency in the second stage
In order to eliminate the effects of random disturbances and inefficient management, and make the measured efficiency of green transformation in urban agglomerations more reasonable and reliable, the SFA method was conducted, and the results are shown in Table 5.

Table 5. SFA estimation results.
The results indicate that the three relaxation variables include the total amount of green investment, the total number of green talents, and the relaxation values of green area are all greater than 0.5. Based on the influence of three environmental factors, the unilateral error LR test results are all greater than the significant values of the mixed chi square distribution test. All four models are valid, indicating that the SFA method is effective in separating environmental impacts, statistical noise, and managing inefficiency. Specifically:
1) The proportion of added value in the second industry: The coefficients of the proportion of added value in the second industry in Model 1 and Model 3 are both negative and significant at the 1% significance level, while the coefficients in Model 2 are positive and significant at the 5% significance level. This indicates that an increase in the proportion of added value in the secondary industry will lead to a decrease in the total green investment and green area, while also leading to an increase in the total number of green talents.
2) Coal consumption proportion: All coefficients of coal consumption proportion are positive and significant at the significance level of 5%. This indicates that an increase in the proportion of coal consumption will lead to an increase in total green investment, total green talent, and green area.
3) Number of patents granted per capita: All coefficients for the number of patents granted per capita are negative and significant at the 1% significance level. This indicates that with the increase in the number of patents granted per capita, the innovation level of cities can be improved, promoting technological progress and industrial upgrading, thereby reducing the investment of cities in green talents, green capital, and green land.
(3) Real efficiency evaluation results in the third stage
In the third stage, the actual efficiency values of green transformation in 48 cities of China’s three major urban agglomerations were obtained by separating the effects of inefficient management and random interference in the second stage, adjusting investment indicators, and conducting further calculations.
According to Table 6, compared to comprehensive efficiency, the actual efficiency of green transformation in 48 cities of China’s three major urban agglomerations shows a significant upward trend. The actual efficiency is almost all above 0.7, indicating that after excluding the impact of environmental factors, the overall green transformation level of the three major urban agglomerations is relatively high; Among them, Cangzhou, Shanghai, Hangzhou, Jinhua, Zhoushan, Ma’anshan, Tongling, Chizhou, Foshan, and Zhongshan have an average actual efficiency of 1 in green transformation. Among these ten cities with a comprehensive efficiency of 1, seven cities are located in the YRD.
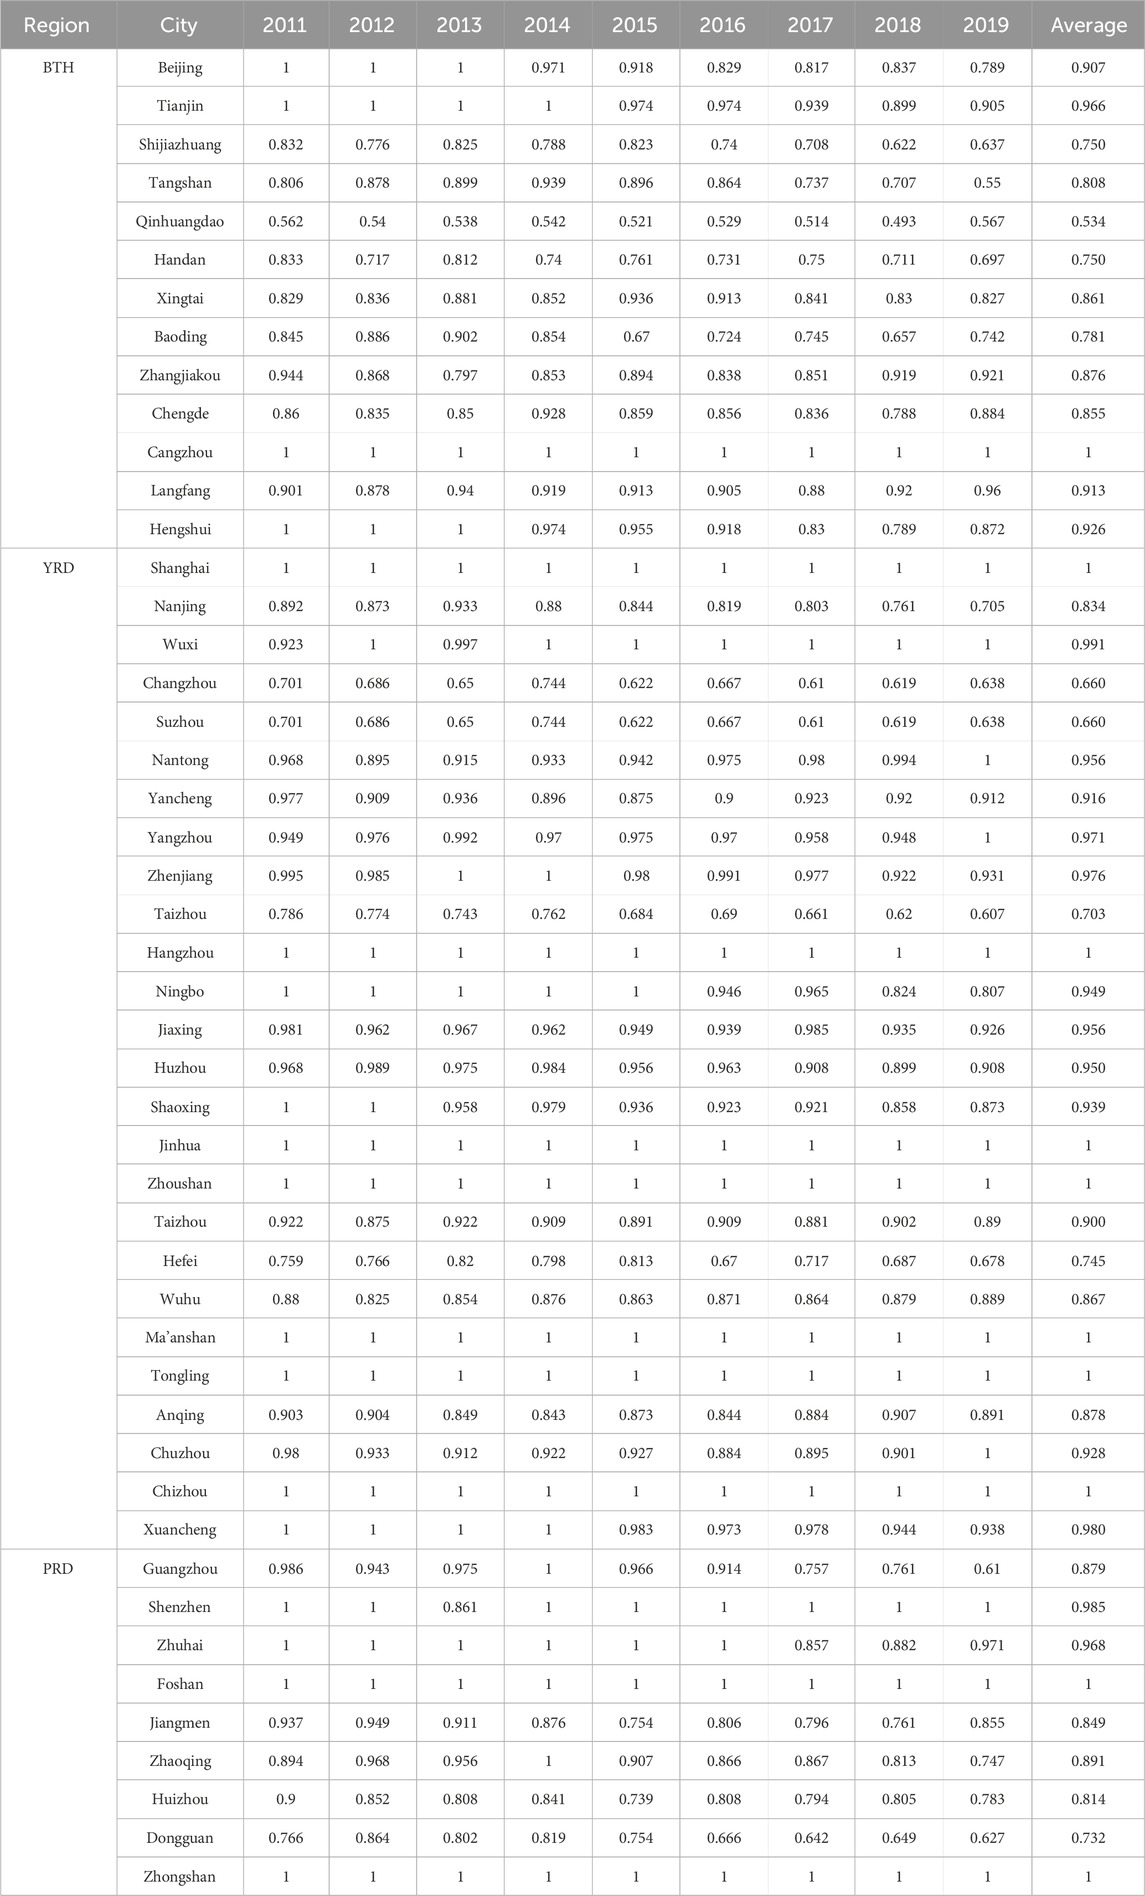
Table 6. Real efficiency of green transformation in China’s three major urban agglomerations from 2011 to 2019.
Specifically, the actual efficiency values of green transformation in the three major urban agglomerations from 2011 to 2019 were plotted as a line chart, as shown in Figure 3.
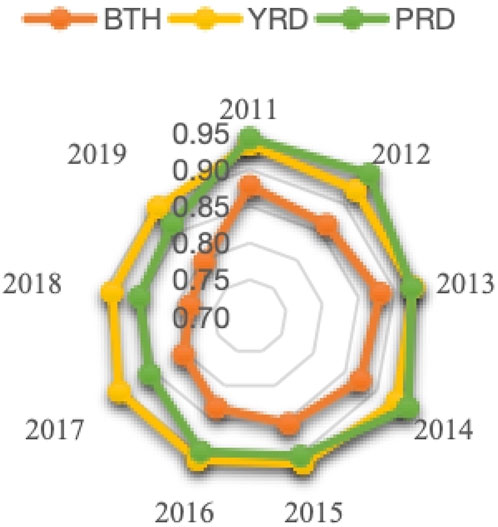
Figure 3. Trends in the real efficiency of green transformation in China’s three major urban agglomerations from 2011 to 2019.
There are significant differences in the actual efficiency of green transformation among the three major urban agglomerations in China. Overall, the actual efficiency of green transformation in the YRD and PRD is significantly higher than that in the BTH, with efficiency values above 0.85, indicating that the actual effect of green transformation in the YRD and PRD is good. Before 2014, the green transformation efficiency of the PRD was very high, but it began to sharply decline after reaching its peak in 2014 and reached its lowest level in 2018; The green transformation efficiency of the YRD slowly increased from 2011 to 2014, and also began to decline slightly after reaching its peak in 2014; The efficiency value of the BTH has been showing a serious downward trend from 2013 to 2018, reaching the lowest value of 0.782 in 2018. However, overall, after reaching the lowest level in 2018, the green transformation efficiency values of the three major urban agglomerations showed a slight rebound in 2019.
3.2 Dynamic efficiency evaluation results
The Malmquist index model was used to measure the green transformation efficiency of the three major urban agglomerations in China from 2011 to 2019. The comprehensive efficiency values and efficiency decomposition values of green transformation in 48 cities of the three major urban agglomerations in China at different periods were calculated, and the results are shown in Table 7.
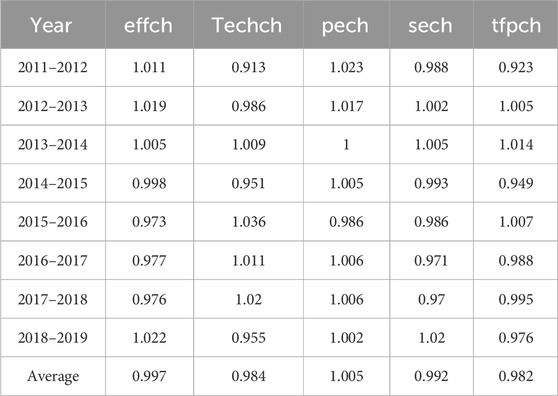
Table 7. Dynamic efficiency and decomposition of green transformation in three major urban agglomerations in China from 2011 to 2019.
Firstly, the average green transformation efficiency of China’s three major urban agglomerations from 2011 to 2019 was 0.982, which decreased by 1.8% on average over the past 9 years, presenting a negative growth trend. The technical efficiency value is 0.997, an overall decrease of 0.3% compared to before. The average change in technological progress is 0.984, a decrease of 1.6% overall compared to before. The average scale efficiency is 0.992, a decrease of 0.8% overall compared to before. The average pure technical efficiency is 1.005, an overall increase of 0.5% compared to before. Therefore, the change in the average value of comprehensive technical efficiency is mainly influenced by scale efficiency, and the positive impact of pure technical efficiency on comprehensive technical efficiency is offset by the decrease in scale efficiency. At the same time, the impact of changes in the technological progress index on urban transformation efficiency is much greater than the impact of technological efficiency on urban transformation efficiency. Therefore, it can be concluded that the lag of technological progress is the main reason for the decline in the comprehensive efficiency of green transformation in urban agglomerations in China.
Plot the comprehensive efficiency values and efficiency decomposition values of green transformation in 48 cities of China’s three major urban agglomerations in different periods into a line chart to grasp their changing trends. The results are shown in Figure 4.
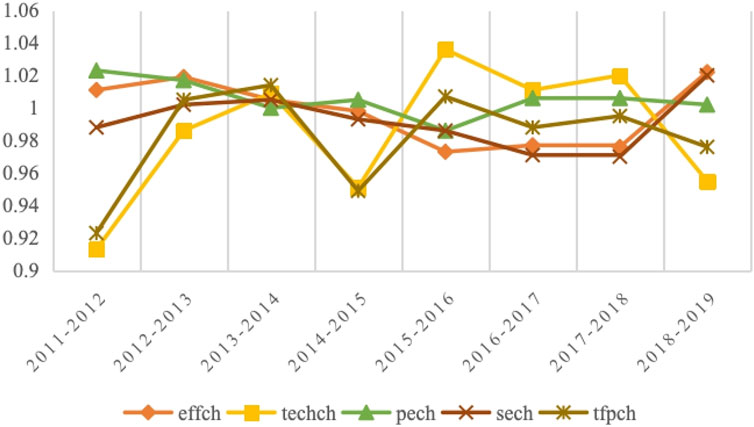
Figure 4. Dynamic efficiency and decomposition of green transformation in three major urban agglomerations in China from 2011 to 2019.
It can be seen that in the nine periods from 2011 to 2019, the efficiency of green transformation in urban agglomerations showed an upward trend from 2012 to 2014 and from 2015 to 2016, while in other periods it remained in a downward trend. Based on the specific decomposition situation, when the technological progress index decreases or rises, total factor productivity will also experience the same decrease or increase. The trend of change in total factor productivity is almost identical to that of technological progress, but does not overlap. The reason is that the impact of changes in technological efficiency on urban transformation efficiency offsets some of the impact of changes in technological progress, The trend of the efficiency of green transformation in urban agglomerations almost entirely depends on the change index of technological progress.
From Figure 5, it can be seen that the total factor productivity of the three major urban agglomerations in China was less than 1 from 2011 to 2019, indicating that the overall efficiency of green transformation in the three urban agglomerations decreased during this period. Among them, the average tfpch of the BTH is 0.983, the average tfpch of the YRD is 0.982, and the average tfpch of the PRD is 0.983, with similar decreases. Based on the Malmquist index decomposition, from 2011 to 2019, the average change in technological efficiency of the BTH was 0.989, with the largest decrease. The average change in technological efficiency of the YRD and PRD was 0.997 and 0.993, respectively. The techch of the BTH is 0.995, while the techch of the YRD and the PRD are 0.986 and 0.99, respectively. The decline in the YRD is relatively large. From this, it can be seen that the changes in the technological progress index have a much greater impact on the efficiency of urban transformation than the impact of technological efficiency on urban transformation efficiency. The lagging technological progress hinders the improvement of green transformation efficiency in the three major urban agglomerations.
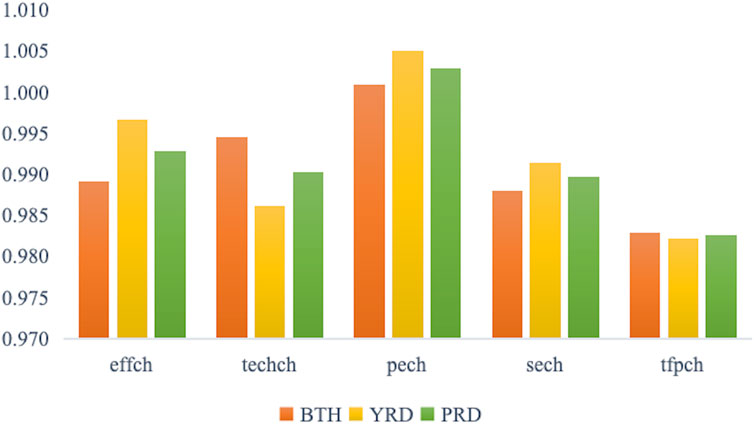
Figure 5. Malmquist index results and decomposition of three major urban agglomerations in China from 2011 to 2019.
3.3 Analysis of spatiotemporal differences
By measuring the green transformation efficiency of the three major urban agglomerations in China from both static and dynamic perspectives, it can be seen that there are significant differences in the green transformation efficiency of the three major urban agglomerations. At the same time, within each urban agglomeration area, there are differences in the green transformation efficiency of the same city at different times and different cities at the same time. By drawing spatiotemporal evolution maps of green transformation in urban agglomerations in 2011, 2015, and 2019, the spatiotemporal differences in the efficiency of green transformation in the three major urban agglomerations in China are obtained Figure 6.
(1) There is a significant difference in the efficiency of green transformation among different cities within urban agglomerations. From a regional perspective, each city exhibits different green transformation efficiency. In the BTH, in addition to mature cities such as Beijing and Tianjin, there are also resource-based cities like Cangzhou that have achieved good results in green transformation. Since the official proposal of the “12th Five Year Plan” to promote the integrated development of BTH and create the capital economic circle, Beijing and Tianjin have been important engines for the coordinated development of the BTH, playing an important role in the fields of economy, healthcare, education, transportation, etc. As an advantageous resource-based city, Cangzhou City has issued multiple policy documents since 2011, focusing on regional characteristic industries, seizing opportunities for green transformation and development, guiding relevant industry enterprises to implement energy-saving technology upgrading and transformation, improving energy efficiency levels, and promoting the green and low-carbon transformation and development of traditional industries. In the YRD, besides mature cities such as Shanghai, Suzhou, and Hangzhou, there are also resource-based cities such as Ma’anshan and Tongling that have good green transformation effects. It is worth mentioning that Nanjing, as an economically advantageous city in the YRD, has a relatively unsatisfactory green transformation effect. The backward technological progress is the main reason for the decline in the comprehensive efficiency of green transformation in China’s urban agglomerations. Therefore, in the future, Nanjing should increase research and development, invest in technology, and allocate financial resources reasonably to promote the green transformation of the city. At the same time, there are currently 6 cities in the YRD with green transformation efficiency values below 0.7. The economic development level of these cities is relatively low, and there is significant redundancy in the investment of capital and labor, so the level of green transformation is relatively low. In the PRD, except for Huizhou and Dongguan, the green transformation efficiency of other cities is above 0.7. The overall green transformation situation of the PRD is good, and the internal differences are not significant. The PRD has always relied on the developed tertiary industry to achieve rapid economic growth, with a relatively light industrial structure, intensive innovation factors, and pursuit of green development. Therefore, the overall level of green transformation in the PRD is relatively high. From this, it can be seen that there may be significant differences in green transformation strategies among different cities. Some cities actively respond to the development direction of national green transformation, striving to achieve economic growth while ensuring environmental sustainability, while some cities pay more attention to economic growth and neglect the protection of the ecological environment, which cannot fully achieve DEA effectiveness, Some cities also have low output efficiency due to excessive emphasis on ecological security and significant constraints on economic development. In summary, the reasons for the low efficiency of green transformation in different cities are heterogeneous.
(2) There are significant differences in the efficiency of green transformation among the three major urban agglomerations. From a regional perspective, it can be concluded that the overall green transformation efficiency of the three major urban agglomerations varies greatly, and each urban agglomeration has different characteristics in green transformation. In terms of vertical development trend, the green transformation efficiency of China’s three major urban agglomerations showed an overall trend of first increasing and then decreasing from 2011 to 2018. However, it achieved a slight rebound in 2019, with significant fluctuations in the PRD and YRD, while the trend of changes in the BTH was not significant; In terms of horizontal development differences, the green transformation level of the three major urban agglomerations is ranked from high to low in the PRD, the YRD, and the BTH. The green transformation efficiency of the PRD and the YRD is similar, but they are significantly higher than the BTH. This result is also reflected in the research of other scholars or institutions, such as the “National New Urbanization Report 2016". The per capita GDP of the PRD is 105,000 yuan, ranking first in the national urban agglomeration. The population agglomeration continues to increase, innovative talents continue to be introduced, and the population age structure continues to exhibit the overall characteristics of “low at both ends, high in the middle”. It has a good “population dividend” and “talent dividend”. The PRD has been leveraging the innovative research and development capabilities of Guangzhou and Shenzhen, as well as Zhuhai, Foshan, Huizhou, Dongguan, Zhongshan, Jiangmen Zhaoqing and other places have the advantage of a complete industrial chain to create advanced industrial clusters; The YRD covers multiple provinces and has been a prosperous place since ancient times. The overall advantages of the urban agglomeration are obvious, and regional development is coordinated and balanced. All dimensions demonstrate comprehensive and comprehensive strength. In addition to maintaining a consistent leading advantage in Shanghai, Hangzhou, Nanjing, and Suzhou, Ningbo, Wuxi, Hefei, Changzhou, and Nantong have also rapidly emerged as core cities, with their engine role constantly increasing and their economic aggregate ranking first, forming a regional economic pattern with complementary advantages and high-quality development. At the same time, the YRD is also a livable place. Jiangsu and Zhejiang provinces have consistently ranked among the top in terms of greenery in the country, with good air quality and a high level of green development efficiency; The BTH has always relied on the two major cities of Beijing and Tianjin to drive the development of other small and medium-sized cities in Hebei Province. Hebei Province is an industrial province with high energy consumption, high pollution, and high emissions as the main characteristics of industrial development. The industrial structure is unreasonable, the pollutant emissions are large, and energy consumption ranks among the top in the country. The emissions of pollutants such as smoke, smoke, and sulfur dioxide have long been ranked first or second in the country. Therefore, the green transformation efficiency of the BTH is relatively low. On the one hand, it may be due to the ineffective implementation of the green transformation concept, and many traditional industries have not undergone timely transformation and upgrading, resulting in slow development of the green industry; On the other hand, Hebei Province is facing many limitations in technology, funding, talent, and other aspects. At the same time, it is also facing the dilemma of transferring polluting enterprises from Beijing, which has made the transformation of many enterprises very difficult and has not yet explored a mature environmental protection path. Therefore, the level of green transformation is still at a relatively low level, and the overall efficiency of green transformation is relatively low.
(3) There is little difference in the efficiency of green transformation among the three major urban agglomerations in terms of time dimension. Compared with the difference in green transformation efficiency of urban agglomerations in the spatial dimension, the difference in the temporal dimension is relatively small. The difference in efficiency values among the 48 cities in the three major urban agglomerations during the five-year period does not exceed 0.2. At the same time, from a dynamic perspective, technological progress is the main driving factor for improving the efficiency of green transformation in urban agglomerations. The change in total factor productivity depends on the combined effect of the technical efficiency change index and the technical progress index. Based on the decomposition results of the Malmquist index at different periods, it can be concluded that the impact of technological progress changes on total factor productivity is greater than that of technological efficiency changes. The trend of changes in total factor productivity is almost identical to that of technological progress, but it does not overlap because the impact of changes in technological efficiency on total factor productivity offsets some of the impact of changes in technological progress on total factor productivity. From this, it can be seen that the change in the technological progress index has a much greater impact on the efficiency of green transformation in urban agglomerations than the impact of technological efficiency on the efficiency of green transformation in urban agglomerations. This indicates that the technological change index mainly affects the changes in the efficiency of green transformation in urban agglomerations.
(4) The efficiency of green transformation in the three major urban agglomerations is affected by environmental constraints. The impact of environmental factors on cities is mainly reflected in the differences in efficiency values before and after adjustment, which are essentially influenced by economic development, energy consumption, and technological investment. After excluding the impact of environmental variables, the efficiency values of most cities have improved. The overall efficiency of green transformation after the adjustment has improved compared to before, indicating that environmental factors at this stage have a inhibitory effect on the green transformation efficiency of urban agglomerations. Although this effect is not significant, it is still necessary to continuously optimize the urban environment to promote the green transformation of urban agglomerations. In addition, there are also some non quantitative environmental factors, such as geographical location, cultural differences, differences in consumer attitudes, and policy influences. However, these factors cannot be quantified, so they are not reflected in environmental variables. These factors are also the reason for the differences in the efficiency of urban green transformation after adjusting for input variables.
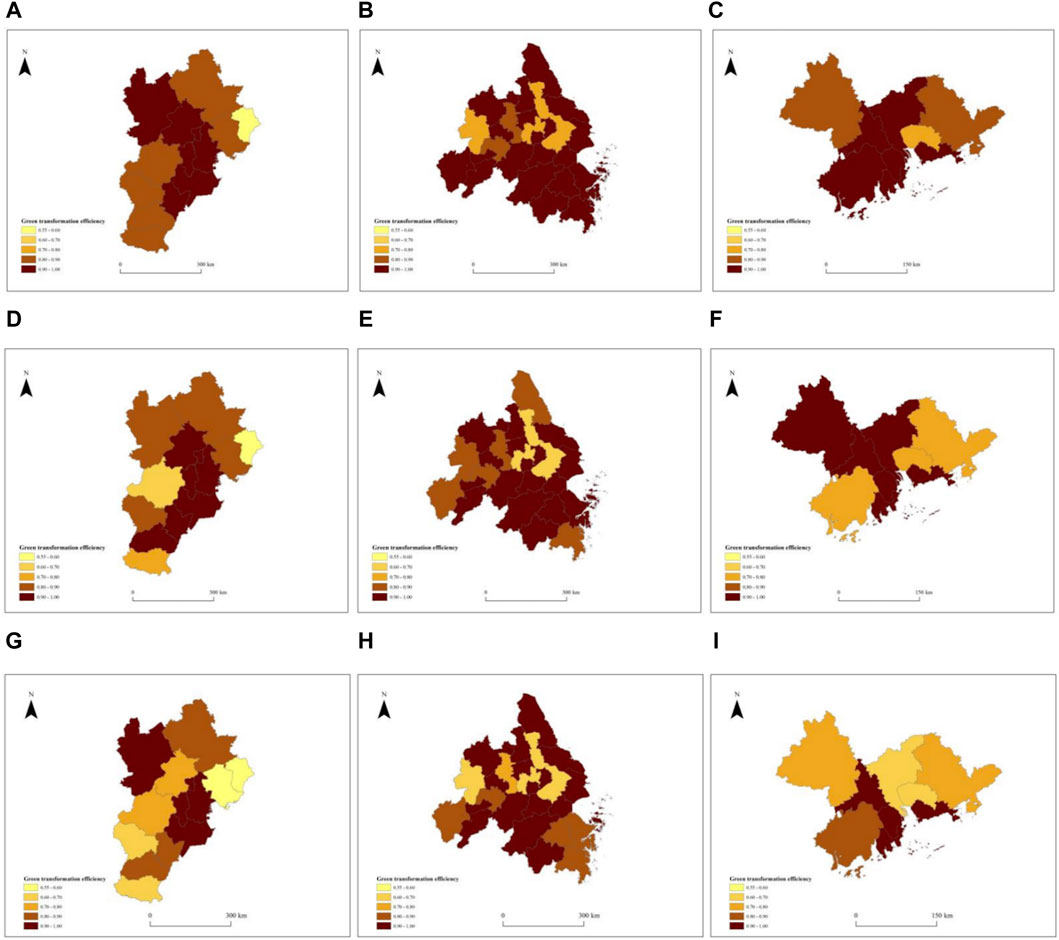
Figure 6. Spatial and temporal changes of green transformation efficiency of BTH, YRD and PRD in 2011, 2015, and 2019.
3.4 Analysis of spatiotemporal differences
(1) Regression results
Using the efficiency value obtained in the third stage as the dependent variable and incorporating the aforementioned explanatory variables, the Tobit regression model was used to obtain empirical results as shown in Table 8.

Table 8. Regression results of Tobit model.
It can be seen that the LR test result is 51.5, Prob>=chibar2 = 0.000, which is significant at the 1% significance level, indicating that the model setting is reasonable and there is a significant individual effect. The upgrading of industrial structure, level of green innovation intensity of environmental regulation, infrastructure construction, and degree of openness to the outside world are all important factors that affect the efficiency of green transformation in urban agglomerations.
Firstly, the impact coefficient of industrial structure upgrading on the efficiency of green transformation in urban agglomerations is positive and significant at the 1% significance level, indicating that the upgrading of industrial structure is conducive to promoting green transformation in urban agglomerations. On the one hand, the industrial structure is becoming more rational. With the continuous advancement of digital technology, the pillar industries of cities should shift more from labor-intensive and capital intensive industries to technology intensive and knowledge intensive industries. On the other hand, the industrial structure is more effective, eliminating and improving inefficient industries, vigorously promoting and developing efficient industries, promoting the integration and coordination of upstream and downstream industries, and forming an intelligent, green, and efficient industrial system.
Secondly, the impact coefficient of green innovation level on the efficiency of green transformation in urban agglomerations is positive and significant at the 1% significance level, indicating that the improvement of green innovation level is conducive to promoting green transformation in urban agglomerations.We must vigorously promote green technology innovation, leverage the empowering role of digital technology, coordinate economic development and environmental protection, and achieve efficient flow of production factors. At the same time, we should actively promote international cooperation in the field of technological innovation, and in the new context of the “dual carbon” goal, promote the continuous reduction of energy consumption per unit product, accelerate the improvement of the contribution rate of various new clean energy sources, and reduce the use and dependence on fossil fuels through technological progress.
Thirdly, the impact coefficient of environmental regulation intensity on the efficiency of green transformation in urban agglomerations is negative and significant at the significance level of 5%, indicating that an increase in environmental regulation intensity will slightly inhibit the green transformation of urban agglomerations. This may contradict our understanding, but in reality, in order to prevent further deterioration of the ecological environment, the government has issued relevant policy documents and adopted environmental regulation measures such as pollution limit and traffic control to protect the urban environment. However, at the same time, overly tough environmental regulatory measures often hinder the further development of the city’s economy, causing the city to fall into a cycle of resource curse. So if we want to truly achieve the green transformation of urban agglomerations, we should consider more from the perspective of technological progress and industrial upgrading, rather than blindly implementing environmental regulations. However, in order to achieve the goal of green transformation of development mode and high-quality economic development, it is feasible and meaningful to temporarily sacrifice short-term economic growth in some cities with severe environmental damage and low resource carrying capacity to achieve long-term environmental sustainable development. Because the intensity of environmental regulations has a relatively small impact on the efficiency of urban green transformation, the degree of inhibition on urban green transformation is relatively low.
Fourthly, the impact coefficient of infrastructure construction on the efficiency of green transformation in urban agglomerations is positive and significant at the significance level of 5%, indicating that the improvement of infrastructure construction is conducive to promoting the green transformation of urban agglomerations. The Ministry of Housing and Urban Development and the National Development and Reform Commission issued the “14th Five Year Plan” for national urban infrastructure construction in July this year, which mentioned the need to “accelerate the construction of new urban infrastructure and promote the transformation and development of urban intelligence”. With various policy documents raising higher requirements for urban development, the improvement of urban infrastructure is conducive to promoting cities to better absorb and utilize the funds, information, technology, talents and other elements required in the process of urban development, and creating a new pattern of joint construction, governance, and sharing. At the same time, accelerating the construction of new urban infrastructure is also beneficial for cities to prioritize the development of emerging technology industries such as photovoltaic power generation, digital technology, and new energy, enabling cities to continuously move towards the direction of “smart cities".
Fifth, the coefficient of influence of the degree of openness on the efficiency of green transformation in urban agglomerations is negative and significant at the 1% significance level, indicating that an increase in openness will slightly inhibit the green transformation of urban agglomerations. With the improvement of the degree of opening-up to the outside world, foreign investment in urban industries is more concentrated in labor-intensive or capital intensive high energy consumption and high pollution industries, and its positive effect on the management experience and technological progress brought by the city is far less than the negative impact on the city’s environmental pollution. In order to avoid the phenomenon of “pollution shelters”, local governments need to screen the “green” level of foreign direct investment, strictly implement environmental protection access, raise the environmental access threshold for foreign direct investment, and fully leverage the technological advantages and spillover effects of foreign direct investment in environmental governance.
(2) Robust test
This article adopts the method of compressing sample data to verify the robustness of the results obtained. According to the results in Table 9, it can be seen that industrial structure upgrading, green innovation level, environmental regulation intensity, infrastructure construction, and degree of openness are important factors affecting the efficiency of green transformation in urban agglomerations, and the direction and degree of influence have not changed significantly, Therefore, to some extent, it indicates that the results obtained in this article have good robustness.
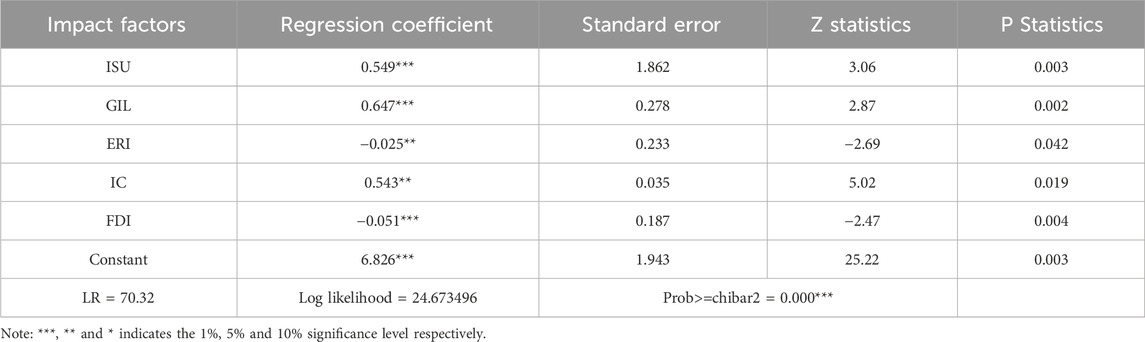
Table 9. Robust test results.
4 Discussion and conclusions
4.1 Discussion
(1) From a static perspective, the overall efficiency of green transformation in the three major urban agglomerations is at a high level, but not all have reached “DEA effectiveness”. Among the 48 cities in the 9 year cycle, the overall level of green transformation in the three major urban agglomerations is relatively high, but from a time perspective, it shows a downward trend overall. Overall, the PRD is known for its green development, with the highest average efficiency value of green transformation, followed by the YRD. The level of green transformation has significantly increased since 2018, while the BTH has the lowest level of green transformation. It promotes the coordinated development of the urban agglomeration with Beijing and Tianjin as the centers, but the two cities’ development is dominant, but they have not played a good agglomeration effect and central radiation effect, Most cities in Hebei Province have performed poorly in green transformation.
(2) From a dynamic perspective, technological progress is the main driving factor for improving the efficiency of green transformation in the three major urban agglomerations. Based on the specific decomposition of the Malmquist index in different periods, when the technological progress index decreases or rises, total factor productivity will also experience the same decrease or increase. The trend of change in total factor productivity is almost identical to that of technological progress, but does not overlap. The reason is that the impact of changes in technological efficiency on urban transformation efficiency offsets some of the impact of changes in technological progress, The trend of the efficiency of green transformation in urban agglomerations almost entirely depends on the change index of technological progress.
(3) From the perspective of spatiotemporal differences, there are significant differences in the spatiotemporal characteristics of green transformation among the three major urban agglomerations. In terms of spatial dimensions, there are significant differences in the efficiency of green transformation between different cities within urban agglomerations and among the three major urban agglomerations. There are significant differences in green transformation strategies among different cities, and the reasons for the low efficiency of green transformation in different cities are heterogeneous. Overall, the PRD has been leveraging the innovative research and development capabilities of Guangzhou and Shenzhen, as well as the advantages of complete industrial chains in cities such as Zhuhai, Foshan, Huizhou, Dongguan, Zhongshan, Jiangmen, and Zhaoqing, to create advanced industrial clusters; The YRD covers multiple provinces and has been a prosperous place since ancient times. The overall advantages of the urban agglomeration are obvious, and regional development is coordinated and balanced, demonstrating comprehensive strength in all dimensions; The BTH has always relied on the two major cities of Beijing and Tianjin to drive the development of other small and medium-sized cities in Hebei Province. Its level of green transformation is lower than that of the PRD and the YRD. On the one hand, the green transformation concept in Hebei Province has not been effectively implemented, and many traditional industries have not undergone timely transformation and upgrading, resulting in slow development of the green industry There are many restrictions on talent and other aspects, while also facing the dilemma of transferring polluting enterprises from Beijing, and a mature path for environmental protection has not yet been explored. Compared with the differences in green transformation efficiency of urban agglomerations in the spatial dimension, the differences in time dimension among the three major urban agglomerations are relatively small, but they are all affected by environmental suppression. Although this impact is not significant, it is still necessary to continuously optimize the urban environment in order to promote the green transformation of urban agglomerations.
(4) From the perspective of influencing factors, government led factors and objective environmental factors jointly affect the green transformation efficiency of the three major urban agglomerations. Industrial structure upgrading, green innovation level, environmental regulation intensity, infrastructure construction, and degree of openness are all important factors that affect the green transformation efficiency of urban agglomerations. Among them, industrial structure upgrading, green innovation level, and infrastructure construction can promote the green transformation of urban agglomerations, and the degree of influence of the three is not significantly different; The intensity of environmental regulations and the degree of openness to the outside world will inhibit the green transformation of urban agglomerations, with a small coefficient of impact and a low degree of inhibition. From this, it can be seen that if we want to truly promote the green transformation of urban agglomerations, we should focus on three main factors: industrial structure upgrading, green innovation level, and infrastructure construction. At the same time, we should avoid overly tough environmental regulatory measures and control and screen the “green environmental protection” level of foreign direct investment.
(5) There are still the following aspects that need to be further studied in this article: firstly, the indicator system needs to be improved. This article currently constructs a green transformation evaluation system for urban agglomerations based on five aspects: economic growth, industrial transformation, resource saving, environmental governance, and improvement of livelihood. In the future, with the continuous deepening and improvement of the green transformation concept, a more comprehensive green transformation evaluation system can be constructed, and the selected indicators can be measured from multiple dimensions and aspects. Moreover, the selection of input-output indicators for efficiency evaluation in this article was also based on literature review and selection. Although statistical methods were also used to assist in screening and avoid some subjective factors, there may still be some biases in the evaluation results. Another thing is that the sample size needs to be enriched. This article selects the three most mature and well-developed urban agglomerations in China from 2011 to 2019 as research samples. In the future, more urban agglomerations can be studied, and with the passage of time and the improvement of data, the time span of the sample size will be longer, improving the credibility of the research results. Finally, the research methods need to be supplemented. In the future, in-depth analysis can be conducted using methods such as case analysis, policy evaluation, and spatial econometrics. Research methods from econometrics, geography, and public management can be introduced into the research, in order to enrich the relevant theories and practices in the field of urban transformation.
4.2 Conclusions
Based on the dynamic and static evaluation of the green transformation of the three major urban agglomerations and the analysis of spatiotemporal differences, as well as the empirical analysis of the factors affecting the efficiency of green transformation, and based on the actual development situation of the three major urban agglomerations in China, relevant policy recommendations are given from the following dimensions:
(1) Establish a concept of urban agglomeration development that combines overall improvement and internal collaboration. As the regional pattern shifts from “administrative region economy” to “urban agglomeration economy”, the central government should quickly adapt to the development model dominated by urban agglomeration units. In terms of development philosophy, not only consider the overall economy, innovation, synergy, green and people’s livelihood quality of urban agglomerations as important decision-making variables, but also take the construction of close and balanced urban connections and the creation of more spatial spillover windows as key performance indicators, truly promoting the development of urban agglomerations from “independent governance” to “shared governance”. Pay attention to the differences between urban agglomerations and implement policies according to local conditions. Focus efforts on solving the bottleneck problems in areas such as economic operation, innovation driven, coordinated development, green transformation, people’s livelihood sharing, and intercity collaboration based on the heterogeneity of structural sources and driving forces. The BTH should establish a global awareness, establish a collaborative mechanism to promote green transformation, comply with the policies of carbon peaking and carbon neutrality, and create a green environment, industry, and financial circulation system; The YRD should leverage its consistent industrial and ecological advantages, emphasize spatial linkage development, deepen the layout of efficient development in economically developed cities such as Shanghai and Suzhou, and promote cooperation within the urban agglomeration; The PRD should fully utilize its unique ecological and geographical advantages, establish a unified green development system in conjunction with Hong Kong and Macau, inject technological innovation impetus into green development, and improve the network of central and peripheral urban agglomerations.
(2) Strengthen the network system of urban agglomerations, avoid conflicts between cities, fully leverage the coordination and promotion role of urban agglomerations, and achieve the synergy of “1 + 1>2″in cities. Cities are the foundation of urban agglomerations, and urban agglomerations are an organic combination of cities. In the process of promoting the green transformation of urban agglomerations, adhere to the policy of overall development of urban agglomerations and avoid elevating individual cities and ignoring macro layout. Simultaneously promoting the optimization of urban spatial structure, functional improvement, and quality improvement, integrating public services, and enhancing the resilience of the city. At the internal level of urban agglomerations, major urban agglomerations should strictly follow the development plans formulated by local governments or even the state, requiring internal cities to closely align with their functional positioning, fully leverage comparative advantages, and actively build a reasonable division of labor, complementary functions, and staggered development pattern for urban agglomerations. Especially for small and medium-sized cities, fully utilize the “scale borrowing” effect, promote their own development level by taking on the advantageous resources of core cities, thereby narrowing the development gap with core cities and strengthening the internal coordination of urban agglomeration development.
(3) Encourage green technology innovation and accelerate the upgrading of industrial structure. At the national level, continue to improve the collaborative innovation layout at the scale of urban agglomerations, continuously reduce the circulation cost of innovation factors between cities through building industrial technology alliances, joint research and development, improving transportation networks, and reforming institutional supply, thereby comprehensively enhancing the collaborative innovation capacity of urban agglomerations. Eliminate and improve inefficient industries, vigorously promote and develop efficient industries, promote the integration and development of upstream and downstream industries, and promote synergy between industries, forming an intelligent, green, and efficient industrial system. Give full play to the empowering role of digital technology, promote efficient and green application of technology, achieve efficient flow of production factors, and actively promote international cooperation in the field of technological innovation. Establish an intelligent and efficient energy system based on clean energy. Improve the level of green innovation, promote the continuous reduction of energy consumption per unit product, accelerate the contribution rate of various new clean energy sources, and reduce the use and dependence on fossil fuels through technological progress. Strengthen and optimize regional cooperation networks through scale restructuring, form regional adjacency spatial connections and higher-level economies of scale through spatial forms such as urban agglomerations, metropolitan areas, national level new areas, and global urban areas, creating a good situation of complementary advantages, win-win cooperation, and coordinated development between regions, and constructing a new model for the development of national networked spatial connections.
(4) Moderate environmental regulation and dual benefits of economic and environmental protection. Coordinate the relationship between economic growth and environmental protection, and pay attention to the selection of environmental regulation policy tools. When implementing environmental regulations, the government should pay attention to the coordination between objectives and the rationality of the selection of regulatory measures, focus on sustainable economic development, follow natural laws, and not exceed the environmental carrying capacity. Pay attention to the appropriateness and rationality of environmental regulations. Modernity requires environmental regulations to be moderate in degree, neither too lenient to effectively solve environmental problems, nor too strict to hinder economic and social development. This means that when formulating environmental regulatory policies, it is necessary to fully consider factors such as resource endowments, industrial structure, and development stages in different regions, and formulate regulatory measures tailored to local conditions. At the same time, it is necessary to adjust regulatory efforts in a timely manner based on the severity and urgency of environmental issues, ensuring that environmental regulations are in line with economic and social development. Rationality requires environmental regulations to be scientific, fair, and effective in terms of content and methods. The government should develop reasonable environmental standards, emission limits, and penalty measures based on scientific environmental risk assessment and prediction. It is necessary to strengthen environmental monitoring and regulatory capacity building to ensure the effective implementation of environmental regulatory policies.
(5) Guide foreign direct investment and attach importance to green and low-carbon areas. The government should deeply implement the Foreign Investment Law, strengthen the promotion and protection of foreign investment, continuously optimize the environment for foreign investment, and effectively avoid the formation of “pollution shelters”. Emphasis should be placed on encouraging foreign investment in areas such as new energy, digital technology, innovation and demonstration applications of green and low-carbon key technologies. To promote economic growth through the “income effect” mechanism, it is necessary to establish a negative list of foreign investment, implement entry barriers for foreign direct investment, correctly guide the flow of foreign investment, ensure that foreign investment conforms to national strategies and industrial development directions, promote the improvement of foreign investment quality, improve foreign investment layout, fully utilize foreign investment resources, and enhance the efficiency of foreign investment utilization. Strongly encourage foreign companies to participate fairly in the formulation and revision of relevant technical specifications, and also encourage foreign investment to engage in research and development of energy-saving and emission reduction technologies. In addition, actively promote foreign companies to participate in relevant international standard certification work, and encourage foreign-invested enterprises to become “leaders” in the green and low-carbon field.
Data availability statement
The original contributions presented in the study are included in the article/Supplementary material, further inquiries can be directed to the corresponding author.
Author contributions
XM: Funding acquisition, Supervision, Writing–review and editing. ZL: Conceptualization, Data curation, Methodology, Software, Visualization, Writing–original draft, Writing–review and editing.
Funding
The author(s) declare that financial support was received for the research, authorship, and/or publication of this article. This work was funded by The National Social Science Fund of China (Grant number: 18BJL092).
Conflict of interest
The authors declare that the research was conducted in the absence of any commercial or financial relationships that could be construed as a potential conflict of interest.
Publisher’s note
All claims expressed in this article are solely those of the authors and do not necessarily represent those of their affiliated organizations, or those of the publisher, the editors and the reviewers. Any product that may be evaluated in this article, or claim that may be made by its manufacturer, is not guaranteed or endorsed by the publisher.
Footnotes
1The BTH urban agglomeration includes 13 cities: Beijing, Tianjin, Shijiazhuang, Tangshan, Qinhuangdao, Handan, Xingtai, Baoding, Zhangjiakou, Chengde, Cangzhou, Langfang, Hengshui; The YRD urban agglomeration includes 26 cities: Shanghai, Nanjing, Wuxi, Changzhou, Suzhou, Nantong, Yancheng, Yangzhou, Zhenjiang, Taizhou, Hangzhou, Ningbo, Huzhou, Jiaxing, Shaoxing, Jinhua, Zhoushan, Taizhou, Hefei, Wuhu, Ma’anshan, Tongling, Anqing, Chuzhou, Chizhou, Xuancheng; The PRD urban agglomeration includes 9 cities: Guangzhou, Shenzhen, Zhuhai, Foshan, Jiangmen, Zhaoqing, Huizhou, Dongguan, Zhongshan
References
Artmann, M., Inostroza, L., and Fan, P. (2019). Urban sprawl, compact urban development and green cities. How much do we know, how much do we agree? Ecol. Indic. 96, 3–9. doi:10.1016/j.ecolind.2018.10.059
Chen, J., Fan, W., Ding, Li, Liu, X., and Song, M. (2020). Driving factors of global carbon footprint pressure: based on vegetation carbon sequestration. Appl. Energy 267, 114914. doi:10.1016/j.apenergy.2020.114914
Cheng, J., Yi, J., Dai, S., and Yan, X. (2019). Can low-carbon city construction facilitate greengrowth? Evidence from China’s pilot low-carbon city initiative. J. Clean. Prod. 231, 1158–1170. doi:10.1016/j.jclepro.2019.05.327
Collier, M. J., Nedovic-Budic, Z., Aerts, J., Connop, S., Foley, D., Foley, K., et al. (2013). Transitioning to resilience and sustainability in urban communities. Cities 32, 21–28. doi:10.1016/j.cities.2013.03.010
Cui, X., Zhan, S., Zhihui, Li, and Jia, Wu (2021). Spatiotemporal evolutions and driving factors of green development performance of cities in the Yangtze River Economic Belt. Ecol. Inf. 66, 101476. doi:10.1016/j.ecoinf.2021.101476
Department of Urban Socio Economic Investigation (2021) National bureau of statistics China urban statistical Yearbook[EB/OL]. Available at: https://navi.cnki.net/knavi/yearbooks/YZGCA/detail (Accessed January 15, 2022).
Fan, F., Lian, H., Liu, X., and Wang, X. (2021). Can environmental regulation promote urban green innovation Efficiency? An empirical study based on Chinese cities. J. Clean. Prod. 287, 125060–125110. doi:10.1016/j.jclepro.2020.125060
Feng, Xu, Cui, F., and Xiang, N. (2021). Roadmap of green transformation for a steel-manufacturing intensive city in China driven by air pollution control. J. Clean. Prod. 283, 1–10. doi:10.1016/j.jclepro.2020.124643
Fried, H. O., Lovell, C. A. K., Schmidt, S. S., and Yaisawarng, S. (2002). Accounting for environmental effects and statistical noise in data envelopment analysis. J. Prod. Analysis 17, 157–174. doi:10.1023/A:1013548723393
Fu, W., and Huang, X. (2016). A study on the evaluation and influencing factors of industrial green transformation based on DEA-tobit model: a case study of the Yangtze River Delta region. Manag. Sci. 1, 112–114. doi:10.3969/j.issn.1003-1154.2016.01.036
Guo, Y., Tong, L., and Mei, L. (2020). The effect of industrial agglomeration on green development efficiency in Northeast China since the revitalization. J. Clean. Prod. 258, 120584–120613. doi:10.1016/j.jclepro.2020.120584
Jamsson, A. (2013). Reaching for a sustainable, resilient urban future using the lens of ecosystem services. Ecol. Econ. 86, 285–291. doi:10.1016/j.ecolecon.2012.06.013
Kii, M. (2021). Projecting future populations of urban agglomerations around the world and through the 21st century. Npj Urban Sustain. 1, 10. doi:10.1038/s42949-020-00007-5
Kourtit, K., Nijkamp, P., and Suzuki, S. (2020). Are global cities sustainability champions? A double delinking analysis of environmental performance of urban agglomerations. Sci. Total Environ. 709, 134963. doi:10.1016/j.scitotenv.2019.134963
Li, Ma, Hualou, L., Kunqiu, C., Shuangshuang, Tu, Yingnan, Z., and Liao, L. (2019). Green growth efficiency of Chinese cities and its spatio-temporal pattern. Resour. Conservation Recycl. 146, 441–451. doi:10.1016/j.resconrec.2019.03.049
Li, Z. (2012) Report on China’s green transformation and development. Beijing: Central Party School Press of the Communist Party of China.
Lin, B., and Zhu, J. (2020). Policy effect of the Clean Air Action on green development in Chinese cities. J. Environ. Manag. 258, 110036–110110. doi:10.1016/j.jenvman.2019.110036
Liu, X., and Kong, F. (2021). Research on the impact of digital economy development on urban green transformation in the Yangtze River economic belt: from the perspective of the “three generations” space. Contemp. Econ. Manag. 43 (09), 64–74. doi:10.13253/j.cnki.ddjjgl.2021.09.008
Lorek, S., and Spangenbergj, H. (2014). Sustainable consumption with in a sustainable economy: beyond green growth and green economies. J. Clean. Prod. 63 (2), 33–44. doi:10.1016/j.jclepro.2013.08.045
Pan, H., Sun, Y., Wang, M., Dong, Z., Wang, Z., Zhang, Y., et al. (2024b). Rising from the ashes: transitioning towards carbon neutrality through the pathways of circular economy agglomeration. Ecol. Econ. 219, 108146. doi:10.1016/j.ecolecon.2024.108146
Pan, H., Yongling, Y., Yue, M., Zhou, H., and Hewings, G. (2024a). Whither less is more? Understanding the contextual and configurational conditions of polycentricity to improve urban agglomeration efficiency. Cities 149, 104884. doi:10.1016/j.cities.2024.104884
Peng, J., Deng, Q., and Zhong, Li (2020). The impact of China’s foreign direct investment and industrial structure upgrading on the development of green economy: a spatial spillover analysis based on interprovincial panel data. Jiangxi Soc. Sci. 4, 48–60.
Qunfeng, Ji, Chuancheng, Li, and Jones, P. (2017). New green theories of urban development in China. Sustain. Cities Soc. 30, 248–253. doi:10.1016/j.scs.2017.02.002
Ruyin, L., Haifeng, Li, Wu, M., and Wenbo, Li (2021). Dynamic evaluation of the green development level of China’s coal-resource-based cities using the TOPSIS method. Resour. Policy 74, 1–11. doi:10.1016/j.resourpol.2021.102415
Siemens (2019). Green city index [DB/OL]. Available at: https://new.siemens.com/global/en.html January 01, 2019).
Stark, D., and Bruszt, L. (1998) Postscocialist paths: transforming politics and property in East Central Europe. Cambridge: Cambridge University Press.
Verhoef, E. T., and Nijkamp, P. (2002). Externalities in urban sustainability: environmental versus localization-type agglomeration externalities in a general spatial equilibrium model of a single-sector monocentric industrial city. Ecol. Econ. 40 (2), 157–179. doi:10.1016/S0921-8009(01)00253-1
Wang, J., Wang, W., Ran, Q., Muhammad, I., Siyu, R., Yang, X., et al. (2022). Analysis of the mechanism of the impact of internet development on green economic growth: evidence from 269 prefecture cities in China. Environ. Sci. Pollut. Res. 29 (7), 9990–10004. doi:10.1007/s11356-021-16381-1
Wang, M., Zhao, H., Cui, J., Fan, D., Bin, Lv, Gang, W., et al. (2018). Evaluating green development level of nine cities within the Pearl River Delta, China. J. Clean. Prod. 174, 315–323. doi:10.1016/j.jclepro.2017.10.328
Wu, C., and Song, X. (2018). Factors influencing green development in cities along the Yangtze River Economic Belt and efficiency evaluation. Learn. Pract. (04), 5–13. doi:10.19624/j.cnki.cn42-1005/c.2018.04.001
Yanchao, F., Xiaohong, W., Du, W., Wu, H., and Wang, J. (2019). Effects of environmental regulation and fdi on urban innovation in China: a spatial Durbin econometric analysis. J. Clean. Prod. 235, 210–224. doi:10.1016/j.jclepro.2019.06.184
Yang, Y., Guo, H., Chen, L., Xiao, L., and Gu Mingyun, K. X. (2019). Regional analysis of the green development level differences in Chinese mineral resource-based cities. Resour. Policy 61, 261–272. doi:10.1016/j.resourpol.2019.02.003
Yin, H., Hong, T., and Ma, T. (2020b). Urban network externalities, agglomeration economies and urban economic growth. Cities 107, 102882. doi:10.1016/j.cities.2020.102882
Yin, J., Zheng, M., and Chen, J. (2015). The effects of environmental regulation and technical progress on CO2 kuznets curve: an evidence from China. Energy Policy 77, 97–108. doi:10.1016/j.enpol.2014.11.008
Yin, Q., Wang, Y., Wan, K., and Wang, D. (2020a). Evaluation of green transformation efficiency in Chinese mineral resource-based cities based on a three-stage DEA method. Sustainability 12, 9455. doi:10.3390/su12229455
Yuan, H., Yidai, F., Lee, J., Liu, H., and Ruzi, Li (2020). The spatial threshold effect and its regional boundary of financial agglomeration on green development: a case study in China. J. Clean. Prod. 244, 118670. doi:10.1016/j.jclepro.2019.118670
Zhong, J., Liu, J., Jiao, L., Lian, X., Zhibang, Xu, and Zhou, Z. (2021). Assessing the comprehensive impacts of different urbanization process on vegetation net primary productivity in wuhan, China, from 1990 to 2020. Sustain. Cities Soc. 75, 103295. doi:10.1016/j.scs.2021.103295
Zhou, F., and Shang, Y. (2022). The connotation, characteristics, and implementation path of green transformation in Chinese cities under the goal of carbon neutrality. Soc. Sci. 01, 51–61. doi:10.13644/j.cnki.cn31-1112.2022.01.005
Zhu, Y. (2011). Green transformation of urban development: identification of key elements and selection of promotion strategies. Southeast Acad. 5, 40–50. doi:10.13658/j.cnki.sar.2011.05.019
Keywords: urban agglomerations, green transformation, efficiency measurement, influencing factors, low carbon development
Citation: Ma X and Lin Z (2024) Evaluation and influencing factors of green transformation in three major urban agglomerations in China. Front. Environ. Sci. 12:1392511. doi: 10.3389/fenvs.2024.1392511
Received: 27 February 2024; Accepted: 18 April 2024;
Published: 09 May 2024.
Edited by:
Wei Zhang, China University of Geosciences Wuhan, ChinaReviewed by:
Haozhi Pan, Shanghai Jiao Tong University, ChinaZaijun Li, Yangzhou University, China
Haimeng Liu, Chinese Academy of Sciences (CAS), China
Copyright © 2024 Ma and Lin. This is an open-access article distributed under the terms of the Creative Commons Attribution License (CC BY). The use, distribution or reproduction in other forums is permitted, provided the original author(s) and the copyright owner(s) are credited and that the original publication in this journal is cited, in accordance with accepted academic practice. No use, distribution or reproduction is permitted which does not comply with these terms.
*Correspondence: Zhihan Lin, bGluemhpaGFuOThAMTI2LmNvbQ==