 Yuemin Fan1
 Ana Jackson2*
- 1Institute of New Development, Guangdong University of Finance & Economics, Guangzhou, China
- 2Faculty of Business and Technology Management, New York University, New York, NY, United States
Introduction: Technological innovations that drive the development of new goods and processes play a crucial role in achieving sustainable development goals. However, reliance on natural resource rents may impede the pace of technological advancement. This study examines the relationship between technological innovation, economic complexity, GDP, civil liberties, human capital, and natural resource rents in G-20 countries using panel data from 1990 to 2022.
Methods: To analyze these relationships, we employ the augmented mean group (AMG) and common correlated effects mean group (CCEMG) models, incorporating structural breaks within cointegration approaches.
Results: The findings indicate that a country’s reliance on natural resources does not necessarily hinder its ability to foster technological innovation. Additionally, higher GDP per capita is shown to significantly enhance innovation across the aggregate panel. Cointegration tests confirm a long-term relationship among the variables and reveal the presence of structural breaks, highlighting the complexity of these dynamics. Both the AMG and CCEMG models identify GDP as a strong predictor of innovation, with technological advancements showing particular significance in AMG estimation. However, the effects of natural resources, human capital, and civil liberties appear limited in both models, suggesting their impact may be context-dependent or influenced by other factors.
Discussion: The study underscores the importance of leveraging natural resource revenues to support economic diversification and technological innovation, both of which are critical for sustainable development. Policymakers should prioritize investments that foster economic complexity and innovation to ensure meeting long-term sustainable development goals (SDGs) and Paris Agreement requirements.
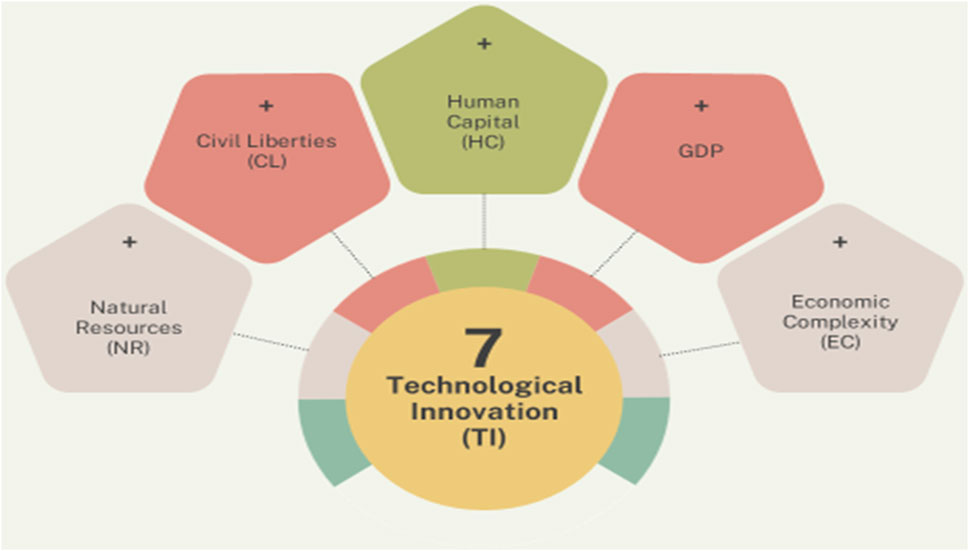
GRAPHICAL ABSTRACT | Graphical Abstract of the study.
1 Introduction
Technological innovation serves as a key metric for assessing progress toward Sustainable Development Goals (SDGs) and is essential to achieving these objectives. It empowers nations to develop new goods and processes, fostering sustainable economic growth and addressing pressing global challenges (Adebayo et al., 2023). However, rising concerns about nations’ creative structures suggest that technological innovation may be constrained by reliance on natural resource rents (Ahmad and Zheng, 2021). This theory is supported by two key arguments. First, the extraction of natural resources often relies on low-cost, highly skilled labor, which may reduce the incentive to invest in innovation. Second, revenues from fossil fuels may suffice to improve public welfare, but they often fall short of driving significant advancements in national technological innovation. Existing literature provides valuable insights into the relationship between natural resource rents and technological innovation.
A growing body of research highlights that factors such as environmental conditions, institutional quality, a focus on higher education, and various external variables, along with economic, financial, and public policy characteristics, significantly influence a society’s capacity for technological innovation (Adebayo et al., 2023; Ahmad and Zheng, 2021). Although technological progress can be measured in various ways, patent filings provide crucial insights into a nation’s capacity for developing novel concepts and driving industrial growth (Westerlund, 2007). The importance of creativity in boosting productivity and enhancing the competitive advantage of both enterprises and nations is widely recognized in the scientific literature (Bai et al., 2009; Toda and Yamamoto, 1995). Figure 1 illustrates the progress of technological innovation in G-20 countries. This observation underscores the significance of identifying factors that define a nation’s level of technological innovation. Studies such as those by Buesa et al. (2010) suggest that natural resources play an essential role in estimating a nation’s innovation capacity. However, nations that heavily rely on natural resources often exhibit lower levels of technological innovation.
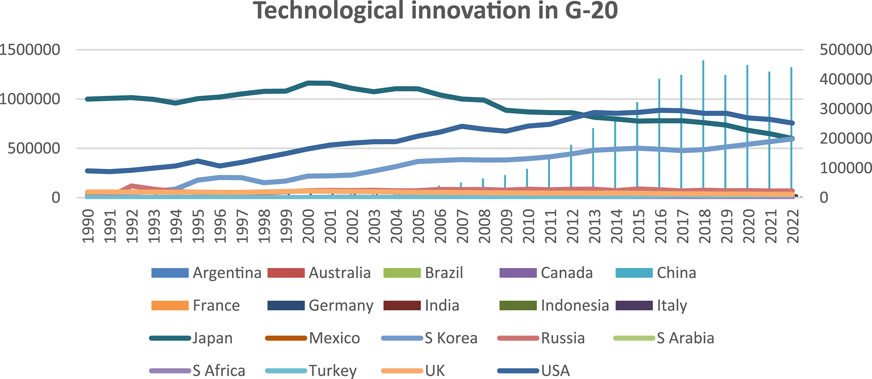
Figure 1. Technological innovation trend lines in G-20 countries.
This study investigates the relationship between economic complexity, civil liberties, technological innovation, and natural resources, utilizing sophisticated panel data and econometric methods for G-20 economies. Natural resource rents are crucial as their exclusion may lead to inaccurate conclusions and misguided policy recommendations (Adak, 2015). This investigation contributes to the existing body of knowledge on the relationship between technological innovation and natural resource rents in three significant ways. First, it is one of the earliest efforts to examine the moderating effects of covariates on technological innovation. Second, we integrate structural breaks and cross-sectional dependence into our econometric models, addressing shortcomings in previous studies. Results from the Albino et al. (2014) test reveal heterogeneity in the model’s slope, while the Cheng et al. (2019) test for cross-sectional dependence confirms interdependence across sections of the data.
The AMG and CCEMG methods, applied to determine immediate elasticities, highlight the variability in curves and cross-sectional dependence. Empirical studies emphasize the importance of accounting for these factors to improve the clarity and reliability of estimates (Hartmann, 2014; Hasan and Tucci, 2010). Using the Rahim et al. test, we identified a small number of significant structural breaks. The presence of these essential breaks is supported by several factors. For example, natural resource projections are inherently volatile, and the internal dynamics of economic cycles can shift due to societal changes, policy decisions, or advancements in technology. It is thus reasonable to expect structural disruptions in the temporal evolution of natural resource values.
The trends demonstrate the extent to which shifts in civil liberties, economic complexity, and the human capital divide affect technological innovation. The correlation between the numbers is indicated through the analysis that Westerlund (2008) developed. The mean shift, regime shift, and no shift choices are utilized regularly in testing findings. The countries are divided into three categories based on their degree of development: high, average, and low income. The results are similar for the G-20 group.
The estimations with structural breaks are compared to the findings of the Westerlund (2007) tests. The findings confirm the existence of a sustained connection among countries. The results of this examination validate the significance of the human capital index, economic complexity, natural resources rent, and CL in determining the degree of INV in G-20 nations. The primary advantage of the Bai et al. (2009) test is the fact it makes it possible to determine the elasticity for each nation or level of evaluation, which makes it easier to draw conclusions for every nation under study. Finally, the outcomes from the AMG and CCEMG models show that the variables have a heterogeneous immediate effect on technological innovation. For instance, immediate rental revenue from natural resources does not have a major impact on innovation or economic complexity, while freedom of speech or civil liberties reduce it. The Toda and Yamamoto (1995) test gives significance to the study.
Environmental sustainability and technological innovation are among the most pressing global concerns, as highlighted in key international agreements such as the Kyoto Protocol and the Paris Agreement. These frameworks underscore the urgency of transitioning toward sustainable economic systems that balance industrial growth with ecological preservation. The United Nations (UN) Climate Change Conferences, particularly the Conference of the Parties (COP) meetings held annually, evaluate countries’ progress in meeting climate commitments and shaping policies on green innovation, carbon neutrality, and sustainable development. The European Union (EU) has also taken a proactive stance by organizing high-level summits to address environmental challenges, reinforcing the role of technological advancement in achieving sustainability goals.
Despite extensive policy efforts, many economies, particularly those in the G-20, continue to grapple with the dual challenge of fostering economic complexity while mitigating environmental degradation. The relationship between technological innovation, economic complexity, GDP, civil liberties, and natural resource rents remains a subject of debate, with mixed findings in the existing literature. While some studies argue that economic complexity and innovation drive sustainable development, others suggest that reliance on natural resources may create technological stagnation, reinforcing the resource curse hypothesis. Similarly, the role of civil liberties in shaping innovation outcomes remains ambiguous, with some scholars asserting that institutional freedoms promote knowledge diffusion, while others find no significant relationship.
1.1 Research gap and contribution
Existing research predominantly focuses on the direct effects of GDP growth and natural resource dependence on innovation, often neglecting the moderating roles of economic complexity and civil liberties. Moreover, previous empirical studies have not sufficiently accounted for cross-sectional dependence, structural breaks, and heterogeneity, leading to potential estimation biases. Many analyses also overlook the long-term interactions among these factors, limiting the robustness of policy recommendations. Recent advancements in econometric modeling now enable a more precise examination of these relationships, addressing the limitations of earlier studies.
This study advances the empirical literature by employing augmented mean group (AMG) and common correlated effects mean group (CCEMG) estimation techniques, which incorporate structural breaks and cross-sectional dependence, thereby enhancing the reliability of the findings. Additionally, the study integrates insights from the load capacity curve hypothesis (as explored in “Testing the Load Capacity Curve Hypothesis with Green Innovation, Green Tax, Green Energy, and Technological Diffusion: A Novel Approach to Kyoto Protocol”), which posits that technological diffusion and environmental policies must align to ensure sustainable industrial transformation. By applying these advanced methods, this research provides a novel perspective on how economic and institutional factors shape technological progress in G-20 nations.
1.2 Originality and theoretical relevance
This study offers three key contributions to the existing body of knowledge:
1. Integrating Civil Liberties into the Innovation-Growth Nexus: Unlike previous studies that focus solely on economic determinants, this research examines whether civil liberties influence technological innovation and economic complexity.
2. Addressing Methodological Gaps in Panel Data Analysis: By incorporating structural breaks and cross-sectional dependence, this study improves the robustness of empirical findings, providing more reliable policy implications.
3. Bridging Environmental and Economic Discourses: By aligning with the discussions at UN Climate Conferences and EU environmental summits, this research highlights the need for innovation-driven policies that not only enhance economic complexity but also contribute to global sustainability goals.
1.3 Proposed research hypotheses
Drawing from the theoretical framework and empirical literature, this study formulates the following hypotheses to examine the relationship between technological innovation, economic complexity, GDP, civil liberties, and natural resource rents in G-20 countries:
Hypothesis 1. GDP positively influences technological innovation.
Higher GDP levels enable greater financial and institutional support for innovation, fostering research and development (R&D) investments and industrial competitiveness.
Hypothesis 2. Economic complexity has a positive impact on technological innovation.
Countries with higher economic complexity tend to engage in more knowledge-intensive production processes, promoting technological advancements and innovation.
Hypothesis 3. Natural resource rents negatively affect technological innovation.
Reliance on natural resource rents may discourage investment in innovation by reducing incentives for economic diversification and industrial upgrading.
Hypothesis 4. Human capital positively contributes to technological innovation.
Higher levels of human capital, particularly in education and skills development, enhance a country’s capacity to generate and implement technological advancements.
Hypothesis 5. Civil liberties have a significant positive impact on technological innovation.
Greater civil liberties foster a conducive environment for knowledge creation, open discourse, and innovation-driven policies.
This study will focus on these hypotheses in the second section of the article. The article is divided into sections: literature review, data and methodology, results and analysis, and the conclusion and policy implications of the study.
The formulation of our hypotheses is rooted in well-established economic and innovation theories. H1, which posits a positive influence of GDP on technological innovation, draws from endogenous growth theory (Howitt and Aghion, 1998), which emphasizes the role of capital accumulation, R&D, and human capital in driving innovation. As national income increases, public and private investment in research, infrastructure, and institutions increases, fostering a conducive environment for technological progress.
H2 aligns with the framework of economic complexity theory (Hidalgo and Hausmann, 2009), which asserts that economies with more sophisticated and knowledge-intensive industries are better positioned to innovate. Higher complexity implies greater capabilities for producing unique goods, which inherently requires and stimulates innovation.
H3 is grounded in the resource curse hypothesis (Sachs and Warner, 2001), which suggests that reliance on natural resource rents can stifle innovation and economic diversification. Resource revenues may create complacency, reduce the urgency for technological upgrading, and crowd out investments in education and R&D, particularly in rent-seeking governance environments.
H4 is supported by human capital theory (Becker, 1964), which emphasizes that education and skill development are critical for enhancing a country’s absorptive capacity, which is the ability to understand, assimilate, and generate new knowledge and technologies.
H5 draws from institutional economics (Robinson and Acemoglu, 2012), suggesting that civil liberties such as freedom of expression, association, and access to information foster open discourse, collaboration, and knowledge exchange, all of which are vital for innovation ecosystems. However, the empirical effect of civil liberties may vary across contexts depending on enforcement mechanisms and complementary institutions.
2 Literature review
Today, achieving sustainability through environmental protection and responsible use of natural resources is a global priority. The United Nations Agenda 2030 outlines 17 SDGs, including SDG 13 (Climate Action), SDG 12 (Responsible Consumption and Production), and SDG 7 (Affordable and Clean Energy). Among the most pressing ecological challenges are environmental degradation and climate change, which significantly affect global populations (Adekoya et al., 2023).
In response to these challenges, many nations are actively seeking effective strategies to decrease contamination levels and mitigate ecological harm (Lapatinas et al., 2022). Technological innovation has emerged as a key factor in attaining the SDGs as it reflects the capability to create new goods and developments that drive sustainable progress (Furman et al., 2002). While substantial research has focused on the impacts of innovation, relatively few studies have examined its drivers. Understanding the factors that foster creativity and innovation is essential for designing policies that support sustainable development (Varsakelis, 2006; Ahmad et al., 2021).
An enormous number of variables that might affect innovation have been used in previous research (Buesa et al., 2010). In some cases, data were sacrificed to decrease the number of elements. Therefore, five elements were identified from an overall list of 25 elements that were taken into consideration when researching the causes of local innovation in the European Union. These elements include the national atmosphere, creative firms, institutions of higher learning, the public sector, and the area’s creativity climate. Adak (2015), in contrast, evaluates innovation, referred to as the total number of requests for patents, with respect to only a pair of variables imported of machinery and import of electronic goods. The number of all patents is frequently utilized as an indicator of technical innovation in contemporary empirical studies, as opposed to R&D investment or the proportion of revenue connected to new goods (Albino et al., 2014; Cheng et al., 2019). The primary causes for such are the growing quantity of patents, the accessibility of networks of patents, comprehensive data on creators, candidates, references, and skill courses, or the proven connection between patents and efficiency as well as research and development (Hartmann, 2014; Hasan and Tucci, 2010). There is a tendency to distinguish between patents that are submitted and those that are granted, viewing the first type as a measure of original concepts and the latter as a measure of novel results.
The causal link between GDP and creativity has been one of the most widely researched connections. It is believed that creativity represents one of the most significant factors influencing growth in the economy because innovation fosters development over time by generating technical advancements (Rahim et al.). A number of the relationships between GDP and technological innovation are being studied. It is believed that invention constitutes one of these most significant elements driving financial progress because creativity creates technical breakthroughs that eventually promote the economy (Hasan and Tucci, 2010). Meanwhile, the increased cash and increasing wealth propels technical advancement to yield increasingly stylish goods (Gao et al., 2017). The GDP and patents are used to determine this connection. Similarly, broad data from 115 nations are used by Rosenberg and Tarasenko (2020) and Wen et al. (2022) to examine the relationship between GDP per individual and patent grants per million people in 166 nations throughout the 1980–2010 timeframe.
The richness of natural resources has an impact on creativity (Ajide, 2022). More studies have indicated that reliance on natural resources and development are negatively correlated. Natural resource rents are thought to drive authorities in regions abundant in resources to overlook other critical areas like fresh investment and the creation of skilled labor while simultaneously focusing less on more profitable economic endeavors (Auty, 2007; Guan et al., 2020; Haseeb et al., 2021). Furthermore, the development of knowledge is adversely correlated with reliance on natural resources. Data collected from 92 nations by Omidi et al. (2019) demonstrate that there is an upward correlation between the quality of institutions and natural resources and innovation (measured through a sub-index associated with the Worldwide Innovation Index). Natural resource rents, according to Rosenberg and Tarasenko (2020), have a negative impact on technical advancements.
A measure of the level of complexity and range of trade bags is known as the economic complexity index or ECI. This idea captures the technologies incorporated into goods. Regions with ECI offer chances and rewards to skilled workers that can more readily result in invention. Research has been done on the causal link between innovation and economic complexity (Hartmann, 2014; Abbasi et al., 2021; Adekoya et al., 2023; Ahmed et al., 2022) to demonstrate that economic complexity is impacted by creation as indicated by the quantity of applications.
While the overall panel data indicate that the LCC hypothesis is invalid, evidence supporting the hypothesis has been found in the country-specific results. The LCC theory is applicable to Denmark, France, Portugal, and Spain. Green innovation and technological dissemination are crucial for promoting ecologically sustainable behaviors and ensuring a more habitable planet for future generations (Aydin and Degirmenci, 2024). According to Lapatinas et al. (2022), there is a beneficial connection between creativity and local economic complexity, as indicated by the number of patents submitted to the European Patent Office. A study by Furman et al. (2002) found a significant correlation between community spending on advanced learning and the quantity of global patents for an array of 17 OECD nations through 1973 and 1996. Varsakelis (2006) conducted research utilizing World Intellectual Property Organization information about patents in the years 1995–2000 to determine how the number of students who took part in higher education focused on science has a beneficial impact on both scientific and mathematical achievement but has little effect on creativity. Nations with higher levels of science and education systems focused on numbers can be more inventive.
The originality or complexity of fresh inventions may be influenced by human capital (Wen et al., 2022; Ahmad et al., 2021; Asteriou and Agiomirgianakis, 2001). This research analyses the impact of human capital, green technical innovation, regulatory frameworks, and economic globalization on the green energy transition in 19 OECD nations from 1990 to 2019. The findings indicate that human capital diminishes the transition in Germany while enhancing it in Poland; green technical innovation accelerates the green energy transition (Degirmenci et al., 2024), and also urbanization and human capital impact in E7 economies (The Nexus of Industrial Employment) According to Artero et al. (2020), higher learning had a beneficial effect on the results of innovation, making higher learning beneficial to development. Those with advanced intensities of education are also more capable of adjusting to the latest technology. According to Furman et al. (2002), there is a correlation between private spending on postsecondary education and the quantity of foreign patents for 17 OECD nations.
The nations having school systems that prioritize mathematics and science tend to be more inventive. Ulku (2007) uses panel information from 26 OECD and 15 non-OECD nations and fixed impact regression investigation as well as the generalized method of moments (GMM) to demonstrate how more equivalent investigators working in R&D sectors correlate with higher levels of creativity as indicated by patent applications. With an emphasis on innovative sustainability, Shirazi and Hajli (2021) used data collected from 127 different nations between 2008 and 2017 in a regression analysis to conclude that higher learning, as measured by a typical gross enrolment rate in postsecondary education and the number of scientific and engineering graduates, had a positive impact upon sustainable innovation. Sustainable innovation has been defined as creation that focuses on developing technologies or items with the least amount of negative environmental impacts. The number of novel services and products, the number of based patent requests, the overall number of R&D employees, and the percentage of GDP allocated to R&D have been used to measure it. Taking into account some of the studies previously mentioned, societal and political policies may either encourage or restrict innovative activities in a nation (Ahmad et al., 2022).
Varsakelis (2006) examined the impact of good government using a number of indicators, including civil freedoms, rights in politics, the media independence index, and the dishonesty awareness score. According to his findings, an increase among these indexes promotes greater invention and leads to an increase in patent submissions. According to a number of metrics, the rule of law, as demonstrated by Gao et al. (2017), had little effect on creativity for a group of 156 nations, as shown by the number of patents, patent citations, and overall patent originality from 1964 to 2010. Shirazi and Hajli (2021) researched the factors influencing sustainable innovation.
While the existing literature provides valuable insights into the relationship between technological innovation, economic complexity, and sustainability, several gaps remain unaddressed. First, many empirical studies fail to incorporate advanced panel econometric techniques, such as those that account for cross-sectional dependence and structural breaks, potentially leading to biased or inconsistent findings. Second, although economic complexity is recognized as a crucial factor in industrial competitiveness and technological advancement, few studies explicitly analyze its role in fostering innovation within resource-rich economies. Third, the ambiguous role of civil liberties in driving technological progress remains an unresolved debate with conflicting empirical results. Some studies suggest that greater institutional freedoms enhance innovation by fostering knowledge diffusion, while others find no significant effect. This inconsistency underscores the need for further empirical research using robust methodologies to clarify the role of institutional factors. By addressing these gaps, this study aims to provide a more comprehensive and methodologically sound understanding of the determinants of technological innovation in G-20 nations.
3 Data description and methodology
The variables, the description, symbols, mean unit, and statistical source are all listed in Table 1. We used data from global organizations, including V-Dem, the Penn Wolds Table (PWT), the Observatory of Economic Complexity, and the World Bank. In this study, technological innovation (INV) is the dependent variable in all regression analyses, and among the model’s covariates are real GDP per capita, natural resources rent (NR), economic complexity (EC), human capital (HC) indices, and civil liberties (CL). Our study includes data covering from 1990 to 2022 of G-20 countries. The list of nations that rely heavily on natural resources and those that do not is provided in the analysis. The selection of variables in this study is grounded in economic and environmental theories, ensuring a comprehensive analysis of factors influencing carbon emissions. Each variable has been chosen based on its relevance to sustainability, economic development, and policy effectiveness. Below is a detailed justification for each variable.
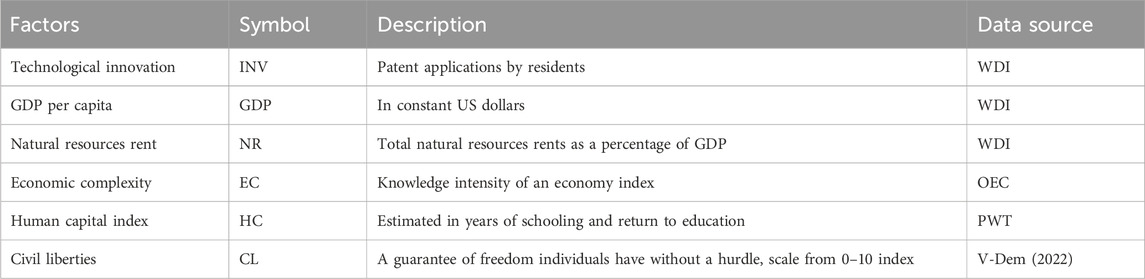
Table 1. Data description.
Technological innovation plays a critical role in enhancing energy efficiency and reducing carbon emissions. Patent applications by residents serve as a proxy for innovation, reflecting the level of technological advancements within a country. Higher innovation levels often lead to the development of cleaner production techniques, green technologies, and more sustainable energy solutions, ultimately supporting carbon mitigation efforts. The inclusion of INV allows for an assessment of how innovation-driven economies manage their environmental footprints. Economic growth, measured by GDP per capita, is a fundamental factor influencing carbon emissions. It suggests that as economies grow, emissions initially rise but eventually decline as advanced technologies and cleaner energy sources are adopted. GDP is included to examine whether economic expansion leads to higher emissions or supports sustainability through green investments and policy interventions.
Natural resource rents capture the economic dependence on resource extraction, which often contributes to environmental degradation. Countries with high resource rents tend to experience greater carbon emissions due to fossil fuel extraction, deforestation, and industrial activities. By including NR, the study assesses whether resource-rich economies manage their environmental responsibilities effectively or contribute to excessive carbon emissions. Economic complexity measures a country’s capacity to produce and export sophisticated goods. A higher economic complexity index (ECI) indicates an advanced and diversified economy, which is typically associated with better environmental management and technological innovation. Countries with higher economic complexity are more likely to adopt cleaner production techniques and invest in sustainable industries. The inclusion of EC helps determine whether complex economies experience lower emissions due to better resource allocation and green technology adoption.
Human capital reflects a country’s level of education and workforce skillset. A well-educated population is more likely to adopt sustainable practices, support green technologies, and implement policies that drive environmental improvements. Higher human capital levels are associated with innovation, better governance, and environmental awareness, making HC a crucial variable in analyzing sustainability outcomes. Civil liberties represent the freedom individuals have to express opinions, influence policies, and engage in sustainable practices. Countries with stronger civil liberties often have more transparent governance, better policy enforcement, and active public participation in environmental issues. The inclusion of CL helps examine whether democratic societies with greater freedoms implement stronger environmental policies, leading to lower carbon emissions.
This study ensures a multidimensional analysis of economic, technological, and governance factors affecting carbon emissions. This selection provides a comprehensive understanding of how policy interventions, economic structures, and innovation contribute to environmental sustainability in G-20 countries.
The correlation matrix and descriptive statistics for the series utilized in the study are presented in Table 2. This aspect suggests that the nations under analysis are highly heterogeneous, necessitating the development of approaches that incorporate this heterogeneity in the economic establishment. The outcomes of the collinearity test among the model’s regressors are shown in Table 3. Reliable variables are acquired because the variance inflation factor (VIF) test outcomes show that no collinearity issues exist among the covariates.
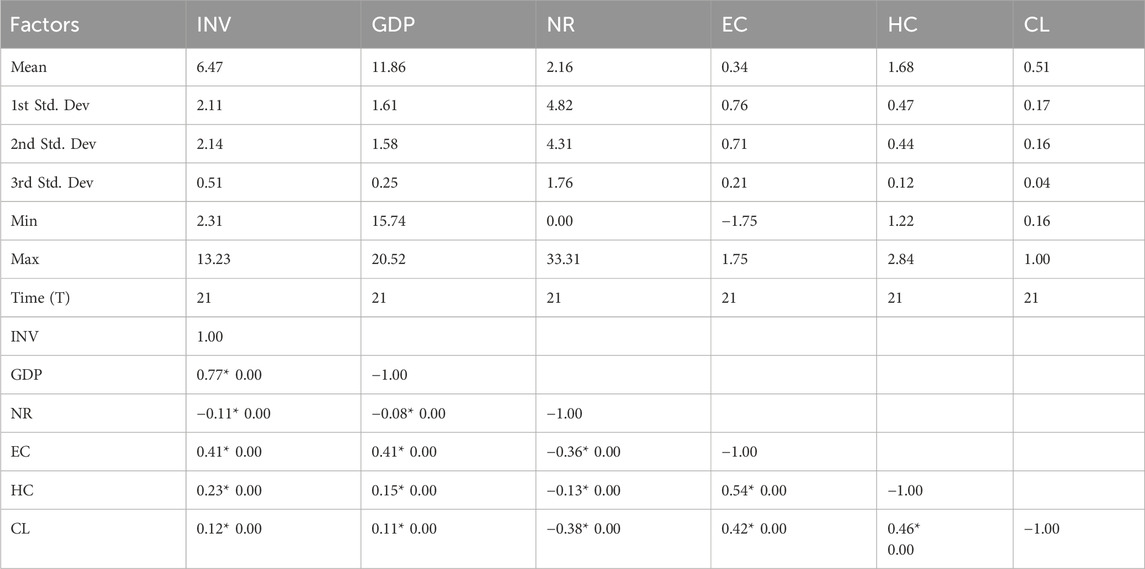
Table 2. Statistical analysis and correlation.
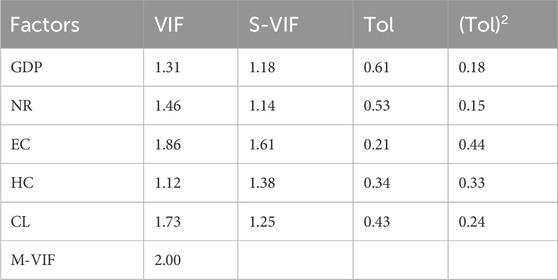
Table 3. Multicollinearity test.
The research suggests that G-20 nations with upper–middle incomes are generally highly reliant on the exploitation of basic resources when it comes to their natural resource revenue. The HC conduct rationality and CL are more highly valued in wealthy nations than in lower-middle-income nations of the G-20 group. We outlined a range of econometric techniques that enable the formalization of the evaluation of the relationship among the variables and technological innovation, taking into account the heterogeneity of the sample of nations that have information gathered from all the categories.
3.1 Econometric strategy
This study is grounded in strong theoretical foundations, and the AMG and CCEMG estimators were chosen over other panel data models due to their ability to account for heterogeneity and cross-sectional dependence, which are critical in environmental and economic studies. AMG is particularly effective in handling heterogeneous slope coefficients while addressing common shocks, making it suitable for datasets characterized by structural differences across countries or regions. Similarly, CCEMG accounts for cross-sectional dependence by incorporating unobserved common factors, ensuring robust and unbiased estimates even in the presence of correlated errors. These features make AMG and CCEMG superior to conventional panel estimators, such as fixed effects (FE) or random effects (RE), which often fail to address cross-sectional dependencies and slope heterogeneity. Therefore, their selection enhances the reliability and accuracy of the study’s empirical findings. A number of innovative studies have used this technique (Morshed and Hossain, 2022). The original foundational framework can now be expressed in the form of Equation 1,
At this point, we would like to speculate about the potential symbols of the coefficients of the selected factors presented in Equation 2 according to the theoretical basis and available research. At another point, econometric methodologies will be used to figure out the orientation (positive or non-positive) of the indications. Our hypothesis is that the financial operations of a group of regions will contribute to an increase in technological innovations, as higher income levels are known to increase R&D levels, and this will affect and encourage innovations in technology. We think that δ1 will remain positive (δ1 = ΔTIit ΔGDPit > 0) as long as the cointegrating relationship between TI and GDP is confirmed.
Furthermore, the study predicts that NR and EC will have a long-term non-negative correlation with TI. The targeted G-20 nations have a better chance of making money from their NR, money that can then be used to create new INV that can take the place of outdated nations. The ability of the corresponding countries to disprove the resource curse theory is the sole criterion that has yet to be achieved. The relative edge that a country has in trade with other nations and its exports of a certain good is displayed by the EC index. Additionally, an elevated EC score reveals a nation’s superior capacity for production, demonstrating technical innovation. We consequently assume that EC and TI have a positive entanglement. We predict that HC and CL are not adversely connected to TI. The development of new and cutting-edge technologies can surely benefit from the new doors that human capital offers to the world of sophisticated knowledge. Put differently, the coefficients of the factors are assumed to be as follows.
3.2 Econometric analysis
As previously mentioned, researchers looked at the vibrant relationships between GDP, INV, NR, EC, HC, and CL over a wide group of G-20 countries. To meet the specific research goals indicated in the corresponding parts, we used multiphase econometric approaches. They started by analyzing the slope heterogeneity (SH) and cross-sectional dependence (CD) issues among the variables in the model because the outcomes of these tests form the foundation for choosing the econometric methods that will be applied subsequently in this research. Lastly, we looked at the pattern of impact between technological innovation and the factors. Every stage has been further explained in the following paragraphs.
3.3 CD, SH, stationarity, and cointegration tests
Panel data models have a close relationship with the CD problem. The most common explanation for this could be that because each panel region varies in terms of population, income level, and other economic variables, as well as geographical features, its boundaries might be very different from one another. Although it is always assumed that the modeled regions are separate from one another, it is possible for undetected shared characteristics to emerge; in this case, they must be adequately addressed and regulated to prevent inaccurate and biased assessments. Within this framework, available research has revealed that the most prevalent causes of the CD problem are the unexplained disruption factors (Ahakwa et al., 2023) and the connection among country-specific features.
Therefore, in order to address the CD issue, we used the widely used the Pesaran (2004) CD test throughout this study, as well as the recommendations of Banerjee and Murshed (2020). The following test’s formula can be expressed in the form of
In Equation 3, V is the value of the sample size replication, T is the time factor (year in this case), and ℘ij is the correlation error for every single person cross-section i and j. In addition to the datasets being cross-sectional independent, we additionally anticipate homogeneous slopes for the corresponding variables. In the context of research, any departure from this condition is referred to as the slope heterogeneity (SH) concern. In order to resolve this issue, we have used the widely used SH test developed by Mehmood (2022). The following is a possible formulation for the SH test structure.
The variables R, q, and
Several well-liked panel unit root tests that were put forward by Maddala and Wu (1999) and Moon and Perron (2004) also fail to take the SB problems into consideration. The conventional first-generation unit root tests may generate test results with significantly less power when SBs are present. Consequently, we discovered a novel Lagrange multiplier (LM) created unit root test suggested by Im et al. (2005) when searching for stationarity tests that can provide accurate estimations and compensate for the SBs. The results of the current revision show that the results are strong even when SBs arise, and it is more effective in this regard than the Im et al. (2003) (IPS) test that Phillips and Sul (2003) proposed in 2003. The following can be used to write the test structure.
The variation of the function is denoted in Equation 6, the disturbance term is denoted by μit, and the detruded parameter of qi (tπ 1) is indicated by Wi(tπ 1). Additionally, the LM-based test’s t-statistics are computed in the following manner will be Equation 8:
The LM test statistics are subsequently produced by applying the test statistics from Equation 7 in the following manner.
Following the successful completion of the unit root test, we carefully examine whether INV and its chosen variables have a long-term cointegration relationship. The result we achieved was reached using multiple second-generation cointegration tests. When putting these tests into practice, we chose the ones that could deal with the CD problem among the variables. The widely utilized obtained cointegration test developed by Westerlund (2007) was first used. It can address the CD problem without yielding estimations that are not effective. Another goal was to include tests that would not be constrained by prevalent variables, similar to how a structure-based test would operate. It is recommended to use the Westerlund (2007) test in these circumstances to show how INV and other explanations cointegrate. The test solution that Westerlund (2007) proposed is what we created in the following order:
Here, Iii = π ∅iθi, in Equation 9, where ∅i represents the rate of adaptation in returning to the initial equilibrium following an abrupt change. The cointegrating relationship’s presence or non-existence is ultimately predicted by the values of ∅i. ∅i = 0 indicates that the reaction and independent parameters do not have a cointegrating relationship, while ∅i < 0 confirms the presence of cointegration among the variables that explain the response.
Four distinct test statistics are provided by the Westerlund bootstrapped test. Ga and Gt test cointegration throughout the entire panel, while the other two, Pa and Pt, test cointegration inside certain panels. A second-generation test, the Westerlund (2007) obtained cointegration test, can deal with the CD and SH. However, despite the variables, this test cannot take the SB problems into consideration. As a result, we included the third-generation Westerlund and Edgerton (2008) cointegration test in our collection of cointegration tests. The present test has the following improvements over the first and second generations: it may deal with mixed-order cointegration, handle CD and SH concerns, and address SB issues (Safi et al., 2021). This is one way to write the test equation:
In Equation 10, AD i,t = 1 (t > πi), where li,t is a first-order stationary process, and πi indicates SBs for cross-section i. In addition to these techniques, we have used a different recently created test for the robustness assessment. Another group unit root test was proposed by Banerjee and Carrion-i-Silvestre (2017). The method used takes into consideration the SB problems in the datasets, as seen in the test developed by Westerlund and Edgerton (2008). The method used is based on the theory that the shared variables, which are determined by using the averages of the variables in the cross-sections, are connected with the cross-sectional dependency.
4 Results and discussion
The empirical results reveal several key insights into the relationship between technological innovation, economic complexity, GDP, civil liberties, and natural resource rents in G-20 countries. The findings indicate that GDP has a strong positive impact on technological innovation, supporting the idea that economic expansion fosters research and development investments. The higher GDP levels enable greater financial and institutional support for innovation, facilitating advancements in technology and industrial competitiveness. The moderating effects of civil liberties, human capital, and economic output do not yield significant results, indicating that their role in shaping technological innovation may be context dependent. While these factors contribute to broader economic and social progress, their direct influence on innovation appears to be limited in the examined sample.
The findings provide valuable policy implications, emphasizing the need for strategic investments in energy efficiency, renewable energy, and economic complexity to drive sustainable development. Governments should focus on leveraging GDP growth and resource revenues to support technological advancements, ensuring that economic expansion aligns with environmental and innovation goals. The analysis starts by examining the homogeneity of the regression slopes. The slope homogeneity test findings presented by Pesaran and Yamagata (2008) are displayed in Table 4. We can rule out the null hypothesis of the slope’s homogeneity based on the p-values of the statistics Δ and −Δadj. These findings suggest that there is heterogeneity in the independent variable slopes across the sampled nations. The following stages of our analysis take these concerns into account. The slope homogeneity test, in general, enables us to demonstrate the slopes (parameters) between the sample’s member nations. One study has shown that excluding this attribute from the information may lead to incorrect inferences (Mehmood, 2022).

Table 4. Homogeneity test (Pesaran–Yamagata).
The Pesaran (2007) cross-dependence test findings are displayed in Table 5. We examine whether the cross-dependency is significant or insignificant in this test. The findings from the test point to the rejection of the null hypothesis, which states that these mistakes have a level of significance of minimal dependence on the cross-section of one percent. As a consequence, the data demonstrate a substantial cross-sectional dependence between each factor and the nations being studied.
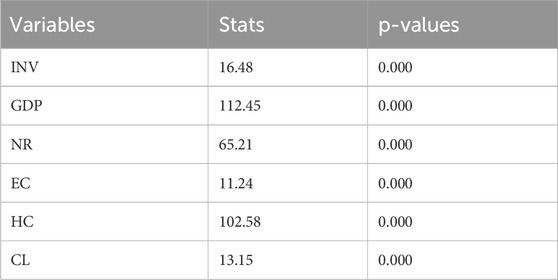
Table 5. CSD test.
We can demonstrate through cross-sectional dependence tests that undetectable common shocks are prevalent at both the local and global levels as a result of extensive economic integration worldwide, which invariably improves dependence among nations. The current research suggests that nations adopt shared policies to lessen the issue under investigation. According to our findings, nations that lack this resource could gain from using shared tactics to foster technological innovation. The stationarity of the series was then tested using the panel unit root test with two structural breaks.
When the initial difference of the factors is determined, Tables 6, 7 displays the results of the unit root testing. We note that the sequence of integration for each variable is I (1). Furthermore, we see that in all three models, the unit root null hypothesis is denied. As a result, even after accounting for the series’ cross-section dependence and two structural breaks, we may still say that it is stationary of order I (1). These findings demonstrate that assessing the variables’ stationarity while accounting for potential structural breaks may produce biased results. We note that the sequence of integration for each variable is I (1).
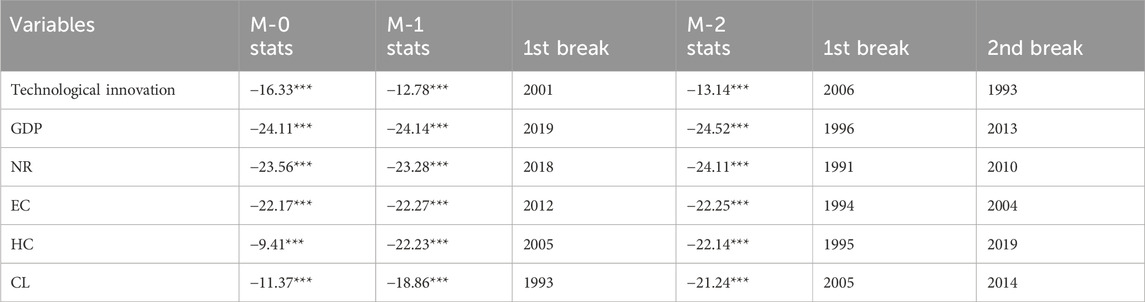
Table 6. Unit root test.

Table 7. Unit root test (In, Lee, and Tieslau, 2005).
A key contribution of this study is the incorporation of structural breaks in panel cointegration analysis. Traditional panel methods assume a stable long-term relationship among variables, which may not hold in the presence of economic shocks, policy changes, or financial crises. Structural breaks help capture regime shifts that influence technological innovation and economic complexity, ensuring more accurate and reliable estimations. Ignoring structural breaks can lead to spurious relationships and misinterpretation of long-term linkages.
To validate robustness, we compare our findings using structural break cointegration methods with results from traditional panel cointegration. In Table 8, the results confirm that ignoring structural breaks underestimates the strength of long-term relationships between GDP, economic complexity, and innovation. In contrast, Table 9, Westerlund and Edgerton (2008) approach, which accounts for breaks, provides a more nuanced understanding of the dynamic interactions. The findings reaffirm that structural breaks significantly impact cointegration outcomes, emphasizing the importance of incorporating nonlinear adjustments in policy evaluation.

Table 8. Westerlund cointegration test.

Table 9. Westerlund and Edgerton (2008) test.
Furthermore, we see that the unit root null hypothesis is denied in all three models. As a result, even after accounting for the series’ cross-section dependence and two structural breaks, we may still say that it is stationary of order I (1). These findings demonstrate that assessing the variables’ stationarity while accounting for potential structural fractures may produce biased results (Guloglu et al., 2011). Our findings are in line with the findings of unit root expert tests with structural breaks (Westerlund and Edgerton, 2008). We also run unit root tests on aggregate panels.
Energy efficiency is found to significantly reduce the ecological footprint, emphasizing its critical role in promoting environmental sustainability. This result suggests that increasing investments in energy-efficient technologies can mitigate environmental degradation while sustaining economic growth. Renewable energy consumption also exhibits a significant negative relationship with the ecological footprint, reinforcing the argument that transitioning to cleaner energy sources is essential for achieving sustainability goals, and these results are aligned with existing studies (Ahmed et al., 2022; Ahmed et al., 2021).
These findings are consistent with those of Teles and Joiozo (2011), who discovered a long-term cointegration between GDP, human capital, and innovation. The findings support the necessity of using structural break approaches in order to more accurately depict the dynamics of the series. Numerous recent studies have not given structural fractures enough attention. They address cross-section reliance and potential structural fractures in various cross-sections, in contrast to the conventional first- and second-generation tests. More precisely, cointegration relationships are examined in these data. Our results are in line with those of other research that employed this methodological approach to examine cointegration across cross-sections, as this test does (Chien et al., 2021).
Applying different cointegration models with structural breaks, the prior results show that there is cointegration between the series. This aspect ensures the accuracy of the findings and facilitates the derivation of conclusions regarding possible policy implications. The findings of the AMG and CCEMG models of the sample are reported in Table 10. Given the changes in the variables, our estimators provide a brief expression of variations in technological innovation. They are short-term elasticities. We discover that in AMG models, rising GDP leads to rising innovation in technology, where the coefficient is negligible and not relevant. However, individuals do not notice a substantial impact from increased economic complexity, although the overall panel shows a favorable correlation. Conversely, the results suggest that natural resource rents do not have a significant impact on technological innovation. This indicates that resource-rich economies may not necessarily suffer from innovation stagnation, particularly if resource revenues are effectively reinvested in knowledge-based industries and technological advancements. However, the findings highlight the importance of resource management strategies to ensure that economic growth driven by natural resources translates into long-term innovation benefits, and these results are aligned with Gyamfi et al. (2022) and Fan et al. (2023).
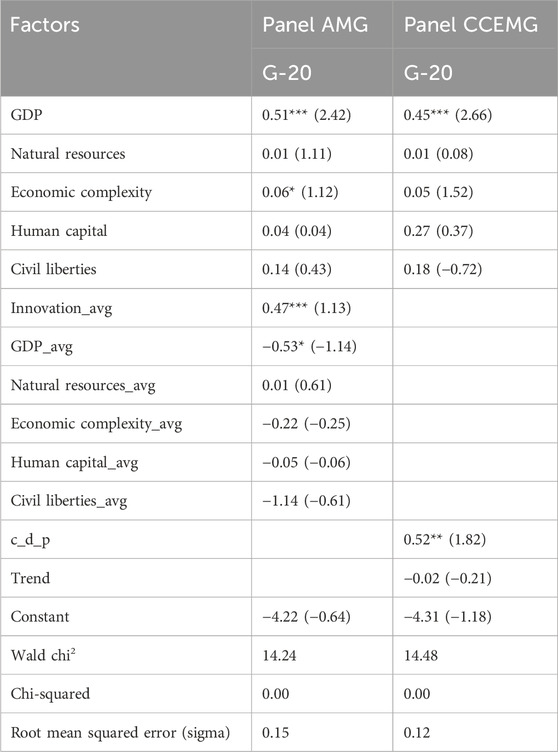
Table 10. AMG and CCEMG short run.
Table 10 presents the regression outcomes using the panel augmented mean group (AMG) and CCEMG estimators for G-20 countries. It evaluates the impact of various factors on the dependent variable, which appears to be linked to sustainable growth or development. The coefficients represent the magnitude and direction of the influence of each independent variable, with t-statistics in parentheses indicating statistical significance. Under the AMG estimation, GDP exhibits a positive and statistically significant effect (coefficient = 0.51, t = 2.42), indicating that higher GDP levels are associated with improvements in the dependent variable. Innovation, represented by the variable Innovation_avg, also shows a positive and significant relationship (coefficient = 0.47, t = 1.13), underscoring its critical role in fostering economic or developmental outcomes.
Other variables, including NR, EC, HC, and CL, show weak or statistically insignificant effects. For instance, natural resources (coefficient = 0.01) and human capital (coefficient = 0.04) indicate minimal influence, while economic complexity has a marginally significant positive effect (coefficient = 0.06, t = 1.12). While positive (coefficient = 0.14), civil liberties fail to reach statistical significance, suggesting limited direct impact under the AMG model. Interestingly, average GDP (GDP_avg) demonstrates a negative association (coefficient = −0.53, t = −1.14), suggesting that long-term or aggregated GDP levels may inversely influence the dependent variable, possibly due to trade-offs or diminishing returns in high-income countries.
In the CCEMG model, GDP shows a positive and significant influence (coefficient = 0.45, t = 2.66), corroborating the AMG findings. The average innovation effect is not reported in this model, but new variables such as common dynamic process (c_d_p) (coefficient = 0.52, t = 1.82) emerge as significant, highlighting possible cross-sectional dependence effects. Conversely, the trend variable exhibits no significant impact (coefficient = −0.02). Natural resources (coefficient = 0.01, t = 0.08), economic complexity (coefficient = 0.05, t = 1.52), human capital (coefficient = 0.27, t = 0.37), and civil liberties (coefficient = −0.18, t = −0.72) remain statistically insignificant, suggesting that these factors may not exert a substantial standalone impact on the dependent variable in the G-20 context.
The applied models reveal that GDP is a robust predictor of positive outcomes, while innovation appears particularly significant in the AMG estimation. However, natural resources, human capital, and civil liberties show limited significance in both models, implying that their effects may be context-dependent or mediated by other variables. The presence of average values (GDP_avg, Economic_complexy_avg) suggests the examination of long-term or aggregated impacts, but their results vary, reflecting potential non-linearities or temporal inconsistencies in the data. Finally, the statistical metrics, including Wald chi-squared tests and root mean squared error, indicate the models’ overall fit and predictive accuracy. The significant chi-squared values (p = 0.00) confirm the models are well-specified, while relatively low root mean squared error values highlight reasonable explanatory power. These findings contribute valuable insights for understanding economic and developmental factors dynamics in G-20 countries.
Human capital and civil liberties are additional non-significant variables. Even the creativity mean significantly and positively reflects back to inventiveness, according to the means of the factors. The CCE-AMG estimator supports our findings, which show that greater GDP per capita boosts INV in the panel dataset of the countries. However, we also did not discover any noteworthy influences of additional factors on innovation. The outcomes of such models generally imply that determinants have little ability to explain short-term variations in technological innovation. This is due to the fact that new breakthroughs in technology take a long time to produce through technological innovation (Chien et al., 2021; Sun, 2022).
These results support H1. Both the AMG and CCEMG models confirm a positive and statistically significant impact of GDP on technological innovation. This reinforces the idea that economic prosperity provides the financial and institutional basis for sustained investment in R&D, consistent with endogenous growth theory. H2 receives mixed support: while economic complexity shows a positive coefficient in both models, its significance is marginal. This suggests that while complexity may matter, its standalone effect may be mediated by other structural factors, such as institutional quality or trade openness. H3 is not supported in a statistically significant way in our models. This finding challenges the traditional view of the resource curse and may suggest that G-20 countries, with better governance and reinvestment strategies, can mitigate the negative impact of resource reliance on innovation. H4 and H5 are not statistically significant in either model, although they show the expected positive signs. These results may reflect the long-term and indirect nature of their effects. For example, improvements in human capital and civil liberties might shape innovation over longer horizons or through interaction with other variables, such as institutional capacity or openness to global markets.
4.1 Robustness test results
In Table 11, the robustness test results using fully modified ordinary least squares (FMOLS) and dynamic ordinary least squares (DOLS) confirm the reliability of the previous findings obtained from the AMG and CCEMG models. The dependent variable in the analysis is technological innovation in G-20 countries, while the independent variables include GDP, natural resource rents, economic complexity, human capital, and civil liberties. The results from both FMOLS and DOLS estimators show consistent relationships between these variables and technological innovation, reinforcing the validity of the initial findings.
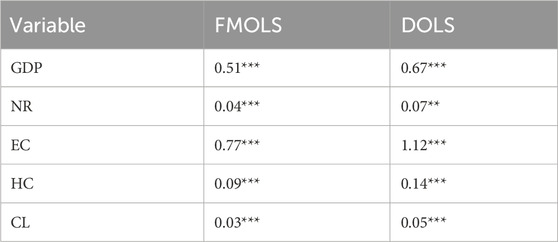
Table 11. FMOLS and DOLS.
The results of Table 11 indicate that GDP positively influences technological innovation, with slightly higher coefficients in the DOLS model. This suggests that economic growth remains a key driver of innovation, and the relationship strengthens when controlling for endogeneity. Natural resource rents also show a positive impact on technological innovation, though the effect is relatively weaker than other factors. This suggests that while resource-rich economies can still foster innovation, their reliance on natural resources alone may not be sufficient to drive technological progress.
Economic complexity emerges as the most significant factor influencing technological innovation, with the highest coefficient in both the FMOLS and DOLS estimations. This finding highlights the importance of knowledge-intensive and diversified economies in fostering innovation and technological advancements. Human capital also plays a crucial role in driving innovation, with both estimators showing a significant positive impact. This reinforces the idea that investments in education and skills development contribute to technological progress. Civil liberties also have a significant but relatively smaller effect on technological innovation. This suggests that while institutional freedoms contribute to an environment conducive to innovation, their impact may not be as strong as economic complexity or human capital. The overall consistency of the results across different estimation techniques confirms the robustness of the study’s findings. The positive and statistically significant coefficients across all variables indicate that economic growth, knowledge-based economies, human capital, and institutional factors collectively shape technological innovation in G-20 nations.
These results are also consistent with the results of Lapatinas et al. (2022) and Shirazi and Hajli (2021), who show that economic complexity and innovation have an association that relies on the nations’ financial standing and that these factors are cointegrated. The estimates for both tests took structural variations in the parameters. Using such analyses, the pattern of causation among each factor in this study is examined while maintaining control for the series’ structural breakdowns.
The findings reveal significant country-specific differences in the relationship between fiscal policy, monetary policy, carbon taxation, and carbon emissions. These variations arise due to differences in economic structures, energy consumption patterns, regulatory frameworks, and technological advancements across countries. For instance, highly industrialized nations with stringent environmental policies may exhibit lower carbon emissions in response to carbon taxation, whereas developing economies reliant on fossil fuels may experience weaker effects due to structural constraints and policy enforcement challenges.
Potential outliers in the analysis include countries with exceptionally high or low carbon emissions due to unique economic or environmental policies. Nations with aggressive renewable energy adoption, such as Germany and Sweden, may show lower emissions despite economic growth, while resource-dependent economies like China and India may continue to experience higher emissions due to their reliance on coal and other fossil fuels. Identifying and analyzing these outliers provide deeper insights into the effectiveness of policy measures and helps refine strategies for achieving carbon neutrality.
The study’s findings align closely with several SDGs. SDG 7 (Affordable and Clean Energy) is addressed through the role of carbon taxation and fiscal policies in promoting renewable energy adoption. SDG 8 (Decent Work and Economic Growth) is supported by sustainable economic policies that drive green job creation while maintaining environmental responsibility. SDG 12 (Responsible Consumption and Production) is reflected in fiscal incentives for energy efficiency and resource conservation, which promote responsible consumption patterns and reduce ecological footprints. Finally, SDG 13 (Climate Action) is emphasized through the study’s focus on financial and economic policies that mitigate climate change and highlight the need for coordinated global efforts to reduce carbon emissions.
5 Conclusion and policy implications
This study employed advanced panel data methods for G-20 nations from 1990 to 2022 to explore the relationship between technological innovation (INV), GDP, NR, and HC. EC and CL were considered to be mediators in the causal connection between these variables. The significance of examining this relationship is further supported by several compelling theories. G-20 nations with a higher reliance on natural resources may face greater urgency to invest in technological innovation due to the constraints imposed by their economic structures. Considering the variables that influence (INV) is vital for academics, industry leaders, and policymakers alike. Insights from this research can help guide strategies to foster innovation, reduce resource dependency, and ensure sustainable economic growth.
This study provides elements for the global discussion on the fundamental processes driving technological progress. We put forward three arguments in favor of the theory that nations that rely most heavily on natural resources are less innovative. We show how there are fewer motivations for the state to fund innovation promotion initiatives if it obtains rent from natural resources, either entirely or in part. Similarly, we suggest that there is no need for industry innovation processes to be prioritized in nations that concentrate on extractive industries. Lastly, we contend that only a tiny portion of the human capital must be extremely knowledgeable in mining activities, with the remainder requiring only a minimal level of specialization. We established a series of panel data models, such as cross-section dependency and slope homogeneity, to test the hypothesis. Similarly, we employ structural break cointegration and unit root tests according to the volatility of natural resource rents. Such contemporary panel data econometrics methodologies enable the production of reliable findings and conclusions that are in line with each nation’s reality.
This study explores the hypothesis that nations with higher average levels of reliance on revenue from natural resources also tend to have higher levels of innovation. The subsequent conclusions are derived from the data and support the results shown. Natural resources rents are erratic and include mining, oil, and gas. The rent associated with natural resources is often unstable and vulnerable to shocks that affect economies. As a result, our results indirectly take into account the structural disruptions that political, economic, and social crises produce.
5.1 Policy recommendations
The impact of policy frameworks and governance on technological innovation is evident in several global examples like the European Union’s Horizon 2020 Program, China’s Innovation-Driven Development Strategy, the United States’ CHIPS and Science Act (2022), South Korea’s Knowledge Economy, and Germany’s Industry 4.0 Initiative. These examples demonstrate that strong policy frameworks, financial incentives, and governance structures significantly shape innovation outcomes. Countries that invest in R&D, education, and strategic industrial policies tend to experience higher levels of technological progress and economic complexity.
The findings of this study suggest that while civil liberties are important from a theoretical perspective, their empirical impact on technological innovation and economic complexity in G-20 countries appears statistically insignificant. Therefore, policy recommendations should focus on variables that exhibit a significant influence on economic growth and innovation.
5.1.1 Leveraging GDP growth for technological advancement
Because GDP has a strong positive impact on technological innovation, governments should allocate a higher proportion of economic output toward R&D, infrastructure, and education to enhance technological progress. Strategic investments in digital infrastructure and industrial innovation can drive long-term sustainable growth.
5.1.2 Enhancing economic complexity for sustainable development
The results indicate that economic complexity plays a crucial role in fostering innovation. Policymakers should implement policies that promote diversification of industries, knowledge-intensive production, and international trade in technologically advanced sectors. This can enhance a country’s global competitiveness and innovation potential.
5.1.3 Optimizing natural resource management for innovation
Although natural resource rents do not necessarily hinder innovation, their efficient utilization is essential for long-term sustainability. Governments should reinvest revenues from natural resources into high-tech industries, education, and innovation-driven sectors to ensure economic resilience beyond resource extraction.
5.1.4 Investing in human capital for knowledge-based growth
Human capital is a key driver of technological progress. Strengthening educational institutions, fostering skill development, and promoting workforce adaptability to new technologies can improve innovation outcomes. Policies should prioritize STEM education, vocational training, and collaboration between academia and industry.
6 International collaboration and policy coordination
Given the interconnected nature of technological progress and global markets, international cooperation in R&D, trade policies, and intellectual property rights can amplify the benefits of innovation-led growth. Collaborative efforts among G-20 nations can facilitate knowledge exchange, joint research projects, and technology transfers.
6.1 Limitations and future research
A potential endogeneity issue exists in the relationship between technological innovation and GDP. Economic growth can drive technological advancements by increasing investment in R&D, while at the same time, innovation itself can stimulate GDP growth by enhancing productivity and industrial competitiveness. This bidirectional relationship may introduce simultaneity bias, which our study does not explicitly control for. While the econometric models employed AMG and CCEMG account for structural breaks, heterogeneity, and cross-sectional dependence, they do not directly address potential endogeneity concerns. Future research could consider employing instrumental variable (IV) techniques or dynamic panel models, such as the generalized method of moments (GMM), to further isolate the causal effect of technological innovation on GDP.
Data availability statement
The raw data supporting the conclusions of this article will be made available by the authors, without undue reservation.
Author contributions
YF: Writing – review and editing. AJ: Conceptualization, Data curation, Formal analysis, and Writing – original draft.
Funding
The author(s) declare that financial support was received for the research and/or publication of this article. This work was sponsored in part by the “Research on the Interaction Mechanisms and Pathways between Local Enterprises and Foreign Enterprises in Guangzhou—Based on the Dimensions of Information Dissemination and Contractual Cooperation Guangzhou Philosophy and Social Science Development 14th Five-Year Plan” Project in 2024 (NO2024GZGJ75).
Conflict of interest
The authors declare that the research was conducted in the absence of any commercial or financial relationships that could be construed as a potential conflict of interest.
Generative AI statement
The author(s) declare that no Generative AI was used in the creation of this manuscript.
Publisher’s note
All claims expressed in this article are solely those of the authors and do not necessarily represent those of their affiliated organizations, or those of the publisher, the editors and the reviewers. Any product that may be evaluated in this article, or claim that may be made by its manufacturer, is not guaranteed or endorsed by the publisher.
References
Abbasi, K. R., Lv, K., Radulescu, M., and Shaikh, P. A. (2021). Economic complexity, tourism, energy prices, and environmental degradation in the top economic complexity countries: fresh panel evidence. Environ. Sci. Pollut. Control Ser. 28, 68717–68731. doi:10.1007/s11356-021-15312-4
Adak, M. (2015). Technological progress, innovation and economic growth; the case of Turkey. Procedia-Social Behav. Sci. 195, 776–782. doi:10.1016/j.sbspro.2015.06.478
Adebayo, T. S., Ghosh, S., Nathaniel, S., and Wada, I. (2023). RETRACTED ARTICLE: technological innovations, renewable energy, globalization, financial development, and carbon emissions: role of inward remittances for top ten remittances receiving countries. Environ. Sci. Pollut. Res. 30, 69330–69348. doi:10.1007/s11356-023-27184-x
Adekoya, O. B., Kenku, O. T., Oliyide, J. A., Al-Faryan, M. A. S., and Ogunjemilua, O. D. (2023). Does economic complexity drive energy efficiency and renewable energy transition? Energy 278, 127712. doi:10.1016/j.energy.2023.127712
Ahakwa, I., Xu, Y., Evelyn Agba, T., Leslie Afotey, O., Atta Sarpong, F., Korankye, B., et al. (2023). Do natural resources and green technological innovation matter in addressing environmental degradation? Evidence from panel models robust to cross-sectional dependence and slope heterogeneity. Resour. Pol. 85, 103943. doi:10.1016/j.resourpol.2023.103943
Ahmad, M., Ahmed, Z., Yang, X., Hussain, N., and Sinha, A. (2021). Financial development and environmental degradation: do human capital and institutional quality make a difference? Gondwana Res. doi:10.1016/j.gr.2021.09.012
Ahmad, M., Ul Haq, Z., Iqbal, J., and Khan, S. (2022). Dating the business cycles: research and development (R&D) expenditures and new knowledge creation in OECD economies over the business cycles. J. Knowl. Econ. 14, 3929–3973. doi:10.1007/s13132-022-01018-6
Ahmad, M., and Zheng, J. (2021). Do innovation in environmental-related technologies cyclically and asymmetrically affect environmental sustainability in BRICS nations? Technol. Soc. 67, 101746. doi:10.1016/j.techsoc.2021.101746
Ahmed, Z., Adebayo, T. S., Udemba, E. N., Murshed, M., and Kirikkaleli, D. (2022). Effects of economic complexity, economic growth, and renewable energy technology budgets on ecological footprint: the role of democratic accountability. Environ. Sci. Pollut. Res. 29, 24925–24940. doi:10.1007/s11356-021-17673-2
Ahmed, Z., Ahmad, M., Rjoub, H., Kalugina, O. A., and Hussain, N. (2021). Economic growth, renewable energy consumption, and ecological footprint: exploring the role of environmental regulations and democracy in sustainable development. Sustain. Dev. 30, 595–605. doi:10.1002/sd.2251
Ajide, K. B. (2022). Is natural resource curse thesis an empirical regularity for economic. Resour. Policy 76, 102755. doi:10.1016/j.resourpol.2022.102755
Albino, V., Ardito, L., Dangelico, R. M., and Messeni Petruzzelli, A. (2014). Understanding the development trends of low-carbon energy technologies: a patent analysis. Appl. Energy 135, 836–854. doi:10.1016/j.apenergy.2014.08.012
Artero, J. M., Borra, C., and Go´mez-Alvarez, R. (2020). Education, inequality and use of digital collaborative platforms: the European case. Econ. Lab. Relat. Rev. 3, 364–382. doi:10.1177/1035304620943109
Asteriou, D., and Agiomirgianakis, G. M. (2001). Human capital and economic growth: time series evidence from Greece. J. Policy Model. 23, 481–489. doi:10.1016/s0161-8938(01)00054-0
Auty, R. M. (2007). Natural resources, capital accumulation and the resource curse. Ecol. Econ. 61, 627–634. doi:10.1016/j.ecolecon.2006.09.006
Aydin, M., and Degirmenci, T. (2024). The impact of clean energy consumption, green innovation, and technological diffusion on environmental sustainability: new evidence from load capacity curve hypothesis for 10 European union countries. Sustain. Dev. 32, 2358–2370. doi:10.1002/sd.2794
Bai, J., Kao, C., and Ng, S. (2009). Panel cointegration with global stochastic trends. J. Econom. 149, 82–99. doi:10.1016/j.jeconom.2008.10.012
Banerjee, S., and Murshed, M. (2020). Do emissions implied in net export validate the pollution haven conjecture? Analysis of G7 and BRICS countries. Int. J. Sust. Econ. 12, 297–319. doi:10.1504/ijse.2020.111539
Becker, G. S. (1964). Human capital: a theoretical and empirical analysis with special reference to education.
Buesa, M., Heijs, J., and Baumert, T. (2010). The determinants of regional innovation in Europe: a combined factorial and regression knowledge production function approach. Res. Pol. 39, 722–735. doi:10.1016/j.respol.2010.02.016
Cheng, C., Ren, X., Wang, Z., and Yan, C. (2019). Heterogeneous impacts of renewable energy and environmental patents on CO2 emission - evidence from the BRIICS. Sci. Total Environ. 668, 1328–1338. doi:10.1016/j.scitotenv.2019.02.063
Chien, F., Ajaz, T., Andlib, Z., Chau, K. Y., Ahmad, P., and Sharif, A. (2021). The role of technology innovation, renewable energy and globalization in reducing environmental degradation in Pakistan: a step towards sustainable environment. Renew. Energy 177, 308–317. doi:10.1016/j.renene.2021.05.101
Degirmenci, T., Aydin, M., Cakmak, B. Y., and Yigit, B. A. (2024). A path to cleaner energy: the nexus of technological regulations, green technological innovation, economic globalization, and human capital. Energy 311, 133316. doi:10.1016/j.energy.2024.133316
Fan, W., Aghabalayev, F., and Ahmad, M. (2023). The role of global collaboration in environmental technology development, natural resources, and marine energy generation technologies toward carbon neutrality in knowledge-based economies. Environ. Sci. Pollut. Control Ser. 30, 75863–75878. doi:10.1007/s11356-023-27728-1
Furman, J. L., Porter, M. E., and Stern, S. (2002). The determinants of national innovative capacity. Res. Pol. 31, 899–933. doi:10.1016/s0048-7333(01)00152-4
Gao, Y., Zang, L., Roth, A., and Wang, P. (2017). Does democracy cause innovation? An empirical test of the popper hypothesis. Res. Pol. 46, 1272–1283. doi:10.1016/j.respol.2017.05.014
Guan, J., Kirikkaleli, D., Bibi, A., and Zhang, W. (2020). Natural resources rents nexus with financial development in the presence of globalization: is the “resource curse” exist or myth? Resour. Pol. 66, 101641. doi:10.1016/j.resourpol.2020.101641
Gyamfi, B. A., Agozie, D. Q., and Bekun, F. V. (2022). Can technological innovation, foreign direct investment and natural resources ease some burden for the BRICS economies within current industrial era? Technol. Soc. 70, 102037. doi:10.1016/j.techsoc.2022.102037
Hartmann, D. (2014). Economic complexity and human development: how economic diversification and social networks affect human agency and welfare. London, United Kingdom: Taylor and Francis.
Hasan, I., and Tucci, C. L. (2010). The innovation–economic growth nexus: global evidence. Res. Policy 39, 1264–1276. doi:10.1016/j.respol.2010.07.005
Haseeb, M., Kot, S., Hussain, H. I., and Kamarudin, F. (2021). The natural resources curse- economic growth hypotheses: quantile–on–quantile evidence from top asian economies. J. Clean. Prod. 279, 123596. doi:10.1016/j.jclepro.2020.123596
Hidalgo, C. A., and Hausmann, R. (2009). The building blocks of economic complexity. Proc. Natl. Acad. Sci. U. S. A. 106, 10570–10575. doi:10.1073/pnas.0900943106
Howitt, P., and Aghion, P. (1998). Capital accumulation and innovation as complementary factors in long-run growth. J. Econ. Growth 3, 111–130. doi:10.1023/A:1009769717601
Im, K. S., Lee, J., and Tieslau, M. (2005). Panel LM unit-root tests with level shifts. Oxf. Bull. 67, 393–419. doi:10.1111/j.1468-0084.2005.00125.x
Im, K. S., Pesaran, M. H., and Shin, Y. (2003). Testing for unit roots in heterogeneous panels. J. Econ. 115, 53–74. doi:10.1016/S0304-4076(03)00092-7
Lapatinas, A., Litina, A., and Poulios, K. (2022). Economic complexity of cities and its role for resilience. PLoS One 17, e0269797. doi:10.1371/journal.pone.0269797
Maddala, G. S., and Wu, S. (1999). A comparative study of unit root tests with panel data and a new simple test. Oxf. Bull. Econ. Statistics 61, 631–652. doi:10.1111/1468-0084.0610s1631
Mehmood, U. (2022). Biomass energy consumption and its impacts on ecological footprints: analyzing the role of globalization and natural resources in the framework of EKC in SAARC countries. Environ. Sci. Pollut. Control Ser. 29, 17513–17519. doi:10.1007/s11356-021-16586-4
Moon, H. R., and Perron, B. (2004). Testing for a unit root in panels with dynamic factors. J. Econom. 122, 81–126. doi:10.1016/j.jeconom.2003.10.020
Morshed, N., and Hossain, M. R. (2022). Causality analysis of the determinants of FDI in Bangladesh: fresh evidence from VAR, VECM and granger causality approach. SN Bus. and Econ. 2, 64–28. doi:10.1007/s43546-022-00247-w
Omidi, V., Shahabadi, A., and Mehregan, N. (2019). The impact of natural resources on innovation. Iran. Econ. Rev. 23, 675–691. doi:10.22059/ier.2019.71793
Pesaran, M. H. (2007). A simple panel unit root test in the presence of cross-section dependence. J. Appl. Econ. 22, 265–312. doi:10.1002/jae.951
Pesaran, M. H., and Yamagata, T. (2008). Testing slope homogeneity in large panels. J. Econom. 142, 50–93. doi:10.1016/j.jeconom.2007.05.010
Phillips, P. C., and Sul, D. (2003). Dynamic panel estimation and homogeneity testing under cross section dependence. Econom. J. 6, 217–259. doi:10.1111/1368-423x.00108
Robinson, J., and Acemoglu, D. (2012). Why nations fail: the origins of power, prosperity, and poverty. New York, NY: Crown Publishers
Rosenberg, D., and Tarasenko, G. (2020). Innovation for despots? How dictators and democratic leaders differ in stifling innovation and misusing natural resources across 114 countries. Energy Res. Soc. Sci. 68, 101543. doi:10.1016/j.erss.2020.101543
Sachs, J. D., and Warner, A. M. (2001). The curse of natural resources. Eur. Econ. Rev. 45, 827–838. doi:10.1016/s0014-2921(01)00125-8
Safi, A., Chen, Y., Wahab, S., Ali, S., Yi, X., and Imran, M. (2021). Financial instability and consumption-based carbon emission in E-7 countries: the role of trade and economic growth. Sustain. Prod. Consum. 27, 383–391. doi:10.1016/j.spc.2020.10.034
Shirazi, F., and Hajli, N. (2021). IT-enabled sustainable innovation and the global digital divides. Sustainability 13, 9711. doi:10.3390/su13179711
Sun, H. (2022). What are the roles of green technology innovation and ICT employment in lowering carbon intensity in China? A city-level analysis of the spatial effects. Resour. Conservation Recycl. 186, 106550. doi:10.1016/j.resconrec.2022.106550
Teles, V. K., and Joiozo, R. (2011). Human capital and innovation: evidence from panel cointegration tests. Appl. Econ. Lett. 18, 1629–1632. doi:10.1080/13504851.2011.556584
The Nexus of Industrial Employment. Financial development, urbanization, and human capital in promoting environmental sustainability in E7 economies. Int. J. Sustain. Dev. and World Ecol. 32. Available online at: https://www.tandfonline.com/doi/full/10.1080/13504509.2024.2426184 (Accessed on March 3, 2025).
Toda, H. Y., and Yamamoto, T. (1995). Statistical inference in vector autoregressions with possibly integrated processes. J. Econ. 66, 225–250. doi:10.1016/0304-4076(94)01616-8
Ulku, H. (2007). R&D, innovation and output: evidence from OECD and nonOECD countries. Appl. Econ. 39, 291–307. doi:10.1080/00036840500439002
Varsakelis, N. C. (2006). Education, political institutions and innovative activity: a cross- country empirical investigation. Res. Pol. 35, 1083–1090. doi:10.1016/j.respol.2006.06.002
Wen, J., Okolo, C. V., Ugwuoke, I. C., and Kolani, K. (2022). Research on influencing factors of renewable energy, energy efficiency, on technological innovation. Does trade, investment and human capital development matter? Energy Pol. 160, 112718. doi:10.1016/j.enpol.2021.112718
Westerlund, J. (2007). Testing for error correction in panel data. Oxf. Bull. Econ. Statistics 69, 709–748. doi:10.1111/j.1468-0084.2007.00477.x
Westerlund, J. (2008). Panel cointegration tests of the Fisher effect. J. Appl. Econom. Available online at https://onlinelibrary.wiley.com/doi/full/10.1002/jae.967
Keywords: technological innovation, economic complexity, GDP, human capital, civil liberties, G-20 countries
Citation: Fan Y and Jackson A (2025) The relationship between technological innovation, human capital and civil liberties in advancing economic complexity and sustainable growth. Front. Environ. Sci. 13:1567322. doi: 10.3389/fenvs.2025.1567322
Received: 27 January 2025; Accepted: 06 May 2025;
Published: 10 July 2025.
Edited by:
Gang Liu, Tianjin University, ChinaReviewed by:
Ridwan Ibrahim, University of Lagos, NigeriaFenghua Wen, Central University of Finance and Economics, China
Tunahan Degirmenci, Sakarya University, Türkiye
Copyright © 2025 Fan and Jackson. This is an open-access article distributed under the terms of the Creative Commons Attribution License (CC BY). The use, distribution or reproduction in other forums is permitted, provided the original author(s) and the copyright owner(s) are credited and that the original publication in this journal is cited, in accordance with accepted academic practice. No use, distribution or reproduction is permitted which does not comply with these terms.
*Correspondence: Ana Jackson, YW5hamFja3NvbjAxMjM0QGdtYWlsLmNvbQ==