 Xuncheng Fan
 Lili Zhao
- School of History and Culture, Mudanjiang Normal University, Mudanjiang, China
Introduction: Efficient land resource utilization is increasingly important for regional development as global attention focuses on sustainable development in border regions. This study develops an innovative ’border location-functional differentiation-efficiency coupling‘ theoretical framework.
Methods: Using this foundation, we employ regression-based path analysis and spatial analytical methods to evaluate the relationship between land use policies and green utilization efficiency across fourteen northeastern China border cities from 2010 to 2020.
Results: Our research reveals significant spatial heterogeneity in land use patterns. Industrial cities show lower land green utilization efficiency (8.14-12.48 tons CO2/10,000 yuan). In contrast, port cities maintain higher utilization efficiency (average 1.54 tons CO2/10,000 yuan). Land use policies oriented toward industrial transformation and ecological protection significantly enhance land green utilization efficiency. Energy intensity (−6452.09, p < 0.05) and industrial structure (−4664.92, p < 0.01) are key inhibiting factors. Different types of cities present differentiated policy responses.
Discussion: Industrial cities promote technological upgrades through digital transformation. Ecological cities emphasize protection-oriented smart development. These findings enrich theoretical research on land use efficiency in border regions. They also provide a scientific basis for formulating differentiated land use policies. This has important practical significance for promoting ecological civilization construction and high-quality development in China’s northern border regions.
1 Introduction
As the global economy expands and world population grows, sustainable land utilization has emerged as a global challenge. Border regions serve as critical connections between countries. In these areas, land use efficiency affects both regional economic transformation and ecological security. Reviewing the developmental trajectory of relevant research, studies on land use efficiency in border regions have formed several distinct research trends, involving different geographical focuses and methodological approaches.
The first research trend focuses on the spatial heterogeneity of land use efficiency across different border regions. Comparative studies have revealed significant regional differentiation patterns: developed border regions tend to emphasize ecological protection, while developing regions face intensified development pressure. For instance, Angelstam et al. (2020) documented relatively low forest loss rates in the Finnish-Russian border (0.42% and 0.09% annually, respectively), reflecting the strong ecological protection orientation in developed regions. In contrast, Wang and Xiao (2023) discovered evident forest reduction and farmland expansion in the Laotian border region, indicating the transformation pressure faced by developing regions. This spatial differentiation is particularly pronounced in resource-based border cities, where Qian and Luo (2024) found land use efficiency to be 20.4% lower than in non-resource-based cities. These studies collectively indicate that the research paradigm is shifting from viewing border regions as homogeneous entities to recognizing their inherent heterogeneity in development paths and efficiency patterns.
The second research trend centers on cross-border comparative analysis, with the China-Russia border receiving considerable academic attention due to its unique geopolitical characteristics and complex development dynamics. This body of research emphasizes significant differences in land management patterns across national boundaries. Chen et al. (2022) found that the Chinese side exhibits intensive agricultural development characteristics, while the Russian side maintains relatively pristine vegetation conditions. These differences reflect not only different choices in development paths but also policy framework differences affecting regional land use efficiency. The cross-border comparative approach has extended to policy effectiveness assessment, such as Qu et al. (2023) ‘s evaluation of black soil protection policies in Heilongjiang Province (projected to reduce carbon stock loss by
The third research direction examines policy implementation and effectiveness in border regions. China’s policy framework for border regions has evolved from general spatial control to a more differentiated approach based on functional positioning. The “National Main Functional Zone Planning” laid the foundation by dividing border regions into different functional zones based on resource environmental carrying capacity and development potential. Subsequent policies such as the “National Forestland Protection and Utilization Planning Outline (2010–2020)” and the “Greater and Lesser Xing’an Mountains Forest Region Ecological Protection and Economic Transformation Planning (2010–2020)” created a multi-layered policy system tailored to regional characteristics. Research on these policies has shifted from single policy evaluation to assessing policy synergy and implementation effectiveness across different regional contexts.
Methodologically, research on land use efficiency in border regions has undergone several stages. Early studies primarily focused on policy description and simple evaluation indicators, while recent methods use complex analytical frameworks. Fekete and Priesmeier (2021) advanced methodological innovation by developing an integrated assessment framework for the US-Mexico border region, emphasizing coordination between cross-border resource management and environmental risk prevention. Efficiency measurement methods have undergone similar evolution, with Chang et al. (2023) applying industrial structure optimization modeling techniques to assess land use efficiency improvement mechanisms. Spatial analysis methods have become increasingly refined, as exemplified by Bazarov et al. (2021) quantitatively comparing human modification degrees on the Chinese (50%) and Russian (28%) sides of the Xingkai Lake basin. The latest methodological Frontier involves digital methods, with Wang et al. (2024) pioneering the use of deep learning techniques to identify inefficient spaces in resource-depleted cities, and Dong et al. (2021) developing integrated models to analyze connections between ecological degradation and urban expansion.
Despite these advances, three key research gaps remain. First, systematic theoretical frameworks for policy-efficiency correlations are lacking. Previous studies have focused mainly on single-dimensional policy implementation or efficiency evaluation. They offer limited exploration of interactions from a comprehensive systems perspective. Second, theoretical explanations for city type differences are insufficient. Although Zheng et al. (2022) proposed spatial conflict measurement methods, these methods have not adequately revealed the heterogeneous mechanisms of policy responses across different types of cities. Finally, theoretical understanding of the uniqueness of land use in cold-region border areas needs deepening. While Yuan et al. (2019) identified core-periphery differentiation in land use efficiency of mining cities, their analysis did not deeply examine the comprehensive impacts of climatic conditions, geopolitics, and development strategies on land use patterns in border regions.
Based on these gaps, this study attempts to fill these theoretical voids by constructing a “policy-efficiency-space” theoretical analysis framework. This framework not only proposes a dual analytical perspective of “type differentiation-spatial heterogeneity” for border region land policy implementation but also constructs a policy response theory based on urban functional positioning while developing a spatial coupling theory for cold-region border land use. Selecting China’s northeastern border region as a case study holds unique value: the region’s 14 border cities exhibit significant differences in functional positioning and development stages, have implemented diverse land policies, and possess a typical “three vertical and one horizontal” spatial pattern, providing an ideal sample for validating the theoretical framework.
This study focuses on three core questions: (1) the formation mechanism of spatial heterogeneity in border region land use efficiency; (2) the response mechanisms of different types of cities to land use policies; and (3) the spatial coupling mechanism between policy implementation and efficiency improvement. This study not only enriches theoretical research on land use efficiency in border regions and provides a new analytical framework for understanding policy implementation effects but also offers scientific basis for formulating differentiated land use policies, which has important practical significance for promoting ecological civilization construction and high-quality development in China’s northern border regions.
2 Materials and methods
2.1 Study area overview
The study area encompasses the northeastern border region of China. It includes eight regions in Heilongjiang Province (Mudanjiang, Jixi, Shuangyashan, Jiamusi, Hegang, Yichun, Heihe, and Daxing’anling), three regions in Jilin Province (Yanbian, Baishan, and Tonghua), two regions in Inner Mongolia Autonomous Region (Hulunbuir and Xing’an League), and Dandong City in Liaoning Province. The region borders Russia’s Far East in the east, faces North Korea’s North Hamgyong Province and Chagang Province across the river in the southeast, and neighbors Russia and Mongolia in the north, with a total border length of 2,682 km, forming an important border economic belt and ecological barrier zone in China’s northeastern region (Sui et al., 2024) (Table 1; Figure 1).
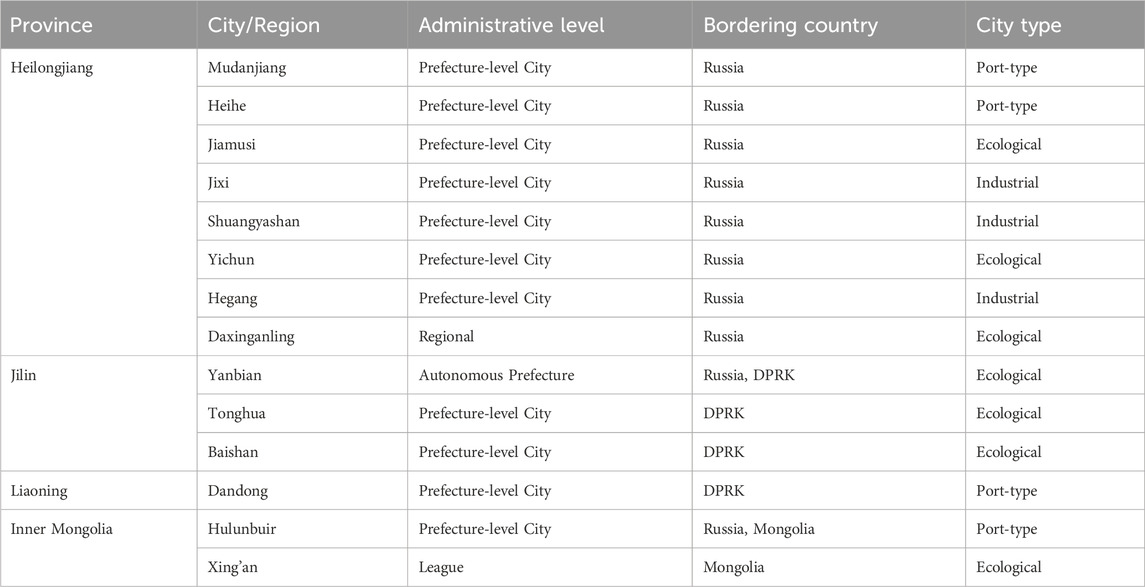
Table 1. Basic characteristics of study area.
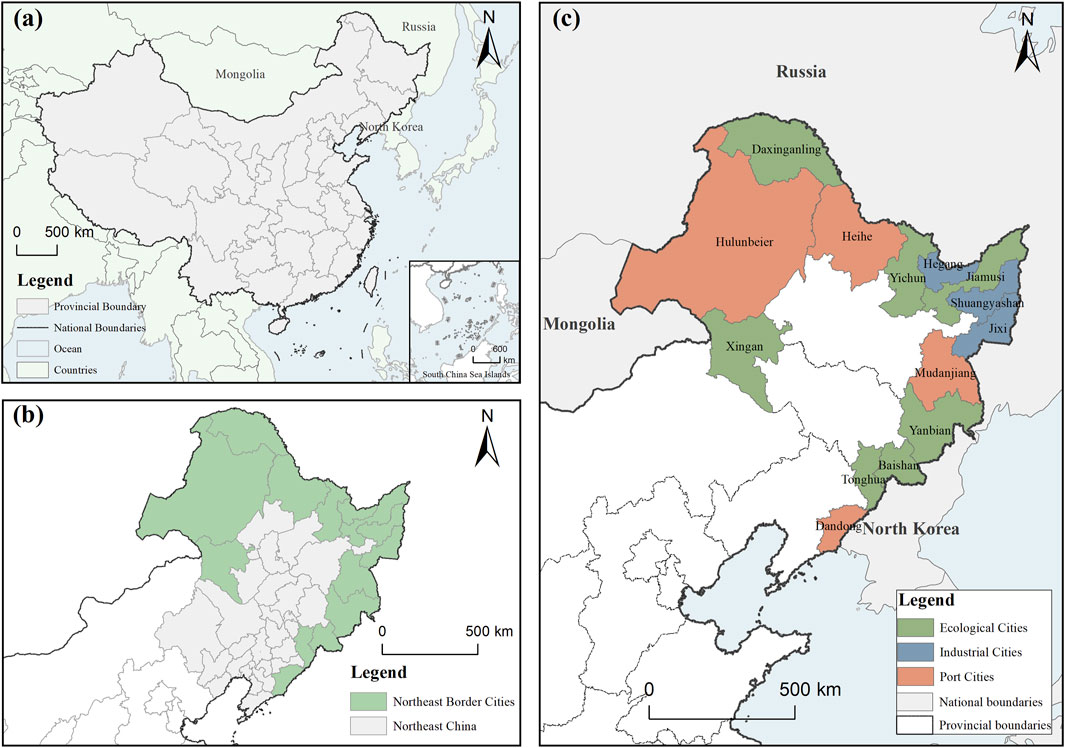
Figure 1. Study area in northeastern border regions of China: (a) Location in China; (b) Northeast China; (c) Distribution of different types of border cities and major geographical features.
The study area’s terrain follows a “three vertical and one horizontal” spatial pattern. The eastern part is dominated by the Changbai Mountain system. This area includes ecological conservation regions such as Yanbian, Baishan, and Tonghua. Forest coverage rates reach 91.34% in Baishan and 84.54% in Yanbian. The central part consists of the Songnen Plain and Sanjiang Plain, represented by areas such as Jiamusi and Shuangyashan, which the “National Land Use Master Plan (2006–2020)” designated as important commercial grain production bases, with Jiamusi’s cultivated land accounting for 77.90%. The western part is dominated by the Greater Xing’an Mountains system, designated as an important ecological functional zone according to the “Greater and Lesser Xing’an Mountains Forest Area Ecological Protection and Economic Transformation Planning (2010–2020)”, forming a grassland and forest interlaced ecosystem represented by Hulunbuir, with forest coverage of 59.43% and grassland coverage of 29.56%. The northern Lesser Xing’an Mountains (“one horizontal”) forms an important regional ecological barrier, typically represented by Yichun with a forest coverage rate of 87.80%. The study area has a temperate continental monsoon climate but shows significant regional differences due to topographical influences, with average annual temperatures ranging from −4°C to 5°C and annual precipitation decreasing from east to west (1,000–300 mm).
Based on development positioning and policy orientation, the study area can be divided into three functional zones. The industrial development policy-led zone includes Jixi, Shuangyashan, and Hegang, dominated by energy and raw materials industries, with the secondary industry accounting for 24%–32% of GDP in 2023. The port economy policy-guided zone includes Heihe, Mudanjiang, Dandong, and Hulunbuir, possessing 7 national-level ports and 1 temporary opening port, mainly focusing on foreign trade and service industries, with the tertiary industry exceeding 45%. The ecological protection policy-led zone includes Daxing’anling, Yichun, Yanbian, Tonghua, Baishan, Jiamusi, and Xing’an League, primarily focused on ecological resource protection, with forest coverage generally exceeding 80%.
The study area is rich in natural resources with distinct regional characteristics. In terms of water resources, Heihe City alone has an average annual surface runoff of 7.31 billion cubic meters. Mineral resources are diverse, with Dandong City possessing 50 types of minerals including gold, silver, lead, and zinc, while Jixi City’s coal and graphite reserves rank among the highest in the province. Biological resources are abundant, with over 3,890 species of wild plants in the region, including 11 nationally protected species. Regional economic development showed notable differences in 2023, with per capita GDP ranging from 73,192 yuan in Hulunbuir City to 38,000 yuan in resource-based cities, forming a development pattern combining traditional industry, modern service industry, and ecological industry.
As an important window for China’s Northeast Asian opening-up, the study area plays a crucial role in promoting regional economic cooperation and cross-border ecological protection. These border regions face dual pressures of economic transformation and ecological protection, making the relationship between land use changes and carbon emissions particularly valuable for research.
2.2 Data sources and processing
2.2.1 Study period selection rationale
First, this period marks an important turning point in China’s land space control, with the implementation of significant policy documents such as the “National Main Functional Zone Planning,” “National Land Use Master Plan (2006–2020),” and “Greater and Lesser Xing’an Mountains Forest Area Ecological Protection and Economic Transformation Planning (2010–2020),” which profoundly influenced land use patterns in the study area. Second, 2010–2020 was a critical period of transformation for the northeastern border region. Under the promotion of the Northeast Revitalization Strategy and the “Belt and Road” Initiative, regional land use patterns underwent significant changes. This period fully covers the implementation phase of the new round of Northeast revitalization strategy, providing an appropriate time window for policy effect evaluation. Third, statistical data for this period is relatively complete and standardized. After 2010, China’s carbon emission statistical system gradually improved, with significant enhancement in the availability and reliability of city-level carbon emission data. Meanwhile, advances in land use change monitoring technology also provided more accurate spatial data support. Selecting this study period not only helps systematically evaluate policy implementation effects but also provides scientific basis for future policy optimization.
2.2.2 Land use data
This study employed the China Land Cover Dataset (CLCD) developed by Wuhan University as its primary data source (Yang and Huang, 2021). The dataset spans from 1985 to 2019, with a spatial resolution of 30 m, and was constructed based on the Google Earth Engine platform. The dataset utilized 335,709 Landsat satellite images, employing a random forest classifier combined with spatiotemporal features for classification, and implemented spatiotemporal filtering and logical reasoning for post-processing to enhance data consistency. Validation based on 5,463 visually interpreted samples showed that the overall classification accuracy reached 80%. These characteristics make the CLCD dataset an ideal source for studying regional land use changes.
To accommodate research needs, this study selected data from three time points: 2010, 2015, and 2020. The original CLCD classification system contains nine land cover types: cropland, forest, shrub, grassland, water, snow and ice, barren, impervious surface, and wetland. Based on research objectives and regional characteristics, we reclassified the original nine classes into six categories: (1) cropland, including the original cropland class; (2) forestland, including the original forest and shrub classes, as these two types have similar ecological functions in the northeastern border region; (3) grassland, maintaining consistency with the original classification; (4) water bodies, corresponding to the original water class; (5) built-up land, corresponding to the original impervious surface class; (6) unused land, integrating the original barren, snow/ice, and wetland classes, which all represent land types with relatively limited human activity impact in the study area.
In our analysis, forestland and grassland were collectively termed as ecological land, a classification based on their shared ecosystem service functions, particularly in carbon sequestration, biodiversity conservation, and ecological security barrier construction. In policy implementation assessment, this integration helps provide a more comprehensive understanding of the overall effects of ecological protection policies. The data preprocessing included: using the Krasovsky 1940 Albers projection system for projection conversion, with central meridian set at 105°E and standard parallels at 25°N and 47°N—a configuration particularly suitable for area calculation in northeastern regions; clipping data according to administrative boundaries; and conducting spatial statistical analysis based on the ArcGIS platform.
To ensure the reliability of the reclassification results, this study employed a multi-level accuracy verification method: first, using confusion matrix methodology to assess classification accuracy, calculating overall accuracy, producer’s accuracy, and user’s accuracy; second, cross-validating with existing land use maps and land use change survey data; finally, selecting representative sample points within the study area for field verification, combined with visual interpretation validation using high-resolution remote sensing images (such as Google Earth historical imagery). Verification results showed that the overall accuracy of the six reclassified land use types exceeded 85%, meeting research requirements. These data provide important support for evaluating the effects of land use policy implementation and land use efficiency.
2.2.3 Carbon emission data
This study constructs a multi-level land use efficiency assessment system based on Scope 1, 2, and 3, covering carbon emission data from 14 border regions during 2010–2020. The assessment framework follows the methodological systems of the “Provincial Greenhouse Gas Inventory Compilation Guidelines” and “IPCC Guidelines for National Greenhouse Gas Inventories,” with carbon emissions measured in 10,000 tons of
Based on the above scope classification, this study designed a multi-level carbon emission accounting framework with the following specific calculation formulas:
Where
Direct emissions (Scope 1) calculation formula:
Where
Energy indirect emissions (Scope 2) calculation formula:
Where
Other indirect emissions (Scope 3) calculations mainly consider upstream and downstream emissions in the industrial chain, using the input-output analysis method:
Where
In the carbon emission accounting process, this study adopted a hierarchical, multi-source emission factor selection strategy to ensure the accuracy and reliability of the calculation results. The selection of emission factors for Scope one direct emissions is primarily based on fuel type and emission activity characteristics. For fossil fuel combustion, recommended emission factors for the Northeast region from the “Provincial Greenhouse Gas Inventory Compilation Guidelines (Trial)” are adopted, with appropriate adjustments based on the actual carbon content and oxidation rate of fuels in the study area. Emissions from industrial production processes use industry-specific emission factors published in the “Enterprise Greenhouse Gas Emission Accounting Methods and Reporting Guidelines” to ensure consistency with national standards. Emission factors for agriculture, forestry, and land-use change reference the technical specifications of the National Forestry and Grassland Administration, with localized adjustments based on the climatic conditions and soil characteristics of the study area. Waste treatment emission factors are based on IPCC guideline recommended values, considering local waste composition characteristics and treatment process differences.
For Scope two indirect emissions, purchased electricity emissions use regional grid emission factors from the Northeast Power Grid, with temporal differentiation coefficients based on power structure changes during the study period. Heating and cooling emission factors consider the characteristics of the heating energy structure in the study area and the efficiency of centralized heating systems, using the carbon emission coefficient for “Steam and Hot Water Production and Supply Industry” with transmission loss corrections. The selection of emission factors follows the priority sequence: localized emission factors provided by the “Provincial Greenhouse Gas Inventory Guidelines (Trial)” are prioritized; followed by industry-specific emission factors issued by the National Development and Reform Commission; for areas lacking localized data, default values from the IPCC emission factor database are referenced.
Data sources integrate multiple statistical systems. Energy activity data comes from the “China Energy Statistical Yearbook” and local energy balance sheets; industrial process data is sourced from the “China Industry Statistical Yearbook” and local industrial statistical reports; agriculture and forestry data is collected from the “China Agricultural Statistical Yearbook,” “China Animal Husbandry Yearbook,” and “China Forestry and Grassland Statistical Yearbook”; waste treatment data is from the “China Environmental Statistical Yearbook” and local environmental statistical reports; energy purchase data comes from the “China City Statistical Yearbook” and local statistical yearbooks.
Regarding accounting uncertainties, this study identified three main sources. Activity data uncertainty primarily stems from multi-departmental submission and aggregation processes of energy statistics, quality of industrial product output data reported by enterprises, and survey methods and sample representativeness of agricultural and forestry activity data. In terms of emission factor uncertainty, fossil fuel combustion emission factors have relatively low uncertainty, while agricultural, forestry, and land-use change emission factors possess higher uncertainty due to ecosystem complexity. Methodological uncertainty mainly originates from accounting boundary definition, applicability assumptions, and data aggregation.
To manage and reduce uncertainty, this study established a comprehensive data quality control system, including a three-level verification mechanism: first, cross-validation of statistical data from different sources to ensure data consistency; second, time series consistency testing to analyze the reasonableness of annual data changes; third, cross-regional comparative verification to evaluate spatial comparability of data. Through these measures, the reliability and accuracy of carbon emission accounting results were ensured.
2.2.4 Socioeconomic data
This study constructs a multi-dimensional socioeconomic indicator system covering four dimensions: economic development, population structure, technological innovation, and infrastructure. Economic development indicators include Gross Domestic Product (GDP) and its three-industry composition, fixed asset investment, and total foreign trade. Population structure indicators include permanent population, population density, and urbanization rate. Technological innovation indicators include the proportion of science and technology expenditure in fiscal expenditure and patent grants. Infrastructure indicators include energy consumption intensity (energy consumption per unit GDP) and road network density.
Data sources primarily include official data from national and local statistical systems. National-level data comes from the “China City Statistical Yearbook” and “China Energy Statistical Yearbook.” Provincial data comes from the “Heilongjiang Statistical Yearbook,” “Jilin Statistical Yearbook,” “Liaoning Statistical Yearbook,” and “Inner Mongolia Statistical Yearbook.” City-level data comes from local statistical yearbooks and statistical bulletins. To ensure temporal comparability of data, this study calculates GDP and related economic indicators at constant 2010 prices to eliminate the impact of price changes. Urbanization rate is calculated based on permanent population to reflect actual urbanization levels. Foreign trade data includes total imports and exports.
To eliminate dimensional differences among different indicators, this study uses the range standardization method to process all indicators dimensionlessly, as shown in Equation 5. The formula is:
where
Data quality control adopts a three-step verification process: First, using the box plot method to identify outliers, re-examining data that exceeds 1.5 times the interquartile range; Second, conducting time series consistency checks to analyze whether indicator trends are reasonable; Finally, comparing indicators horizontally among similar cities to verify spatial comparability of data. For data with discrepancies, corrections are made through consulting original statistical materials and statistical departments to ensure data accuracy and reliability.
2.2.5 Variable description and research design characteristics
Table 2 provides descriptive statistics for the main variables in this study, including land use structure variables, carbon emission variables, and socioeconomic variables at two time points, 2010 and 2020, with sample size, minimum values, maximum values, and standard deviations. From the perspective of land use structure, forest land accounts for the highest proportion in the study area (maximum 97.52% in 2010, maximum 96.87% in 2020), followed by cultivated land (maximum 77.03% in 2010, maximum 77.90% in 2020), while the proportion of construction land is relatively low (maximum 4.22% in 2010, maximum 4.76% in 2020) but shows a stable increasing trend. Carbon emission data indicate that during the 2010–2020 period, the maximum value of total carbon emissions increased from 35.772 million tons to 46.640 million tons, and the minimum value also rose from 8.028 million tons to 9.424 million tons, with significant differences between cities (standard deviation of 878.32 in 2010, increasing to 1,284.42 in 2020). Regarding socioeconomic variables, the proportion of secondary industry decreased significantly (maximum 60.09% in 2010, maximum only 33.25% in 2020), while the proportion of tertiary industry increased notably (maximum 50.09% in 2010, maximum reaching 61.69% in 2020), reflecting the industrial structure transformation trend in the study area. All statistical data are based on a sample of 14 northeastern border cities.
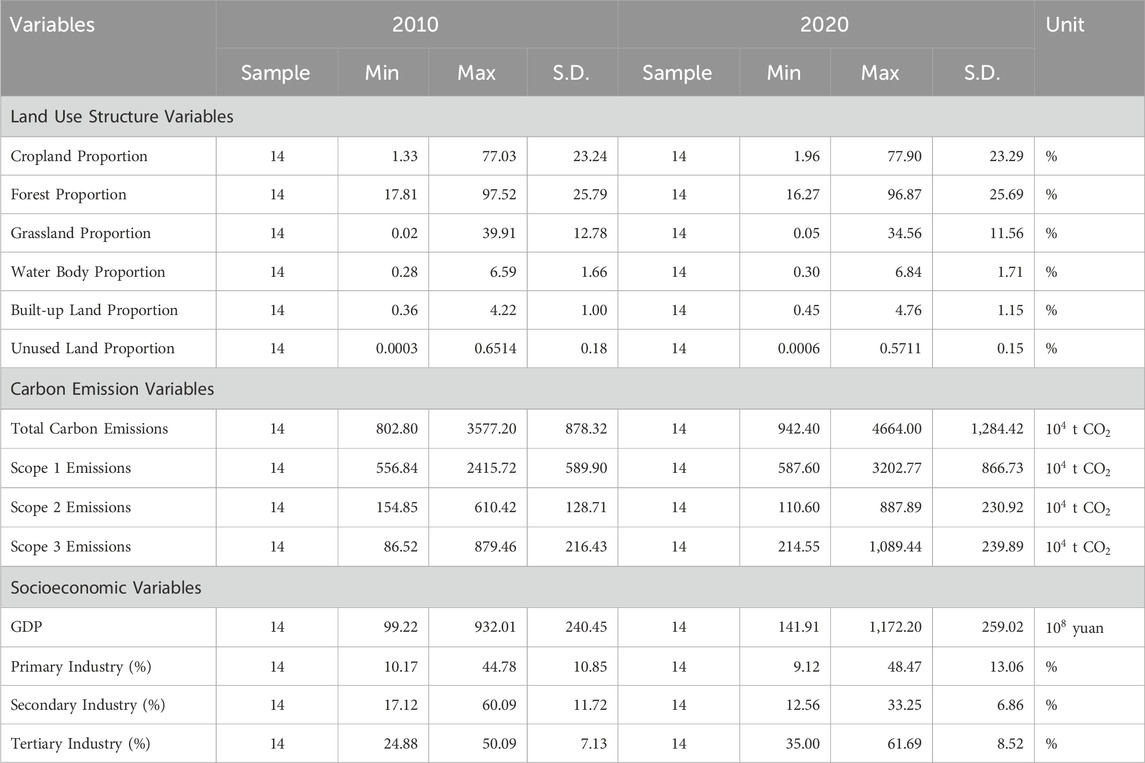
Table 2. Statistical analysis of land use, carbon emissions, and socioeconomic variables (2010 and 2020).
To ensure data quality, this study conducted systematic preprocessing of carbon emission data. Carbon emission data preprocessing included three key steps. First, activity data standardization converted activity data (such as energy consumption, industrial output) from different sources through unit conversion and standardization processing to ensure data consistency, for example, energy consumption data were uniformly converted to standard coal equivalent. Second, emission factor selection followed a three-tier system: priority was given to localized emission factors (such as region-specific research results), followed by industry-specific emission factors published by the National Development and Reform Commission, and finally IPCC default values (when the first two types of factors were unavailable). Third, for missing value processing, linear interpolation was used to supplement missing data in time series to ensure data continuity; for inter-regional data gaps, average values from similar regions were used as substitutes and noted in the uncertainty analysis.
Besides carbon emission data, the processing of land use data also required precise technical parameter settings. In terms of projection system settings, the Krasovsky 1940 Albers projection system was configured with central meridian 105°E and standard parallels 25°N and 47°N, a configuration particularly suitable for area calculations in the northeastern region. During the land classification process, functional differences of various land types in the carbon cycle were emphasized, especially classifying forestland and grassland as ecological land categories to facilitate subsequent analysis of their carbon sink functions. Additionally, all spatial analysis operations were completed using ArcGIS 10.8, ensuring consistency and reproducibility of spatial calculations.
Based on the functional positioning and policy orientation characteristics of cities in the study area, this research adopted a classification analysis method. Based on development positioning and policy orientation, the 14 border cities were divided into three categories. Industrial development policy-guided areas include Jixi, Shuangyashan, and Hegang, with main characteristics of energy and raw material industries as the dominant sectors, secondary industry accounting for 24%–32% of GDP, land use dominated by agricultural land, continuous expansion of urban construction land, and relatively high carbon emission intensity (8.14–12.48 tons/10,000 yuan). Port economic policy-guided areas include Heihe, Mudanjiang, Dandong, and Hulunbuir, characterized by national-level ports, foreign trade and service industries as the main sectors, tertiary industry proportion exceeding 45%, diversified land use structure, coordinated development of ecological land and construction land, and moderate carbon emission intensity (average 1.54 tons/10,000 yuan). Ecological protection policy-guided areas include Daxing’anling, Yichun, Yanbian, Tonghua, Baishan, Jiamusi, and Xing’an League, primarily characterized by ecological resource protection, forest coverage generally exceeding 80%, land use dominated by forests supplemented by agricultural land, and relatively low carbon emission intensity (1.31 tons/10,000 yuan). This classification is based on comprehensive assessment of policy document analysis, land use structure characteristics, and economic development indicators, ensuring scientific validity and policy relevance.
To further explore land use efficiency differences among different types of cities, this study employed the Tukey HSD post hoc test method based on one-way analysis of variance. Statistical analysis results show that although the observed carbon emission intensity of industrial cities (1.72 tons/10,000 yuan) was higher than that of port cities (1.54 tons/10,000 yuan) and ecological cities (1.31 tons/10,000 yuan), these differences did not reach statistical significance (F (2,11) = 0.655, p = 0.538). The 95% confidence intervals for carbon emission intensity of each city type were: industrial cities [7.50, 12.55] tons/10,000 yuan, port cities [1.97, 7.22] tons/10,000 yuan, and ecological cities [2.17, 16.80] tons/10,000 yuan. The overlap of these confidence intervals further supports the conclusion that differences are not significant. Effect size analysis
This study selected 14 border cities in the northeastern region as the research sample, mainly based on the following considerations: (1) these cities constitute a complete economic belt and ecological barrier belt along China’s northeastern border, with spatial continuity and integrity; (2) these cities show obvious differences in functional positioning, including industrial development-oriented, port economy-oriented, and ecological protection-oriented types, providing ideal samples for studying policy response differences across different types of cities; (3) these cities have experienced similar policy implementation backgrounds, simultaneously influenced by the “Northeast Revitalization Strategy” and the “Belt and Road Initiative”, facilitating horizontal comparison of policy effects; (4) these cities have high data completeness and accessibility, especially relatively comprehensive land use change and carbon emission data during the 2010–2020 period, capable of supporting the empirical analysis of this study. This sample selection ensures both representativeness of the research and feasibility of the analysis.
2.3 Theoretical framework
2.3.1 “Border location-functional differentiation-efficiency coupling” theoretical framework
This study constructs an innovative theoretical analysis framework of “border location-functional differentiation-efficiency coupling” to systematically explain the formation mechanism of land use efficiency in border regions. Unlike traditional studies that view border regions as homogeneous entities, this framework emphasizes the heterogeneity and functional differences of border cities, revealing the formation path of spatial differences in land use efficiency.
Border location factors hold a central position in this framework. As important regions connecting different countries, border regions’ land use efficiency not only relates to regional economic transformation but also affects ecological security. Fekete and Priesmeier (2021), in their study of the US-Mexico border, found that coordination between cross-border resource management and environmental risk prevention is crucial for improving land use efficiency; while Bazarov et al. (2021), comparing the Xingkai Lake basin, discovered that the degree of human modification on the Chinese side (50%) is significantly higher than on the Russian side (28%), reflecting the impact of different development paths under border location on land use patterns.
The functional differentiation dimension explains the interaction mechanism between the development positioning of border cities and policy implementation effects. Cities with different functional positioning exhibit differentiated responses to land use policies: industrial cities (such as Jixi, Shuangyashan, and Hegang) show relatively lagged land use policy implementation effects under traditional industrial inertia; port cities (such as Heihe, Mudanjiang, Dandong, and Hulunbuir) utilize their openness advantages to form efficient land use patterns; ecological cities (such as Daxing’anling, Yichun, etc.) form a “protection priority-efficiency synergy” development model through strict ecological protection policies. This functional differentiation not only explains regional differences in policy implementation effects but also provides a theoretical basis for differentiated policy formulation in border regions.
The efficiency coupling dimension introduces spatial connection and interaction mechanisms. Unlike traditional regional economic theory, this framework emphasizes that border regions have formed a networked development pattern with port cities as nodes and industrial chains as links. In the policy transmission process, low-efficiency regions become key areas for policy implementation through industrial connections, high-efficiency regions drive overall regional efficiency improvement through demonstration effects, and different types of cities form functionally complementary mechanisms in policy responses, constituting a spatial coupling path of “demonstration effect-diffusion mechanism-collaborative improvement.” This dimension transcends traditional single-center development theory and better fits the networked development reality of border regions.
2.3.2 Theoretical mechanism of policy-efficiency relationship
How land use policies influence green utilization efficiency is one of the core questions of this study. Through review of existing literature and theoretical analysis, we have identified several key pathways and mechanisms. Land use structure optimization is the primary mechanism through which policy affects efficiency. During policy implementation, optimization of the ratio between ecological land and construction land can directly change regional carbon emission patterns. This relationship has a profound theoretical foundation—spatial economics has long focused on the impact of different land types on regional sustainable development. Empirical research also supports this view; Chang et al. (2023) demonstrated that industrial structure optimization significantly enhances land use efficiency, while Song et al. (2022) revealed the profound influence of resource endowment differences and development cycles on efficiency in border regions, especially during economic transition periods.
Spatial layout optimization constitutes another important mechanism. By adjusting urban form and industrial spatial distribution, land policies can significantly influence energy consumption patterns and carbon emission levels. Li H. et al. (2024) found in their Beijing-Tianjin-Hebei study that optimizing spatial planning can achieve carbon emission reductions of
Synergistic effects between policies represent a more complex influence mechanism. Land policies at different levels and in different domains do not operate in isolation but form interactive networks. A typical example is the coordination between the “National Main Functional Zone Planning” and the “Forest Land Protection and Utilization Planning Outline (2010–2020)”—the former provides institutional guarantees for the latter through macro spatial control, while the latter improves land efficiency through specific ecological restoration measures. This policy integration produces evident multiplier effects, far exceeding the expected outcomes of single policy implementation.
The driving role of technological innovation cannot be ignored. Technology upgrades guided by land policies can indirectly but significantly improve land use efficiency. In industrial city transformation practices, digital transformation and energy structure optimization have become significant efficiency improvement pathways. Qian and Luo (2024) research confirmed that digital technology application can effectively enhance land efficiency in resource-based cities, which is particularly crucial for the transformation of border industrial cities. This technological pathway also reflects that the long-term effects of land use policies are often realized through innovation diffusion mechanisms. Understanding these mechanisms is valuable for evaluating policy effects and optimizing future policy design, and also provides a theoretical foundation for the empirical analysis in this study.
2.3.3 Theoretical explanation of spatial heterogeneity
This study breaks through the spatial homogeneity assumption in traditional regional research and constructs a heterogeneity analysis framework of “three types of cities-multiple spaces.” The spatial differences in land use efficiency in border regions have complex formation mechanisms requiring multi-dimensional understanding. Traditional industrial inertia is a key factor explaining spatial heterogeneity. Border industrial cities, deeply influenced by historical development path dependency, often form high-carbon emission, low-efficiency land use patterns. The core-periphery differentiation phenomenon in mining cities’ land use efficiency discovered in Yuan et al. (2019) research provides important evidence, but they did not deeply explore the comprehensive effects of climatic conditions, geopolitics, and development strategies. Our theoretical framework views industrial inertia as a fundamental explanatory variable for spatial heterogeneity, emphasizing the persistent influence of historical accumulation on current land use patterns.
Differences in location conditions also shape the spatial pattern of land use. Significant differences exist in geographic location, port distance, and transportation convenience among border region cities, directly leading to diversification of land use methods. Practice shows that port cities can often utilize location advantages to form efficient and intensive land use patterns, while geographically peripheral areas tend toward extensive use. This phenomenon is highly consistent with Turner and Pham (2015) research results on the northern border of Vietnam—port cities significantly improved land use efficiency through regional development platforms.
The unbalanced distribution of ecological resource endowments constitutes the third important dimension. The study area has formed a special spatial pattern of “three vertical and one horizontal”: the eastern Changbai Mountain system and the western Greater Khingan Range system constitute key ecological barriers, providing a good ecological foundation for the local area; while the central Songnen Plain mainly undertakes agricultural production functions. These resource endowment differences directly affect policy implementation effects and efficiency performance. Mendoza-Ponce et al. (2021) research on the Guatemala-Mexico border verified the importance of ecological resource management policies, especially the significant role of zero deforestation policies in improving carbon stocks.
The differentiated positioning of regional development strategies is also an indispensable factor. Based on the “National Main Functional Zone Planning,” border regions have formed a functionally diverse spatial layout: the Greater Khingan Range and Changbai Mountain regions are positioned as key ecological function zones, while some port cities are included in key development regions. This differentiated planning guides various types of cities onto different development paths, leading to spatial heterogeneity in land use efficiency. Although Zheng et al. (2022) proposed spatial conflict measurement methods, they did not fully explain the heterogeneous mechanisms of policy responses across different types of cities. By analyzing functional positioning differences, this study provides a more comprehensive theoretical perspective for explaining the spatial heterogeneity of policy responses. This multi-dimensional theoretical framework not only helps understand the complex pattern of land use efficiency in border regions but also provides a scientific basis for differentiated policy formulation.
2.4 Research methodology system
This study constructs a comprehensive “policy-efficiency-space” multi-level analysis framework, integrating quantitative and spatial analysis methods to systematically evaluate the relationship between land use policies and green utilization efficiency in border regions. This framework, based on three theoretical dimensions (border location, functional differentiation, efficiency coupling) and four mechanisms (land use structure optimization, spatial layout optimization, policy synergy, technology driving), adopts the research approach of “mechanism analysis-spatial verification-effect evaluation” to form an analytically consistent system with inherent logic.
Method selection follows these principles: First, the systemic principle suitable for complex system analysis. The land use system in border regions involves multi-dimensional interactions, requiring methods capable of processing multi-variable relationships simultaneously. Second, the geographical principle that accounts for spatial heterogeneity. Border regions show significant spatial differences, requiring analytical methods that capture spatial patterns and regional differences. Third, the mechanistic principle focusing on policy implementation pathways. Policy influences are transmitted through multiple channels, requiring analysis of each factor’s contribution and operating mechanism. Fourth, the integrative principle balancing quantitative analysis and qualitative explanation. This combines statistical significance testing with interpretation of practical policy significance, avoiding over-reliance on single indicators.
Based on these principles, this study forms three mutually supporting methodological modules: The policy implementation effect analysis module uses regional difference indices and transition matrix methods to evaluate land use structure changes, and analyzes spatial patterns through global Moran’s I; the efficiency evaluation module adopts a carbon emission-based multi-level evaluation system, combining annual change rates, variation coefficients, and variance analysis methods to identify temporal-spatial characteristics; the policy effect evaluation module integrates Pearson correlation analysis, BiLISA spatial association analysis, and regression-based path analysis to reveal policy driving mechanisms, supplemented by LMDI decomposition to quantify the contribution of various factors.
The innovation of this methodological system lies in: First, it overcomes limitations of traditional single methods by combining the mechanism analysis capability of regression path analysis with the location sensitivity of spatial analysis methods; second, it achieves comprehensive land use efficiency assessment through a multi-level carbon emission accounting framework; third, it integrates quantitative statistics and spatial analysis techniques, answering not only “what” and “what differences” but also exploring “why” and “how to improve”; finally, it adopts dual perspectives of type differentiation and spatial heterogeneity, providing scientific support for differentiated policy formulation in border regions. We will detail the theoretical basis, specific operational steps, and application contexts of these methods, demonstrating how to systematically evaluate the relationship between land use policies and green utilization efficiency in border regions through multi-method integration.
2.4.1 Theoretical basis of spatial econometric methods
Spatial heterogeneity is a core characteristic in research on land use efficiency in border regions. Recent studies show that traditional spatial econometric methods face two main theoretical limitations: insufficient justification of spatial dependence assumptions and inconsistency in handling cross-border effects (Inmaculada et al., 2017). This study addresses these limitations in the following ways: First, we explicitly theorize spatial dependence based on Tobler’s First Law of Geography, namely, “things closer in space are more related than things farther apart.” Unlike studies that merely report spatial autocorrelation without articulating theoretical foundations (Inmaculada et al., 2017), we adopt Anselin’s spatial autocorrelation theory, explicitly linking the application of global Moran’s I index and BiLISA methods with spatial dependence mechanisms specific to border regions. Second, we address the cross-border specific spatial dynamics issue pointed out by Grau et al. (2018) and Daniel et al. (2023). Unlike existing studies with inconsistent analytical methods from grid units to parcel level, we adopt an integrated approach combining regional level analysis with city type differentiation analysis to more comprehensively capture spatial heterogeneity in border regions. Third, we address the model selection problem revealed by Zhao et al. (2020) and Sipos et al. (2021), which show different models (such as spatial Durbin, spatial autoregressive, and geographically weighted regression) have different advantages in parameter estimation and spatial heterogeneity capture. Our study overcomes limitations of single models by using regression-based path analysis and spatial analysis, providing a more comprehensive analytical framework.
Compared to existing research, this study offers three important innovations in theoretical framework and methodology: First, breaking through traditional spatial homogeneity assumptions to construct a differentiated border region analysis framework. Existing studies generally view border regions as homogeneous entities Bazarov et al. (2021) or rely on a single spatial scale (Mesbah et al., 2012; Xiu-Qing et al., 2022), failing to fully reveal heterogeneity among different border city types. Based on location characteristics and functional positioning, this study constructs a “border location-functional differentiation-efficiency coupling” framework, surpassing the parcel-level analysis of David and Ralph (2014) and the international comparative research of Zhao et al. (2020), providing a more comprehensive understanding of border region differences. Second, developing a multi-dimensional theoretical model of “policy tools-city types-efficiency performance” to systematically reveal policy response mechanisms of different types of cities. Unlike the spatial conflict measurement methods proposed by Zheng et al. (2022), which fail to fully reveal heterogeneous mechanisms of policy responses across different city types, our theoretical model integrates Benny and Steffen (2013) analysis of administrative boundary effects and Turner and Pham (2015) research on border region development platforms to construct a more explanatory policy response theory. Third, developing a border land use research framework integrating spatial econometric methods and causal inference. Unlike Wang et al. (2024) use of deep learning to identify inefficient spaces and Zhao et al. (2020) application of geographically weighted regression as a single method orientation, our research framework combines the mechanism analysis capability of regression path analysis with the location sensitivity of spatial analysis, and integrates temporal-spatial heterogeneity processing methods from Wenjia and Kexin (2023) to construct an integrated research architecture of “mechanism analysis-spatial verification.” This innovation surpasses the methodological comparative studies of Mühlbach (2019) and Laurent and Thierry (2016), providing analytical tools more suitable for the complex realities of border regions.
2.4.2 Integration of causal inference methods
This study incorporates causal inference methods into spatial analysis, an integration inspired by recent methodological advances. Since 2020, several innovative causal inference methods have emerged in the field of land use policy evaluation, particularly Spatial Interrupted Time Series (SITS) analysis, which directly addresses the challenges of temporal-spatial heterogeneity (Wenjia and Kexin, 2023).
Our method integrates several key causal inference principles: First, we adopt a comparative framework similar to the synthetic control method (Sills et al., 2015; Laurent and Thierry, 2016), systematically selecting and weighting comparison units, using long-term pre-intervention data to evaluate policy effects. This approach is particularly suitable for border region research as it can handle cases with few treatment units. Second, we draw on insights from improved difference-in-differences methods proposed by Brantly and Tong (2023), relaxing standard parallel trend assumptions to address dynamic selection and time stationarity issues common in border regions. Third, we extract value from interdisciplinary approaches from Marcelo et al. (2018) research, which adapts epidemiological methods to land use policy evaluation for handling data limitation situations. This integration of causal inference methods enables us to move beyond simple correlation analysis into more rigorous evaluation of policy effects. In particular, we can distinguish between direct and indirect effects of policies, address potential reverse causality, and consider the influence of unobservable factors.
2.4.3 Selection basis and structural design of path analysis model
This study employs regression-based path analysis to analyze the impact pathways of land use policies on green utilization efficiency. The choice of path analysis over other statistical methods is based on three main considerations: First, path analysis can effectively reveal direct and indirect relationships among multiple variables. The process by which land use policies influence green utilization efficiency involves multiple mediating variables such as economic development, industrial structure, and energy intensity, with complex interactions among these variables. Path analysis can estimate these relationships through multiple regression analysis, thereby better understanding the transmission mechanisms of policy impacts. Second, path analysis offers flexibility in model specification and interpretative intuitiveness. Compared to complex structural equation models, regression-based path analysis has lower requirements for data distribution assumptions, making it more suitable for this study’s limited sample (n = 14), while providing clear and intuitive coefficient interpretation. Third, path analysis is suitable for analyzing longitudinal data. This study spans multi-year observations from 2010 to 2020, necessitating consideration of dynamic changes in policy effects. Path analysis combined with time series data analysis can effectively track the evolution of policy impacts over time.
During the method selection process, we also considered the Geographically Weighted Regression (GWR) method. Although GWR has obvious advantages in handling spatial heterogeneity, this study focuses on the transmission mechanisms of policy impacts rather than merely identifying spatial distribution characteristics; therefore, path analysis better meets research needs. To compensate for path analysis limitations in handling spatial heterogeneity, we combine path analysis with spatial analysis methods to form an integrated research framework of “mechanism analysis-spatial verification,” which can both reveal policy impact mechanisms and verify the spatial differentiation of these mechanisms.
Based on the above theoretical foundation, the path analysis model constructed in this study includes two core variable groups: policy influence factors and green utilization efficiency. Policy influence factors include eight main variables: economic development (GDP, fixed asset investment), industrial structure (proportions of three industries), technological innovation (proportion of science and technology expenditure, patent grants), energy intensity (energy consumption per unit of GDP), urbanization (urbanization rate), openness (total foreign trade), and infrastructure (road network density). These variables as independent variables directly impact green utilization efficiency as the dependent variable, which is measured through three dimensions of carbon emission intensity (Scopes 1, 2, and 3). The model employs Ordinary Least Squares (OLS) to estimate path coefficients and evaluates model fit through indicators such as R2, adjusted R2, F-statistic, and p-value.
Model application results show that based on cross-sectional data from 14 border cities, this study’s model fits well (R2 = 0.924, Adj. R2 = 0.803, F (8,5) = 7.610, p = 0.0194), indicating that the selected policy driving factors can explain 92.4% of carbon emission variation. This result verifies the rationality and effectiveness of the model selection. Specific results of the path analysis will be presented in detail in Section 3.3.3, revealing the degree and direction of influence of different policy factors on land green utilization efficiency through path coefficients and their significance levels.
2.4.4 Analysis of policy implementation effects
(1) This study uses area proportion method and Regional Difference Index (RDI) to evaluate land use policy implementation effects, while employing transition matrix method to analyze land use conversion relationships during policy implementation. The Regional Difference Index is calculated as:
where
(2) To evaluate the spatial effects of policy implementation, the global Moran’s I index is used to measure the spatial correlation of policy implementation:
where
2.4.5 Efficiency assessment methods
This study employs a comprehensive assessment system based on carbon emission intensity to measure land green utilization efficiency. The selection of carbon emission data as the main indicator for evaluating green utilization efficiency, rather than other pollutants such as sulfur dioxide, industrial wastewater, and PM2.5, is primarily based on the following three considerations: First, carbon emissions serve as a comprehensive indicator for measuring the sustainability of land resource utilization. Compared to single pollutant indicators, carbon emission data can more comprehensively reflect the environmental impacts of various land use methods including agricultural production, industrial activities, energy consumption, and ecosystem functions. Particularly in the context of international climate change response, carbon emissions have become a key indicator for measuring regional sustainable development levels, directly linked to global emission reduction goals. Second, carbon emissions possess clear cross-regional comparability. Unlike certain environmental indicators with significant regional specificities (such as the varying impacts of water pollution indicators in water-rich areas versus water-scarce areas), carbon emission impacts are global and not limited by regional conditions, helping ensure the comparability of assessment results between different types of border cities. Third, carbon emission data have higher consistency and accessibility in border regions. The carbon emission statistical system in China’s northeastern border region is relatively well-established with high data quality, capable of supporting long time-series regional comparative studies. In contrast, data for other pollutants show greater differences in statistical standards and monitoring methods across different regions, making it difficult to meet the needs of cross-regional comparative research.
Based on these considerations, land use efficiency assessment employs annual average change rates and variation coefficients to measure temporal change characteristics, analyzing efficiency structural characteristics through multi-dimensional composition analysis. To analyze regional differences, one-way analysis of variance method is adopted:
where
2.4.6 Policy effect evaluation methods
Policy effect evaluation methods include three dimensions: First, Pearson correlation coefficient is used to evaluate policy implementation effects:
where
Second, BiLISA method is used to analyze spatial correlation effects of policies:
where
Finally, coupling degree analysis is used to evaluate policy synergy:
where
2.4.7 Policy driving mechanism analysis
This study employs the Logarithmic Mean Divisia Index (LMDI) decomposition method to analyze the policy driving mechanisms of land use efficiency. In the assessment of policy driving factors, this study selects energy emission intensity (energy consumption per unit of GDP) as the main infrastructure evaluation indicator, rather than solely using traditional road network density or power supply facility coverage, primarily based on the following considerations: First, energy emission intensity is a comprehensive indicator reflecting the degree of infrastructure modernization and efficient utilization. In border regions, single physical infrastructure indicators struggle to comprehensively reflect regional development levels. Energy emission intensity not only reflects the level of energy infrastructure construction but also embodies energy utilization efficiency, providing a more comprehensive assessment of the overall quality of regional infrastructure. Second, energy emission intensity has a direct intrinsic connection with land green utilization efficiency. The level of infrastructure development affects land use patterns, thereby influencing carbon emission intensity. Especially in border regions, energy infrastructure configuration significantly impacts land use efficiency. Third, data availability for energy consumption in northeastern border regions is higher than for other infrastructure indicators, capable of supporting long time-series analysis. Data selection comprehensively considers theoretical relevance and data accessibility, maximizing research feasibility while ensuring the theoretical rationality of the assessment.
The specific calculation formula is as follows:
where
where
3 Results
3.1 Land use policy implementation and its effects
3.1.1 Policy impact on land use structure
The implementation of national land use policies has created significant regional differences and dynamic evolutionary patterns in the study area. These differences reflect policy orientations. At a deeper level, they demonstrate the comprehensive influence of regional development strategies, natural resource endowments, and historical path dependencies. In 2020, the “National Land Use General Planning (2006–2020)” and “Greater and Lesser Xing’an Mountains Forest Region Ecological Protection and Economic Transformation Planning (2010–2020)” jointly shaped the differentiated land use pattern in the study area. The high forest coverage in ecological protection policy-dominated regions—Daxing’anling (96.87%), Baishan (91.34%), and Yichun (87.80%)—is both a spatial projection of the national ecological security strategy in border regions and an institutional manifestation of regional functional positioning transformation under ecological value reassessment. The high level of ecological protection in these regions strengthens the ecological barrier function of border areas, becoming an important component of national spatial optimization. Under the guidance of agricultural policies, the distribution differences of cultivated land are significant, with plain regions such as Jiamusi (77.90%), Jixi (58.53%), and Shuangyashan (60.91%) having much higher proportions of agricultural land than other regions. This distribution pattern is both determined by natural geographical conditions and represents the institutional arrangement of the national food security strategy in spatial terms, consolidating the functional positioning of the Songnen Plain and Sanjiang Plain as major commercial grain-producing areas (Table 3).
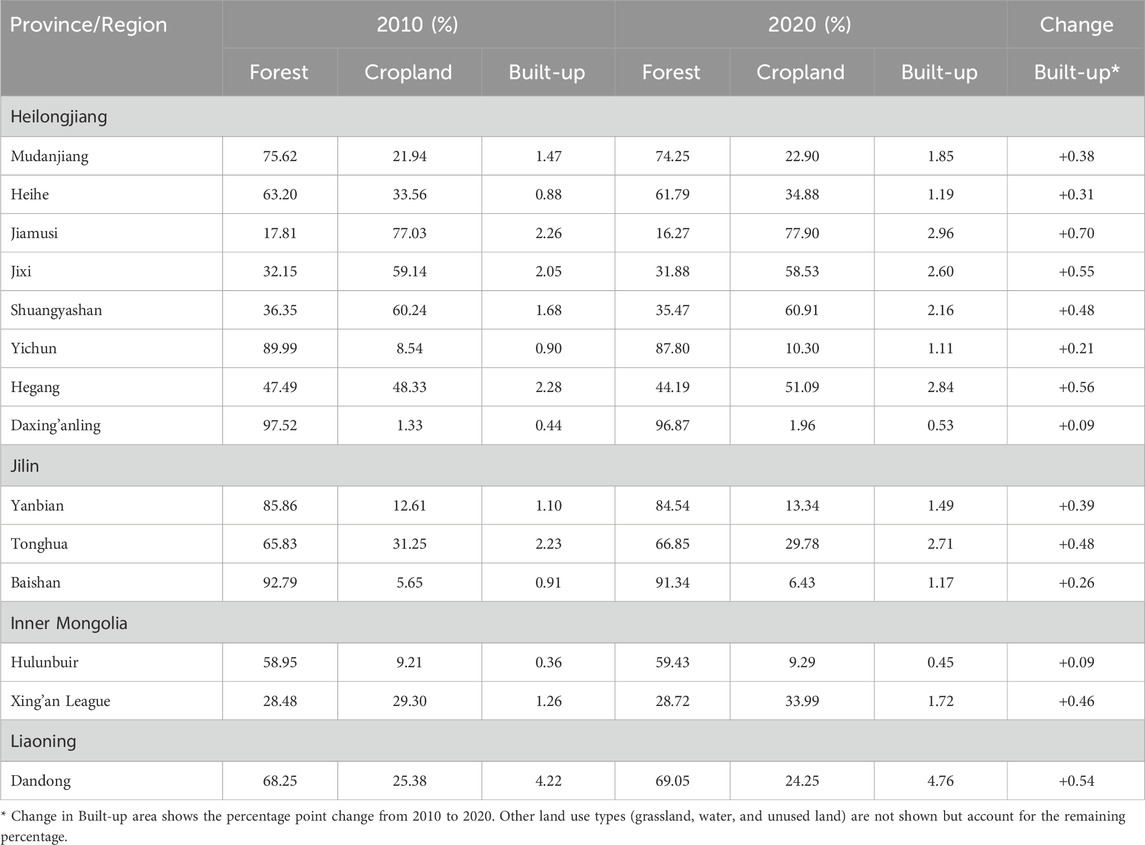
Table 3. Changes in land use structure under different policies in northeastern border regions (2010–2020).
From a temporal evolution perspective (Table 3), the land policy implementation effects during 2010–2020 exhibited differentiated characteristics adapting to regional functional positioning. Under industrial development policy orientation, urban construction land expansion was significant, such as Jixi increasing from 2.05% to 2.60%, and Shuangyashan from 1.68% to 2.16%. This expansion pattern reflects the institutional demand for construction land in resource-based cities during industrial transformation and also embodies the spatial manifestation of local development strategies against the backdrop of “land finance.” Land use transition matrix analysis (Supplementary Table S1) shows that construction land expansion in these cities mainly occupied cultivated land, such as 127.88 square kilometers of cultivated land in Jixi city being converted to construction land, reflecting the adjustment mechanism of land use structure under the dual driving forces of industrialization and urbanization. In contrast, ecological protection policy-dominated regions exhibited obvious stability characteristics, such as Baishan city’s forest land proportion decreasing by only 1.45 percentage points (from 92.79% to 91.34%), with changes mainly occurring between different types of ecological land. This difference highlights the institutional differences in resource allocation mechanisms and development intensity under different policy orientations, while also reflecting the restructuring role of ecological civilization construction on traditional development models.
From the perspective of inter-provincial differences, each province exhibits diverse policy implementation effects based on resource endowments and development strategies (Supplementary Figure S1). The diversified pattern in Heilongjiang Province’s border regions—ecological dominance in the northern Daxing’anling (forestland 96.87%) and Yichun (forestland 87.80%), agricultural dominance in the central Jiamusi (cultivated land 77.90%) and Jixi (cultivated land 58.53%)—reflects the differentiated development strategies and resource allocation mechanisms within the province, embodying the “one province, multiple policies” approach to coordinated regional development. The unified ecological protection policy orientation in Jilin Province’s three border regions (forest coverage rate 66.85%–91.34%) indicates the consistency in institutional implementation of regional ecological security strategies, strengthening the ecological barrier function of the eastern border. The differentiated pattern in Inner Mongolia Autonomous Region’s two areas—Hulunbuir’s “forest-grassland complex” (forestland 59.43%, grassland 29.56%) and Xing’an League’s “cropland-grassland complex” (cultivated land 33.99%, grassland 34.56%)—embodies the institutional balance mechanism between grassland ecosystem and agricultural-pastoral development. Liaoning Province’s Dandong City has formed a pattern primarily based on ecological protection (forestland 69.05%) supplemented by urban development (construction land 4.76%) through policy guidance, reflecting the differentiated functional positioning of border regions by a coastal open province.
The correlation between land use policy implementation effects and regional functional positioning reflects the targeted nature of policy design and implementation effectiveness. The land use structure characteristics of industrial development-oriented cities—high proportions of cultivated land (58%–61%) and continuous construction land growth—indicate that these regions are in a transitional development stage, with land use patterns influenced by both historical industrial layout and current development needs. The composite land use structure formed by port cities reflects their multi-functional positioning and institutional choices seeking balance between border economic cooperation and ecological security. The high forest proportion in ecological protection-dominated cities embodies the profound influence of the ecological priority concept on land policies and the restructuring effect of national ecological security strategies on regional development paths.
Land use transfer matrices further reveal differences in land use change mechanisms under different policy orientations (see Supplementary Table S1). Under industrial development policies, cities mainly expand construction land by occupying cultivated land (such as 127.88 square kilometers of cultivated land in Jixi city being converted to construction land), reflecting the institutional bias in land resource allocation and economic growth pressure during industrialization processes. The economical and intensive characteristics of ecological protection policy-dominated cities (such as only 52.25 square kilometers of cultivated land being converted to construction land in Baishan city) embody the reshaping effect of green development concepts on land use patterns. This differentiated pattern of land use change is both a spatial mapping of regional development stage differences and an institutional manifestation of resource optimization allocation mechanisms under different policy orientations, providing an important perspective for understanding the spatial heterogeneity of policy effects.
3.1.2 Spatial pattern of policy implementation
The spatial distribution of land use in the study area is influenced by both industrial (Guo et al., 2023). The implementation effect of ecological protection policies is reflected in the spatial distribution of forestland. As shown in Figure 2, forestland demonstrates significant spatial clustering, mainly distributed in ecological corridor zones such as the Greater Xing’an Mountains, Lesser Xing’an Mountains, and Changbai Mountain areas, forming a “three-mountain connected” ecological security pattern in the northeastern border region. The distribution of cropland under agricultural development policy guidance shows evident regional concentration, mainly concentrated in the Songnen Plain and Sanjiang Plain regions, particularly forming concentrated continuous agricultural production areas in regions such as Jiamusi and Shuangyashan. The implementation of grassland ecological protection policies has resulted in grassland being mainly distributed in the Hulunbuir grassland region, showing unique spatial continuity. Built-up land under urban development policies, although occupying a relatively small proportion, shows significant expansion tendencies around major cities, with spatial distribution showing evident point-clustering characteristics.
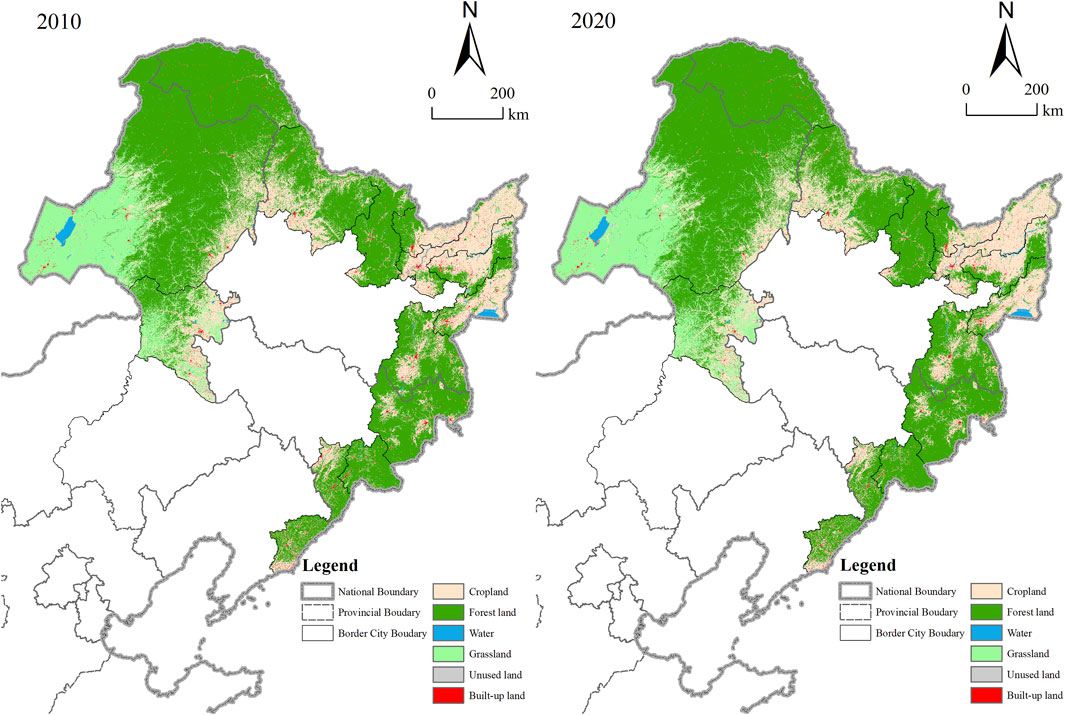
Figure 2. Spatial distribution of land use policy implementation effects in northeastern border regions (2010–2020).
We evaluated spatial effects of policy implementation using the global Moran’s I index method (Equation 7). The analysis results (Supplementary Table S2) reveal that different land use types show distinct policy response characteristics. Statistical significance testing of Moran’s I indices reveals spatial autocorrelation characteristics in the land use pattern of border regions. In 2020, the implementation of agricultural land policies resulted in significant clustering of cultivated land (Moran’s I = 0.441, p
In contrast, ecological protection policies have promoted a balanced distribution of forestland, with spatial autocorrelation test results for forest land (Moran’s I = 0.249, p
Comparing policy implementation effects between 2010 and 2020 (Figure 2), spatial differences in land use changes can be observed. The impact of ecological protection policies has resulted in forestland changes mainly occurring in marginal transition zones, primarily involving policy adjustments with cultivated land; grassland protection policies have ensured the stability of grassland spatial distribution, mainly concentrated in eastern Inner Mongolia; while urban development policies have guided the orderly expansion of construction land along transportation arteries and central urban areas. This policy effect is also supported by spatial autocorrelation indices, with the Moran’s I statistic for cultivated land increasing from 0.433 (p = 0.015) in 2010 to 0.441 (p = 0.013) in 2020, indicating enhanced spatial clustering reaching statistical significance. This transition confirms the gradually strengthening spatial synergy effect of regional agricultural policy orientation. The Moran’s I value for grassland in 2020 (0.661) slightly increased compared to 2010 (0.651), reflecting the enhanced effect of grassland protection policies.
The spatial distribution characteristics of unused land and water bodies embody the differentiation of policy implementation. Unused land exhibits stronger spatial dependence (Moran’s I = 0.319, p
By comparing the spatial autocorrelation significance test results of different land types, the spatial differentiation effect of policy interventions can be identified: regions with the most significant ecological protection policy effects (grassland protection areas) exhibit the highest spatial autocorrelation coefficient (0.661) and statistical significance (p
Further in-depth analysis reveals complex socioeconomic and institutional driving mechanisms behind this spatial pattern of land use policy implementation. The significant spatial clustering of cultivated land and grassland versus the relative dispersion of construction land and forestland reflects the interaction process between differentiated policy tools and regional characteristics. Specifically, cultivated land clustering under agricultural land policy orientation mainly stems from historically formed agricultural production specialization and pursuit of economies of scale; Heilongjiang Province’s Songnen Plain and Sanjiang Plain have formed concentrated contiguous major grain-producing areas, institutionally prioritized and protected by the “National Land Use General Planning.” The high clustering of grassland (Moran’s I = 0.661) reflects the requirement for integrity protection of the eastern Inner Mongolia grassland ecosystem, with relevant ecological compensation policies reinforcing this spatial pattern. In contrast, the relative evenness of forestland distribution aligns with the policy concept of the “Greater and Lesser Xing’an Mountains Forest Region Ecological Protection and Economic Transformation Planning,” which emphasizes overall ecosystem protection rather than local priority protection. The dispersion of urban construction spatial patterns embodies the strategic choice of balanced development in border regions and policy orientation toward small town construction. This spatial differentiation is not only a result of natural conditions and historical inertia but also a spatial mapping of differences in policy tool selection, implementation intensity, and control methods, reflecting the spatial coordination mechanism of multiple policy objectives in the regional sustainable development process.
3.1.3 Regional differences in policy response
Different land use policy orientations have caused significant regional differences. Regional Difference Index analysis results show (Supplementary Table S3) that RDI values calculated using Equation 6 reflect the spatiotemporal differentiation of land policy implementation effects. Under agricultural policy orientation, Jiamusi City shows the highest cropland difference index (1.504 in 2020), significantly higher than the study area’s average level. Hulunbuir City, dominated by grassland protection policies, shows prominent performance in grassland difference index (5.053), reflecting the significant effect of grassland ecological protection policies. Regarding forest protection, Daxing’anling region (0.598) and Yanbian Prefecture (0.395) show relatively stable difference indices, while Jiamusi City (0.732) shows relatively higher values, reflecting regional differences in forest protection policy implementation intensity.
From the temporal evolution of policy implementation, grassland protection policy implementation shows significant effects. In 2020, the grassland difference indices of Hulunbuir City (5.053) and Xing’an League (6.077) were significantly higher than other regions. Compared to 2010 (5.076 and 6.104 respectively), these two regions maintained relatively stable difference indices, indicating continuous effective implementation of grassland ecological protection policies. Regarding urban development policies, built-up land difference indices show an overall convergence trend, such as Dandong City decreasing from 1.737 in 2010 to 1.420 in 2020, reflecting the gradual effect of regional coordinated development policies, with urban construction becoming more balanced.
Box plot analysis (Supplementary Figure S2) further reveals the characteristics of inter-provincial policy implementation differences. Heilongjiang Province adopts differentiated land policies, resulting in the largest internal differences, particularly evident in cropland proportion. Within this, agriculture policy-led Jiamusi (77.90%) and ecological protection policy-led Daxing’anling (1.96%) constitute the upper and lower quartile extreme points respectively, forming an “agriculture-forest” composite policy pattern. Jilin Province implements unified ecological protection policies, with forest proportions in its three regions maintaining high levels (66.85%–91.34%) and showing small box height, reflecting policy orientation consistency.
The radar chart (Figure 3) clearly demonstrates policy implementation characteristics of different types of regions. Cities under industrial development policies formed a structure dominated by cropland (56.84%) with relatively high built-up land proportion (2.53%). Cities guided by port economy policies show a balanced composite pattern, with moderate forest proportion (66.13%) and coordinated proportions of built-up land (2.06%) and water bodies (1.06%). Cities dominated by ecological protection policies prominently show a forest-led (67.48%) and cropland-supplemented (24.81%) structure, with the lowest unused land proportion (0.0855%), reflecting higher land use efficiency. This type differentiation reflects high consistency between policy implementation effects and regional functional positioning.
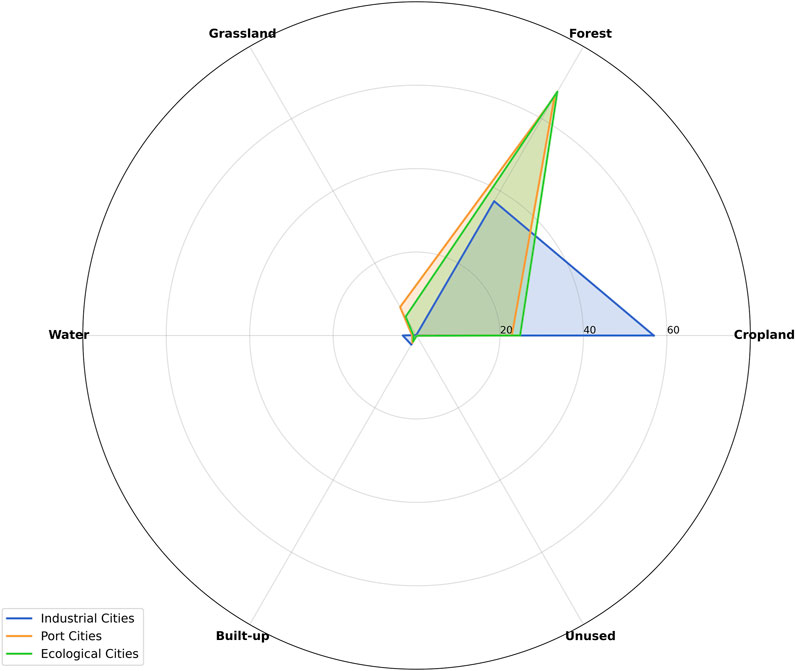
Figure 3. Land use patterns by city type under different policy implementation (2020).
This type differentiation not only reflects the high degree of alignment between policy implementation effects and regional functional positioning but also reveals deeper socioeconomic and institutional driving mechanisms. The differences in land use patterns among the three types of cities presented in the radar chart (Figure 3) are essentially the result of the combined effects of urban functional positioning, economic development stages, and regional collaboration mechanisms.
The structure of industrial cities dominated by cultivated land (56.84%) with a relatively high proportion of construction land (2.53%) reflects the natural geographical conditions and historical agricultural foundation of these cities located in plain areas, while also relating to industrial layout during the planned economy period. Resource-based economic structures have limited the diversified development of land use methods, forming characteristics of coexisting agricultural and industrial land. Particularly for resource-depleted cities like Jixi, facing dual challenges of industrial upgrading and spatial restructuring during transformation, land use policies more often shoulder the functions of stabilizing employment and ensuring livelihoods.
The “diversified” land use structure of port cities reflects their transitional economic development stage and multi-functional positioning, with cross-border economic cooperation reshaping land spatial organization, and policy implementation focusing more on balancing development and openness. The “forestland-dominated, cultivated land-supplemented” pattern of ecological cities embodies the restructuring of regional development paths by national ecological security strategies, with ecological compensation mechanisms and regional interest coordination mechanisms having a key impact on policy implementation effects. From the inter-provincial comparison of regional difference indices (Supplementary Figure S2), internal policy differences within Heilongjiang Province’s border regions are most significant, reflecting its diversified functional positioning and complex governance system; while the uniformity of Jilin Province’s border regions embodies the institutional effects of regional coordinated development strategies. These differentiated characteristics indicate that successful land use policies need to fully consider regional historical paths, development stages, and functional positioning, achieving an organic unity of “adaptation to local conditions” and “coordinated development” in policy design and implementation processes.
3.2 Land green utilization efficiency: spatiotemporal analysis
3.2.1 Temporal trends in land use efficiency
Carbon emission intensity, as an important indicator for assessing land green utilization efficiency, reflects the spatiotemporal evolution characteristics of land use efficiency in the study area. Based on the land use efficiency assessment results (Supplementary Table S4), the total carbon emissions calculated by Equation 1 for the 14 border regions increased from 373.56 million tons in 2010 to 495.54 million tons in 2020, an increase of 32.65%, indicating that the overall land use efficiency needs improvement. There are significant differences in land use efficiency across regions. For instance, carbon emissions in Jixi City increased from 31.11 million tons in 2010 to 46.60 million tons in 2020, an increase of 49.79%, reflecting a decline in land use efficiency. In contrast, Inner Mongolia Autonomous Region showed relatively higher land use efficiency, with carbon emissions in Hulunbuir City increasing only from 8.028 million tons to 9.424 million tons, an increase of 17.39%.
Different regions within the study area demonstrate unique efficiency change patterns. Taking Hulunbuir City as an example, its carbon emissions achieved a decrease during 2010–2015 (from 8.028 million tons to 7.469 million tons), reflecting improved land use efficiency, but showed a slight increase during 2015–2020 (rising to 9.424 million tons), forming a “V-shaped” change trend, reflecting the impact of land policy adjustments during regional development. In contrast, Dandong City shows relatively stable land use efficiency characteristics, with its carbon emission proportion showing a slight downward trend (from 9.24% in 2010 to 8.77% in 2020), reflecting continuous improvement in intensive land use levels.
To more intuitively display the dynamic change characteristics of land use efficiency, this study constructs a bubble chart (Figure 4). Bubble size reflects the absolute level of land use efficiency, while color depth indicates the rate of efficiency change. During 2010–2015, most regions showed declining trends in land use efficiency, manifested as bubbles showing obvious red color and increased size, with Jixi City showing the fastest efficiency decline at an annual growth rate of 6.11%. Entering 2015–2020, the trend of land use efficiency improvement gradually emerged, with bubble colors generally becoming lighter, some regions even showing light blue, reflecting the gradual emergence of positive effects from land use policies.
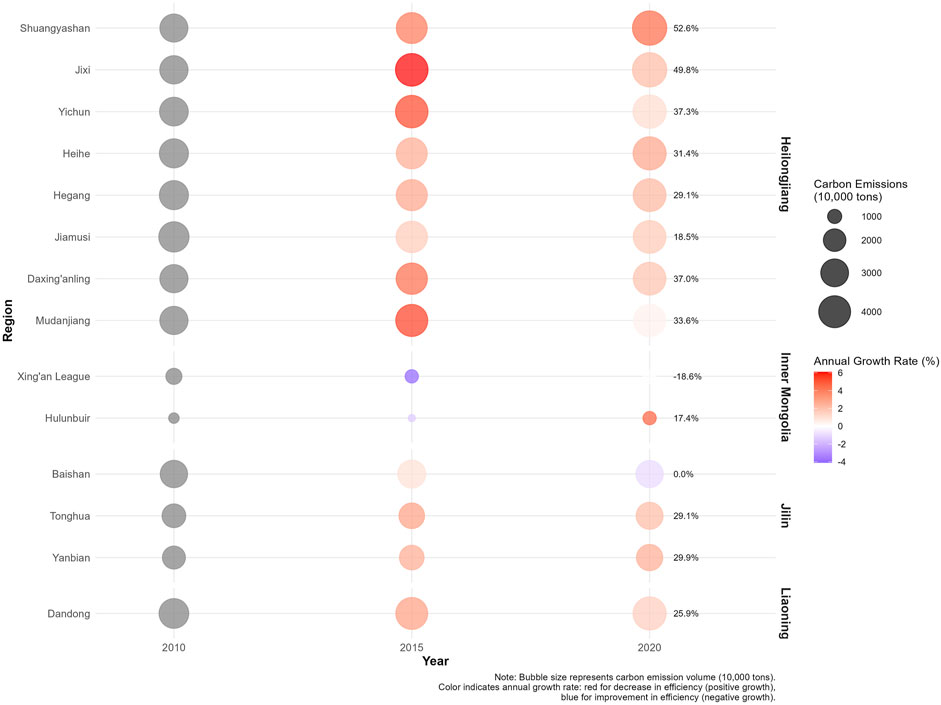
Figure 4. Changes in land use efficiency in northeastern border regions (2010–2020).
These temporal evolution characteristics of land use efficiency not only reflect changes in statistical data but also embody deeper socioeconomic transformation processes. The decline in carbon emissions in Hulunbuir City from 2010 to 2015 (from 8.028 million tons to 7.469 million tons) is closely related to its industrial structure adjustment, particularly the increase in tertiary industry proportion and energy structure optimization, reflecting institutional innovation in this region actively responding to the national low-carbon development strategy. In contrast, the rapid growth of carbon emissions in Jixi City (with an annual average growth rate of 6.11%) embodies institutional barriers to the transformation of resource-based cities, including resistance to state-owned enterprise reform, policy implementation deviations caused by employment pressure, and imperfect technological innovation systems. This difference simultaneously reflects imbalances in regional innovation capabilities and differences in policy implementation effectiveness, revealing that institutional design for coordinated regional development needs to place greater emphasis on adaptation to local conditions and precise policy implementation.
3.2.2 Structural characteristics of land use efficiency
The assessment of land use efficiency in the study area requires not only attention to the overall level but also in-depth analysis of its structural characteristics to reveal the underlying socioeconomic transformation mechanisms and institutional driving factors. Based on the multi-dimensional analysis of carbon emission composition (Supplementary Table S5), direct emissions (Scope 1) calculated by Equation 2 from land use activities dominate the carbon emissions in the study area. In 2020, the proportion of Scope 1 emissions across regions was generally between 61% and 70%, indicating that land use efficiency is mainly influenced by fossil energy consumption and industrial production processes. This emission structure characteristic reflects the deep-rooted heavy industrial foundation and relatively traditional energy utilization patterns in Northeast China, as well as the institutional resistance in regional industrial structure transformation.
Different types of cities exhibit significant differences in efficiency structure, revealing the profound impact of urban functional positioning on resource utilization patterns. Industrial cities (Jixi, Shuangyashan, and Hegang) have land use efficiency dominated by industrial activities, characterized by high Scope one emission proportions (average 67.01%) and high energy consumption calculated by Equation 3 (Scope two average 15.01%). This structural characteristic originates from the heavy industry-oriented spatial layout and resource-intensive production methods formed during the planned economy period, reflecting the dual challenges of technological upgrading and institutional innovation faced by resource-based cities during industrial transformation. Port cities (Heihe, Mudanjiang, Dandong, and Hulunbuir) have formed more efficient land use patterns, with relatively low proportions of Scope one emissions (average 65.96%), but higher indirect emissions from service industries calculated by Equation 4 (Scope three average 18.99%). This structural characteristic embodies the effectiveness of economic structure optimization achieved by port cities under the promotion of opening-up policies, and also reflects the reshaping effect of modern service industry development on land use patterns, demonstrating the institutional dividends of the national border opening strategy.
From an inter-provincial comparison perspective (Supplementary Figure S3), regional differences in efficiency structure reflect the dual influence of local governance models and resource endowments. The land use efficiency structure in Heilongjiang Province’s border regions is relatively homogeneous, with coefficient of variation calculation results showing that in 2020, the proportions of Scope 1, 2, and 3 emissions were 0.05, 0.21, and 0.19 respectively. This homogeneity stems from integrated industrial policies and energy planning at the provincial level, embodying the institutional effects of unified regional market construction. In contrast, significant differences in land use efficiency exist between the two border regions of Inner Mongolia Autonomous Region, with Hulunbuir City and Xing’an League differing by 2.78 percentage points in the proportion of Scope 1 emissions, reflecting the spatial heterogeneity of local autonomy and adaptability in the land use policy implementation process, while also highlighting the practical paths of differentiated development strategies.
The regional differences in energy consumption dimension (Scope 2 emissions) and industrial development dimension (Scope 3 emissions) of land use efficiency further reveal the diversity of development path choices. In 2020, Shuangyashan City’s Scope 2 emissions accounted for 19.04%, significantly higher than the study area average; while Xing’an League was only 11.69%, reflecting institutional environment differences in energy infrastructure construction and energy structure adjustment across different regions. From a temporal evolution perspective, the degree of dependence on purchased energy has been continuously increasing, such as the proportion of Scope 2 emissions in Mudanjiang City rising from 10.12% in 2010 to 18.45% in 2020, indicating that regional energy integration strategies are reshaping the association mechanism between land use and energy consumption, promoting the formation of more intensive and efficient energy utilization patterns.
In terms of industrial development dimension, efficiency structure changes are closely associated with industrial transformation policies. In 2020, Yichun City had a relatively high proportion of Scope 3 emissions (24.7%), embodying the institutional innovation effectiveness of transition from traditional forestry economy to ecological service economy; while the Daxing’anling region was relatively low (16.3%), reflecting path dependency of industrial development under strict ecological protection policies. During 2010–2020, the land use optimization trends of some ecological cities—such as the increase in Scope 3 emissions proportion in Yanbian Prefecture from 15.77% to 20.92%—indicate that service-oriented industrial policies have become the core driving force for land use pattern transformation in these regions, embodying the synergistic effects of industrial upgrading and spatial restructuring under the Northeast Revitalization Strategy. These structural differences and their evolutionary characteristics not only reflect the differences in land use efficiency improvement strategies across different types of regions but also reveal the interactive mechanism between institutional change and technological innovation in the regional development process. With the deepening advancement of ecological civilization construction and implementation of carbon peaking and carbon neutrality strategies, the proportions of Scope 2 and Scope 3 will further increase, especially in ecological cities, a trend presaging that land use patterns in border regions are undergoing profound institutional transformation, forming greener and lower-carbon development models.
3.2.3 Spatial patterns of land use efficiency
The spatial pattern of land use efficiency demonstrates significant clustering and gradient distribution characteristics (Han et al., 2019) (Figure 5). In terms of carbon emission intensity, regional land use efficiency generally shows a “high west-low east” spatial pattern. In 2020, eastern regions including Jixi City (46.600 million tons), Shuangyashan City (46.640 million tons), and Dandong City (43.440 million tons) formed a low-efficiency cluster zone; while western regions including Hulunbuir City (9.424 million tons) and Xing’an League (9.456 million tons) demonstrated characteristics of highly efficient utilization.
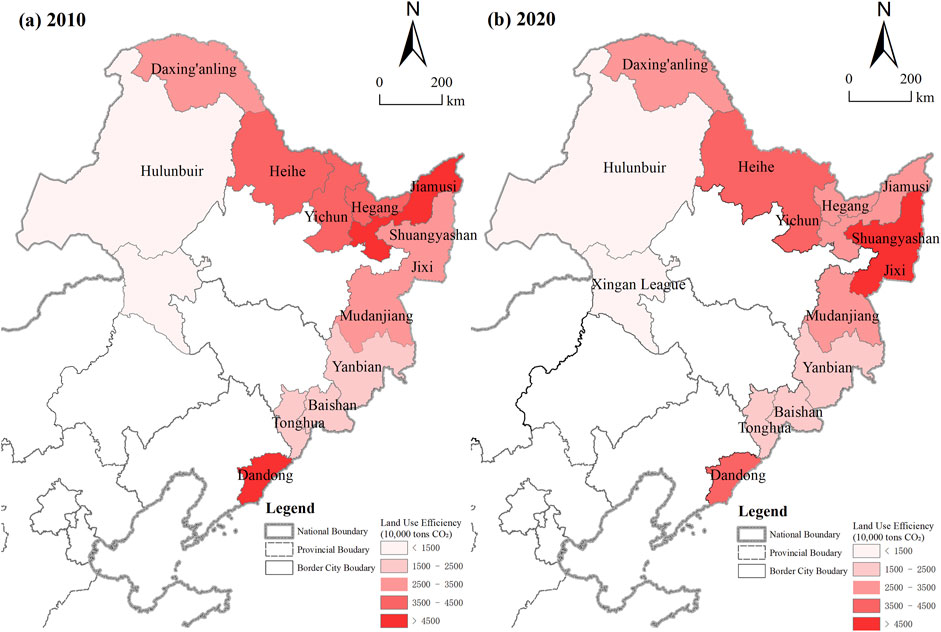
Figure 5. Spatial pattern of land use efficiency in northeastern border regions during different periods: (a) 2010; (b) 2020.
Further verification of this spatial differentiation pattern comes from spatial clustering characteristics of land use efficiency (Supplementary Table S6). In 2020, eastern Heilongjiang Province formed a significant low-efficiency cluster (H-H), with Jixi City
From the temporal evolution of land use efficiency, the study area’s spatial pattern has undergone partial adjustments. During 2010–2020, Jiamusi City’s land use efficiency characteristics underwent significant changes, transforming from a non-significant state in 2010
Different provinces demonstrate differentiated spatial clustering characteristics in land use efficiency. Border regions in Heilongjiang Province show the most significant spatial correlation in land use efficiency, with five regions showing significant spatial autocorrelation in 2020. In comparison, border regions in Jilin Province demonstrate more independent efficiency characteristics
Behind this spatial distribution pattern and clustering characteristics of land use efficiency lie complex socioeconomic, historical development, and institutional driving mechanisms. The “high in the west, low in the east” efficiency spatial pattern reflects the differential influence of regional industrial evolution paths. The formation of low-efficiency clustering areas in the eastern region, represented by Jixi and Shuangyashan, stems from the historical inertia of resource-led industrialization; long-term resource dependence has not only shaped an industrial structure dominated by heavy industry but also formed a high-carbon emission technological path dependency. The spatial autocorrelation in these regions is significant
From a temporal evolution perspective, the phenomenon of Jiamusi City transitioning from a non-significant state to low-efficiency clustering (
3.2.4 Regional differences in efficiency
Significant provincial differences and type differentiation characteristics exist in land use efficiency in the study area, and this spatial heterogeneity may be closely related to regional development paths, industrial structure characteristics, and resource endowment conditions. In terms of carbon emission intensity, one-way analysis of variance (Equation 8) results (Supplementary Table S7) show that Heilongjiang Province’s border regions have relatively high carbon emissions, with an average total of 43.621 million tons in 2020, significantly higher than other provinces. This may be related to the historically formed resource-intensive industrial structure and traditional energy utilization patterns in this region, reflecting historical remnants of heavy industrial layout during the planned economy period. Notably, the carbon emission intensity in this region decreased from 0.88 tons/10,000 yuan in 2010 to 0.68 tons/10,000 yuan in 2020, a reduction of 22.73%. This improvement trend coincided with industrial adjustment policies and technological updating measures implemented in recent years, but more evidence is needed to determine specific causal relationships. Border regions in Inner Mongolia Autonomous Region have relatively low total carbon emissions, only 9.44 million tons in 2020, with a carbon emission intensity of 0.11 tons/10,000 yuan. This efficiency difference may be associated with its industrial structure characteristics and natural resource endowment conditions.
From an urban type perspective, the three types of cities exhibit differentiated characteristics in land carbon emission efficiency. Industrial cities (Jixi, Shuangyashan, Hegang) have relatively high per capita carbon emissions, maintained at a level of 1.00 tons/person in 2020, with no significant change during 2010–2020. This stability may reflect structural challenges faced in the transformation process of resource-based economies, including insufficient industrial diversification and slow technological updating. Port cities (Heihe, Mudanjiang, Dandong, Hulunbuir) have lower per capita emissions at 0.46 tons/person, with carbon emissions per unit of GDP at 1.54 tons/10,000 yuan. The data indicate that these cities are dominated by service industries, with a statistical association between their land use patterns and lower carbon emission intensity. Ecological cities are at an intermediate level, with per capita emissions of 0.95 tons/person in 2020 and an emission intensity of 1.31 tons/10,000 yuan, which may be related to their need to balance the dual goals of ecological protection and economic development.
Time series data show differences in efficiency improvement degrees among different types of cities during 2010–2020. Industrial cities had the smallest reduction in carbon emission intensity (8.51%), while port cities (12.50%) and ecological cities (13.82%) showed relatively larger improvements. These differences may be related to industrial structure characteristics, technological application levels, and policy implementation environments of various types of cities, but this association does not necessarily imply a direct causal relationship. Determining specific causal mechanisms requires further empirical research, especially targeted policy effect assessments.
The relationship between efficiency and economic development shown in Figure 6 further highlights the potential association between development models and land use efficiency. Industrial cities such as Jixi City (57.238 billion yuan, 8.14 tons/10,000 yuan) and Shuangyashan City (49.394 billion yuan, 9.44 tons/10,000 yuan) have relatively high carbon emission intensities, which may be associated with industrial structures dominated by resource extraction and heavy industry; while port city Hulunbuir (117.220 billion yuan, 0.80 tons/10,000 yuan) has a lower carbon emission intensity, possibly reflecting different resource utilization patterns of a service-dominated economy. Differences also exist among cities of the same type, such as the carbon emission intensity of industrial city Hegang (12.48 tons/10,000 yuan) being higher than that of Jixi City (8.14 tons/10,000 yuan), suggesting that individual city characteristics (such as resource endowments, development stages, and management capabilities) may explain efficiency performance better than simple type classification.
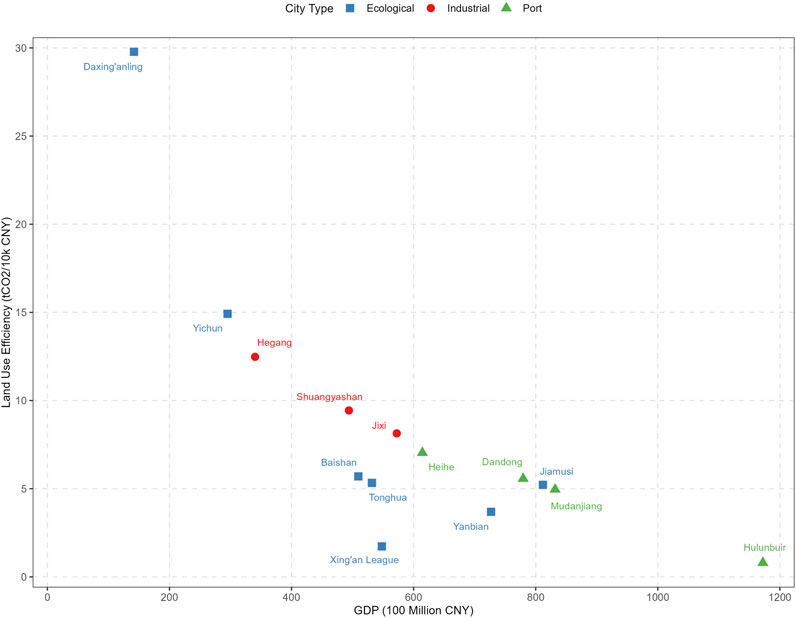
Figure 6. Relationship between economic development and land use efficiency across different types of cities (2020).
Based on the above analysis, we propose the following specific, operational policy recommendations:
For industrial cities, research results indicate that this type of city has the highest carbon emission intensity and the smallest improvement margin. We recommend implementing targeted technological innovation incentive measures, such as establishing special technological transformation funds, providing over 50% financial support for energy efficiency improvement projects; establishing a differentiated emission rights trading system, setting stricter emission reduction targets for high-carbon intensity industries; developing tax incentive policies for high-energy-consuming enterprises, such as reducing corporate income tax by 30% for enterprises achieving energy consumption reductions of more than 15%.
For port cities, data shows that this type of city already has relatively high land use efficiency. We recommend supporting their further development of service industry advantages while promoting these experiences to other types of cities: establishing a service industry development experience sharing platform in border regions, regularly organizing technical exchanges between different types of cities; strengthening intelligent upgrading of port infrastructure, such as digital customs clearance systems, to improve land use efficiency; policy support should not simply favor port cities while neglecting industrial cities, but should allocate resources according to efficiency improvement potential.
For ecological cities, we recommend developing economic activities consistent with ecological positioning on the basis of ecological protection: developing ecological value transformation mechanisms, such as establishing carbon sink trading platforms to convert ecological protection into economic benefits; designing ecological tourism franchise auction systems to balance development and protection; formulating quantitative ecological service industry development targets, such as increasing the proportion of service industries to 60% by 2030.
The above recommendations are based on empirical data analysis of different types of cities, proposing differentiated measures targeting their respective characteristics, rather than simply favoring one type of city. Implementation of these policies needs to consider local specific conditions and establish dynamic evaluation mechanisms, adjusting policy tool combinations in a timely manner to achieve continuous improvement in land use efficiency in border regions.
3.3 Policy effects on land use efficiency
3.3.1 Policy response analysis
To evaluate land use policy effects, this study analyzes the correlation between different land use types and land use efficiency (with carbon emissions as indicators), deeply revealing the socioeconomic driving mechanisms and institutional effects behind policy implementation. Research results show significant differences in the impact of different land use types on land use efficiency, reflecting spatial heterogeneity in the matching degree between policy tool selection and regional characteristics. Analysis results using the Pearson correlation coefficient method (Equation 9) indicate (Table 4) that in 2020, the proportion of cultivated land use showed a significant negative correlation with land use efficiency (r = 0.377,
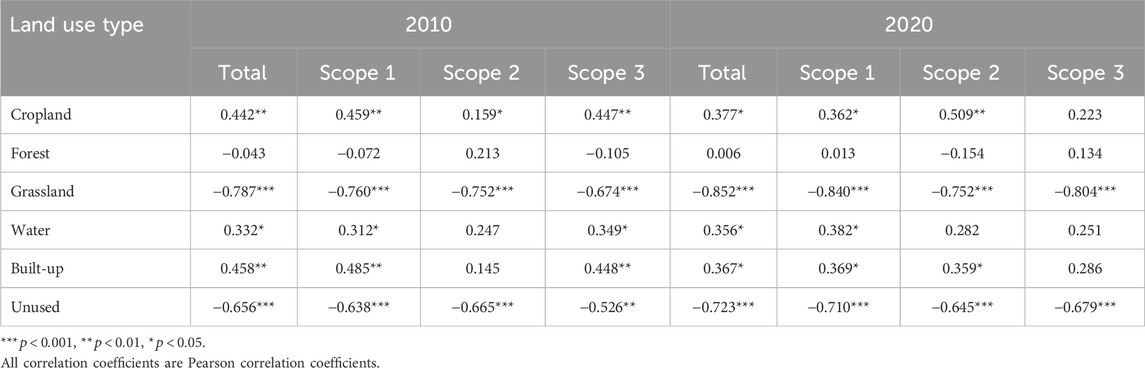
Table 4. Correlation analysis between land use types and land use efficiency.
Grassland policies exhibit the most significant effects, with correlation coefficients with land use efficiency in 2020 reaching −0.852, −0.840, −0.752, and −0.804 respectively (all
Urban construction land policies show dynamic changes, embodying the evolutionary characteristics of land use policies during urbanization processes. The correlation between this type of land and land use efficiency decreased from 0.458
Unused land remediation policies continue to show effectiveness, reflecting institutional innovation in land resource integration and optimal allocation. In 2020, it maintained significant positive correlations with all land use efficiency indicators, with correlation coefficients of −0.723, −0.710, −0.645, and −0.679 respectively (all
The hierarchy of policy effects that can be intuitively observed from the heat map (Figure 7) profoundly reflects the ecological function differences of different land types and spatial variation in policy intervention intensity. Grassland and unused land policies show the most significant effects (deep blue regions), benefiting from the relatively concentrated spatial distribution and clear policy intervention objectives of these two land types, ensuring coordination and execution effectiveness of policy implementation; the impacts of cultivated land and construction land policies are relatively moderate (light red regions), reflecting that these two land types are regulated by multiple-objective policies, with certain tensions between economic development and environmental protection goals; the effects of forestland and water body policies are not sufficiently evident (near-white regions), embodying that the ecological service functions of these two land types have not been fully transformed into economic value, with incentive mechanisms in policy design still needing strengthening. This multi-level policy effect reveals the importance of matching land use policies with regional characteristics, providing a scientific basis for formulating more targeted and coordinated land policy systems, while also establishing an evidence-based analytical framework for evaluating policy implementation effects.
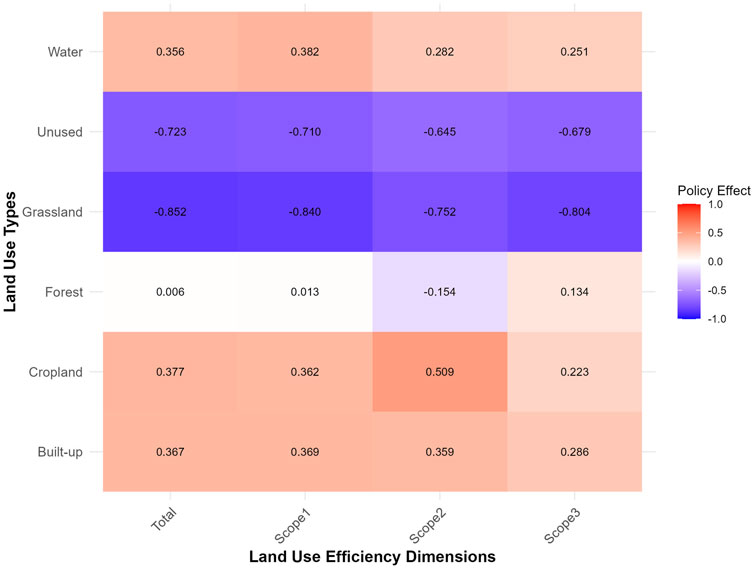
Figure 7. Correlation analysis between land use types and land use efficiency (2020).
3.3.2 Spatial coupling of policy implementation
The implementation effects of land use policies are reflected in the spatial coupling relationship between land use patterns and their efficiency. Research results show that the study area exhibits complex spatial coupling characteristics between land use and efficiency levels. Results from the BiLISA (Bivariate Local Indicators of Spatial Association) analysis method (Equation 10) show (Figures 8a,b) that the implementation effects of construction land policies underwent significant changes during 2010–2020. In 2010, Hegang City showed high-high clustering, indicating that intensive construction land development led to decreased land use efficiency; while Yichun City exhibited low-high outlier characteristics, reflecting that its land-saving utilization policies failed to effectively improve land use efficiency. By 2020, only Shuangyashan City maintained high-high clustering characteristics, indicating the gradual emergence of land use policy effects in improving land use efficiency.
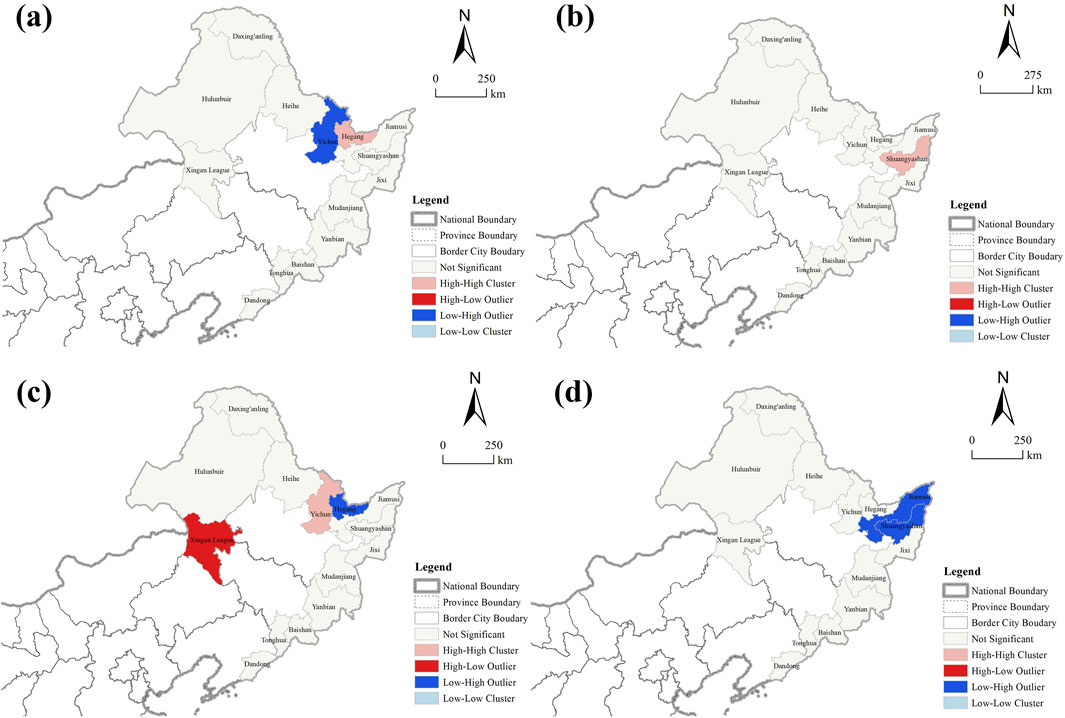
Figure 8. Spatial coupling analysis of policy implementation in border regions (2010–2020): (a) Built-up land policy effects in 2010; (b) built-up land policy effects in 2020; (c) ecological land policy effects in 2010; (d) ecological land policy effects in 2020.
The implementation effects of ecological land policies show spatial differentiation (Tan et al., 2022) (Figures 8c,d). In 2010, Xing’an League’s ecological protection policy effects were significant, showing high-low outlier characteristics, achieving a positive combination of high ecological land proportion and high land use efficiency; while policy effects in the eastern study area varied, with Yichun City showing high-high clustering and Hegang City showing low-high outlier characteristics. By 2020, Jiamusi and Shuangyashan showed poor ecological land policy effects, both transforming to low-high outliers, indicating that ecological space protection and land use efficiency improvement failed to progress synergistically.
Using the coupling degree measurement method (Equation 11) to further evaluate land use policy implementation effects (Table 5), the analysis results show significant regional differences (Huang et al., 2024). In 2020, border regions in Heilongjiang Province showed strong policy synergy, with Jiamusi City (0.979), Jixi City (0.946), and Shuangyashan City (0.908) all achieving high-level coupling. In contrast, the Daxing’anling region showed weaker policy synergy (coupling degree 0.400), indicating that its land use patterns and efficiency improvement goals have not yet achieved good coordination.
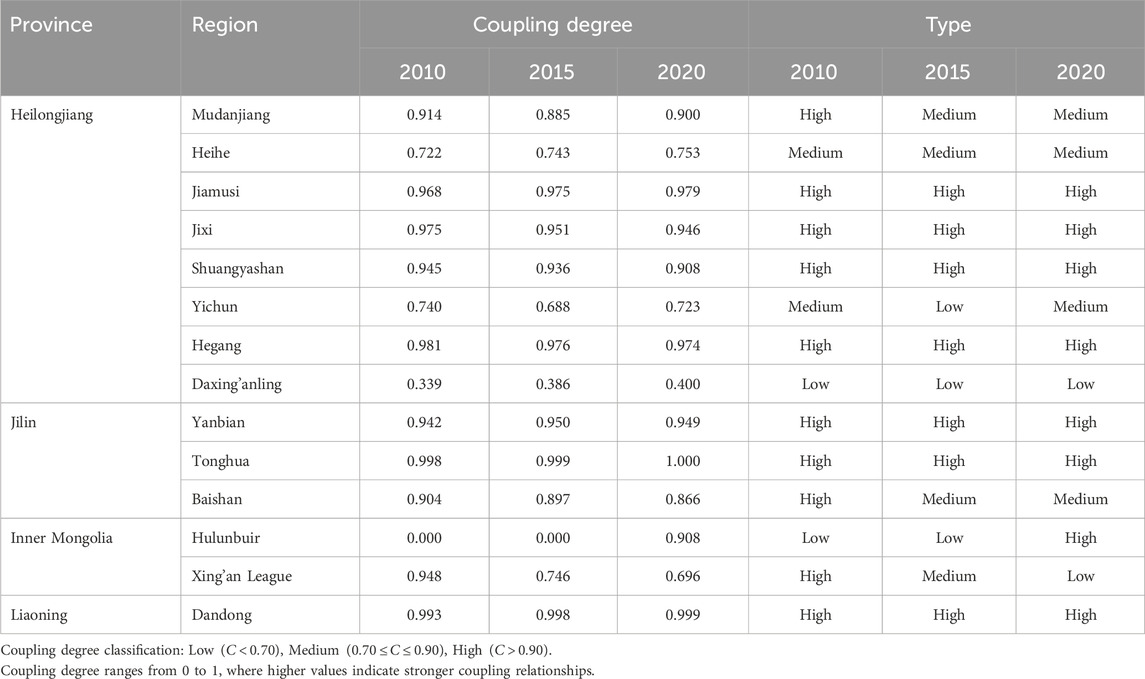
Table 5. Spatial coupling of land use policy implementation effects.
From the temporal evolution of policy implementation, different types of cities show differentiated characteristics. Industrial cities maintain stable policy synergy, with cities like Jixi and Shuangyashan consistently maintaining coupling degrees above 0.9. Port cities show significant improvement in policy effects, particularly Hulunbuir City, whose policy synergy improved from a low level (0.000) in 2010 to a high level (0.908) in 2020. Among ecological cities, Yanbian Prefecture and Tonghua City consistently maintain good policy synergy effects, achieving balance between land use efficiency and ecological protection. The formation and evolution of this spatial coupling pattern reflect both achievements and challenges in the study area’s land use policy implementation process, providing important basis for optimizing the land use policy system and enhancing policy implementation effects.
The formation and evolution of this spatial coupling pattern not only reflects the achievements and challenges in the process of advancing land use policy implementation in the study area but also more deeply embodies the combined effects of regional development stages, governance capabilities, and industrial transformation paths. Behind the high-level coupling in Heilongjiang Province’s border regions (Jiamusi 0.979, Jixi 0.946, Shuangyashan 0.908) are long-term accumulated institutional dividends and policy coordination mechanisms.
During the implementation of the Northeast Revitalization Strategy, these regions have achieved positive interactions between resource allocation and efficiency improvement by establishing coordination mechanisms between industrial and land policies, manifested as coupling degrees continuously maintained at high levels. The stability of policy coordination in industrial cities reflects their high emphasis on land use efficiency during transformation, despite facing dual pressures of resource depletion and industrial transformation, but maintaining relatively high coupling degrees through strengthening the systematization of policy implementation.
Port cities, especially Hulunbuir’s significantly improved policy coordination (from 0.000 to 0.908), embody the institutional innovation effectiveness of border opening and regional collaboration under the “Belt and Road” Initiative; the improvement of cross-border cooperation mechanisms has created new coupling paths for land use policies and efficiency enhancement. The sustained high coupling of ecological cities such as Yanbian Prefecture and Tonghua City indicates that coordination mechanisms for protection and development under the background of ecological civilization construction have formed institutionalized operation modes.
In contrast, the low coupling degree in the Daxing’anling region (0.400) reflects potential conflicts between ecological protection intensity and economic development needs, requiring further optimization of balance mechanisms between ecological compensation and local development in institutional design. The spatial differences in policy coupling degrees reveal that successful land use policy implementation needs to simultaneously consider the matching degree between regional development stages and functional positioning, establishing dynamic policy adjustment mechanisms to achieve coordinated evolution of policy orientation and regional needs, which is of key significance for enhancing overall land use efficiency in border regions.
3.3.3 Policy driving mechanisms
Land use efficiency changes are influenced by multiple policy factors (Liu et al., 2022). LMDI decomposition analysis (Equations 12, 13) shows significant differences in the impact degrees of different driving factors. Based on the LMDI decomposition method, this study evaluates policy effects from eight aspects: economic scale, industrial structure, population scale, technological progress, energy intensity, urbanization, opening-up, and infrastructure. Analysis results show (Table 6) significant differences in policy responses across different regions during two periods (2010–2015 and 2015–2020). Among these factors, economic development policy had the most significant impact during 2010–2015, with land use efficiency in Heihe City (410.68%), Yanbian Prefecture (368.64%), and Tonghua City (316.48%) being greatly affected. During 2015–2020, the regulatory effects of economic policies began to emerge, with land use efficiency improving in Hulunbuir City (−132.74%) and Tonghua City (−586.59%), reflecting effective regulation of economic development patterns by land use policies.
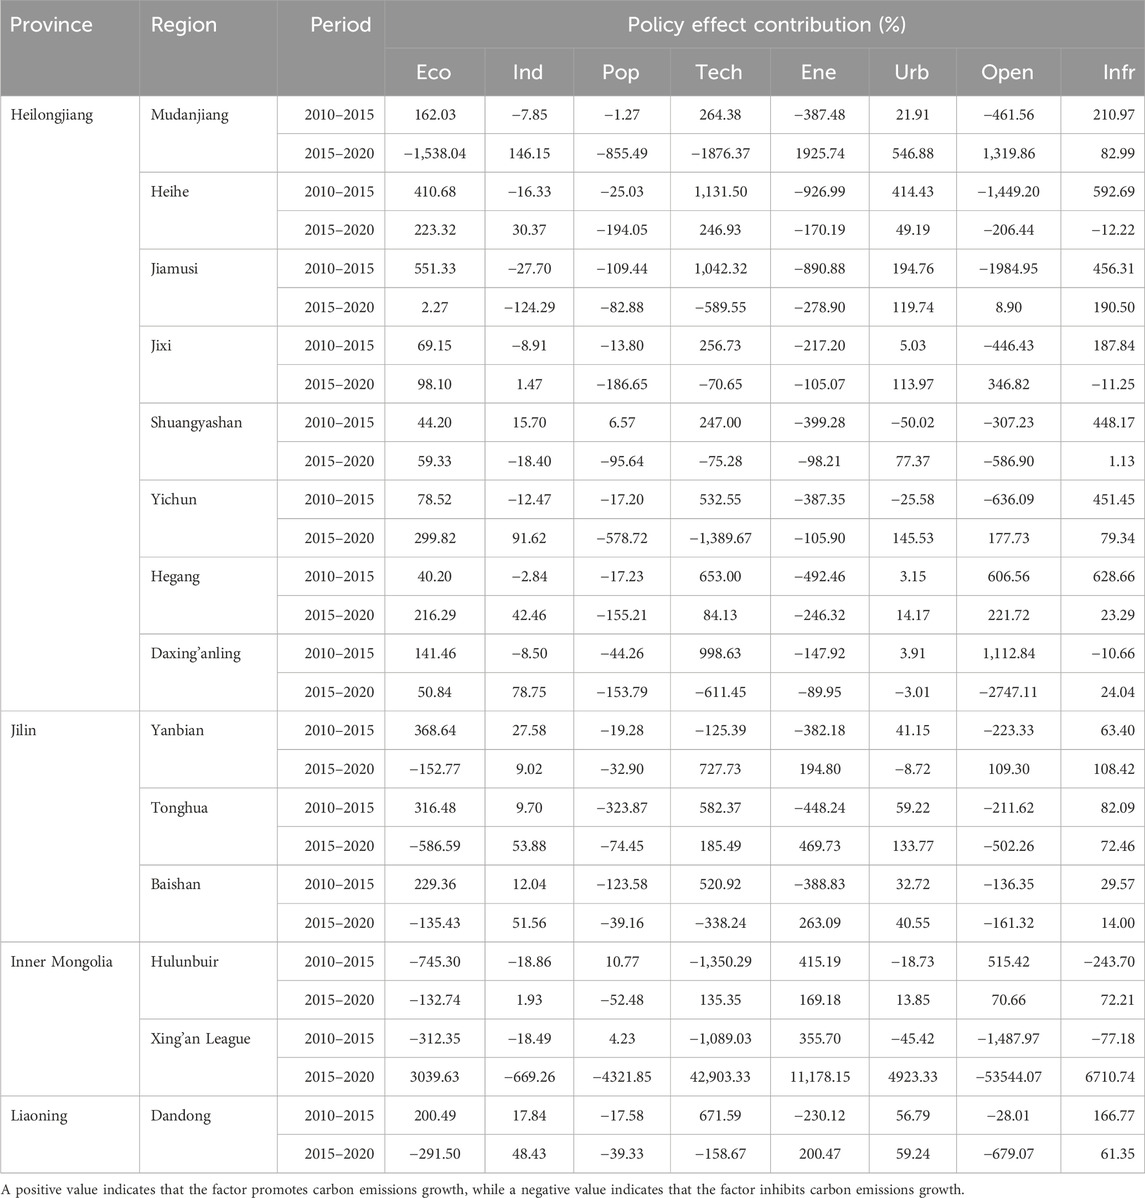
Table 6. Policy effects and driving mechanisms of land green utilization efficiency in border regions (%).
Industrial and energy policies show continuous effects in improving land use efficiency. During 2015–2020, industrial structure adjustment policies achieved positive effects in most regions, such as Xing’an League (−669.26%) and Jiamusi City (−124.29%) showing significant improvements in land use efficiency. Energy utilization policy effects were particularly evident during 2010–2015, with significant improvements in land use efficiency in Heihe City (−926.99%) and Jiamusi City (−890.88%), demonstrating the policy effectiveness of energy structure optimization.
To further reveal the influence mechanisms and action pathways of policy factors on land use efficiency, this study constructed a policy impact network model using regression-based path analysis. As shown in Figure 9, the path analysis results display direct influence relationships between eight policy factors and land green utilization efficiency. The model fits well (

Figure 9. Analysis of the impact pathway of land use policy on green utilization efficiency.
From the perspective of policy impact pathways (Figure 9), energy efficiency policies (−6452.09,
Overall, both LMDI decomposition and path analysis results indicate that energy intensity optimization and industrial structure adjustment constitute the dominant pathways for enhancing land green utilization efficiency. The differential responses of cities in the study area to different policies reflect the important influences of city types, development stages, and resource endowments in the policy implementation process. This complex policy response pattern provides important references for optimizing land use policy systems and improving policy implementation precision.
3.3.4 Analysis of policy synergy effects
The improvement of land use efficiency not only stems from the implementation effects of single policies but more deeply embodies the synergistic effects of multi-level policies and the complex institutional interaction mechanisms behind them. Research results indicate that policy coordination is significantly correlated with the enhancement of land green utilization efficiency in border regions, with its action mechanisms involving multiple dimensions such as policy integration, institutional innovation, and governance coordination. The synergistic complementarity between the “National Land Use General Planning (2006–2020)” and the “Greater and Lesser Xing’an Mountains Forest Region Ecological Protection and Economic Transformation Planning (2010–2020)” typically demonstrates the institutional connection mechanism between national strategies and regional planning: the former constructs a rigid spatial control framework through land use regulation and indicator allocation, forming institutional boundaries for regional development; the latter provides flexible implementation paths through differentiated ecological restoration measures, achieving precise implementation of policy objectives. This institutional innovation model of “rigid control + flexible implementation” provides a governance framework for the overall improvement of land use efficiency in border regions.
Policy synergy effects exhibit significantly differentiated characteristics among cities of different functional types, reflecting the complex interactive relationship between institutional environments and regional characteristics. In ecological cities, policy coordination forms a multi-level protection system centered on ecological values, promoting overall strengthening of ecological functions. The high forestland coverage rate of 96.87% in the Daxing’anling region is not only a result of strict land use control but more an institutional product of the combined effects of ecological compensation mechanisms, environmental governance responsibility systems, and resource monitoring systems. The maintenance of high ecological land proportions in Baishan City (91.34%) and Yichun City (87.80%) benefits from the coordinated advancement of ecological red line control and industrial transformation policies, forming an institutional balance between protection and development. The significant 13.82% reduction in carbon emission intensity in these regions during 2010–2020 not only verifies the synergistic effect of ecological protection policies but also embodies the institutionalization process of the development concept that “lucid waters and lush mountains are invaluable assets.”
Port cities demonstrate typical pathways of policy coordination promoting spatial optimization and functional enhancement. The low carbon emission intensity of this type of city (average 1.54 tons
Although industrial cities face greater transformation pressure, policy coordination has explored differentiated development paths for them. The relatively low land use efficiency of this type of city (8.14–12.48 tons
The differentiated performance of policy synergy effects in the study area reveals the deep institutional logic of land use governance. The significant positive correlation between policy coordination degree and land use efficiency indicates that effective land governance requires the construction of multi-level, cross-departmental coordination mechanisms to achieve precise matching of policy objectives, implementation tools, and regional characteristics. This coordination mechanism not only needs complementarity in policy design but also coordination in the execution process and consistency in evaluation feedback, forming an institutional framework of “unified objectives, clear division of labor, and shared responsibilities.” The practice of improving land use efficiency in border regions enlightens us that successful regional governance models should fully consider differences in regional functional positioning and development stages, constructing flexible and differentiated policy systems under the national strategic framework, stimulating endogenous dynamics of regional development through institutional innovation, and achieving long-term goals of green high-quality development.
4 Discussion
4.1 Analysis of spatial heterogeneity in land use efficiency
Our findings reveal significant spatial heterogeneity in border region land use efficiency. This heterogeneity manifests at three levels: differences between city types, regional gradient distribution patterns, and spatial clustering characteristics. First, different types of cities show significant efficiency differences. Industrial cities demonstrate relatively low land use efficiency, with carbon emission intensity reaching 8.14–12.48 tons
Second, land use efficiency shows evident regional gradient characteristics. The study area overall shows a “high west-low east” spatial pattern. Western regions, represented by Hulunbuir (9.424 million tons) and Xing’an League (9.456 million tons), demonstrate higher land use efficiency; while eastern regions form a low-efficiency cluster centered on Jixi (46.600 million tons) and Shuangyashan (46.640 million tons). This gradient distribution is closely related to regional industrial layout and development paths: western regions have formed a “forest-grassland composite” high-efficiency utilization model leveraging ecological resource advantages; eastern regions show relatively lower land use efficiency influenced by traditional industrial layout.
Third, spatial clustering effects are significant. Spatial autocorrelation analysis shows that eastern Heilongjiang Province has formed a significant low-efficiency cluster (H-H), with Jixi City
Several mechanisms contribute to this spatial heterogeneity: the industrial inertia of traditional manufacturing bases, the locational advantages of port cities, variations in ecological resource endowments, and different orientations of regional development strategies (Li et al., 2020). The industrial inertia of traditional industrial bases leads to slow improvement in land use efficiency, reflecting the profound influence of historical development paths; port cities achieve efficient land use leveraging opening-up advantages, demonstrating the importance of locational condition differences; regions rich in ecological resources more easily form efficient land use patterns, indicating the key role of resource endowments in spatial heterogeneity formation; differentiated orientation of regional development strategies further strengthens this spatial heterogeneity.
These findings have important implications for optimizing regional land use policies. Research shows that policy formulation needs to fully recognize spatial heterogeneity characteristics, avoiding “one-size-fits-all” policy implementation models. For low-efficiency clusters, special policy interventions should be adopted to improve land use efficiency. Meanwhile, the demonstration effects of high-efficiency regions should be fully leveraged to promote regional coordinated development through experience promotion and policy synergy. Based on this, when formulating land use optimization strategies, spatial heterogeneity characteristics should be fully considered to implement differentiated policy measures.
4.2 Analysis of land use policy improvement effects
Research results show that land use policies oriented towards industrial transformation and ecological protection significantly improved land use efficiency (Ge and Liu, 2021). Through driving force analysis, energy intensity (−6452.09,
Ecological cities in the study area achieved steady improvement in land use efficiency through strict land use control and ecological space protection, with carbon emission intensity decreasing by 13.82% during 2010–2020. Energy efficiency policies also showed significant effects, with land use efficiency significantly improving in Heihe City (−926.99%) and Jiamusi City (−890.88%) during 2010–2015. In contrast, urbanization policy (58.91,
These findings have three important implications for improving land use policies:
First, implement differentiated policies, formulating personalized land use strategies for different types of cities, particularly addressing the efficiency gap between industrial cities (8.14–12.48 tons
Second, adhere to ecological protection priority, drawing on implementation experiences from the “Greater and Lesser Xing’an Mountains Forest Area Ecological Protection and Economic Transformation Planning (2010–2020),” maintaining high forest coverage rates through strict land use control and ecological compensation mechanisms.
Finally, promote intensive and efficient utilization, adopting differentiated measures for different types of cities, particularly focusing on green transformation of traditional industries in industrial cities to improve output efficiency per unit of land.
4.3 Policy response differences among different types of cities
Different types of cities in the study area show significant differences in their responses to land use policies, reflecting the correlation characteristics between urban functional positioning and policy implementation effects (Qu et al., 2020). These differentiated responses provide important basis for formulating precise land use policies.
Industrial cities (Jixi, Shuangyashan, Hegang) demonstrate evident policy transformation pressure. These cities show relatively low land use efficiency, with carbon emission intensity maintaining high levels of 8.14–12.48 tons
Port cities (Heihe, Mudanjiang, Dandong, Hulunbuir) show stronger policy adaptability. These cities average carbon emission intensity of 1.54 tons
Ecological cities (Daxing’anling, Yichun, etc.) emphasize protection-oriented policy responses. While maintaining ecological functions, these cities achieved steady improvement in land use efficiency. Through strict implementation of ecological protection policies, these cities generally maintained forest coverage above 80%, and achieved synergy between ecological protection and efficiency improvement through developing eco-friendly industries. Innovative ecological compensation mechanisms effectively balanced protection and development relationships, enabling these cities to achieve the most significant improvement in land use efficiency, with carbon emission intensity decreasing by 13.82% during 2010–2020.
These differentiated policy responses have important implications for optimizing regional land use policies. First, differentiated land policy systems need to be established based on city types: industrial cities should accelerate technological upgrading and promote green transformation of traditional industries; port cities can further leverage service industry advantages to explore high-efficiency, low-carbon development models; ecological cities need to strengthen institutional guarantees for ecological protection and innovate green development paths. Second, policy synergy should be emphasized, promoting complementary advantages and linked development between different types of cities. Finally, dynamic assessment mechanisms should be established to timely adjust policy implementation directions and continuously improve policy execution efficiency. Future policy optimization should focus on policy specificity and synergy, flexibly adjusting policy tool combinations according to city characteristics while strengthening policy coordination between cities to construct new patterns of regional coordinated development. This will not only help improve individual cities’ land use efficiency but also promote overall sustainable development in border regions.
4.4 Theoretical implications
Based on empirical analysis of China’s northeastern border region, this study develops a theoretical framework of ‘border location-functional differentiation-efficiency coupling’, systematically explaining the formation mechanisms of land use efficiency in border regions (He et al., 2024). The innovation of this theoretical framework is reflected in three aspects:
First, the research breaks through the limitations of traditional land use theory that views border regions as homogeneous entities, constructing a differentiated analysis framework based on location characteristics and functional positioning. Empirical research finds that border regions’ land use efficiency is closely related to their development stages and locational conditions. This finding enriches the theoretical connotation of border region land use efficiency, providing new perspectives for understanding regional differences.
Second, the study constructs a multi-dimensional theoretical model of ‘policy tools-city types-efficiency performance’. This model breaks through traditional single policy evaluation models, systematically revealing differentiated response mechanisms of different types of cities to land policies. Research shows that industrial cities have relatively low land use efficiency due to existing production capacity constraints; port cities achieve efficiency improvements through regional cooperation; ecological cities form a ‘protection priority-efficiency synergy’ development model. This theoretical model provides a new analytical framework for understanding policy effects.
Third, the study developed a “multi-center-networked” regional land use efficiency theory. By introducing dimensions of spatial heterogeneity and functional complementarity, the research found that border regions have formed a networked development pattern with port cities as nodes and industrial chains as links. In the policy transmission process, the study identified a “demonstration effect-diffusion mechanism-collaborative improvement” spatial coupling path: low-efficiency areas become policy implementation focus areas through industrial linkages; high-efficiency areas promote overall regional efficiency improvement through demonstration effects; and different types of cities form functional complementary mechanisms in policy responses.
These theoretical innovations have important implications for land use research: they construct a comprehensive theoretical framework for studying land use efficiency in border regions; develop a policy effect evaluation theory based on city types; and enrich regional collaborative development theory. Future research could deepen theoretical innovation in the following directions: exploring long-term evolutionary mechanisms of land use efficiency in border regions; studying cross-border regional policy coordination mechanisms; and analyzing adaptation mechanisms of land use efficiency in border regions under climate change.
4.5 Policy implications
Spatial heterogeneity characteristics require the formulation of differentiated policy systems. Research shows that land use efficiency varies significantly among different types of cities, with industrial cities’ carbon emission intensity (8.14–12.48 tons/10,000 yuan) significantly higher than that of port cities (average 1.54 tons/10,000 yuan), consistent with international experience. Fekete and Priesmeier (2021), in their study of the US-Mexico border region, found that coordination between cross-border resource management and environmental risk prevention is crucial. Therefore, traditional “one-size-fits-all” policies can hardly adapt to regional development needs, and precise land policies should be formulated based on urban functional positioning. For industrial cities, research results indicate that this type of city has the highest carbon emission intensity and the smallest improvement margin, so targeted technological innovation incentive measures should be implemented, such as: establishing special technological transformation funds, providing over 50% financial support for energy efficiency improvement projects; establishing a differentiated emission rights trading system, setting stricter emission reduction targets for high-carbon intensity industries; developing tax incentive policies for high-energy-consuming enterprises, such as reducing corporate income tax by 30% for enterprises achieving energy consumption reductions of more than 15%.
Industrial transformation and energy structure optimization are key pathways for enhancing land use efficiency. Empirical analysis shows that energy intensity (−6452.09,
Establishing regional coordinated development mechanisms is crucial. Research finds that land use efficiency exhibits significant spatial clustering characteristics, with the eastern region forming a low-efficiency clustering area centered on Jixi (46.600 million tons) and Shuangyashan (46.640 million tons). Wang and Xiao (2023), in their study of the Laotian border, found that the degree of cross-border cooperation affects land use efficiency. Turner and Pham (2015), in their study of the northern Vietnamese border, verified the importance of regional development platforms. This spatial pattern indicates the need to establish cross-regional policy coordination mechanisms, leveraging the demonstration and driving role of high-efficiency regions. For ecological cities, we recommend developing economic activities consistent with ecological positioning on the basis of ecological protection: developing ecological value transformation mechanisms, such as establishing carbon sink trading platforms to convert ecological protection into economic benefits; designing ecological tourism franchise auction systems to balance development and protection; formulating quantitative ecological service industry development targets, such as increasing the proportion of service industries to 60% by 2030.
Policy support for green development needs further strengthening. Empirical research shows that coordination between environmental policies and economic policies is crucial for enhancing land use efficiency. Angelstam et al. (2020) study of Finnish-Russian border experiences indicates that differences in environmental policies can lead to significant efficiency differences. This requires improving green finance policies to support enterprise technological transformation; innovating land management systems to enhance resource allocation efficiency; improving environmental regulatory systems to strictly implement ecological red lines. Finally, strengthening international cooperation and experience exchange is of great significance. Bazarov et al. (2021) comparative study of China-Russia border regions found significant differences in land use methods between the two countries, providing important references for policy optimization. The above recommendations are based on empirical data analysis of different types of cities, proposing differentiated measures targeting their respective characteristics, rather than simply favoring one type of city. Implementation of these policies needs to consider local specific conditions and establish dynamic evaluation mechanisms, adjusting policy tool combinations in a timely manner to achieve continuous improvement in land use efficiency in border regions.
4.6 Research limitations and future directions
4.6.1 Methodological and data limitations
The current research faces several methodological limitations worth considering. First, although the study establishes significant correlation between policy implementation and land use efficiency, causal inference remains challenging. Regression-based path analysis, while helpful in revealing relationships, relies on several key assumptions that may not be fully satisfied in complex socioeconomic systems. Path analysis assumes linear relationships between variables, but in reality, there may be non-linear relationships or threshold effects between policies and land use efficiency, for example, certain policy measures may need to reach specific intensities before effects become apparent. The model also assumes that causal flow is unidirectional (from policy to efficiency), while ignoring possible reverse causality (high-efficiency regions may more easily implement certain policies) or circular causal relationships. Additionally, although we attempt to include various policy factors, the possibility of omitted variable bias cannot be completely ruled out—certain unmeasured factors may simultaneously affect policy implementation and efficiency performance, leading to biased estimation results.
Path analysis also assumes that error terms are independent of each other, but in regional economic research, error terms from different equations may be correlated, especially when multiple factors are affected by common external shocks. At the same time, the model assumes that observations between different cities are mutually independent, while spatial dependencies may exist among border region cities, which is why we combine the use of spatial analysis methods. Nevertheless, spatial analysis methods themselves also face limitations, especially Moran’s I and BiLISA, which, while effective in identifying spatial clustering patterns, are sensitive to outliers and boundary definitions, and assume stability of spatial relationships, which may not hold true in the diverse geographical environments of the study area. Finally, the specific specification of the path model (assumed causal chains between variables) has a certain subjectivity, and different model specifications may lead to different estimation results. We constructed the current model based on theoretical frameworks but cannot exclude other possible causal pathways. Future research could adopt geographically weighted regression or spatial panel models to more comprehensively capture spatial heterogeneity.
The LMDI decomposition method, though powerful in identifying driving factors, assumes that various factors are independent of each other, while in reality, these factors may be interrelated in complex ways. For example, technological progress and industrial structure optimization often occur simultaneously and influence each other, making their independent effects difficult to determine. This method also struggles to capture dynamic feedback mechanisms between variables, such as how decreases in energy intensity might, in turn, affect industrial structure; these complex interactions are difficult to fully present in a static decomposition framework.
The carbon emission data used in this study has inherent uncertainties. Although calculations follow IPCC guidelines and national emission factors, carbon accounting at the city level in border regions faces unique challenges. Cross-border economic activities may lead to carbon leakage issues, with emissions belonging to local production potentially partially transferred to the other side of the border. Moreover, the availability and quality of activity data from different regions and sectors vary, potentially affecting the comparability of efficiency assessments. While the land use classification method is based on the CLCD dataset with 80% accuracy, it inevitably includes classification errors. Reclassifying the original nine land cover types into six types may lead to information loss, especially in complex landscape transition zones such as urban-rural interfaces. Additionally, the 30-m spatial resolution may not fully capture fine land use changes in urban areas, potentially affecting the accuracy of construction land assessment in rapidly developing port cities.
4.6.2 Research design limitations
This study focuses on 14 border cities in northeastern China, which, while providing a comprehensive perspective for this specific region, limits the generalizability of research findings to other border regions of China. The southwestern border (adjacent to Vietnam, Laos, and Myanmar) or northwestern border (adjacent to Central Asian countries) regions of China operate under different geographical, climatic, and socioeconomic conditions, potentially leading to different policy response patterns. The 2010–2020 study period, while capturing important policy implementation phases, may be insufficient to fully observe the long-term effects of ecological protection policies, which typically take decades to fully manifest. Moreover, this period coincides with specific macroeconomic conditions and national policy priorities, which may not persist in the future, potentially affecting the temporal stability of identified relationships.
An important limitation of this study is the assumption of relatively uniform policy implementation within similar city types. In reality, the intensity and effectiveness of policy implementation may vary significantly due to differences in local governance capabilities, fiscal resources, and socioeconomic conditions. For example, ecological protection policies may be implemented with varying degrees of stringency in different ecological cities, leading to changes in efficiency responses not captured in the type analysis. Significant seasonal variations in the Northeast region represent another limitation. winter heating demands significantly increase energy consumption and carbon emissions, while summer growing seasons enhance carbon absorption. These seasonal effects are not decomposed in the current annual analysis, potentially affecting land use efficiency assessment, especially when comparing regions with different seasonal patterns.
4.6.3 Application generalization and future prospects
Applying the results of this study to other regions requires careful consideration of contextual factors. The research findings may be most applicable to border regions with similar development stages, industrial structures, and geographical characteristics to northeastern China. For example, findings regarding industrial city transformation challenges may apply to resource-based border regions facing similar industrial transformation pressures in the Russian Far East, parts of Eastern Europe, or Central Asia. The policy effects identified by the research, particularly the significant impacts of energy intensity (−6452.09,
Based on these limitations, future research could develop in several promising directions: First, future research could further expand from path analysis to adopting complete structural equation models (SEM), quasi-experimental designs, or synthetic control methods to strengthen causal inference in policy effect assessment. These methods help isolate policy impacts from other confounding factors, providing more robust evidence for policy effectiveness. Second, developing multi-dimensional evaluation systems incorporating additional environmental indicators beyond carbon emissions, such as water pollution, soil degradation, and biodiversity loss, would provide more comprehensive assessments of land green utilization efficiency. Third, extending the time series range would better capture the cumulative effects of ecological protection policies and reveal potential non-linear relationships between policy implementation and efficiency improvement. Fourth, strengthening cross-border comparative analysis, especially comparisons between Chinese border cities and corresponding cities in neighboring countries, would provide valuable insights into how different governance systems affect land use efficiency in geographically connected regions. Finally, incorporating climate change adaptation into the analytical framework would enhance understanding of how land use efficiency in border regions responds to increasing climate change, which is particularly important for cold-region borders that may experience significant climate-related changes. These future research directions would not only address the limitations of the current study but also provide a more comprehensive understanding of how land use policies in diverse border regions globally can effectively promote sustainable development.
5 Conclusion
This study systematically analyzes land use policy implementation effects and land green utilization efficiency in northeastern China’s border regions. Our main findings include: Land use patterns show significant spatial heterogeneity. Industrial cities demonstrate lower land green utilization efficiency (8.14–12.48 tons
This study achieved innovative results in theoretical, methodological, and practical aspects. At the theoretical level, it proposed an innovative framework of ‘border location-functional differentiation-efficiency coupling’, developed a policy effect theory based on city types, and constructed a multi-center networked regional development theory. At the methodological level, it innovatively constructed a multi-level efficiency assessment system, developed policy effect assessment methods based on city types, and proposed spatial coupling degree measurement methods for policy coordination. At the practical level, it systematically revealed the type difference characteristics of land use efficiency in border regions, identified different policy response patterns across city types, and provided scientific basis for formulating differentiated land use policies.
Future research should focus on the following directions: First, in the context of digital transformation, exploring the influence mechanisms of smart city construction on land use efficiency in border regions, especially how digital technologies improve green utilization efficiency through optimizing land resource allocation and management models; Second, in response to challenges brought by climate change, studying adaptive strategies for land use in border regions, particularly focusing on differentiated impacts of extreme weather events on land use efficiency across different types of cities; Third, strengthening research on long-term effect assessment of land use policies, optimization of policy synergy, and cross-border regional policy coordination mechanisms. These research directions will not only deepen theoretical understanding of land green utilization efficiency in border regions but also provide scientific basis for sustainable land development under the challenges of digital transformation and climate change.
Data availability statement
Publicly available datasets were analyzed in this study. This data can be found here: The data analyzed in this study are primarily from publicly available repositories: For land use data, the China Land Cover Dataset (CLCD) is accessible through the Earth Big Data Science Engineering Data Sharing Platform of the Chinese Academy of Sciences, which requires login via China Science and Technology Cloud Pass system (http://data.casearth.cn). For carbon emission and socioeconomic data, we used publicly available statistical yearbooks including China Energy Statistical Yearbook, China Industry Statistical Yearbook (both available from the National Bureau of Statistics), and Provincial Statistical Yearbooks (Heilongjiang, Jilin, Liaoning, Inner Mongolia) accessible through provincial statistical bureaus’ websites. The processed datasets and analysis results generated during this study are available from the corresponding author upon reasonable request.
Ethics statement
Ethical approval was not required for the study involving humans in accordance with the local legislation and institutional requirements. Written informed consent to participate in this study was not required from the participants or the participants’ legal guardians/next of kin in accordance with the national legislation and the institutional requirements.
Author contributions
XF: Conceptualization, Data curation, Formal Analysis, Investigation, Methodology, Visualization, Writing – original draft. LZ: Funding acquisition, Project administration, Supervision, Validation, Writing – review and editing.
Funding
The author(s) declare that financial support was received for the research and/or publication of this article. This research was supported by the Doctoral Research Fund of Mudanjiang Normal University (Grant Nos MNUB202406 and MNUB202407).
Conflict of interest
The authors declare that the research was conducted in the absence of any commercial or financial relationships that could be construed as a potential conflict of interest.
Generative AI statement
The author(s) declare that no Generative AI was used in the creation of this manuscript.
Publisher’s note
All claims expressed in this article are solely those of the authors and do not necessarily represent those of their affiliated organizations, or those of the publisher, the editors and the reviewers. Any product that may be evaluated in this article, or claim that may be made by its manufacturer, is not guaranteed or endorsed by the publisher.
Supplementary material
The Supplementary Material for this article can be found online at: https://www.frontiersin.org/articles/10.3389/fenvs.2025.1582896/full#supplementary-material
References
Angelstam, P., Manton, M., Yamelynets, T., Sørensen, O., and Kondrateva, S. (2020). Landscape approach towards integrated conservation and use of primeval forests: the transboundary Kovda river catchment in Russia and Finland. Land 9, 144. doi:10.3390/land9050144
Bazarov, K. Y., Egidarev, E., and Mishina, N. (2021). Land use analysis of lake Khanka basin using remote sensing data. IOP Conf. Ser. Earth Environ. 895, 012007. doi:10.1088/1755-1315/895/1/012007
Benny, G., and Steffen, O. (2013). Borders as boundaries to fiscal policy interactions? an empirical analysis of politicians’ opinions on rivals in the competition for firms. J. Regional Sci. 53, 583–606. doi:10.1111/jors.12029
Brantly, C., and Tong, L. (2023). Policy evaluation during a pandemic. J. Econ. 236, 105454. doi:10.1016/j.jeconom.2023.03.009
Chang, J.-H., Wang, W., and Liu, J. (2023). Industrial upgrading and its influence on green land use efficiency. Sci. Rep. 13, 2813. doi:10.1038/s41598-023-29928-8
Chen, T., Dolman, H., Sun, Z., Zeng, N., Gao, H., Miao, L., et al. (2022). Land management explains the contrasting greening pattern across China-russia border based on paired land use experiment approach. J. Geophys. Res. Biogeosciences 127, e2021JG006659. doi:10.1029/2021JG006659
Chen, Y., Chang, J., Li, Z., Ming, L., Li, C., and Li, C. (2023). Coupling coordination and spatiotemporal analysis of urban compactness and land-use efficiency in resource-based areas: a case study of Shanxi province, China. Land 12, 1658. doi:10.3390/land12091658
Cheng, L., Brown, G., Liu, Y., and Searle, G. (2020). An evaluation of contemporary China’s land use policy – the link policy: a case study from ezhou, hubei province. Land Use Policy 91, 104423. doi:10.1016/j.landusepol.2019.104423
Daniel, P., Dominik, K., Krzysztof, O., and Jaroslav, B. (2023). Changes in spatial discontinuity in settlement patterns in the Czech-polish border area: a case study of těšín silesia. Pap. Regional Sci. 102, 565–588. doi:10.1111/pirs.12732
David, A. L., and Ralph, A. (2014). A spatial econometric analysis of land-use change with land cover trends data: an application to the Pacific Northwest. doi:10.2737/pnw-rp-600
Dong, S., Li, Y., Li, Y., and Li, S. (2021). Spatiotemporal patterns and drivers of land use and land cover change in the China-mongolia-Russia economic corridor. Pol. J. Environ. Stud. 30, 2527–2541. doi:10.15244/pjoes/127419
Fekete, A., and Priesmeier, P. (2021). Cross-border urban change detection and growth assessment for Mexican-USA twin cities. Remote Sens. 13, 4422. doi:10.3390/rs13214422
Ge, X. J., and Liu, X. (2021). Urban land use efficiency under resource-based economic transformation—a case study of Shanxi province. Land 10, 850. doi:10.3390/land10080850
Grau, A., Odening, M., and Ritter, M. (2018). Land price diffusion across borders: the case of Germany (03/2018) doi:10.18452/19263
Guo, X., Zhang, Y., Guo, D., Lu, W., and Xu, H. (2023). How does ecological protection redline policy affect regional land use and ecosystem services? Environ. Impact Assess. Rev. 100, 107062. doi:10.1016/j.eiar.2023.107062
Han, W., Zhang, Y., Cai, J., and Ma, E. (2019). Does urban industrial agglomeration lead to the improvement of land use efficiency in China? an empirical study from a spatial perspective. Sustainability 11, 986. doi:10.3390/su11040986
He, S., Yu, S., Li, G., and Zhang, J. (2020). Exploring the influence of urban form on land-use efficiency from a spatiotemporal heterogeneity perspective: evidence from 336 Chinese cities. Land Use Policy 95, 104576. doi:10.1016/j.landusepol.2020.104576
He, W., Gong, J., and Zeng, X. (2024). Research progress on land use and analysis of green transformation in China since the new century. Agronomy 14, 2774. doi:10.3390/agronomy14122774
Huang, J., Han, W., Zhang, Z., Ning, S., and Zhang, X. (2024). The decoupling relationship between land use efficiency and carbon emissions in China: an analysis using the socio-ecological systems (ses) framework. Land Use Policy 138, 107055. doi:10.1016/j.landusepol.2024.107055
Inmaculada, A. A., Osvaldo, U. B.-T., and Laura, E. d. M.-B. (2017). Interstate and transborder spillover effects in the road network: a case study for méxico. Front. Norte 23, 61–90. doi:10.17428/rfn.v23i46.824
Ji, X., Wang, K., Ji, T., Zhang, Y., and Wang, K. (2020). Coupling analysis of urban land use benefits: a case study of Xiamen city. Land 9, 155. doi:10.3390/land9050155
Juknelienė, D., Kazanavičiūtė, V., Valčiukienė, J., Atkocevičienė, V., and Mozgeris, G. (2021). Spatiotemporal patterns of land-use changes in Lithuania. Land 10, 619. doi:10.3390/land10060619
Laurent, G., and Thierry, M. (2016). Regional policy evaluation: interactive fixed effects and synthetic controls. Rev. Econ. Statistics 98, 535–551. doi:10.1162/REST_a_00537
Li, D., Yang, L., Lin, J., and Wu, J. (2020). How industrial landscape affects the regional industrial economy: a spatial heterogeneity framework. Habitat Int. 100, 102187. doi:10.1016/j.habitatint.2020.102187
Li, H., Liu, Y., Li, Y., Li, X., Yan, S., and Zheng, X. (2024a). How to realize synergistic emission reduction in future urban agglomerations: spatial planning approaches to reducing carbon emissions from land use: a case study of the Beijing–Tianjin–Hebei region. Land 13, 554. doi:10.3390/land13040554
Li, Y., Chen, H., Yu, P., and Yang, L. (2024b). The application and evaluation of the lmdi method in building carbon emissions analysis: a comprehensive review. Buildings 14, 2820. doi:10.3390/buildings14092820
Liu, J., Jin, X., Li, H., Zhang, X., Xu, W., Fan, Y., et al. (2022). Spatial-temporal changes and driving factors of the coordinated relationship among multiple land use efficiencies integrating stakeholders’ vision in eastern China. J. Clean. Prod. 336, 130406. doi:10.1016/j.jclepro.2022.130406
Ma, Y., Zheng, M., Zheng, X., Huang, Y., Xu, F., Wang, X., et al. (2023). Land use efficiency assessment under sustainable development goals: a systematic review. Land 12, 894. doi:10.3390/land12040894
Marcelo, C., Raoni, R., Marcelo, S., Andrea, A. A., and Juliano, C. (2018). Epidemiologically inspired approaches to land-use policy evaluation: the influence of the rural environmental registry (CAR) on deforestation in the brazilian amazon. Elem. Sci. Anthropocene 6, 1. doi:10.1525/elementa.260
Mendoza-Ponce, A. V., Corona-Núñez, R., Nava, L. F., Estrada, F., Calderón-Bustamante, Ó., Martínez-Meyer, E., et al. (2021). Impacts of land management and climate change in a developing and socioenvironmental challenging transboundary region. J. Environ. Manage. 300, 113748. doi:10.1016/j.jenvman.2021.113748
Mesbah, J. M., Raymond, J. G. M. F., and William Alan, M. (2012). Borders and barriers: spatial analysis of agricultural output spillovers at the grid cell level, 26. doi:10.22004/ag.econ.124790
Mühlbach, N. (2019). Tree-based methods: consequences of moving the US embassy. Soc. Sci. Res. Netw. doi:10.2139/ssrn.3316049
Qian, Q., and Luo, S. (2024). The dilemma of land green use efficiency in resource-based cities: a perspective based on digital transformation. Front. Environ. Sci. 12. doi:10.3389/fenvs.2024.1339928
Qu, C., Li, W., Xu, J., and Shi, S. (2023). Blackland conservation and utilization, carbon storage and ecological risk in green space: a case study from Heilongjiang province in China. Int. J. Environ. Res. Public Health 20, 3154. doi:10.3390/ijerph20043154
Qu, S., Hu, S., Li, W., Wang, H., Zhang, C., and Li, Q. (2020). Interaction between urban land expansion and land use policy: an analysis using the dpsir framework. Land Use Policy 99, 104856. doi:10.1016/j.landusepol.2020.104856
Seemuangngam, A., and Lin, H.-L. (2024). The impact of urbanization on urban flood risk of nakhon ratchasima, Thailand. Appl. Geogr. 162, 103152. doi:10.1016/j.apgeog.2023.103152
Sills, E. O., Herrera, D., Kirkpatrick, A. J., Brandão, A., Dickson, R., Hall, S., et al. (2015). Estimating the impacts of local policy innovation: the synthetic control method applied to tropical deforestation. PLOS ONE 10, 01325900–e132615. doi:10.1371/journal.pone.0132590
Sipos, T., Szabó, Z., and Török, Á. (2021). Spatial econometric cross-border traffic analysis for passenger cars – Hungarian experience. Promet 33, 233–246. doi:10.7307/PTT.V33I2.3641
Song, Y., Yeung, G., Zhu, D., Xu, Y., and Zhang, L. (2022). Efficiency of urban land use in China’s resource-based cities, 2000–2018. Land Use Policy 113, 106009. doi:10.1016/j.landusepol.2022.106009
Sui, L., Yan, Z., Li, K., Wang, C., Shi, Y., and Du, Y. (2024). Prediction of ecological security network in northeast China based on landscape ecological risk. Ecol. Indic. 160, 111783. doi:10.1016/j.ecolind.2024.111783
Tan, R., Liu, P., Zhou, K., and He, Q. (2022). Evaluating the effectiveness of development-limiting boundary control policy: spatial difference-in-difference analysis. Land Use Policy 120, 106229. doi:10.1016/j.landusepol.2022.106229
Turner, S., and Pham, T.-T.-H. (2015). Nothing is like it was before: the dynamics between land-use and land-cover, and livelihood strategies in the northern Vietnam borderlands. Land 4, 1030–1059. doi:10.3390/land4041030
Wang, X., Meng, X., Wang, C., Ling, Y., Zhang, Y., and Ying, L. (2024). Identification of inefficient spaces in resource-depleted cities: a case study of Hegang city [in Chinese]. Resour. Sci. 46, 1119–1130. doi:10.18402/resci.2024.06.06
Wang, Y., and Xiao, C. (2023). Spatiotemporal characteristics and the national variations of borderland use change in Laos within the geopolinomical context. Front. For. Glob. Change 6, 1223605. doi:10.3389/ffgc.2023.1223605
Wei, W., Zhang, P., Yao, M., Xue, M., Miao, J., Liu, B., et al. (2020). Multi-scope electricity-related carbon emissions accounting: a case study of shanghai. J. Clean. Prod. 252, 119789. doi:10.1016/j.jclepro.2019.119789
Wenjia, Z., and Kexin, N. (2023). Spatiotemporal heterogeneities in the causal effects of mobility intervention policies during the Covid-19 outbreak: a spatially interrupted time-series (sits) analysis. Ann. Am. Assoc. Geogr. 113, 1112–1134. doi:10.1080/24694452.2022.2161986
Xiu-Qing, Z., Meihui, X., Zhiyuan, L., and K, D. (2022). Spatial spillover effect of rural labor transfer on the eco-efficiency of cultivated land use: evidence from China. Int. J. Environ. Res. Public Health 19, 9660. doi:10.3390/ijerph19159660
Xu, X., Zhang, D., Zhang, Y., Yao, S., and Zhang, J. (2020). Evaluating the vegetation restoration potential achievement of ecological projects: a case study of Yan'an, China. Land Use Policy 90, 104293. doi:10.1016/j.landusepol.2019.104293
Yang, J., and Huang, X. (2021). The 30 m annual land cover dataset and its dynamics in China from 1990 to 2019. Earth Syst. Sci. Data 13, 3907–3925. doi:10.5194/essd-13-3907-2021
Yuan, J., Bian, Z., Yan, Q., and Pan, Y. (2019). Spatio-temporal distributions of the land use efficiency coupling coordination degree in mining cities of western China. Sustainability 11, 5288. doi:10.3390/su11195288
Zhao, C., Jensen, J. L., and Weaver, R. (2020). Global and local modeling of land use change in the border cities of Laredo, Texas, USA and nuevo Laredo, tamaulipas, Mexico: a comparative analysis. Land 9, 347. doi:10.3390/land9100347
Keywords: land-use policy, green utilization efficiency, border cities, carbon reduction, spatial heterogeneity, sustainable development, policy effects, northeastern China
Citation: Fan X and Zhao L (2025) Land use policy and green utilization efficiency in border cities: evidence from northeastern China’s carbon reduction practice. Front. Environ. Sci. 13:1582896. doi: 10.3389/fenvs.2025.1582896
Received: 25 February 2025; Accepted: 10 April 2025;
Published: 28 April 2025.
Edited by:
Lingli Qing, Guangzhou College of Commerce, ChinaReviewed by:
Wenfang Pu, Huazhong Agricultural University, ChinaHaixin Huang, Northwest University, China
Yedong Chen, China University of Mining and Technology, China
Guihai Liu, Jiangxi Normal University, China
Copyright © 2025 Fan and Zhao. This is an open-access article distributed under the terms of the Creative Commons Attribution License (CC BY). The use, distribution or reproduction in other forums is permitted, provided the original author(s) and the copyright owner(s) are credited and that the original publication in this journal is cited, in accordance with accepted academic practice. No use, distribution or reproduction is permitted which does not comply with these terms.
*Correspondence: Lili Zhao, emhhb2xpbGlAbWRqbnUuZWR1LmNu