 Konstantinos Zachopoulos1
 Nikolaos Kokkos1
 Maria Katherina Dal Barco2,3
 Elisa Furlan2,3
 Hung Vuong Pham2,3
 Silvia Torresan2,3
 Andrea Critto2,3
 Georgios Sylaios1*
- 1Laboratory of Ecological Engineering and Technology, Department of Environmental Engineering, Democritus University of Thrace, Xanthi, Greece
- 2Department of Environmental Sciences, Informatics and Statistics, Ca’ Foscari University of Venice, Venice, Italy
- 3CMCC Foundation - Euro-Mediterranean Center on Climate Change, Lecce, Italy
Coastal zones face intensified natural and anthropogenic disturbances, including rising sea levels, coastal erosion, and over-exploitation of resources. Coastal zone monitoring of these effects involves satellite-borne shoreline extraction and detection of change rates over time. Shoreline evolution is directly related to waves, tides, winds, storms, extreme events, sea level change, and human activities affecting the geomorphologic processes of the coast. The shoreline evolution along the study sites (Iera Poli of Messolonghi, Greece, and Ugento Municipality, Italy) was examined and assessed by analyzing historical satellite images, covering the area during the latest decade (2009–2019). The study focuses on eight geographical sub-areas. The areas were selected based on their high economic and aesthetic values and the potential vulnerability to coastal erosion and climate change impact, as identified by previous studies. The outcome of this analysis offers a useful decision support tool for screening and designing multi-layered adaptation strategies that integrate environmental conservation, coastal protection, and socioeconomic sustainability to enhance long-term coastal resilience.
1 Introduction
Coastal environments are featured as the active and dynamic buffer zones between land and ocean, where significant terrestrial and marine forces prevail, shaping the coastline over space and time at varying rates (Crowell et al., 1991; Jigena-Antelo et al., 2023). Natural, morphological, climatological, and geological factors, enhanced by human constructions and interventions, are responsible for the changes seen in the shoreline over the years, reported as erosion and accretion processes (van Rijn, 2011; Aguilera-Vidal et al., 2022). These factors operate at different time scales, i.e., abrupt shoreline changes may occur during highly energetic phenomena such as storm surges, earthquakes, and volcanic eruptions. In contrast, more gradual changes occur during lower energetic periods, such as sea level rise, waves, and nearshore longshore and cross-shore currents. On the other hand, human interventions also affect the coastlines through developments in the adjacent watershed (e.g., urbanization, land reclamation, loss of vegetation, and damming) as well as through coastal infrastructures (e.g., harbors, marinas, and touristic developments) (Romine et al., 2009; Dada et al., 2024; Molina et al., 2025). Recent studies warn that sea level rise and extreme events related to climate change may cause severe threats to coastal zones, leading to the retreat of land over the sea and increasing the vulnerability of the coastal zone (Pearce et al., 2018; Molina et al., 2025).
Based on the above, coastal zone monitoring through satellite-borne shoreline extraction and detection of change rates at various times appears indispensable. Satellite-borne images provide several advantages, as they cover large monitoring areas over long periods with intense repeatability and limited cost (Almeida et al., 2021; Erdem et al., 2021; Dike et al., 2024; Alvarez et al., 2025). Satellite imagery has rapidly developed over the past few decades by reducing spatial resolution, increasing the frequency of surveying the same location, and improving overall data availability. Infrared and multi-spectral satellite images show great potential in accurately distinguishing the land-water interface (El-Asmar et al., 2013; Gorelick et al., 2017). Historical satellite images cover over 30 years with moderate to high spatial resolution, allowing for a fast, low-cost assessment of shoreline change in broad geographical areas.
The estimate of coastal erosion requires detailed data on shoreline positions (Vos et al., 2019; Wang et al., 2020; Almeida et al., 2021), including historical trends and future projections (Mukhopadhyay et al., 2012). This information could support the design of coastal protection measures while assessing sea-level rise and storm surge risks, and refining modeling scenarios (Prasad and Kumar, 2014; Irani et al., 2024). This technology is increasingly vital in shoreline detection and coastal erosion studies, as it provides clear images where the land-sea boundary is well-defined. Furthermore, Remote Sensing data can be seamlessly integrated with programming languages (e.g., R, Python, and Java) and geographic information systems (e.g., QGIS, and ArcGIS), creating a powerful toolkit for analyzing and extracting spatial information that informs decision-making and policy development (Louati et al., 2015; Petropoulos et al., 2015; Gorelick et al., 2017; Roy et al., 2024).
Over recent decades, the rapid advancement and adoption of satellite imaging have enabled the scientific community to fully explore innovative methodologies to leverage remote sensing data. Recent efforts have focused on developing advanced image processing algorithms and automated procedures to enhance the accuracy of shoreline detection and coastal erosion assessments (Vos et al., 2019; Almeida et al., 2021). In this context, Machine Learning (ML) approaches are gaining recognition for their effectiveness in classifying land and sea from Earth Observation data and in differentiating various surface types, such as agricultural, wetland, and urban areas (Ketchum et al., 2020). Numerous recent studies have demonstrated the promising potential of ML in shoreline mapping and detecting littoral changes (Petropoulos et al., 2015; Tsekouras et al., 2015; Angileri et al., 2016; Arif et al., 2017; Rahmati et al., 2017; Peponi et al., 2019). However, detecting slow and subtle shoreline changes (within a few tens of meters) using satellite images and ML methods is particularly challenging. This task becomes even more complex for gently sloping sandy coasts, which generally exhibit less obvious morphological evolution, and for highly developed littoral zones, where numerous economic pressures (e.g., coastal protection structures, sand extraction) make detecting changes difficult. Nonetheless, these areas are most vulnerable to potential retreat due to sea-level rise, intensified storm surges, and unbalanced land use (Hereher, 2015). It is projected that nearly half of the world’s sandy beaches could disappear by the end of the century (Vousdoukas et al., 2020).
Several free data portals exist for retrieving satellite images, such as the Earth Explorer1, provided by U.S. Geological Survey (USGS), the Copernicus Open Access Hub2, the Planet Explorer3, and more. This study introduces a novel and harmonized framework integrating satellite-based shoreline analysis with open sea wave time-series provided by international databases, such as the Copernicus Marine Environmental Monitoring System (CMEMS) to evaluate coastal erosion risk, their relation with wave dynamics, and the potential implementation of different adaptation measures for risk reduction (Copernicus Marine Service, 2024). The study focuses on the southern coastline of the Municipality of Iera Polis of Messolonghi (Western Greece) and the coastline of the Ugento municipality in the Apulia region (South-Eastern Italy). In particular, eight geographical sub-areas (four for each country) were selected based on their economic and ecological value, as well as their vulnerability to coastal erosion and climate change impact. Furthermore, this study explores the role of adaptation measures, ranging from nature-based solutions to hybrid approaches that combine ecological and engineered interventions, as viable strategies to reduce coastal erosion risk and enhance long-term resilience within the selected case studies. By linking erosion risk assessments with climate adaptation planning, the proposed framework offers a valuable tool for guiding decision-makers in designing sustainable coastal protection strategies.
2 Materials and methods
2.1 Case studies
2.1.1 Iera Polis of Messolonghi, Greece
The Greek study area is situated in western Greece, in the south of the prefecture of Aitoloakarnania, one of the regional units of Central Greece (Figure 1). More precisely, the study focuses on the southern coastline of the Municipality of Iera Polis of Messolonghi situated on the north-western coast of the Patraikos Gulf. The coastal zone is characterized by a complex lagoonal system that is among the largest in the Mediterranean region, covering over 150 km2. This system has been formed through the siltation action of the adjacent Acheloos River (in the West) and Evinos River (in the East) (Leonardos and Sinis, 1998).
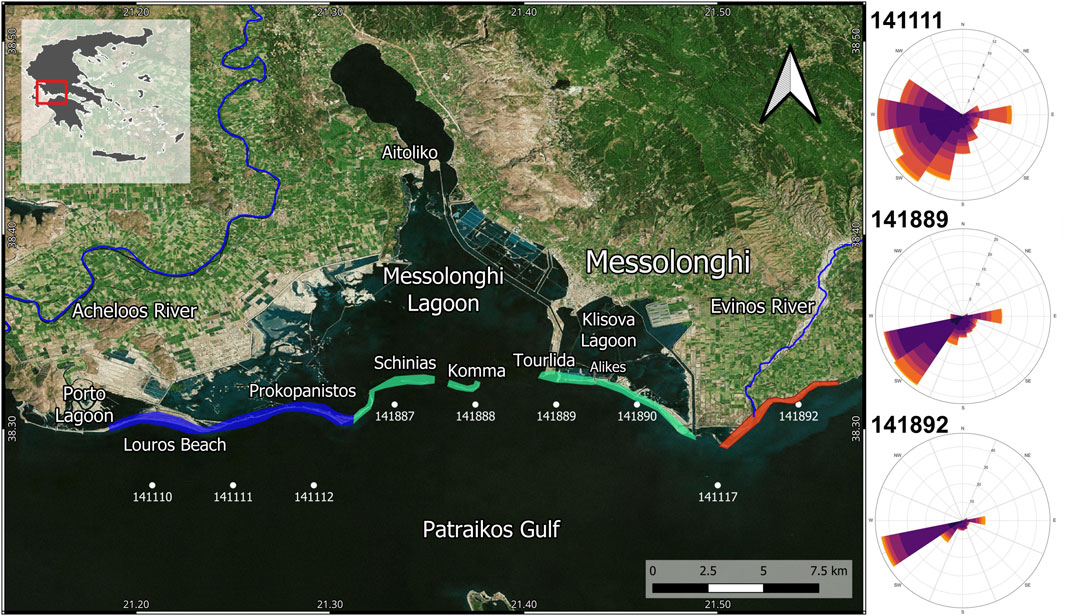
Figure 1. The sub-areas studied along the coastline of the Municipality of Iera Poli of Messolonghi, Greece. White dots: offshore CMEMS points; blue, green and red areas: areas with nearshore wave analysis; Wave roses illustrate the wave characteristics at CMEMS points.
The physical characteristics of the lagoon, such as its shallow depth, sedimentation processes, salinity, and nutrient status, are shaped by the morphometric dynamics of the Acheloos and Evinos river basins, which are characterized by intense tectonic activity, steep slopes, significant elevation differences, and pluvial discharge, as well as the Mediterranean climate (high winter precipitation, dry summer) (Mimikou and Baltas, 2013; Liordos et al., 2014; Psomiadis et al., 2020). The coastal zone of the Messolonghi lagoon is a particularly sensitive and dynamic coastal system that is directly affected by extreme weather events such as heavy rainfall, storms, and flooding. These phenomena have increased in frequency, intensity, and duration over the past decade, a trend largely attributed to climate change and shifting hydro-meteorological patterns in the Mediterranean region. Significant flooding episodes in 2016, 2017, and 2018 caused extensive damage to agricultural land, infrastructure, and the natural geomorphology of the area (Antoniadis et al., 2023).
The lagoonal system consists of four lagoons: the Messolonghi lagoon, covering an area of over 45 km2, the Aitoliko Lagoon (in the North) with an area of about 15 km2, as well as other lagoons, such as Klisova Lagoon in the East and Porto Lagoon in the West (Gianni and Zacharias, 2012). The Messolonghi lagoon is located in the central and southern part of the lagoonal system and communicates with the Patraikos Gulf by several channels. The Klisova lagoon is located in the eastern part of this complex system and is characterized by a significant number of saltworks (Alikes) that occupy 12.4 km2. It is an area of complex geomorphology since the outflow of the Evinos River transfers sediments along the coastal zone, shaping the sandbars of the lagoons.
The coastline has undergone significant anthropogenic modifications. The damming of the Evinos River (notably at the Agios Dimitrios dam) has significantly reduced the supply of sediments to both the lagoon and the adjacent coastal zone. Under natural conditions, the Evinos River is one of the primary sources of sediment transport, which plays a crucial role in; Replenishing coastal landforms, Counteracting erosion by providing natural sediment deposits along the shoreline, Sustaining shallow wetland habitats, which are vital for numerous species of flora and fauna, including migratory birds and aquatic organisms (Filippaki et al., 2023). However, due to reduced sediment discharge, the coastal system has become hydromorphologically degraded, leading to gradual shoreline retreat, erosion of protective formations and net land loss, increased flood vulnerability, as the natural buffering capacity against wave action and storm surges is diminished (Filippaki et al., 2023).
The coastal zone of the Municipality of Iera Polis of Messolonghi is a dynamic environment with significant variations in the coastline position through the decade from 2009 to 2019. Several analyses reveal sediment transportation along the coastline and erosion and accretion hotspots. Accordingly, this study focused on four sub-areas: a) the Louros beach, b) the Messolonghi lagoon mouth, c) the Tourlida and Klisova Beach, and d) the Evinos river mouth.
Louros Beach is a long sandy beach located in the west. It is featured by its high tourist significance and ecological value since it is a breeding area for sea-turtles Caretta caretta. Long sandy beaches form the mouth of the Messolonghi lagoon. In the West, Prokopanistos Beach (around 2.5 km), and at the center, the sandy islands Schinias (about 1.5 km) and Komma (approximately 1.7 km). The outer beaches of the sandy dune areas are particularly vulnerable to extreme weather events and intense wave action due to their geomorphology. The third study site is a long sandy coastline of around 7.6 km, from the Tourlida beach to the Babakoulia channel. Specifically, the study focused on Tourlida Beach since it is an important tourist point of interest. It is located on the outer shoreline of the Klisova lagoon, which communicates with the Gulf of Patras through five channels along the coastline. Finally, the Evinos River mouth study site represents a complex transitional environment. The river distributes material between fresh river water and brackish coastal wetlands, helping to build mudflats and marshes. These sediments serve to sustain and expand the neighboring Messolonghi Lagoon. The Evinos River estuary is listed in the Natura 2000 network and the Ramsar Convention.
2.1.2 Ugento, Italy
The Apulia region is in South-Eastern Italy. It is a strategic position in the heart of the Mediterranean, bordering the Adriatic Sea to the East and the Ionian to the South-East (Figure 2). Several cities (e.g., Bari, Taranto, Brindisi, Ostuni, and Gallipoli) with high population density are located along this coast, where, during the summer, the population increases further due to tourism. With a coastal extension of about 970 km (Regione Puglia, 2018), mostly flat and sandy, Apulia is the Italian region with the highest coastal development, attracting an increasing number of tourists from all over the world (Del Vecchio and Passiante, 2017).
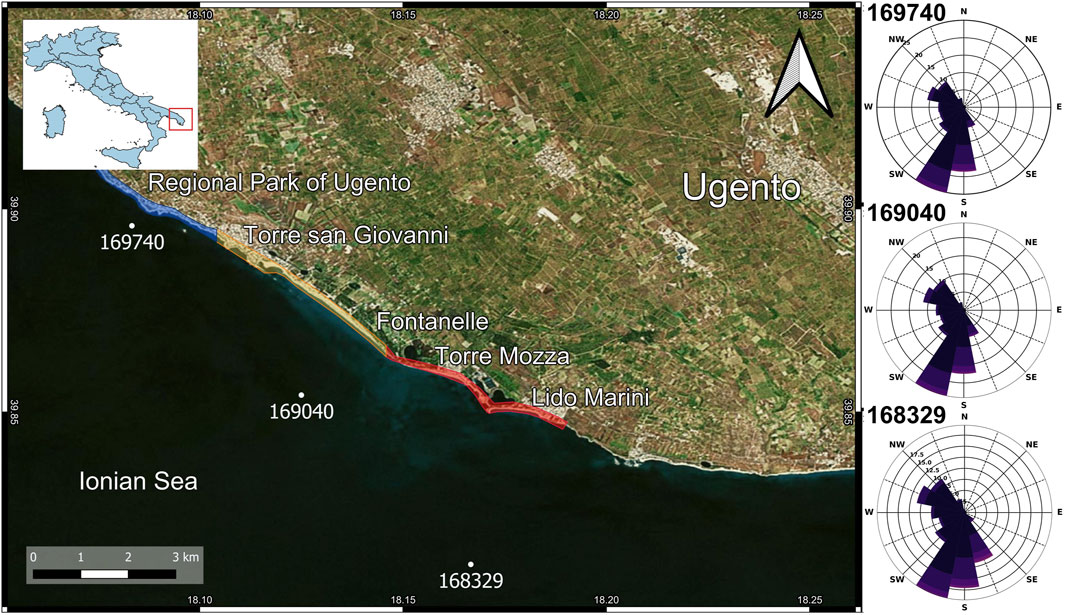
Figure 2. The Municipality of Ugento in the Apulia region, Italy. White dots: offshore CMEMS points; red areas: areas with nearshore wave analysis; blue and yellow areas: excluded zones; Wave roses illustrate the wave characteristics at CMEMS points.
About 13.8% of the Apulian region, and the connected marine space, are characterized by valuable natural protected areas, including two national parks, three marine protected areas, sixteen state reserve areas, and eighteen regional parks (e.g., the Regional Park of Ugento). The Municipality of Ugento is a medium-sized town located in the southern Salento peninsula, less than 60 km far from the provincial capital city of Lecce. The municipal area presents a population of about 12,000 with a density of 123 inhabitants.km-2) (Istat, 2011).
Between December 2009 and January 2010, the Apulian coast endured over 20 consecutive days of severe weather and storm surges driven by intense Sirocco winds (SSE direction). According to wave dynamics research in Southern Apulia, southeasterly winds over a 700–800 km fetch produced offshore wave heights of 6.5–7.5 m, causing substantial coastal erosion in Salento and adjacent regions. Apulia experienced multiple extreme weather events, in 2011, 2013, 2015, and 2019, characterized by intense and prolonged rainfall (Delle Rose et al., 2021; Avino et al., 2024).
The coastline has undergone significant anthropogenic modifications that have influenced its natural dynamics and contributed to coastal instability. Key interventions include the construction of coastal infrastructure such as jetties, roads, and groynes, which have altered sediment transport patterns and disrupted longshore drift. These engineering works, often intended to stabilize the shoreline or support activities like fish farming and tourism, have led to unintended consequences such as increased erosion, especially in areas adjacent to hardened structures. Additionally, land reclamation, dune vegetation removal, and the expansion of urban and tourist infrastructure have further degraded natural coastal defenses, reduced habitat quality, and increased the coastal vulnerability to storm events and sea-level rise (Dal Barco et al., 2024).
Its territory covers an overall surface of approximately 100 km2, including the city center of Ugento, the hamlets of Gemini and Torre San Giovanni, the marinas of Torre Mozza, Lido Marini, and Fontanelle. This area represents one of the most interesting and precious zones of the Salentine Peninsula from an environmental, historical, and landscape point of view, as it is characterized by a high diversity in ecosystems within its Nature 2000 sites, demonstrating the ecological complexity and the high biodiversity of habitats and species that can be found, especially in the Regional Park of Ugento (Comune di Ugento, 2015).
2.2 Conceptual framework of the study
The methodology applied to assess and define the erosion activity in both study areas was based on a conceptual framework harmonizing two analytical tiers: a) the ‘offshore wave analysis’ and the estimation of ‘incident wave energy in the breaking zone’, and b) the ‘shoreline movement’ analysis. In particular, the offshore wave analysis and the estimation of incident wave energy in the breaking zone of each study area were performed by using the offshore wave parameters (i.e., significant wave height, wave period, and wave direction) retrieved from CMEMS, following the equations described by the (U.S. Army Corps of Engineers, 2008). The shoreline movement analysis was carried out by processing historical satellite images, using remote sensing analysis techniques in GIS software. The parallel implementation of both tiers allows for identifying suitable areas for prevention/mitigation measures, promoting soft engineering solutions (Figure 3). The analysis focused not only on each case study but also on their macro-areas, depending on the geographic morphologic settings, as suggested by previous works (Bombino et al., 2022; Corbau et al., 2023).
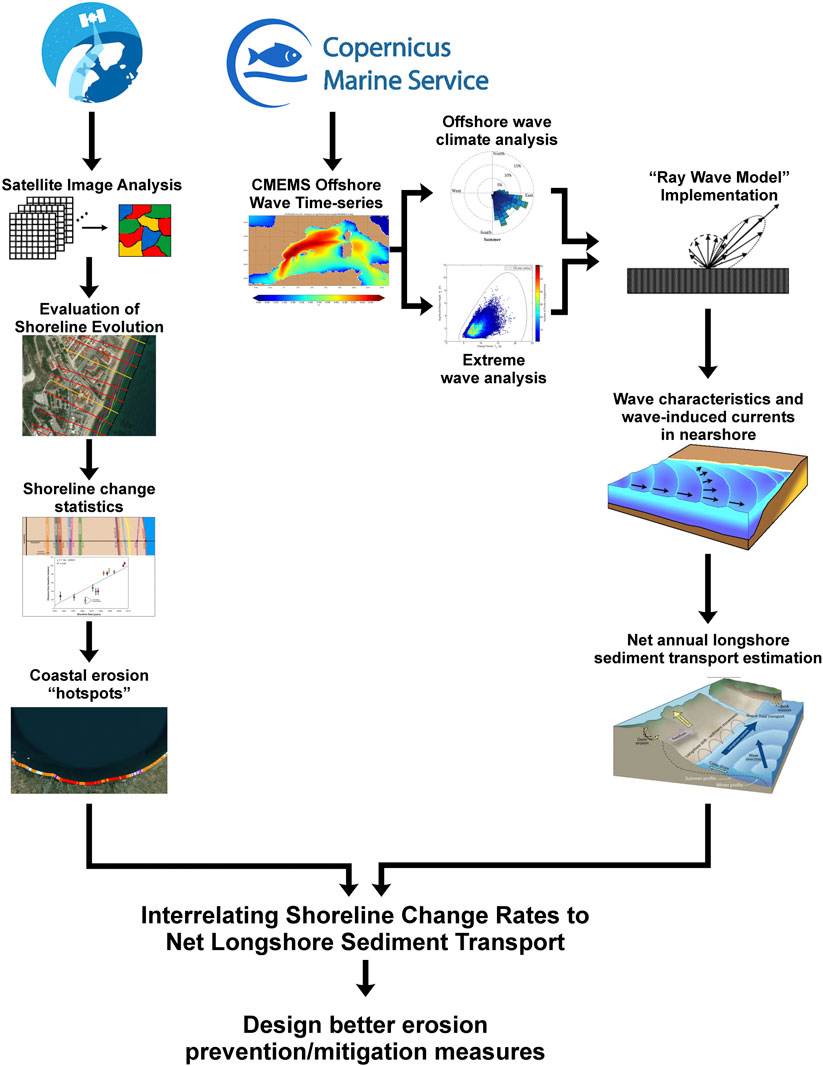
Figure 3. Conceptual framework to assess coastal erosion, understand the processes responsible for coastal erosion and design better prevention/mitigation measures.
2.3 Satellite image analysis
The assessment of shoreline evolution using satellite images breaks down into the following operative steps: a) proper historical satellite image selection, b) historical coastline extraction from the satellite images, c) evaluation of shoreline evolution through time, and d) assessment of methodological errors.
2.3.1 Satellite image selection
Four historical satellite images for each study site were retrieved to cover the period from 2009 to 2018 (for Ugento) and 2009 to 2019 (for Messolonghi) (Table 1). The historical image selection was mainly based on the correct geo-referencing, orthorectification, and image clarity from cloud cover. The monochromatic near-infrared band was selected for image classification analysis and shoreline extraction. The shoreline movement analysis was carried out using satellite images from the RapidEye sensor, retrieved from the Planet Explorer database (www.planet.com/explorer), with a pixel size of 5 m. The RapidEye Ortho Tile products have a uniform pixel size of 5 m across all spectral bands. These products are orthorectified and geometrically corrected, making them suitable for direct use in spatial and environmental analyses. To enhance the geospatial accuracy of the imagery, a supplementary georeferencing validation was performed based on ground reference points.
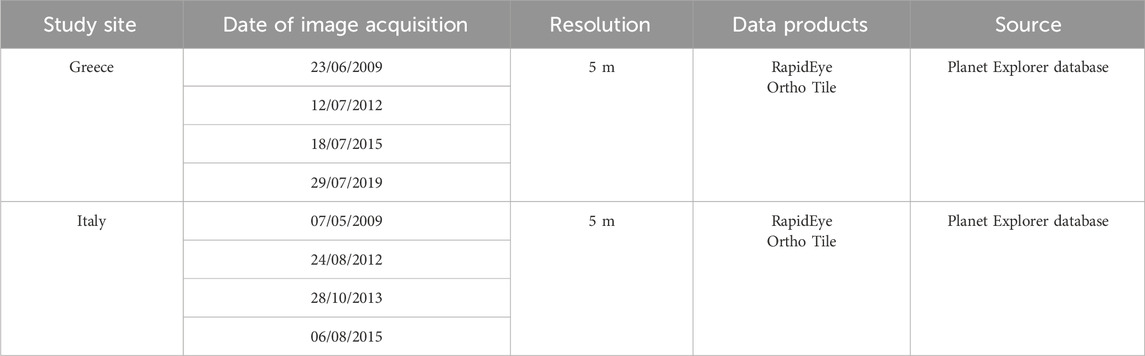
Table 1. Metadata of the satellite images used.
2.3.2 Coastline extraction methodology
The methodology employed in this study entailed an image classification procedure using a semi-automatic classification technique to distinguish the sea from the land and thus extract the exact shoreline location. The near-infrared band of each satellite image was imported into a GIS environment, and using the Semi-Automatic Classification Plugin (SCP) for QGIS (Congedo, 2016), around 30 Regions of Interest (ROI’s) on each image were manually identified and separated into two classes (i.e., land and sea). The image was classified through the minimum distance classification algorithm, and a new classified raster file was created. The shoreline was extracted by vectorizing the classified raster image and smoothed by a Gaussian filtering algorithm.
2.3.3 Evaluation of the shoreline evolution
To evaluate the shoreline evolution through the study period, an analysis was carried out by applying the Digital Shoreline Analysis System (DSAS), provided by the USGS (Thieler et al., 2009). The DSAS procedure was carried out by applying perpendicular to the shoreline transects, positioned at distances of 10 m. The reference baseline required by the DSAS procedure was manually digitized and positioned offshore and parallel to the most recent shoreline (shoreline of 2018 or 2019). A series of coastal erosion indicators was produced:
a) the Net Shoreline Movement (NSM, in m), reporting the distance between the oldest and the earliest shoreline for each transect,
b) the End Point Rate (EPR, m yr-1), calculated by dividing the distance of Net Shoreline Movement by the time elapsed between the oldest and the most recent shoreline, and finally,
c) the Weighted Linear Regression (WLR, m yr-1), in which the weight w is a function of the variance of the measurement uncertainty (Genz et al., 2007) (Equation 1):
where e is the shoreline uncertainty value. Using the data produced by the DSAS transects, a statistical analysis of the shoreline evolution along the study years was applied, and various statistical indices were derived. The results were verified using two methods for outlier removal: a) the Interquartile Range (IQR) method, and b) the method of extreme values removal (based on quantile distribution – 1%) to “clip” the data and remove the outliers. Both methods were applied in combination with optical and empirical detection.
2.3.4 Error estimation
For all two case study sites and eight macro-areas, the total uncertainty value ET was estimated for each shoreline by accounting for both positional and measurement uncertainties as the square root of the sum of squares of the relevant uncertainty terms, as Equation 2:
where ES is the seasonal error, Etd is the tidal fluctuation error, Ed is the error associated with shoreline digitization, Ep is the error related to the image resolution, and Er is the image rectification error. Seasonal uncertainty assesses the shoreline variations due to the prevailing wave conditions from summer to winter. This error was minimized since almost all analyzed images were collected during the summer. The tidal fluctuation error refers to the shoreline change due to spring-neaps sea level variability. Since both areas are microtidal, this error was assessed at ±0.2 m. The digitization error of the satellite image was derived from the statistical analysis of the DSAS tool presents a maximum specified error, at ±0.5 m, while the image resolution error was ±5 m. Finally, although all images were already ortho-rectified and georeferenced, minor corrections were needed, leading to an error of ±2.3 m. Based on the above assessments, the total uncertainty value ET was estimated at ±5.6 m.
2.4 Incident wave analysis
A comprehensive wave analysis was performed in correspondence with the coastal erosion assessment. The estimated wave characteristics were associated with erosion hotspots, providing potential explanations for annual coastline changes. The daily time series of the spectral significant wave height (VHM0), the zero up-crossing wave period (VTM10), and the wave orientation relative to the north (VMDR) were retrieved from the CMEMS database. The data cover 2009-2018 for the Greek study site and 2009-2019 for the Italian one.
These data were imported into a simple wave-ray model, as open sea significant wave height (Ho), wave period (T), and open sea direction (ϕo), to turn offshore wave characteristics into nearshore and breaker zone wave characteristics.
The deep-sea parameters as the wavelength [in m] were estimated by Equation 3:
The wave celerity [in m s-1] and the wave group celerity [m s-1] as Equations 4, 5:
and
where T is the wave period [in sec] and g is the gravitational acceleration [m s-2].
At the breaker zone, the wavelength was computed by Equation 6:
The wave celerity and the wave group celerity (Equations 7, 8):
and
The significant wave height [in m] at the breaker was computed as Equation 9:
where Ks is the shoaling coefficient and KR is the refraction coefficient, estimated as Equations 10, 11:
and
and no and nb are the wave dispersion coefficients at the open sea and the nearshore, estimated by Equations 12, 13:
and
Finally, the wave direction at the breaker zone and the wave breaker zone depth were assessed by Equations 14, 15:
and
where γ = 0.78, known as the breaker index.
Following the wave characteristics at the breaker zone, the longshore sediment transport, Vlong [in m s-1] was computed according to the CERC equation (Equation 16):
where m is the bottom slope at the breaker zone, derived from bathymetric maps (GEBCO Compilation Group, 2024). The incident wave energy at the breaker zone [J m-1s-1] was assessed by Equation 17:
and the theoretical longshore sediment transport on an annual basis [m3 yr-1] was estimated by the CERC relevant equation as Equation 18:
Thus, the estimated longshore sediment transport along sections of the coastline will be correlated with the observed shoreline erosion and accretion rates derived from satellite imagery over the study period.
3 Results
The above methodological approaches were applied to the two case studies situated at different geographical locations, having variable geomorphological characteristics and natural and human-induced drivers. This analysis aims to demonstrate the applicability and robustness of the proposed workflow in variable contexts. This section presents the results of these two case studies, reporting coastal erosion patterns and wave-related data at each study area.
3.1 Coastal erosion patterns along the Messolonghi coastal zone
The Messolonghi case study site is characterized by several inlets, channels, and river mouths, like the Evinos River mouth, supplying sediments to the coastal zone. Four geographic-morphologic macro-areas were studied, namely, the Louros beach, the Messolonghi lagoon mouth, the Tourlida and Klisova beaches, and the Evinos River mouth. The following paragraphs present the findings of the shoreline analysis for these areas.
3.1.1 Louros Beach
The Louros beach, located on the western coast presents a balanced average shoreline movement from 2009 to 2019 (+2.0 to −2.5 m) (Figure 4c). It is observed that the eastern side of the coastline retreats while the western is advancing. Specifically, the west zone revealed a significant retreat of about −3.5 m showing a moderate erosion rate, up to −0.70 m year-1. On the contrary, the eastern coast showed moderate accretion rates, with a maximum coastline movement of up to +9.0 m and an average deposition rate of about +0.5 m year-1 (Figure 4).
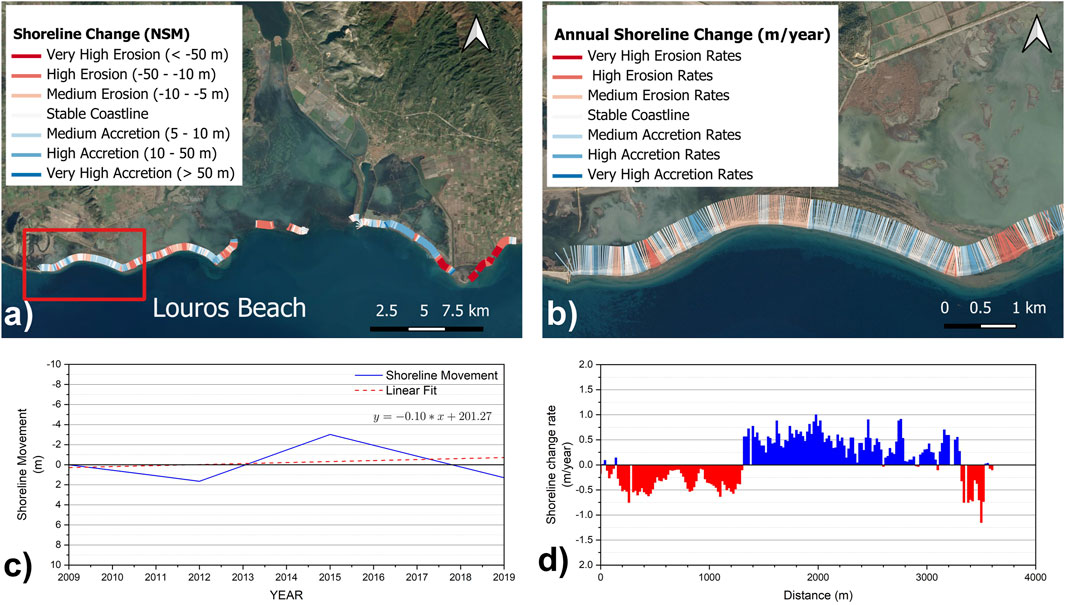
Figure 4. (a) Shoreline evolution ιn the coastal zone of Messolonghi coastal zone as evaluated through the DSAS tool; (b) Annual shoreline change rates observed at Louros Beach; (c) Mean temporal shoreline displacement and linear regression trend at Louros Beach during 2009–2019; (d) erosion and accretion rates along transects at the Louros Beach.
3.1.2 Messolonghi Lagoon Mouth
Due to their geomorphology, the sandbars at the mouth of Messolonghi lagoon are the most vulnerable shoreline segments of the Greek study site (Figure 5a). Satellite imagery results indicate that the shoreline gradually eroded by up to −7.0 m in 2015 (Figure 5c). The total retreat was ∼ −5.0 m, with the average shoreline change rate of −0.50 m year−1. A maximum erosion rate of −4.20 m year−1 and a maximum accretion rate of +4.50 m year−1 were observed in the area (Figures 5b,d). In Prokopanistos Beach, a relatively high spatial mean shoreline retreat is observed (-10.0 m) throughout the latest decade. Coastal erosion appears imminent in Schinias and Komma sites, exhibiting average shoreline retreat of approximately −1.0 m year−1 and -0.5 m year−1, respectively. The maximum erosion rate was observed at the western zone of the Schinias coastline (−2.2 m year−1), while the higher accretion rate occurred at the eastern part of the Komma coastline (+1.1 m year−1) (Figure 5).
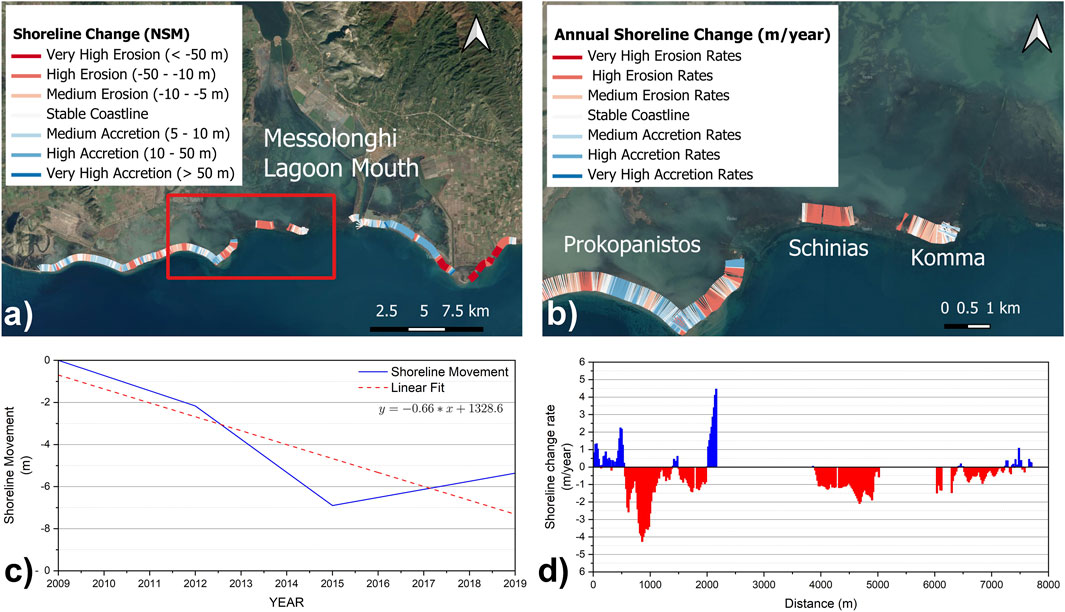
Figure 5. (a) Shoreline evolution in the coastal zone of Messolonghi coastal zone as evaluated through the DSAS tool; (b) Annual shoreline change rates observed at Messolonghi Lagoon Mouth; (c) Mean temporal shoreline displacement and linear regression trend at Messolonghi Lagoon Mouth, during 2009–2019; (d) Erosion and accretion rates along transects at the Messolonghi Lagoon Mouth.
3.1.3 Tourlida and Klisova Beach
Moving to the east of the Messolonghi lagoon mouth, the beaches of Tourlida and Klisova are situated (Figure 6a). The average coastline position ranges from +2.3 to −3.1 m throughout the study period (Figure 6c). The Tourlida beach forms a small artificial gulf in which the coastline retreated gradually up to −5.0 m over the last decade. The mean erosion rate reached −0.20 m year-1 (Figures 6b,d). On the other hand, Klisova Beach exhibits significant accretion activity, with average accretion rates up to +8 m year-1. On the southeast coast, close to the Babakoulia channel, very high erosion rates (up to +15.3 m year-1) are recorded. The sediment moves towards the south and accumulates in the channel dike (Figure 6).
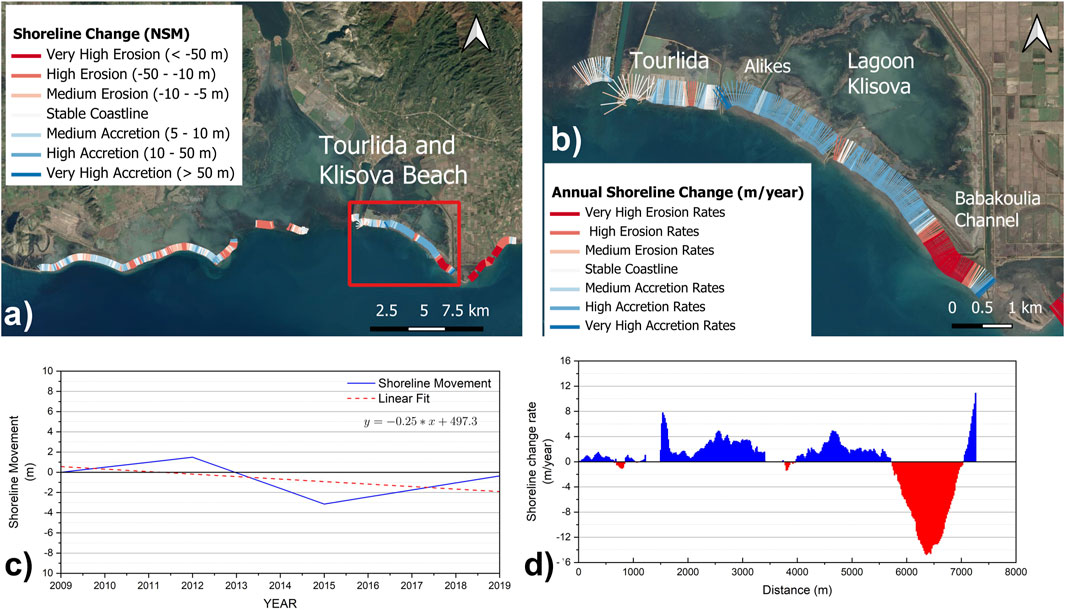
Figure 6. (a) Shoreline evolution in the coastal zone of Messolonghi coastal zone as evaluated through the DSAS tool; (b) Annual shoreline change rates observed at Tourlida and Alikes; (c) Mean temporal shoreline displacement and linear regression trend at Tourlida and Alikes, during 2009–2019; (d) Erosion and accretion rates along transects at the Tourlida and Alikes.
3.1.4 Evinos River mouth
The Evinos River mouth is located along the eastern coast of the Greek study site (Figure 7a). This coast suffers from severe erosion, exhibiting an average shoreline retreat up to −125 m (Figure 7c) and erosion rates up to −33 m year−1 (Figures 7b,d). Portions of land along the Babakoulia zone have moved from East to West by almost 350 m from 2009 to 2019. The average erosion rates were estimated up to −14 m year−1 along the coast on both sides of the Evinos River mouth. At this zone, the shoreline retreated from −50 m to −130 m (Figure 7).
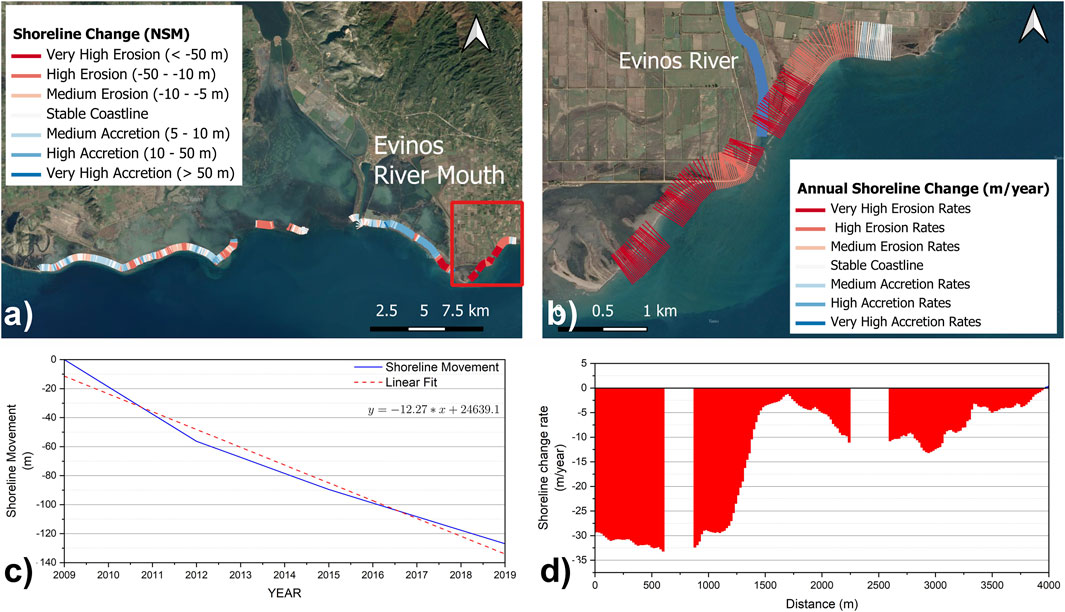
Figure 7. (a) Shoreline evolution in the coastal zone of Messolonghi coastal zone as evaluated through the DSAS tool; (b) Annual shoreline change rates observed at Evinos River mouth; (c) Mean temporal shoreline displacement and linear regression trend at Evinos River mouth, during 2009–2019; (d) Erosion and accretion rates along transects at the Evinos River mouth.
3.2 Offshore and nearshore wave analysis along the Messolonghi shoreline
In this section, the wave characteristics retrieved from the CMEMS database in hourly time steps at nine offshore points along the Messolonghi coastline were statistically described, and the nearshore wave characteristics, such as the incident wave energy and the longshore sediment transport, were estimated. Figure 1 presents the central points of the offshore CMEMS cells along the Messolonghi shoreline. Moreover, the coastline was discretized into three coastal sub-areas according to the wave influence on the coastal zone. In particular, the Western coast (colored in blue) is mainly influenced by the waves at the western CMEMS points (141110, 141111, and 141112), the central coast (colored in green) by the offshore waves at the central CMEMS points (141887, 141888, 141889, and 141890), and the eastern coast (colored in red) by the CMEMS points 141117 and 141892.
Based on the wave analysis, the western offshore area (points 141110–141112) exhibits the maximum wave activity, with wave orientation ranging from SSW to WNW, and the W and SW being the most prevalent wave directions. The average wave height varies from 0.24 to 0.37 m, with extreme weather conditions resulting in waves as high as 2.24 m. More specifically, the highest wave activity is observed 3 km offshore of Louros Beach, with wave directions ranging from SSW to WNW. The average wave height is estimated at approximately 0.37 m.
The wave activity is significantly lower at the central offshore zone (points 141887–141890). The mean wave height is 0.24 m, and waves propagate primarily from the WSW and SW. Even in strong weather circumstances, the wave height does not surpass 1.5 m, with the highest wave height (up to 1.70 m) recorded in the Louronisides area (Prokopanistos, Schinias, and Komma sandbars). More precisely, the most frequent wave direction in the offshore marine region of Prokopanistos and Komma is SW to WSW, with average wave heights of 0.35 and 0.25 m, respectively. Moreover, in Alikes, WSW-oriented waves prevail, with wave heights reaching 1.7 m.
The influence of increased wave action is limited in the eastern coastal zone. At the offshore area of the Evinos River mouth, waves propagate primarily from WSW, with an average wave height of 0.21–0.24 m. The maximum wave height is about 1.47 m, and a rare occurrence of high waves was observed. As a result, the eastern coastal zone receives limited wave power, mostly due to its orientation. Table 2 presents the results from the above analysis.
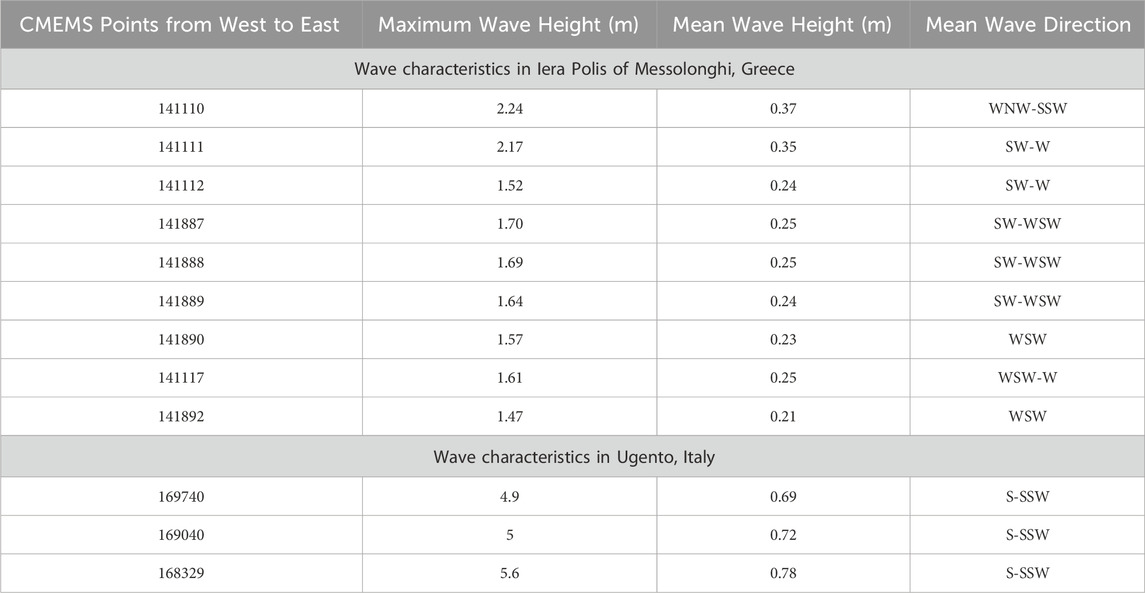
Table 2. Wave analysis results for the coastal zone of the Municipality Iera Polis of Messolonghi, Greece and coastal zone of the Ugento, Italy.
The incident wave energy prevailing over the study area influences the sediment budget and affects sediment transport by the wave height and direction. Such patterns possibly determine the accretion/erosion features observed at the shoreline. The most frequent wave orientation in the study site was from the west to the southern direction, with wave heights up to 2.6 m and incident wave energy to the coastline up to 80 J m−1s−1.
Based on historical satellite imagery analysis, five erosion hotspots were identified: a) Louros Beach, b) Prokopanistos coastline, c) Schinias sandbar, d) Komma sandbar, and e) Evinos River mouth. The average incident wave energy at these five hotspots was estimated to be approximately 50.99 J m−1 s−1, corresponding to a mean annual erosion rate of −1.34 m year−1, with a predominant wave orientation from S-SSE. Table 3 indicates that the period from 2012 to 2015 was characterized by the highest wave energy conditions, with an average incident wave power of 79.23 J m-1 s−1. During this interval, notably elevated incident wave energy values were recorded at Louros Beach (158.11 J m-1 s−1) and the Prokopanistos coastline (85.92 J m-1 s−1), corresponding to erosion rates of −1.8 m year−1. Additionally, the maximum incident wave energy calculated at the Louronisides (Schinias and Komma) at the Messolonghi Lagoon mouth was approximately 32.35 J m-1 s−1 and 40.55 J m-1 s−1, correlating with accelerated shoreline retreat rates at −2.0 m year−1.
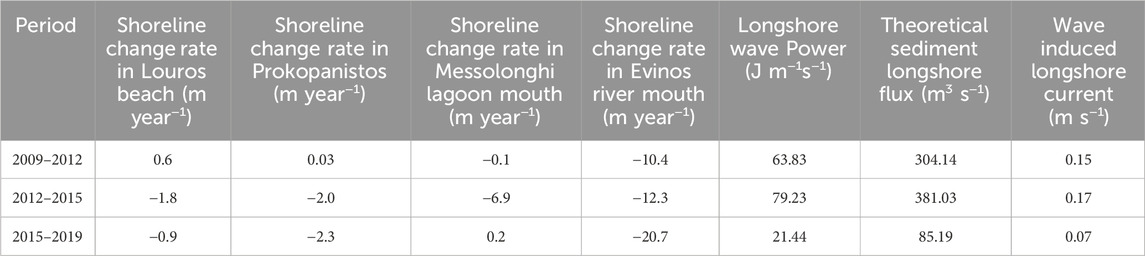
Table 3. Mean shoreline change rate, longshore wave power, and wave-induced longshore current and theoretical longshore sediment flux at the Messolonghi coastal zone.
3.3 Coastal erosion patterns along the Ugento coastal zone
The Ugento case study is characterized by different morphological, landscape, and human-induced settings, such as the rocky coast in the north, the artificially protected sandy beach of Torre Mozza in the center, and the mix of rocky and sandy coast of Lido Marini in the south. Therefore, these morphological settings formed the division of four coastal segments: the regional park of Ugento, Fontanelle, Marina of Torre Mozza, and Lido Marini. The results of the shoreline analysis for these segments are reported in the following paragraphs.
3.3.1 The regional park of Ugento
Along the Regional Park of the Municipality of Ugento, the shoreline appears stable since the area is mainly featured by a less vulnerable geomorphological setting (i.e., rocky coast) and less affected by human interventions (e.g., the construction of jetties, hydrological adjustments, or buildings and resorts along the coast) (Figure 8a). This area was relatively stable since the shoreline movement ranged between −0.5 and +1.7 m, with a negligible mean shoreline change rate over the investigated period (2009–2018) (Figure 8c). Moreover, a fluctuating trend among transects is observed (i.e., change from erosion to accretion) with a rate of change of about ±0.5 m year−1 (Figures 8b,d).
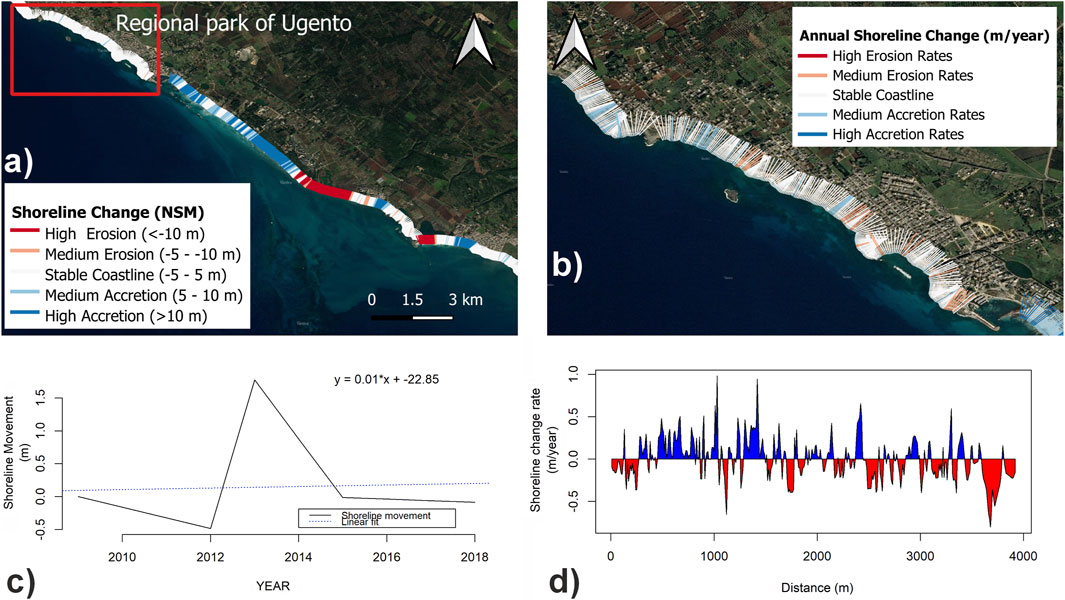
Figure 8. (a) Shoreline changes across the Ugento coastal zone as evaluated through the DSAS tool; (b) Shoreline change rates within the Regional Park of Ugento; (c) Temporal variability of shoreline movement within the Regional Park of Ugento over the 2009-2018 timeframe; (d) Erosion/accretion rates along the transects of the Regional Park of Ugento.
3.3.2 Fontanelle
Moving south from the stable area of the Regional Park of Ugento to the Fontanelle area, a high rate of shoreline accretion in this coastal zone is observed (Figure 9a). This area appears to accumulate sediments, functioning in a highly advancing trend. Positive NSM values in all transects are observed with maximum accretion of about 15.5 m (Figure 9c). In addition, the average change rate over this period was about 2.5 m year−1, and the maximum annual shoreline change was about 3.2 m year−1 (Figures 9b,d). This phenomenon is due to the movement of sediments during port construction and the implementation of nature-based solutions (i.e., dune restoration) along the Fontanelle zone over the last decade (Comune di Ugento, 2015; Moretti et al., 2016). Specifically, the latter had a pivotal role in the beach reconfiguration, which proved efficient in preventing coastal erosion (Figure 9).
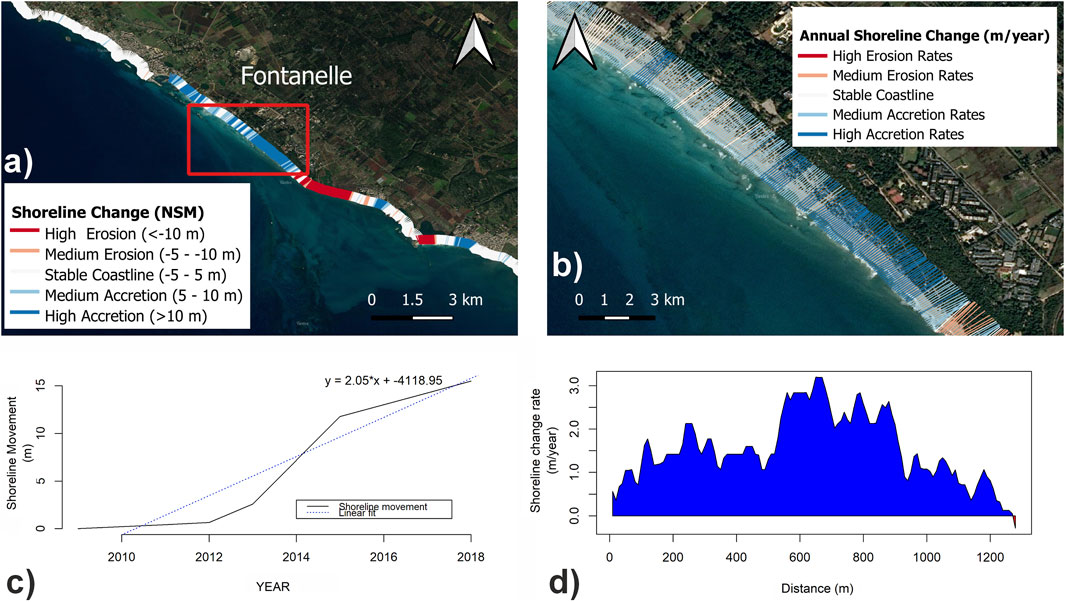
Figure 9. (a) Shoreline changes across the Ugento coastal zone as evaluated through the DSAS tool; (b) Shoreline change rates within the Fontanelle area; (c) Temporal variability of shoreline movement within the Fontanelle area over the 2009-2018 timeframe; (d) Erosion/accretion rates along the coastal zone of Fontanelle.
3.3.3 Marina of Torre Mozza
Moving south, just about 1.2 km from the accretion zone of Fontanelle, a contrast situation on the sandy beach of Torre Mozza is observed, where a high erosion rate is detected (Figure 10a). Specifically, negative values of NSM with a maximum value of around −61.0 m were recorded (Figure 10c), and the average shoreline change rate was about −3.9 m year−1 over the 2009-2018 period. Moreover, the maximum annual shoreline change rate was found at −6.2 m year−1, positioning the marina of Torre Mozza as the most eroded marina in the Municipality (Figures 10b,d). This pattern is mainly due to storm surge events which are becoming even more frequent and severe in this area, as well as the transport of unbalanced sediments. The latter is the result of the port and water infrastructures (i.e., groins, breakwaters) built in the municipality during the 1981-2003 timeframe, contributing to the sediment imbalance in the southern part of the municipality (Figure 10). Specifically, the groin-breakwater system bordering the marina of Fontanelle, is responsible for the erosive pattern, which has been evident over the last decades (Comune di Ugento, 2015).
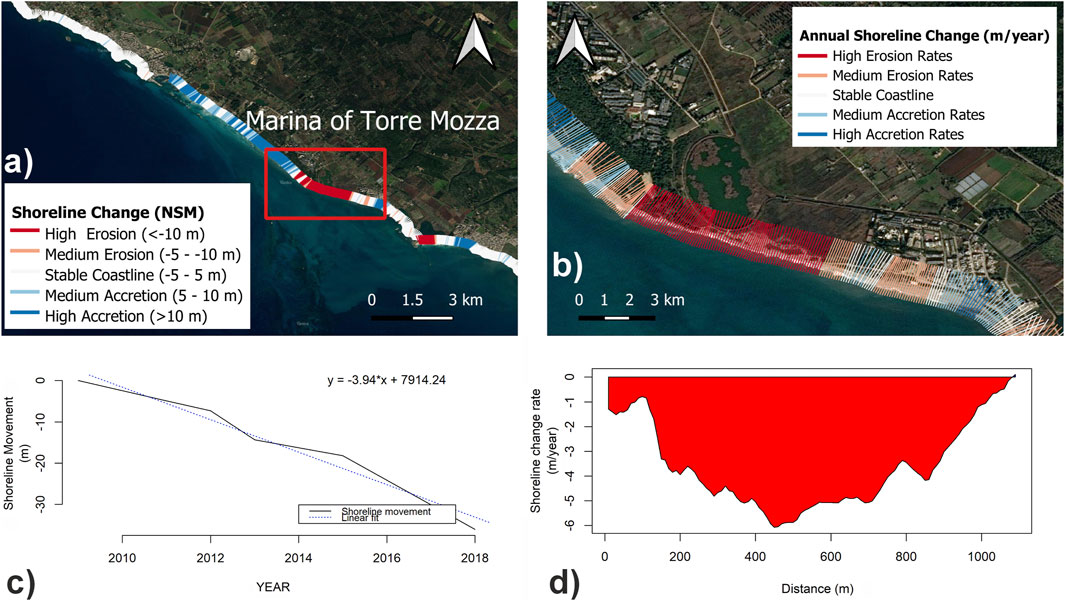
Figure 10. (a) Shoreline changes across the Ugento coastal zone as evaluated through the DSAS tool; (b) shoreline changes within the marina of Torre Mozza; (c) Temporal variability of shoreline movement of the Torre Mozza area over the 2009-2018 timeframe; (d) erosion/accretion rate along the coastal zone of Torre Mozza.
3.3.4 Lido Marini
In contrast to previous cases, the shoreline of Lido Marini illustrates mixed behavior (Figure 11a). Specifically, this area experienced a maximum erosion of about −26.0 m on the western side, while the highest accretion of about −21.0 m was observed in the eastern zone. Overall, the rate of shoreline change for the whole investigated period (2009–2018) is about −0.20 m for the total area (Figure 11c). Moreover, the maximum annual shoreline change rate was about ±2 m year−1 (Figures 11b,d).
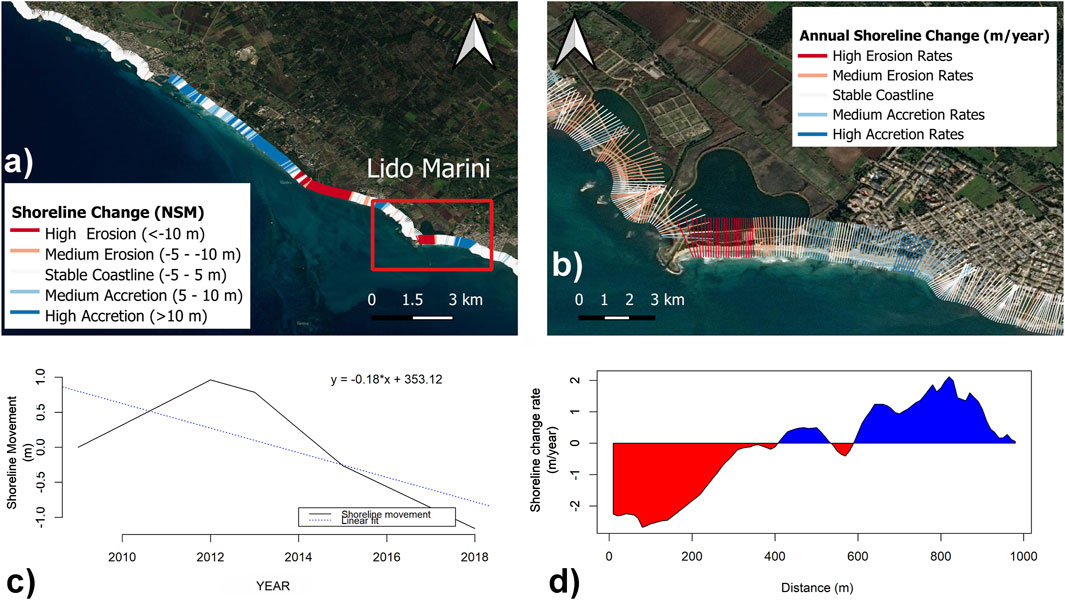
Figure 11. (a) Shoreline changes across the Ugento coastal zone as evaluated through the DSAS tool (b) Shoreline changes within Lido Marini; (c) Temporal variability of shoreline movement of the Lido Marini over the 2009-2018 timeframe ty; (d) Erosion/accretion rate along the transects of the Lido Marini coastal zone.
After 2012, the shoreline evolution turned from erosion to accretion due to the reconstruction of dunes and beach nourishment under the Ugento Municipal coastal plan (Comune di Ugento, 2015). However, most of the nourished sand was lost within two to 3 years under the influence of storms, and sand was transported eastwards (Figure 11).
3.4 Offshore and nearshore wave analysis along the Ugento coastal zone
The wave characteristics of three offshore locations along the Ugento coastline were obtained in hourly time-steps from the CMEMS reanalysis database. Figure 2 presents the offshore CMEMS points (white dots) as well as the coastal zones impacted by the incident wave energy (highlighted areas). The data were statistically analyzed, and the nearshore wave characteristics were estimated.
Due to the orientation and sediment composition of the beaches, the association between the incident wave energy and coastal erosion was only applied to the Torre Mozza and Lido Marini coastlines (Figure 2, red highlighted zone). The northern rocky coastline of Ugento National Park (Figure 2, zone colored in blue) and the artificially protected sandy coastline from Torre San Giovanni to Fontanelle (Figure 2, colored in yellow) were excluded from the wave study due to their almost perpendicular orientation to the incident waves, favoring the cross-shore and not the long-shore sediment transport.
According to the wave analysis, the southern offshore area (point 168329) shows the maximum wave activity, with the most prevalent wave directions from SW and S. The average significant wave height was about 0.78 m, with extreme weather events resulting in waves as high as 5.6 m. The wave activity is also significantly high in the central and north offshore areas (CMEMS points 169040 and 169740, respectively). The mean significant wave height in the central region is roughly 0.72 m and approximately 0.68 m in the northern zone, with waves mainly propagating from the SSW and SW. In severe storms (about 10 per year), significant wave heights of up to 5 m were observed. In general, storm events increased significant wave heights, exceeding 4 m in the offshore marine area of Ugento (Table 2).
The orientation of the Torre Mozza and the Lido Marini beach promotes the longshore sediment transport from the induced wave energy. The period 2012–2015 was the most energetic with an average incident wave power of 847.74 J m−1s−1, theoretical sediment longshore flux moving from West to East of about 41.87 m3s−1, and Wave Induced Longshore Current (from west to east) of about 0.026 m s−1. This period coincides with the higher erosion rate observed in Torre Mozza (−8.51 m year−1) and Lido Marini (−3.16 m year−1). In periods 2009-2012 and 2015-2018, high longshore wave power (773.00 and 632.80 J m−1s−1) and sediment longshore flux (3805.84 and 3113.77 m3s−1) are observed. However, the magnitude of the wave-induced longshore current (0.013 and 0.021 m s−1) is low, illustrating that the longshore sediment budget remains moderately unbalanced, and the coastal erosion rate is lower in both sandy beaches (Table 4).
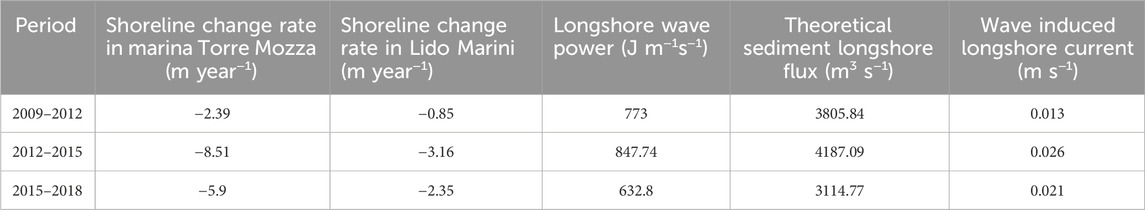
Table 4. Mean erosion rate, longshore wave power, and wave-induced longshore current and theoretical longshore sediment flux at the Ugento coastal zone.
4 Discussion
4.1 Unravelling erosion patterns: Lessons learned from case studies
The coastal zones of Messolonghi (Greece) and Ugento (Italy) are characterized by long sandy beaches with significant ecological and touristic interest. Messolonghi represents a natural coastal area with minimal human intervention, featuring Greece’s largest lagoon ecosystem, which connects to the open sea through fourteen channels. In contrast, Ugento is a more urbanized region, with numerous tourist settlements along its coastline, particularly active during the summer months. Ugento’s wetlands and water ponds are linked to the open sea through five channels. From an ecological and geomorphological perspective, both areas exemplify the interaction between inland water systems and the open sea, with sediment transport playing a crucial role in shaping their coastal zones.
Despite their geographical and environmental differences, both locations face coastal erosion concerns. In Messolonghi, erosion is primarily influenced by wave activity and a reduced sediment supply from rivers due to damming. In Ugento, frequent storms and strong waves, combined with anthropogenic interventions along the coastline (e.g., coastal infrastructure development in Lido Marini, and harbor construction in Torre San Giovanni), have exacerbated erosion in several areas. While Messolonghi’s natural barriers, such as the islets of Schinia and Komma, help shield the coastline from stormy waves, Ugento has witnessed progressive shoreline retreat, particularly around the Marina of Torre Mozza, where approximately 1.5 km of sandy beach was lost between 2005 and 2017.
Klisova Beach, another area of interest, experiences significant sediment accumulation along the coasts near the Klisova lagoon channels. Occasionally, sediment accumulation blocks the inlet channel, trapping freshwater inflow into the lagoon and leading to flooding. The upstream construction of a dam at the Evinos River mouth has further disrupted the sediment supply to the coastal zone. This has intensified erosion in the Evinos River mouth, directly linking the observed shoreline retreat to freshwater retention and reduced sediment transport.
The identification of erosion hotspots has been supported by satellite image analysis, with RapidEye images providing a 5 m resolution, ensuring accurate shoreline positioning. Regardless of the method applied, the continuous and rapid changes in coastline morphology due to the proximity of river deltas and coastal lagoons may induce uncertainties and errors. These uncertainties may affect the semi-automatic image classification technique applied in this study, especially in areas with intricate coastline features. To minimize potential errors, a meticulous comparison between automated results and visually identified reference shorelines was conducted during the preliminary stages of the classification. Additionally, the accuracy of shoreline positioning is directly influenced by the pixel size of the satellite image. This high-resolution data allowed for more precise identification of erosion and accretion hotspots, increasing confidence in the results.
Moreover, as the shoreline evolution analysis considered both natural dynamics and human-induced changes, the most vulnerable locations, such as the Evinos River mouth in Messolonghi and Torre Mozza in Ugento, were identified. Although the two regions differ regarding geographic location, wave exposure, and human intervention, coastal erosion remains a shared challenge, emphasizing the need for sustainable coastal management to protect their ecological integrity and tourism value. The proposed methodology provides a reliable tool to evaluate shoreline changes over time in diverse geographical and geomorphological settings. This approach aligns with previous studies, such as Manno et al. (2023), who applied similar methodologies to assess coastal erosion vulnerability along the Sicilian coastline, utilizing shoreline change data and CMEMS offshore wave data.
Today, the Messolonghi coastal area faces compounded pressure from both climatic and anthropogenic drivers: The increase in extreme weather events combined with gradual sea level rise exacerbates the system’s exposure and vulnerability. On the other hand, human interventions—such as river damming, land reclamation, and wetland drainage—have disrupted the ecosystem’s natural defenses, reducing its ability to adapt or recover from external shocks.
4.2 Decoding wave dynamics in Messolonghi (Greece) and Ugento (Italy)
Wave dynamics significantly differ between Messolonghi and Ugento, shaping distinct coastal erosion processes in each region. Messolonghi benefits from partial protection due to its position within the Gulf of Patras, with only the western coast exposed to high waves originating from WNW-SSW directions. The average wave height in Messolonghi is 0.37 m, with a maximum height of 2.24 m. In contrast, Ugento’s coastline is highly exposed to wave activity from the S-SSW direction, with an average wave height of 0.78 m and a maximum height of 5.6 m. The incident wave energy in Ugento is approximately ten times stronger than in Messolonghi, resulting in more intense longshore sediment transport and higher erosion rates.
To analyze these processes, this study applied a simple wave propagation model, similar to previous studies that used one-line shoreline evolution approaches (Ashton and Murray, 2006; Hurst et al., 2015). Based on the linear wave theory, the model assessed the longshore sediment transport, which is highly sensitive to wave climate characteristics (e.g., significant wave height, peak period, and, most importantly, wave direction). It simulated wave transformation from deep water through the surf zone, accounting for wave transformation processes such as shoaling, refraction, and breaking, while ultimately assessing the wave-driven longshore sediment transport rate. The model was forced by the offshore wave data from CMEMS reanalysis products to ensure a data-driven approach. This led to an empirical and process-based method that efficiently simulated shoreline evolution at broader temporal and spatial scales, given its numerical simplicity and low computational cost (Chataigner et al., 2022).
The analysis of sediment transport patterns in the study sites (i.e., Louros beach, Kleisova beach, and Lido Marini) revealed key similarities. Sediment moves alongshore due to wave-induced sea currents, accumulating in adjacent coastal areas. Both Louros Beach (Greece) and Lido Marini (Italy) were exposed to southward waves, with westward sea currents transporting sediments from west to east. This process leads to erosion along the western coasts and sediment accretion in the eastern sections. However, extreme storm events and floods have exacerbated erosion in vulnerable locations such as the Evinos River mouth, Schinias, Komma, and the Marina of Torre Mozza.
Natural barriers play an essential role in reducing coastal erosion risk in Messolonghi. The islets of Schinia and Komma, along with the coast of Prokopanistos, help reduce the impact of storm waves, safeguarding the fishing infrastructure at the mouth of the lagoon. However, extreme weather conditions, mainly from the SW direction, have caused severe damage, destroyed dams, and released farmed fish into the open sea. Preserving and protecting Prokopanistos Beach and the Schinias and Komma islets is crucial to preventing further coastal degradation.
4.3 Innovative transformative solutions for coastal resilience
This study evaluates coastal erosion risk in the two case studies, providing a detailed analysis of the factors contributing to shoreline evolution. Their sandy coasts are particularly vulnerable to extreme storm surges and rising sea levels, while anthropogenic developments, such as coastal structures and infrastructures, further disrupt sediment balance (Pantusa et al., 2018; Foti et al., 2022).
Historically, coastal defense infrastructures, such as groin systems and breakwaters, were widely implemented to reduce erosion risk. These structures help stabilize shorelines by interrupting sediment transport and dissipating wave energy. However, while they provide localized protection, they often shift erosion downdrift, leading to unintended negative consequences in adjacent areas (Scardino et al., 2020; Corbau et al., 2023). To address this challenge, hard infrastructures should be carefully designed and complemented by more sustainable approaches that reduce erosion vulnerability while enhancing the health and resilience of the coastal marine system.
In recent years, Nature-based Solutions (NbS) and hybrid approaches have gained recognition as more sustainable and adaptable alternatives to traditional hard engineering for climate change adaptation and disaster risk reduction (European Environment Agency et al., 2021). These approaches leverage natural processes to mitigate erosion, enhance biodiversity, and maintain ecosystem functionality. Specifically, they apply ecosystem-based principles to tackle societal challenges, including climate change (Seddon et al., 2020). Practical examples include dune restoration, beach nourishment, and soft engineering techniques. Recognizing their benefits, both Messolonghi and Ugento municipalities have begun integrating these innovative strategies into their coastal management plans to address the growing risks of shoreline retreat.
In Ugento, where tourism plays a crucial economic role, significant coastal retreat has been observed in key locations such as Lido Marini and Torre Mozza (see Section 3.3). Regional and local authorities have implemented several NbS, including dune restoration projects, to counteract this trend. One of the most notable initiatives carried out between 2007 and 2013 (Comune et al., 2014) involved the reconstruction of eroded and degraded dunes using a circular approach that repurposes beached Posidonia leaves, naturally deposited onshore. The coastline of Ugento, rich in seagrass vegetation, is widely covered by Posidonia oceanica, which plays a dual role in sediment dynamics. While their accumulation helps trap sand, reducing its transport across the beach, they also obstruct drainage channels. Traditionally classified as urban waste, the removal of Posidonia deposits incurs significant disposal costs. To overcome this challenge, beached Posidonia leaves from channel mouths have been repurposed to restore and protect degraded dune systems. These leaves enhance erosion control, serve as a natural fertilizer enriching the soil with nutrients essential for supporting the regrowth of native dune vegetation, and provide habitat for various organisms. By preserving beaches during winter storms, they sustain the local tourism economy in summer while eliminating the need for costly landfill disposal. This strategy, implemented within a well-defined regulatory framework, maximizes the ecological benefits of Posidonia deposits and demonstrates a cost-effective, nature-based approach to coastal management that minimizes environmental impact.
A viable solution for protecting the eroded beaches in Messolonghi from destructive waves and extreme storm events is the application of soft engineering techniques. One widely adopted approach involves using geotubes, fabric containers filled with dredged material that function as artificial groins, onshore or offshore breakwaters (Koerner and Koerner, 2006). Compared to traditional coastal protection methods, such as rock armor, concrete units, or asphalt, geosystems offer significant advantages, including reduced construction volume, faster execution, and lower costs, as well as the use of locally available materials and low-skilled labor (Stanley and Lewis, 2009). Several studies indicate that geotube breakwaters can be constructed at just 30% of the cost of conventional rubble mound breakwaters, making them a cost-effective alternative for protecting beaches from destructive waves and storms (Sheehan et al., 2009; Sheehan and Harrington, 2012). The flexibility of this approach offers an opportunity to adapt to changing environmental conditions. It is well-suited to areas where conventional, hard-engineering methods may not be feasible or environmentally desirable. Their deployment is particularly recommended for the entrance of the Messolonghi lagoon, where they can help prevent the erosion of small sandy inlets, caused by extreme waves from the SW-WSW direction, while safeguarding the aquaculture activities within the lagoon from extreme wave events. Geotubes can be proposed as a coastal protection measure for the eroded shorelines within the study areas. Their deployment is expected to reduce the incoming wave energy and mitigate the rate of coastal erosion. Specifically, further investigation is recommended for the eroded shores of Lido Marini and Marina di Torre Mozza in the Ugento region, which are highly exposed to energetic wave conditions, with wave energy reaching up to 847.74 J m−1s−1, predominantly from the south-southwest (S-SSW) direction. Combining this approach with other restoration initiatives, such as dune rehabilitation or the plantation of native vegetation, may constitute a hybrid adaptation strategy that integrates engineered protection with nature-based resilience.
Beyond geotubes and dune restoration, to further enhance coastal resilience, additional strategic actions should be considered in both study areas. These include beach nourishment to replenish eroded shorelines with sediment sourced from offshore deposits, soft engineering interventions, such as sand fences and vegetation planting, to stabilize dunes and reduce wind-driven erosion, and adaptation of coastal infrastructure, ensuring that hard engineering solutions are designed in a way that minimizes negative impacts on adjacent areas. By integrating these approaches, a multi-layered adaptation strategy can be developed, balancing coastal protection with environmental conservation and socio-economic sustainability. For local authorities, implementing these innovative strategies represents a crucial opportunity to proactively manage coastal risks, preserve natural ecosystems, and safeguard key economic sectors such as tourism and fisheries. By integrating nature-based and hybrid approaches into broader coastal management frameworks, municipalities can enhance resilience, reduce economic losses, and support sustainable development in Messolonghi and Ugento.
As climate change accelerates coastal erosion and extreme weather events, traditional hard infrastructure alone is no longer a sufficient response (European et al., 2021). The new frontiers of coastal adaptation, such as nature-based and hybrid solutions, offer promising alternatives that align with ecological processes while ensuring long-term shoreline stability. This study provides valuable insights into where these adaptation measures can be effectively implemented, offering a pathway toward sustainable and adaptive coastal management in Mediterranean regions facing similar erosion challenges. This research contributes to the growing legacy of EU-funded initiatives, reinforcing the importance of cross-border collaboration in addressing coastal risks. The insights from this study align with other European projects, such as DesirMED4, AcquaGuard5, and Hermes6, which aim to develop transformative coastal management strategies across the Mediterranean region. By leveraging shared knowledge, technological advancements, and policy integration, these projects collectively pave the way for a more resilient and sustainable future for coastal communities, while preserving natural ecosystems.
5 Conclusion
This study aimed to evaluate coastal erosion risk in the two case studies, Iera Polis of Messolonghi (Greece) and Ugento (Italy), by combining shoreline evolution analysis with wave dynamics. Through this integrated approach, the study identified key erosion patterns, sediment accumulation areas, erosion hotspots, and longshore sediment transport processes, providing a comprehensive understanding of coastal vulnerability in these regions.
The results highlight that both case studies experience significant coastal erosion, though the driving factors differ. In Messolonghi, erosion is primarily influenced by wave activity and reduced sediment supply due to river damming, while in Ugento, frequent storms, high wave energy, and human interventions along the coastline have accelerated shoreline retreat.
This study also explores the potential implementation of NbS and hybrid adaptation strategies as sustainable and cost-effective alternatives to traditional coastal protection methods. In Ugento, the use of beached Posidonia leaves for dune restoration has proven to be an effective NbS, helping stabilize sediment, enhance biodiversity, and support ecosystem resilience while maintaining the local tourism economy. Meanwhile, in Messolonghi, the application of geotubes has been identified as a promising hybrid solution, reducing wave energy impact and safeguarding aquaculture activities from extreme coastal events.
Beyond these, additional strategic measures should be integrated into a multi-layered coastal adaptation strategy, ensuring the balance between coastal protection, environmental conservation, and socio-economic sustainability. As climate change accelerates coastal erosion and extreme weather events, relying solely on traditional hard engineering solutions is no longer a viable approach. The new frontiers of coastal adaptation, including NbS and hybrid solutions, offer more sustainable, adaptable, and ecosystem-friendly alternatives that enhance long-term shoreline stability and resilience.
Data availability statement
The raw data supporting the conclusions of this article will be made available by the authors, without undue reservation.
Author contributions
KZ: Data curation, Formal Analysis, Investigation, Methodology, Software, Visualization, Writing – original draft, Validation, Writing – review and editing. NK: Data curation, Formal Analysis, Methodology, Software, Visualization, Writing – original draft, Investigation, Validation. MD: Conceptualization, Data curation, Formal Analysis, Investigation, Methodology, Visualization, Writing – original draft. EF: Conceptualization, Investigation, Methodology, Writing – original draft. HP: Conceptualization, Data curation, Formal Analysis, Investigation, Methodology, Visualization, Writing – original draft. ST: Funding acquisition, Project administration, Writing – review and editing. AC: Supervision, Writing – review and editing. GS: Conceptualization, Funding acquisition, Methodology, Project administration, Resources, Supervision, Writing – original draft, Writing – review and editing.
Funding
The author(s) declare that financial support was received for the research and/or publication of this article. This research was implemented in the framework of the research project “DesirMED - Demonstration and mainstreaming of Nature-based Solutions for Climate Resilient transformation in the Mediterranean”, a project funded under the Horizon Europe Program that prioritizes Nature-based Solutions (NbS), innovative technologies and social practices to accelerate the transformation towards climate adaptation and resilience in the Mediterranean.
Conflict of interest
The authors declare that the research was conducted in the absence of any commercial or financial relationships that could be construed as a potential conflict of interest.
Generative AI statement
The author(s) declare that Generative AI was used in the creation of this manuscript. The author(s) verify and take full responsibility for the use of generative AI in the preparation of this manuscript. Generative AI was used to assist in language editing and improving the clarity of the text. The authors reviewed, edited, and approved all AI-generated content to ensure accuracy and integrity.
Publisher’s note
All claims expressed in this article are solely those of the authors and do not necessarily represent those of their affiliated organizations, or those of the publisher, the editors and the reviewers. Any product that may be evaluated in this article, or claim that may be made by its manufacturer, is not guaranteed or endorsed by the publisher.
Footnotes
1https://earthexplorer.usgs.gov/
2https://scihub.copernicus.eu/
3https://www.planet.com/explorer/
4DesirMED (Demonstration and mainstrEaming of nature-based Solutions for climate Resilient transformation in the MEDiterranean) project, funded by HORIZON Europe Research and Innovation actions in support of the implementation of the Adaptation to Climate Change Mission (HORIZON-MISS-2022-CLIMA-01): https://www.desirmed.eu/.
5AcquaGuard (Nature based solutions for Flood Prevention) project, funded by the Italy–Croatia INTERREG Programme: https://www.italy-croatia.eu/web/acquaguard.
6HERMES (A HarmonizEd fRamework to Mitigate coastal EroSion promoting ICZM protocol implementation) project, funded by INTERREG BalkanMED Programme: http://www.interreg-balkanmed.eu/approved-project/18/.
References
Aguilera-Vidal, M., Muñoz-Perez, J. J., Contreras, A., Contreras, F., Lopez-Garcia, P., and Jigena, B. (2022). Increase in the erosion rate due to the impact of climate change on sea level rise: victoria beach, a case study. J. Mar. Sci. Eng. 10, 1912. doi:10.3390/jmse10121912
Almeida, L. P., Efraim De Oliveira, I., Lyra, R., Scaranto Dazzi, R. L., Martins, V. G., and Henrique Da Fontoura Klein, A. (2021). Coastal analyst system from space imagery engine (CASSIE): shoreline management module. Software 140, 105033. doi:10.1016/j.envsoft.2021.105033
Alvarez, K. R., Bachofer, F., and Kuenzer, C. (2025). Potential of Earth observation for the German north sea coast—a review. Remote Sens. 17, 1073. doi:10.3390/rs17061073
Angileri, S. E., Conoscenti, C., Hochschild, V., Märker, M., Rotigliano, E., and Agnesi, V. (2016). Water erosion susceptibility mapping by applying stochastic gradient treeboost to the imera meridionale river basin (sicily, Italy). Geomo 262, 61–76. doi:10.1016/j.geomorph.2016.03.018
Antoniadis, N., Alatza, S., Loupasakis, C., and Kontoes, C. (2023). Land subsidence phenomena vs. Coastal flood hazard—the cases of Messolonghi and aitolikon (Greece). Remote Sens. 15, 2112. doi:10.3390/rs15082112
Arif, N., Danoedoro, P., and Hartono, (2017). Analysis of artificial neural network in erosion modeling: a case study of serang watershed. IOP Conf. Ser. Earth Environ. Sci. 98, 012027. doi:10.1088/1755-1315/98/1/012027
Ashton, A. D., and Murray, A. B. (2006). High-angle wave instability and emergent shoreline shapes: 1. Modeling of sand waves, flying spits, and capes. J. Geophys. Res. Earth Surf. 111. doi:10.1029/2005jf000422
Avino, A., Cimorelli, L., Furcolo, P., Noto, L. V., Pelosi, A., Pianese, D., et al. (2024). Are rainfall extremes increasing in southern Italy? JHyd 631, 130684. doi:10.1016/j.jhydrol.2024.130684
Bombino, G., Barbaro, G., D'agostino, D., Denisi, P., Foti, G., Labate, A., et al. (2022). Shoreline change and coastal erosion: the role of check dams. First indications from a case study in Calabria, southern Italy. Catena 217, 106494. doi:10.1016/j.catena.2022.106494
Chataigner, T., Yates, M. L., Le Dantec, N., Harley, M. D., Splinter, K. D., and Goutal, N. (2022). Sensitivity of a one-line longshore shoreline change model to the mean wave direction. Coast. Eng. 172, 104025. doi:10.1016/j.coastaleng.2021.104025
Comune, Di U., Liviello, L., Raho, G., Ufficio Ambiente Del Comune Di, U., and Area Tecnica Del Consorzio Di Bonifica Di, U. (2014). “Azioni di valorizzazione del ruolo ecologico-ambientale dei resti di Posidonia oceanica spiaggiata attraverso la ricostituzione dei cordoni dunali degradati del litorale di Ugento”.
Congedo, L. (2016). Semi-automatic classification plugin documentation. Release 4. doi:10.13140/RG.2.2.29474.02242/1
Copernicus Marine Service (2024). Mediterranean Sea waves reanalysis. MEDSEA_MULTIYEAR_WAV_006_012. doi:10.25423/cmcc/medsea_multiyear_wav_006_012
Corbau, C., Buoninsegni, J., Olivo, E., Vaccaro, C., Nardin, W., and Simeoni, U. (2023). Understanding through drone image analysis the interactions between geomorphology, vegetation and marine debris along a sandy spit. Mar. Pollut. Bull. 187, 114515. doi:10.1016/j.marpolbul.2022.114515
Crowell, M., Leatherman, S. P., and Buckley, M. K. (1991). Historical shoreline change: error analysis and mapping accuracy. J. Coast. Res. 7, 839–852.
Dada, O. A., Almar, R., and Morand, P. (2024). Coastal vulnerability assessment of the West African coast to flooding and erosion. Sci. Rep. 14, 890. doi:10.1038/s41598-023-48612-5
Dal Barco, M. K., Furlan, E., Pham, H. V., Torresan, S., Zachopoulos, K., Kokkos, N., et al. (2024). Multi-scenario analysis in the Apulia shoreline: a multi-tiers analytical framework for the combined evaluation and management of coastal erosion and water quality risks. Environ. Sci. Policy 153, 103665. doi:10.1016/j.envsci.2023.103665
Delle Rose, M., Martano, P., and Orlanducci, L. (2021). Coastal boulder dynamics inferred from multi-temporal satellite imagery, geological and meteorological investigations in southern Apulia, Italy. Water 13, 2426. doi:10.3390/w13172426
Del Vecchio, P., and Passiante, G. (2017). Is tourism a driver for smart specialization? Evidence from Apulia, an Italian region with a tourism vocation. J. Destin. Mark. Manag. 6, 163–165. doi:10.1016/j.jdmm.2016.09.005
Dike, E., Godfrey, A., and Efeovbokhan, O. (2024). Shoreline position trends in the Niger Delta: analyzing spatial and temporal changes through Sentinel-1 SAR imagery. Geomat. Nat. Hazards Risk 15. doi:10.1080/19475705.2024.2346150
El-Asmar, H. M., Hereher, M. E., and El Kafrawy, S. B. (2013). Surface area change detection of the Burullus Lagoon, North of the Nile Delta, Egypt, using water indices: a remote sensing approach. J. Remote Sens. Space Sci. 16, 119–123. doi:10.1016/j.ejrs.2013.04.004
Erdem, F., Bayram, B., Bakirman, T., Bayrak, O. C., and Akpinar, B. (2021). An ensemble deep learning based shoreline segmentation approach (WaterNet) from Landsat 8 OLI images. Adv. Space Res. 67, 964–974. doi:10.1016/j.asr.2020.10.043
European Environment Agency, , Castellari, S., Zandersen, M., Davis, M., Veerkamp, C., Förster, J., et al. (2021). Nature-based solutions in Europe policy, knowledge and practice for climate change adaptation and disaster risk reduction. Publications Office.
Filippaki, E., Tsakalos, E., Kazantzaki, M., and Bassiakos, Y. (2023). Forecasting impacts on vulnerable shorelines: vulnerability assessment along the coastal zone of Messolonghi area—western Greece. Climate 11, 24. doi:10.3390/cli11010024
Foti, G., Barbaro, G., and D’alessandro, F. (2022). Editorial: innovations in coastal erosion risk assessment and mitigation. Front. Mar. Sci. 9. doi:10.3389/fmars.2022.1066989
Genz, A., Fletcher, C., Dunn, R., Frazer, N., Rooney, J., Fletcher, A., et al. (2007). The predictive accuracy of shoreline change rate methods and alongshore beach variation on maui, hawai'i. J. Coast. Res. 23. doi:10.2112/05-0521.1
Gianni, A., and Zacharias, I. (2012). Modeling the hydrodynamic interactions of deep anoxic lagoons with their source basins. Estuar. Coast. Shelf Sci. 110, 157–167. doi:10.1016/j.ecss.2012.04.030
Gorelick, N., Hancher, M., Dixon, M., Ilyushchenko, S., Thau, D., and Moore, R. (2017). Google Earth engine: planetary-scale geospatial analysis for everyone. Remote Sens. Environ. 202, 18–27. doi:10.1016/j.rse.2017.06.031
Hereher, M. E. (2015). Coastal vulnerability assessment for Egypt’s Mediterranean coast. Geomat. Nat. Hazards Risk 6, 342–355. doi:10.1080/19475705.2013.845115
Hurst, M. D., Barkwith, A., Ellis, M. A., Thomas, C. W., and Murray, A. B. (2015). Exploring the sensitivities of crenulate bay shorelines to wave climates using a new vector-based one-line model. J. Geophys. Res. Earth Surf. 120, 2586–2608. doi:10.1002/2015jf003704
Irani, M., Naderi, M. M., Massah Bavani, A. R., Hassanzadeh, E., and Moftakhari, H. (2024). A framework for coastal flood hazard assessment under sea level rise: application to the Persian Gulf. J. Environ. Manage 349, 119502. doi:10.1016/j.jenvman.2023.119502
Jigena-Antelo, B., Estrada-Ludeña, C., Howden, S., Rey, W., Paz-Acosta, J., Lopez-García, P., et al. (2023). Evidence of sea level rise at the Peruvian coast (1942–2019). Sci. Total Environ. 859, 160082. doi:10.1016/j.scitotenv.2022.160082
Ketchum, D., Jencso, K., Maneta, M. P., Melton, F., Jones, M. O., and Huntington, J. (2020). IrrMapper: a machine learning approach for high resolution mapping of irrigated agriculture across the western U.S. Remote Sens. 12, 2328. doi:10.3390/rs12142328
Koerner, G. R., and Koerner, R. M. (2006). Geotextile tube assessment using a hanging bag test. Geotext. Geomembr. 24, 129–137. doi:10.1016/j.geotexmem.2005.02.006
Leonardos, I., and Sinis, A. (1998). Reproductive strategy of aphanius fasciatus nardo, 1827 (pisces: cyprinodontidae) in the mesolongi and etolikon lagoons (W. Greece). Fish. Res. 35, 171–181. doi:10.1016/s0165-7836(98)00082-4
Liordos, V., Pergantis, F., Perganti, I., and Roussopoulos, Y. (2014). Long-term population trends reveal increasing importance of a Mediterranean wetland complex (Messolonghi lagoons, Greece) for wintering waterbirds. Zool. Stud. 53, 12. doi:10.1186/1810-522x-53-12
Louati, M., Saïdi, H., and Zargouni, F. (2015). Shoreline change assessment using remote sensing and GIS techniques: a case study of the Medjerda delta coast Tunisia, 4239–4255.
Manno, G., Azzara, G., Lo Re, C., Martinello, C., Basile, M., Rotigliano, E., et al. (2023). An approach for the validation of a coastal erosion vulnerability index: an application in sicily. J. Mar. Sci. Eng. 11, 23. doi:10.3390/jmse11010023
Mimikou, M., and Baltas, E. (2013). Assessment of climate change impacts in Greece: a general overview. Am. J. Clim. Change (AJCC) 02, 46–56. doi:10.4236/ajcc.2013.21005
Molina, R., Manno, G., Villar, A. C., Jigena-Antelo, B., Muñoz-Pérez, J. J., Cooper, J. a.G., et al. (2025). The effects of anthropic structures on coastline morphology: a case study from the málaga coast (Spain). J. Mar. Sci. Eng. 13, 319. doi:10.3390/jmse13020319
Moretti, M., Tropeano, M., Loon, A. J. V., Acquafredda, P., Baldacconi, R., Festa, V., et al. (2016). Texture and composition of the Rosa Marina beach sands (Adriatic coast, southern Italy): a sedimentological/ecological approach. Geologos 22, 87–103. doi:10.1515/logos-2016-0011
Mukhopadhyay, A., Sandip, M., Samadrita, M., Subhajit, G., Sugata, H., and Mitra, D. (2012). Automatic shoreline detection and future prediction: a case study on Puri Coast, Bay of Bengal, India. Eur. J. Remote Sens. 45, 201–213. doi:10.5721/eujrs20124519
Pantusa, D., D’alessandro, F., Riefolo, L., Principato, F., and Tomasicchio, G. R. (2018). Application of a coastal vulnerability index. A case study along the apulian coastline, Italy. Water 10, 1218. doi:10.3390/w10091218
Pearce, W., Mahony, M., and Raman, S. (2018). Science advice for global challenges: learning from trade-offs in the IPCC. Environ. Sci. Policy 80, 125–131. doi:10.1016/j.envsci.2017.11.017
Peponi, A., Morgado, P., and Trindade, J. (2019). Combining artificial neural networks and GIS fundamentals for coastal erosion prediction modeling, 11. Sustain. doi:10.3390/su11040975
Petropoulos, G. P., Kalivas, D. P., Griffiths, H. M., and Dimou, P. P. (2015). Remote sensing and GIS analysis for mapping spatio-temporal changes of erosion and deposition of two Mediterranean river deltas: the case of the Axios and Aliakmonas rivers, Greece. Int. J. Appl. Earth Obs. Geoinf. 35, 217–228. doi:10.1016/j.jag.2014.08.004
Prasad, D., and Kumar, N. (2014). Coastal erosion studies—a review. Int. J. Geosci. 5, 341–345. doi:10.4236/ijg.2014.53033
Psomiadis, E., Charizopoulos, N., Soulis, K. X., and Efthimiou, N. (2020). Investigating the correlation of tectonic and morphometric characteristics with the hydrological response in a Greek river catchment using Earth observation and geospatial analysis techniques. Geosciences 10, 377. doi:10.3390/geosciences10090377
Rahmati, O., Tahmasebipour, N., Haghizadeh, A., Pourghasemi, H. R., and Feizizadeh, B. (2017). Evaluation of different machine learning models for predicting and mapping the susceptibility of gully erosion. Geomo 298, 118–137. doi:10.1016/j.geomorph.2017.09.006
Romine, B., Fletcher, C., Frazer, N., Genz, A., Barbee, M., and Lim, S.-C. (2009). Historical shoreline change, southeast oahu, Hawaii; applying polynomial models to calculate shoreline change rates. J. Coast. Res. 25, 1236–1253. doi:10.2112/08-1070.1
Roy, P. P., Abdullah, M. S., and Siddique, I. M. (2024). Machine learning empowered geographic information systems: advancing Spatial analysis and decision making. World J. Adv. Res. Rev. 22, 1387–1397. doi:10.30574/wjarr.2024.22.1.1200
Scardino, G., Sabatier, F., Scicchitano, G., Piscitelli, A., Milella, M., Vecchio, A., et al. (2020). Sea-level rise and shoreline changes along an open sandy coast: case study of gulf of Taranto, Italy. Water 12, 1414. doi:10.3390/w12051414
Seddon, N., Chausson, A., Berry, P., Girardin, C. a.J., Smith, A., and Turner, B. (2020). Understanding the value and limits of nature-based solutions to climate change and other global challenges. Philos. Trans. R. Soc. B Biol. Sci. 375, 20190120. doi:10.1098/rstb.2019.0120
Sheehan, C., and Harrington, J. (2012). An environmental and economic analysis for geotube coastal structures retaining dredge material. Resour. Conserv. Recycl. 61, 91–102. doi:10.1016/j.resconrec.2012.01.011
Sheehan, C., Harrington, J. R., and Murphy, J. D. (2009). An overview of dredging and dredge material beneficial use in Ireland. Terra Aqua, 3–14.
Stanley, O. D., and Lewis, R. R. I. (2009). Strategies for mangrove rehabilitation in an eroded coastline of selangor, peninsular Malaysia. J. Coast. Zone Manag. 12, 142–154.
Thieler, E. R., Himmelstoss, E. A., Zichichi, J. L., and Ergul, A. (2009). “The Digital Shoreline Analysis System (DSAS) version 4.0-an ArcGIS extension for calculating shoreline change”.
Tsekouras, G. E., Rigos, A., Chatzipavlis, A., and Velegrakis, A. (2015). “A neural-fuzzy network based on hermite polynomials to predict the coastal erosion,” in Engineering applications of neural networks. Editors L. Iliadis, and C. Jayne (Springer International Publishing), 195–205.
U.S. Army Corps of Engineers (2008). Coastal engineering manual: overview and coastal hydrodynamics.
Van Rijn, L. C. (2011). Coastal erosion and control. Ocean. Coast. Manage. 54, 867–887. doi:10.1016/j.ocecoaman.2011.05.004
Vos, K., Splinter, K. D., Harley, M. D., Simmons, J. A., and Turner, I. L. (2019). CoastSat: a Google Earth Engine-enabled Python toolkit to extract shorelines from publicly available satellite imagery. Environ. Model. Softw. 122, 104528. doi:10.1016/j.envsoft.2019.104528
Vousdoukas, M. I., Ranasinghe, R., Mentaschi, L., Plomaritis, T. A., Athanasiou, P., Luijendijk, A., et al. (2020). Sandy coastlines under threat of erosion. Nat. Clim. Change 10, 260–263. doi:10.1038/s41558-020-0697-0
Keywords: coastal erosion, shoreline evolution, satellite images classification, GIS analysis, nature-based solutions
Citation: Zachopoulos K, Kokkos N, Dal Barco MK, Furlan E, Pham HV, Torresan S, Critto A and Sylaios G (2025) A harmonized framework to assess coastal erosion blending copernicus marine data products and satellite imagery along Greek and Italian shorelines. Front. Environ. Sci. 13:1602740. doi: 10.3389/fenvs.2025.1602740
Received: 30 March 2025; Accepted: 07 July 2025;
Published: 06 August 2025.
Edited by:
Ester A. Serrao, University of Algarve, PortugalReviewed by:
Paraskevi Drakopoulou, Hellenic Centre for Marine Research (HCMR), GreeceGiandomenico Foti, Mediterranea University of Reggio Calabria, Italy
Copyright © 2025 Zachopoulos, Kokkos, Dal Barco, Furlan, Pham, Torresan, Critto and Sylaios. This is an open-access article distributed under the terms of the Creative Commons Attribution License (CC BY). The use, distribution or reproduction in other forums is permitted, provided the original author(s) and the copyright owner(s) are credited and that the original publication in this journal is cited, in accordance with accepted academic practice. No use, distribution or reproduction is permitted which does not comply with these terms.
*Correspondence: Georgios Sylaios, Z3N5bGFpb3NAZW52LmR1dGguZ3I=