 Changai Li1
 Ling Liu
- 1School of Biological Engineering, Huainan Normal University, Huainan, China
- 2First Exploration Team of Anhui Coalfield Geological Bureau, Huainan, China
- 3Department of Landscape Architecture, Nanjing Forestry University, Nanjing, China
This research investigated the changes of land use as well as ecosystem service value (ESV) of the Huaihe River Ecological Economic Belt (HREEB) which is a critical ecological functional zone in China. This research utilised land-use data to analyse the spatiotemporal dynamics of land-use patterns of the HREEB. The patch-generating land-use simulation model was utilized to simulate land-use patterns under three distinct scenarios for the year 2030. The ESV was quantified using the equivalent factor method. Furthermore, Pearson correlation analysis and the geographic detector model were employed to examine the impacts of factors on the ESV. The results showed that (1) From 2000 to 2020, farmlands predominated as the primary land-use type, followed by artificial surfaces, forests and water bodies. The most notable land-use trend was the conversion of farmlands into artificial surfaces. (2) Between 2000 and 2005, the overall ESV rose, but from 2005 to 2020, it decreased. By 2030, the ESV under the ecological protection scenario would higher than other scenarios (3) Land-use types (espacially water bodies and artifical surfaces), NDVI and soil type were identified as the crucial drivers of ESV variation. Thus, our results can offers considerable theoretical insights for formulating environmental conservation and land-use strategies for the region.
1 Introduction
Ecosystem services encompass a wide array of immediate and collateral advantages that people obtain from natural environments (Hasan et al., 2020; Xia et al., 2023), including climate regulation, environmental remediation, soil conservation, resource provisioning and landscape aesthetic maintenance (Lin et al., 2023; Sannigrahi et al., 2020). A healthy ecosystem exhibits resilience in maintaining its structure, functionality and service provision under external pressures, without displaying evident signs of stress (Hernández-Blanco et al., 2022). Ecosystem services are not only indicative of ecosystem health but are also intrinsically linked to human wellbeing, serving as a critical foundation for sustainable socioeconomic development (Costanza et al., 2014). Nevertheless, rapid global economic growth and continuous population expansion have intensified human disturbances to natural ecosystems, resulting in widespread issues, including land degradation, vegetation cover reduction, water body area shrinkage and construction-land expansion (Li et al., 2020; Valle Junior et al., 2015). These changes have exacerbated ecological degradation, profoundly affecting regional biodiversity and socioeconomic activities (Ci et al., 2023). Over the past half-century, ecosystem services have significantly degraded in many regions (Bateman et al., 2013; Fang et al., 2021). Accordingly, the determination of ecosystem service value (ESV) has been a pivotal study hotspot in ecological and environmental sciences (Chen W. et al., 2021; Wang et al., 2014). The ESV quantifies the economic value of ecosystem services by translating them into monetary or commodity terms, offering a robust framework for understanding their dynamics and informing ecological conservation policies and sustainable development strategies (Liu et al., 2010; Sannigrahi et al., 2018).
Land-use change (LUC) is a primary driver of alterations in ecosystem service functions (Wang Y. et al., 2023). Consequently, analysing the dynamic variation of ESV based on LUC is a widely adopted research approach (Liu et al., 2020). Notably, ESV evaluations must consider the pronounced spatiotemporal dynamics of land-use patterns (Hu et al., 2019; Winkler et al., 2021). Early research primarily focused on elucidating the historical spatiotemporal dynamics of the ESV, while recent studies have increasingly emphasised on predicting future ESV trends through land-use simulations (Peng et al., 2021). Current methodologies for land-use simulations include the cellular automata (CA)–Markov model (Guan et al., 2019), conversion of land use and its effects (CLUE-S) model (Peng et al., 2019), future land-use simulation (FLUS) model (Chen Z. et al., 2021) and patch-generating land-use simulation (PLUS) model (Wang et al., 2024). Among them, the PLUS model has superior simulation accuracy, enabling the precise quantification of the contributions of driving factors to LUC (Liang et al., 2021).
Among these methods that are widely employed for calculating the ESV, the equivalent factor method is particularly suitable for regional and national-scale ESV assessments because of its intuitive nature and operational simplicity (Chen W. et al., 2021; Wang et al., 2014). Building on the foundational work of Costanza et al. (2014) and Xie et al. (2015) developed a method for determining ESV equivalent factors that was grounded in experts’ knowledges. This method not only quantifies the service values of diverse ecosystems but also captures the spatiotemporal dynamics of the ESV. To further enhance ESV calculation accuracy, scholars have refined the equivalent factors of ESV using region-specific parameters, such as grain yield, rainfall, normalised difference vegetation index (NDVI) (Fu et al., 2016; Niu et al., 2022; Xie et al., 2015).
Recently, research examining the effects of LUC on the ESV has increased, primarily targeting areas of significant economic growth and ecological sensitivity, such as the Yangtze River Delta (Li et al., 2019), Xinjiang (Wang et al., 2022) and the Qinghai–Tibet Plateau (Jiang et al., 2020). By contrast, the Huai River Basin, which is one of the cradles of Chinese civilisation, has received lesser attention. The Huaihe River Ecological Economic Belt (HREEB) has a superior geographical location. It is not only a transitional zone between the north and south of China, but also a transitional zone between subtropical monsoon climate and warm temperate climate. Therefore, it has rich biodiversity and profound cultural heritage. However, the distribution of rainfall throughout the year is uneven, making it prone to flooding and drought. The carrying capacity of water and soil resources is limited, and the ecological environment capacity is inhibited. As a region of ecological importance and vulnerability in China, the ecological service functions of this area play an important role in building an important ecological corridor for the transition zone between the north and south climates, improving the overall natural environment, and maintaining national ecological security. The HREEB serves not only as a crucial ecological barrier for China but also ranks among the most promising regions for development in the central-eastern portion of the nation. However, prolonged neglect has led to numerous challenges in the region, such as lagging economic growth and severe environmental degradation. In response, the Development Plan for the Huaihe River Ecological Economic Belt, which outlined comprehensive strategies to protect the area’s natural ecosystems and service functions, was issued in 2018. Consequently, research on land use and ESV in this region carries multi-faceted significance. From an ecological perspective, investigating how LUC affect climate regulation, hydrological processes, soil conservation and biodiversity can provide scientific foundations for establishing regional ecological security patterns. On the economic front, incorporating ecological values into development assessments facilitates green GDP accounting and promotes the transition from traditional industries to eco-friendly industries. At the social level, understanding the encroachment of cities on ecological spaces is beneficial for mediating urban-rural conflict. Regarding policy implications, the research outcomes can inform spatial planning and enhance inter-provincial collaborative governance, ensuring alignment with national strategic objectives. Collectively, this study holds substantial practical value for the region’ development.
The existing research on the ESV of the HREEB mainly took 10 years as a cycle (Wang Z. et al., 2023), while China’s development plan takes 5 years as a cycle. Using 10 years as a cycle often overlooked some valuable development laws and characteristics. The existing research on the driving factors of ESV in the HREEB was limited to using the correlation coefficient to analyze the relationship of landscape index and ESV, without considering the comprehensive effects of multiple driving factors on ESV at the spatial level. In addition, the main sources of grain planting area and yield data used to correct the ESV equivalent factor were often not detailed (Wang Z. et al., 2023). Against this backlog, this study took 5 years as a cycle to analyse the ESV and predict land-use patterns for 2030 in the HREEB. By applying Pearson correlation analysis and a geographic detector model, the study explored the spatial driving factors underlying the ESV variation. The main grain planting area and yield data of each city and county in the region were obtained. Some data that were not recorded in history were also replaced with reliable data, and the data sources were explained in detail to ensure that the research results were more scientific. The results offer a scientific basis for the creation of environmental conservation policies and strategic land management plans, and the layout of green industries, achieving coordinated economic and ecological development, and ultimately promoting high-quality regional development and ecological civilization construction.
2 Materials and methods
2.1 Study area
In 2018, the National Development and Reform Commission defined the HREEB area as encompassing regions along the trunk stream of the Huai River, its primary tributaries as well as the downstream Yishu–Sishui River system. This region spans five provinces—Jiangsu, Shandong, Anhui, Henan and Hubei—and includes 25 prefecture-level cities, three counties (Tongbai, Suixian and Dawu) and 1 county-level city (Guangshui). The mean yearly temperature in the region is recorded at 13.7°C, while the mean annual precipitation amounts to 992.88 mm. The geographic location of the HREEB is illustrated in Figure 1.
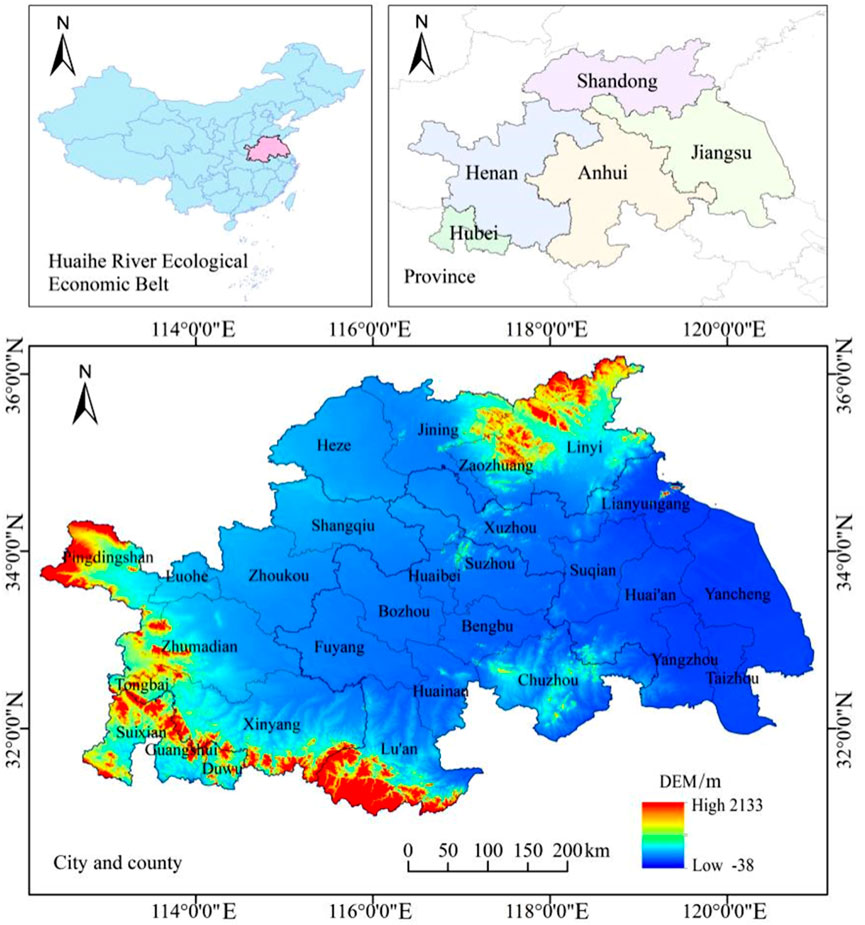
Figure 1. Geographic location of the HREEB.
2.2 Data sources
The land-use data for the 2000–2020 period, which boasts a spatial resolution of 30 m, were obtained from a dataset developed by Yang and Huang et al. of Wuhan University (Yang and Huang, 2021). Seven land-use types were included in the dataset: farmland, forest, shrubland, grassland, water body, barren land and artificial surfaces. Due to the unavailability of yield per unit area data of wheat, rice and corn for Suixian County, Guangshui City and Dawu County, the yield per unit area data of the Hubei were adopted. Other data sources are shown in Table 1 For the PLUS model, all vector data were converted into raster format, with the spatial coordinate system standardised to WGS 1984 Pseudo-Mercator and a uniform resolution of 30 m. Similarly, for the geographic detector model, the vector data were rasterised, and the spatial coordinate system was converted into the WGS 1984 Pseudo-Mercator, with a resolution of 5,000 m.
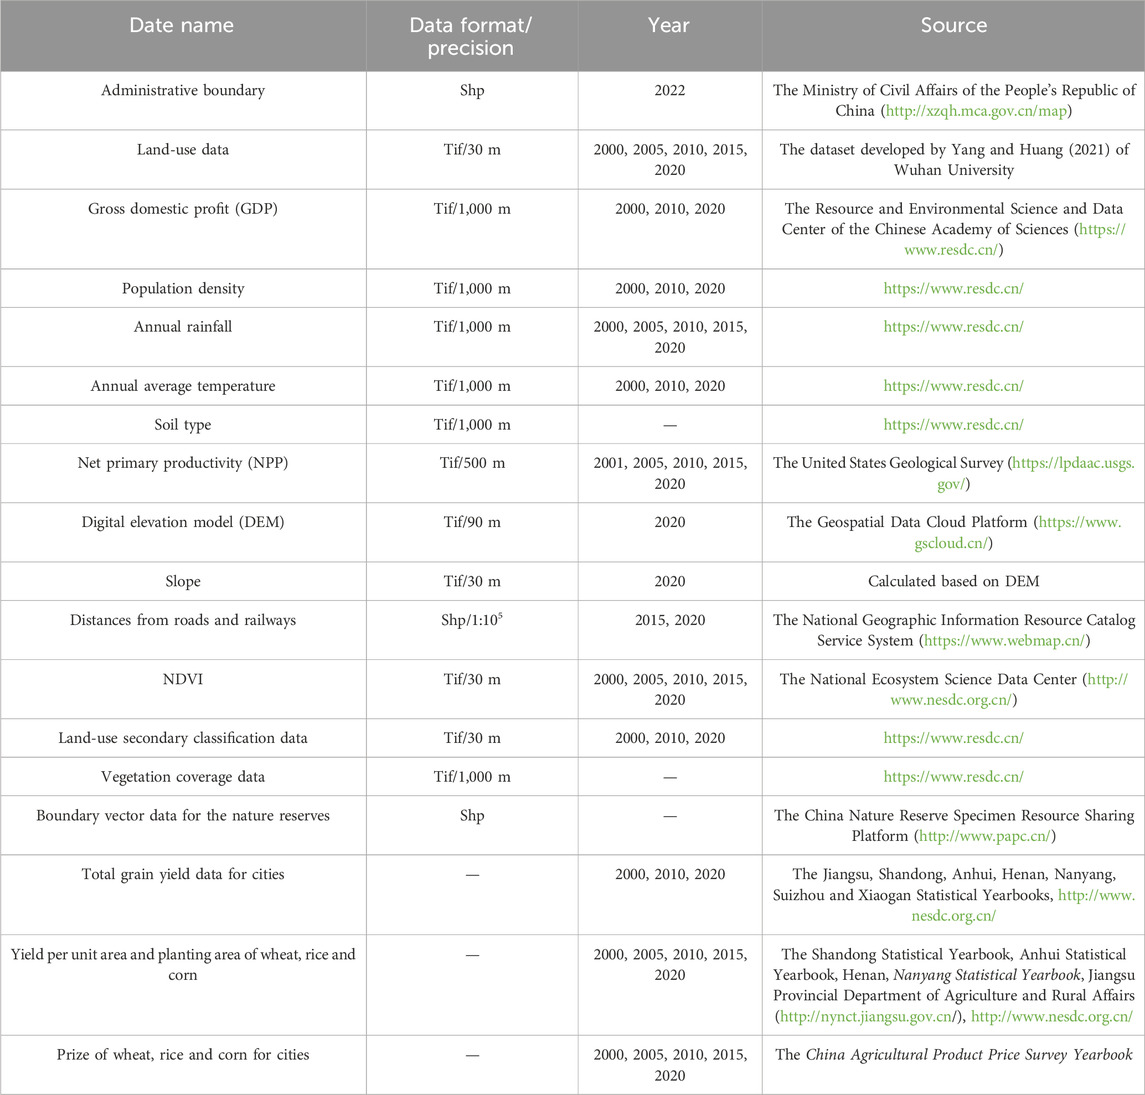
Table 1. Data sources.
2.3 Research methods
This research employed land-use data from 2000 to 2020 to analyse the spatiotemporal dynamics of land use in the HREEB. The PLUS model was employed to simulate land-use patterns under three scenarios for the year 2030. Utilizing the equivalent factor method and correction coefficients, the ESV equivalents of various land-use types in the HREEB were adjusted to compute the ESVs. Pearson correlation analysis was performed to analyse the impact of the LUC on the ESV, and geographic detector model, including single-factor and interactive detection, was conducted to study the effects of the LUC, NDVI, soil type, etc. on the ESV (Figure 2).
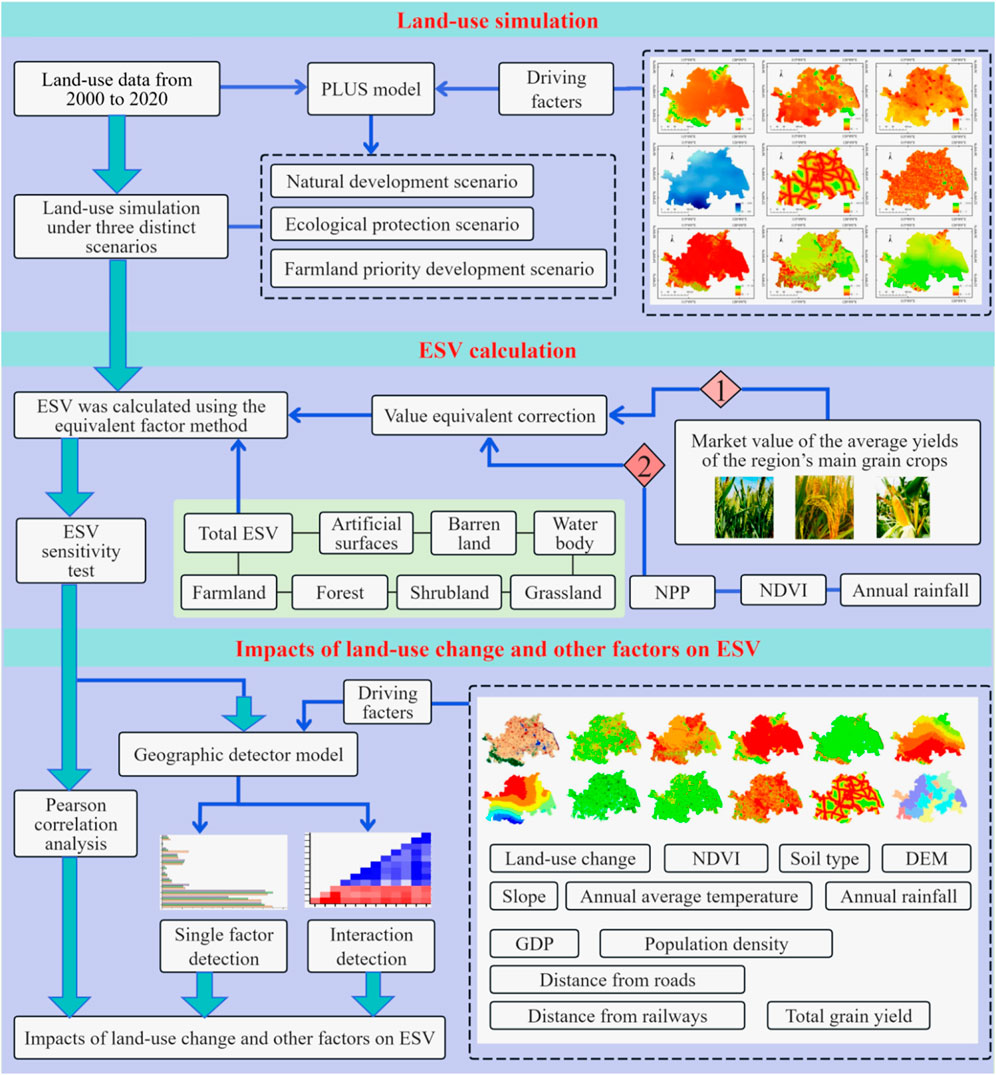
Figure 2. Research framework.
2.3.1 Conversion matrix of land use
The conversion matrix of land use is a quantitative tool that captures the directional changes and areas of transformation among diverse land-use types from the initial to the final stages of a particular epoch within the investigation zone (Daba and You, 2022). In our study, For our research, the calculation was performed according to the method suggested by He et al. (2022). The resulting data were visualised as a Sankey diagram using the Origin software to illustrate the spatiotemporal dynamics of land-use conversion.
2.3.2 PLUS model
The PLUS model integrates the land expansion analysis strategy (LEAS) module with the CA model (Gao et al., 2022). The LEAS module can determine how much different land types have grown or decreased in the LUC periods (Wei et al., 2024). The CA model can enable the dynamic simulation of patch generation under the constraints of development probabilities, neighbourhood probabilities, neighbourhood weights, adaptive inertia and transfer matrices of various land-use types (Liang et al., 2021).
Land-use simulation accuracy highly depends on selecting driving factors. According to the foundational work of Costanza et al. (2014) and the specific natural and socioeconomic conditions of the region, this study selected five natural driving factors (DEM, slope, anual average temperature, annual rainfall and soil type) and four socioeconomic driving factors (GDP, population density and distances from roads and railways). Neighbourhood weights, which reflected the expansion probabilities of land-use types, were assigned values of 0–1, where 1 and 0 indicated the highest and lowest expansion probabilities, respectively. The formula Liang et al. (2021) is shown in Equation 1 as follows:
Here,
Using land-use data from 2010 to simulate patterns for 2020, the following neighbourhood weights were derived: farmland (0.100), forest (0.482), shrubland (0.459), grassland (0.423), water body (0.392), barren land (0.459) and artificial surface (1.000). The overall accuracy of simulation model achieved to 91.6%. Furthermor, the Kappa coefficient and Figure of Merit coefficient were up to 0.812 and 0.131, respectively. These results validate the model’s reliability for simulating land-use data in 2030.
This study developed land-use transfer rule matrices under three distinct scenarios from 2020 to 2030 based on the land-use transfer matrix from 2010 to 2020 (Table 2). (1) The natural development (ND) scenario projected land-use patterns for 2030 based on observed trends from 2010 to 2020, assuming that the future LUC would follow the same trajectory as the previous decade, with no significant deviations or policy interventions. (2) The ecological protection (EP) scenario prioritised ecological conservation by designating forest parks, wetland parks, scenic spots, other natural reserves and water bodies as restricted areas within the HREEB, thereby protecting them from encroachment. Furthermore, land-use transfer rules were adjusted to prevent the conversion of farmlands into artificial surfaces and barren lands as well as the conversion of high-coverage forests into shrublands or grasslands. (3) The farmland priority development (FPD) scenario focused on the protection and prioritised development of farmlands, restricting their conversion into other land-use types, except for water bodies, while allowing necessary conversions of other land-use types to farmlands to ensure sustainable agricultural land use.
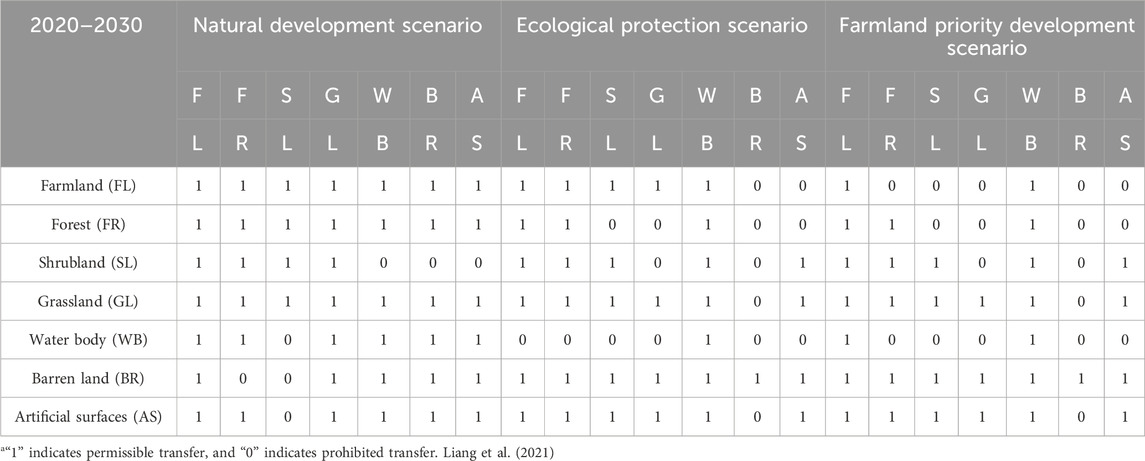
Table 2. Land-use transfer rule matrix under the three scenarios.
2.3.3 ESV calculation
The ESV equivalents per unit area of farmlands, forests, shrublands, grasslands, water bodies, barren lands and artificial surfaces in the HREEB were referenced from Xie et al. (2015)’s ESV Equivalent Table for China’s Terrestrial Ecosystems. This table provides ecological service value coefficients for farmlands, forests, shrublands, grasslands, water bodies, barren lands and exposed lands, which can serve as reference data for calculating the ESV coefficients of farmlands, forests, shrublands, grasslands, water bodies, barren lands and artificial surfaces. Based on the 30-m land-use secondary classification data, the area proportions of dry farmlands and paddy fields within farmlands were calculated to be 72.1% and 27.9%, respectively. Additionally, using the 1000-m vegetation coverage data, the area proportions of coniferous and broad-leaved forests within forests were calculated to be 50.9% and 49.1%, respectively.
Then, the ESV equivalent per unit area was adjusted using one-seventh of the market worth of the mean yield of the region’s rice, wheat and corn as the financial worth of a standard equivalent factor (Yang et al., 2024). During 2000–2020, the average yields of rice, wheat and corn in the study area were 7,147.00, 5,221.35 and 5,253.55 kg/hm2, respectively, with average prices of 2.23, 1.96 and 1.77 CNY/kg, respectively. Utilising the formula proposed by Shi et al. (2023), the economic value of a standard equivalent factor in the HREEB was calculated to be 1,615.55 CNY/hm2.
The ESV correction coefficients for the HREEB were derived using Formula 2-4 based on NPP, annual rainfall, and NDVI data (Li et al., 2023; Xie et al., 2015):
Here,
Based on the previous correction, Equation 5 was used to further adjust the ESV equivalent value per unit area for various land-use types in the HREEB (Table 3) then the overall ESV of the region was calculated using Equation 6 (Mamat et al., 2024):
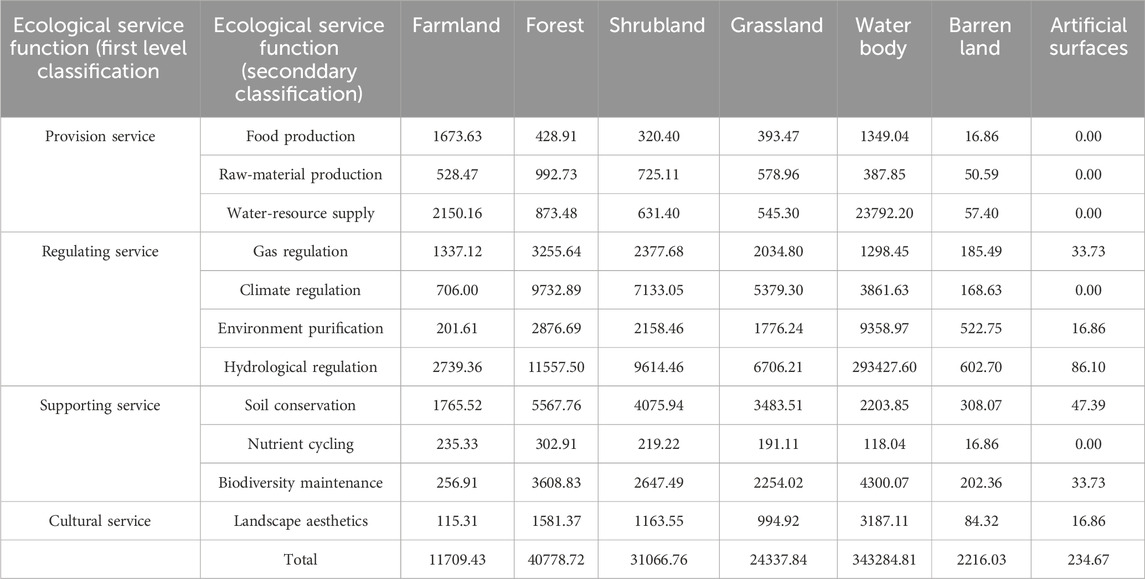
Table 3. ESV equivalent per unit area in the HREEB (CNY·hm−2·a−1).
Here, VCij is the ESV equivalent per unit area (CNY/hm2), E is the financial worth of one standard equivalent in the HREEB and Fij is the corrected ESV equivalent for the jth service function of the ith land-use type. ESVs represents the overall ESV of the HREEB (CNY), Ai is the area of the ith land-use type (hm2), VCi is the sum of the ESV equivalent per unit area for all service functions of the ith land-use type.
2.3.4 ESV sensitivity test
The ESV sensitivity test is conducted to evaluate the reliance of ESV assessment outcomes on ESV equivalents (Qiu et al., 2021). To conduct this analysis, the ESV equivalents per unit area for different land-use types were adjusted by ±50%, and the resulting changes in the overall ESV were calculated as the following Equation 7 (Tao et al., 2024):
Here, CS denotes the coefficient of ESV sensitivity. ESVa represents the pre-adjustment overall ESV, and ESVb represents the post-adjustment overall ESV. VCa represents the pre-adjustment ESV equivalent, and VCb represents the post-adjustment ESV equivalent. A CS value less than 1 suggests inelasticity, thereby substantiating the reliability of the research findings.
2.3.5 Geographic detector model
The geographic detector model identifies and quantifies factors influencing a geographical phenomenon by creating smaller, delineated sections within the study area and analysing the means and variances of the geographic variables (Yu et al., 2023). Herein, drawing on the research of Zhang X. et al. (2023), 12 driving factors were selected: LUC (X1), NDVI (X2), soil type (X3), DEM (X4), slope (X5), annual average temperature (X6), annual rainfall (X7), distance from roads (X8), distance from railways (X9), population density (X10), GDP (X11) and total grain yield (X12). The single-factor detection was conducted to examine the relationship between the ESV and these driving factors. An interactive detection was utilised to identify the combined effects of these driving factors on ESV changes, evaluating whether the explanatory power of the ESV increased when two driving factors interacted.
3 Results
3.1 Structures of land-use types
Table 4 presents the area and proportion of each land-use type in the HREEB during 2000–2020. Farmlands were the dominant land-use type, covering over 72% of the total area, followed by artificial surfaces, forests and water bodies. The area of farmlands decreased from 29,128,618.44 to 27,208,206.09 hm2, while the area of grasslands decreased from 241,799.22 to 123,396.39 hm2. Meanwhile, the area of artificial surfaces increased from 3,977,380.08 to 5,751,793.71 hm2. During 2000–2005, the area of water bodies increased by 219,457.89 hm2, whereas from 2005 to 2020, it decreased by 130,114.53 hm2.
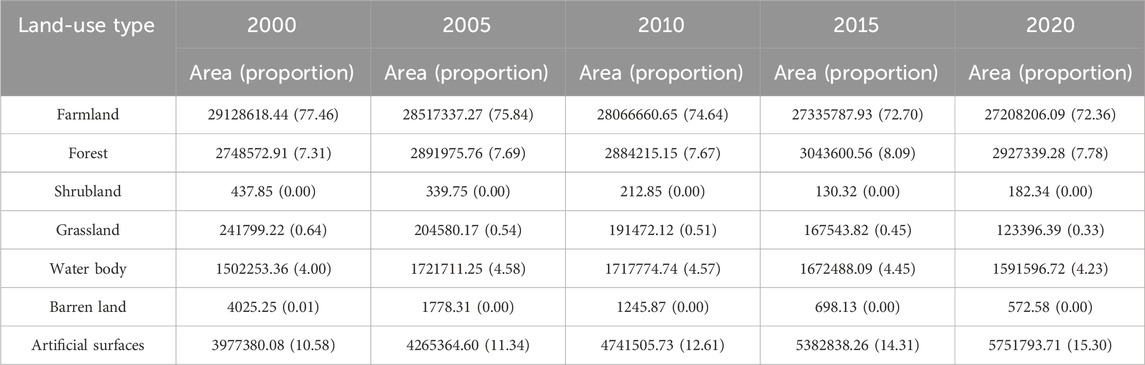
Table 4. LUC statistics in the HREEB (hm2/%).
3.2 Conversion of land use
Figure 3 illustrates the conversion of land use from 2000 to 2020. Farmlands were converted into artificial surfaces (2,120,686.38 hm2), forests (394,344.90 hm2) and water bodies (321,976.44 hm2). Water bodies were converted into farmlands (221,357.34 hm2), artificial surfaces (96,714.18 hm2) and forests (3,422.16 hm2). Artificial surfaces were converted into farmlands (384,670.53 hm2) and water bodies (81,874.26 hm2). Forests (240,673.14 hm2) and grasslands (104,368.68 hm2) were primarily converted into farmlands, with forests (2,937.15 hm2) converted into water bodies. Furthermore, farmlands converted into artificial surfaces exceeded artificial surfaces converted into farmlands by 1,736,015.85 hm2. Therefore, the decrease in the area of water bodies was mainly due to their conversion into farmlands, artificial surfaces and forests. Figures 4a-e shows the expansion of artificial surfaces from urban areas to surrounding farmlands, with farmlands converting into forests in southwestern Dabie Mountains. Large areas of farmlands near Weishan Lake in Shandong were converted into water bodies, while water bodies were converted into artificial surfaces in the eastern coastal regions. Over the past 20 years, water bodies were occupied by farmlands and artificial surfaces, farmlands were occupied by artificial surfaces, forests and grasslands were occupied by farmlands and artificial surfaces, and a large amount of grassland were transferred to forests.
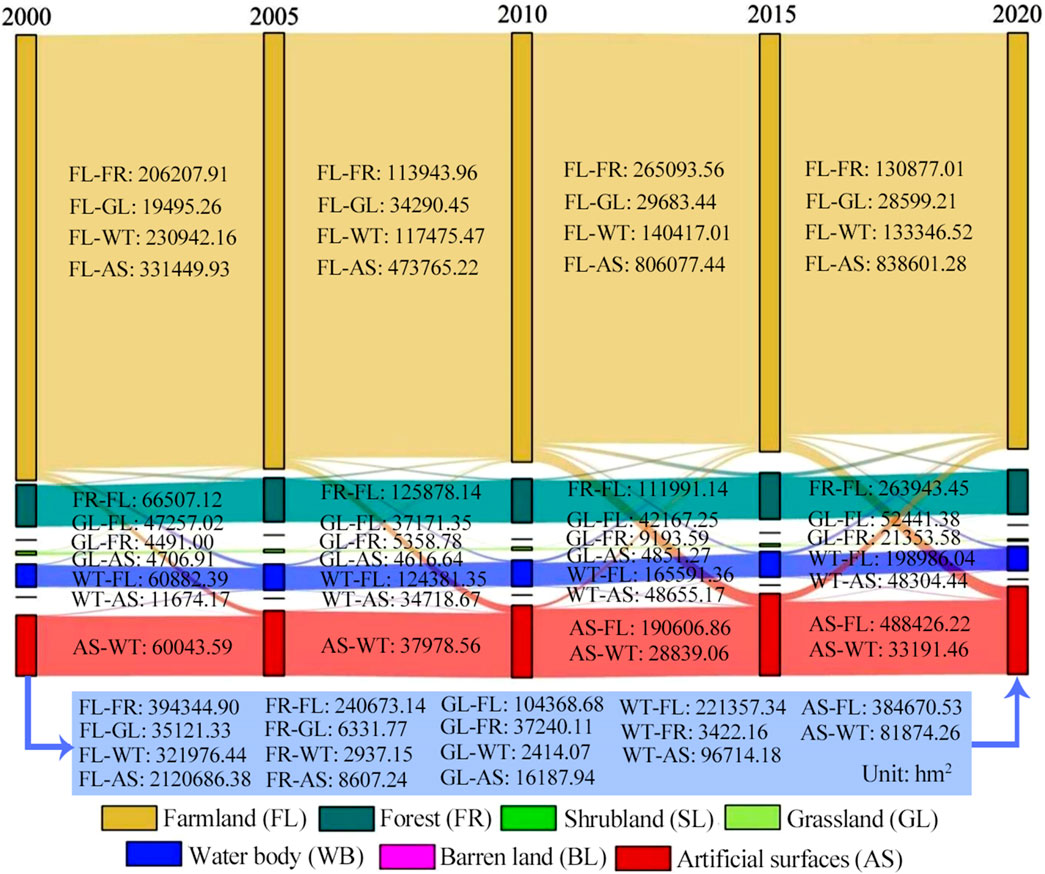
Figure 3. Diagram showing land-use conversion in the HREEB.
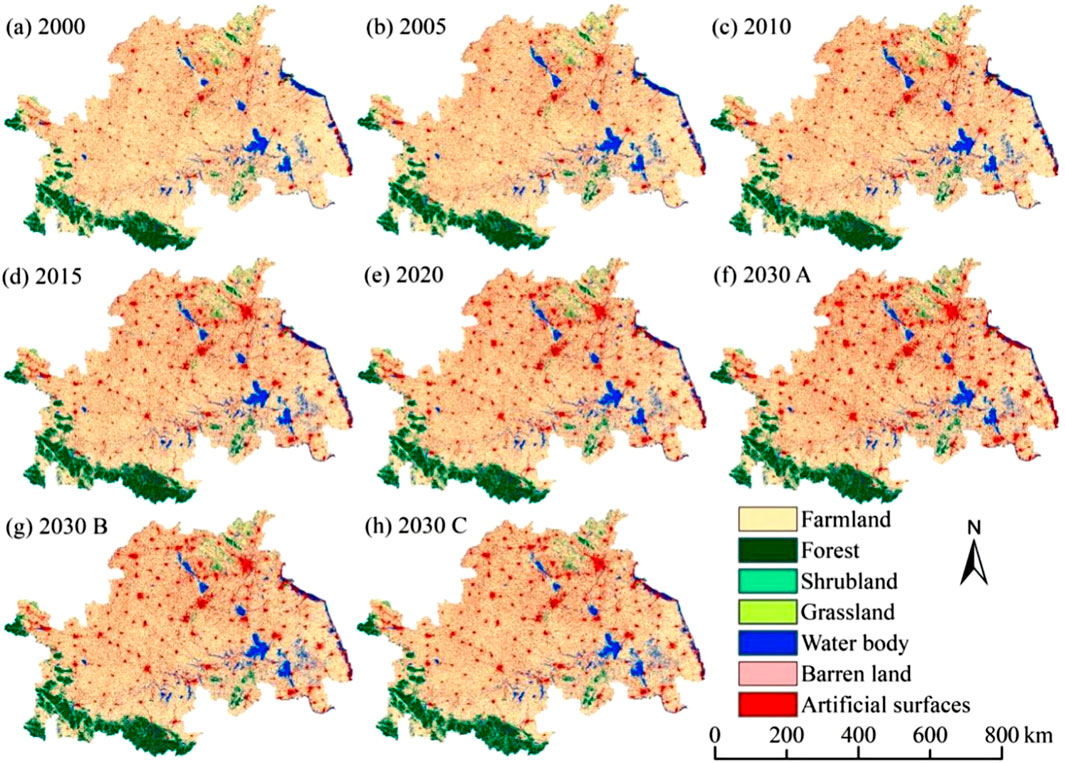
Figure 4. Land-use maps from 2000 to 2030. (a) Land-use map in 2000; (b) Land-use map in 2005; (c) Land-use map in 2010; (d) Land-use map in 2015; (e) Land-use map in 2020; (f) Land-use simulation map under the ND scenario in 2030; (g) Land-use simulation map under the EP scenario in 2030; (h) Land-use simulation map under the FPD scenario in 2030.
3.3 Multi-scenario LUC simulation
According to Table 5 and Figures 4f-h, under the ND scenario, the farmland area will decrease by 2.77% to 26,454,456.18 hm2 by 2030 in the HREEB. The water body area will decrease by 3.66%, whereas the areas of artificial surfaces and forests will increase by 13.74% and 0.74%, respectively. Artificial surfaces will continue to be converted rapidly into peripheral farmlands. Under the EP scenario, water bodies, national and provincial forest parks, wetland parks, scenic spots and other natural reserves are classified as protected zones. Consequently, the area of artificial surfaces will decrease by 13.45% to 5,661,966.33 hm2 by 2030, whereas the areas of water bodies, forests and grasslands will rise. Under the FPD scenario, the farmland area will increase by 1.07% to 27,442,860.66 hm2 by 2030, whereas artificial surfaces, forests, grasslands and water bodies will all experience significant reductions in area. Therefore, the land-use pattern in 2030 under ecological protection will be the most reasonable, followed by the FPD scenario, and finally the ND scenario.
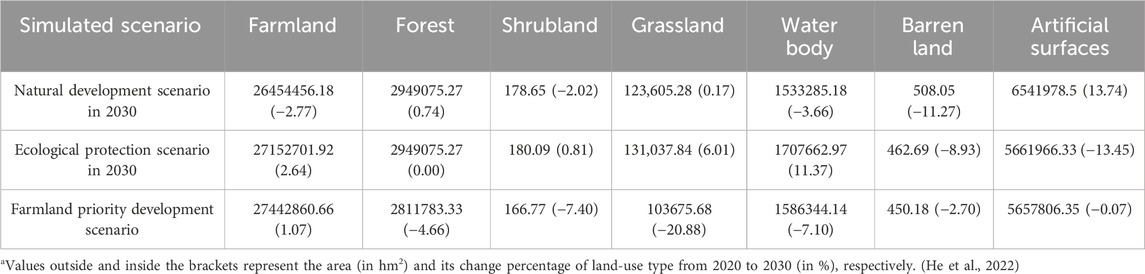
Table 5. Simulation results of land use in 2030.
3.4 ESV dynamics
Table 6 illustrates that the overall ESV of the HREEB increased by CNY 12.993 billion from 2000 to 2020. This increase was primarily driven by a CNY 30.670 billion increase in the water body ESV, despite a CNY 22.487 billion decrease in the farmland ESV. Between 2000 and 2005, the overall ESV increased by CNY 73.180 billion; however, from 2015 to 2020, it decreased by CNY 34.990 billion, largely due to a CNY 27.769 billion decrease in the water body ESV.
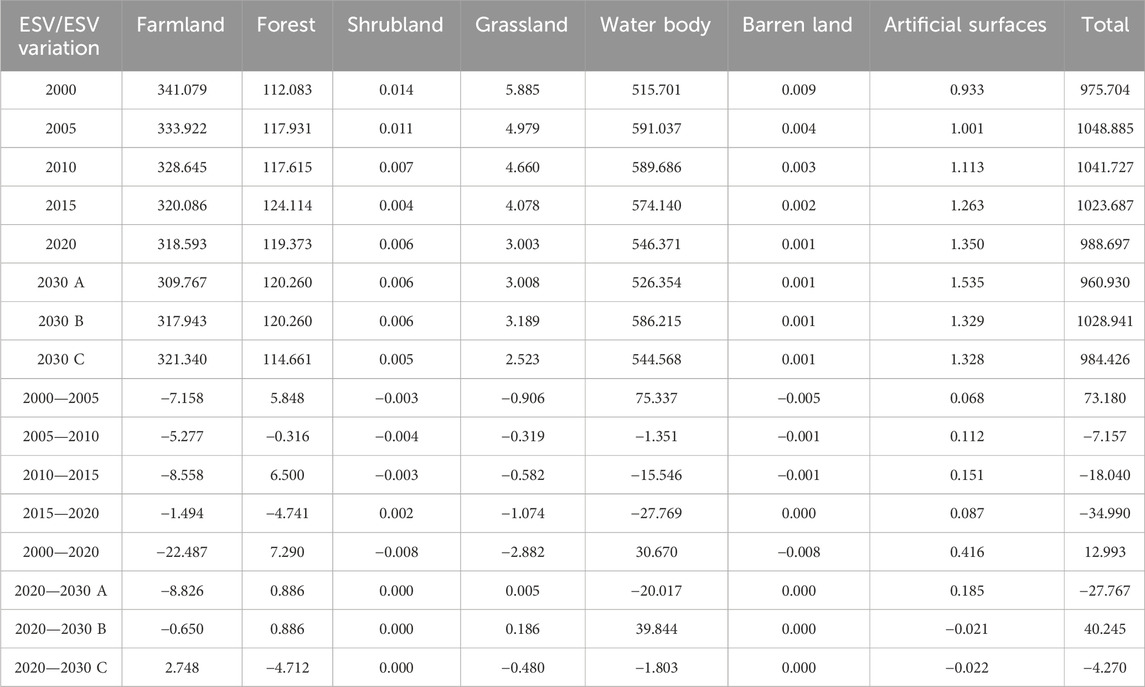
Table 6. ESV variation of the HREEB (billion).
Projections for 2020–2030 indicated varying ESV trends: (1) Under the ND scenario, water body and farmland ESVs would decrease, decreasing the overall ESV by CNY 27.767 billion. (2) Under the EP scenario, water body, forest and grassland ESVs would increase, increasing the overall ESV by CNY 40.245 billion. (3) Under the FPD scenario, farmland ESV would increase, but water body, forest and grassland ESVs would decrease, decreasing the overall ESV by CNY 4.270 billion. Thus, under the EP scenario, the ESV will be highest in 2030, followed by the FPD scenario, and the ESV will be the lowest under the ND scenario.
3.5 Analysis of ESV sensitivity
The CS was utilised to evaluate the responsiveness of the ESV to the ESV equivalents from 2000 to 2030. As illustrated in Table 7, all land-use types exhibited CS values below 1, demonstrating that the ESV is inelastic to ESV equivalents and confirming the robustness of the findings. Water bodies displayed the highest ESV sensitivity index, followed by farmlands and forests. The analysis shows that on the one hand, the water body ESV is much higher than that of other land types, and on the other hand, the HREEB is a water ecological sensitive area. However, human activities such as land reclamation, pond digging and aquaculture, dam construction, and river hardening in the Hongze Lake and Gaoyou Lake areas downstream of the Huai River have caused extensive degradation of wetland water bodies, resulting in a decrease in biodiversity, flood regulation capacity, water purification and other ecological service functions in the region.
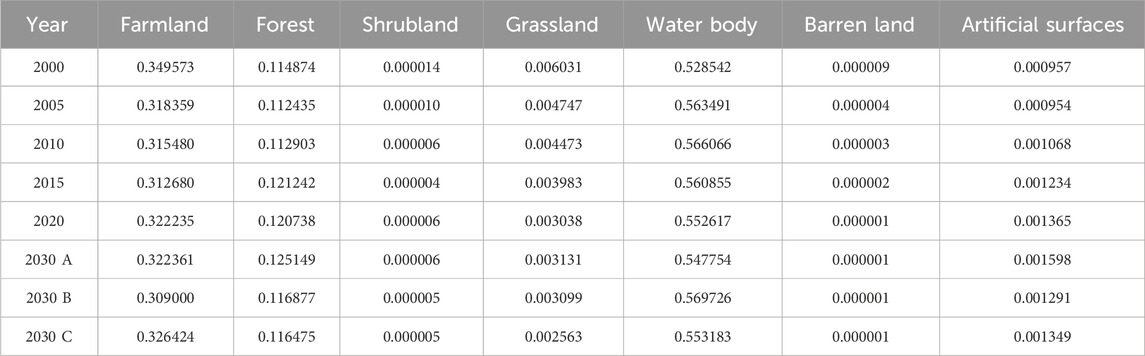
Table 7. Sensitivity test of ESV in the HREEB.
3.6 Driving-force analysis of the ESV
As depicted in Figure 5, during 2000–2030, the overall ESV in the HREEB exhibited a highly significant positive correlation with the water body area, while showing a negative correlation with the artificial surface area. Additionally, the ESV was positively correlated with the farmland, forest and, grassland areas. The artificial surface area demonstrated a highly significant negative correlation with the farmland and grassland areas as well as a significant negative correlation with the shrubland and barren-land areas. The grassland area was highly positively correlated with the farmland area and significantly positively correlated with the shrubland area. Furthermore, the shrubland area showed a highly significant positive correlation with the farmland area but a significant negative correlation with the forest area.
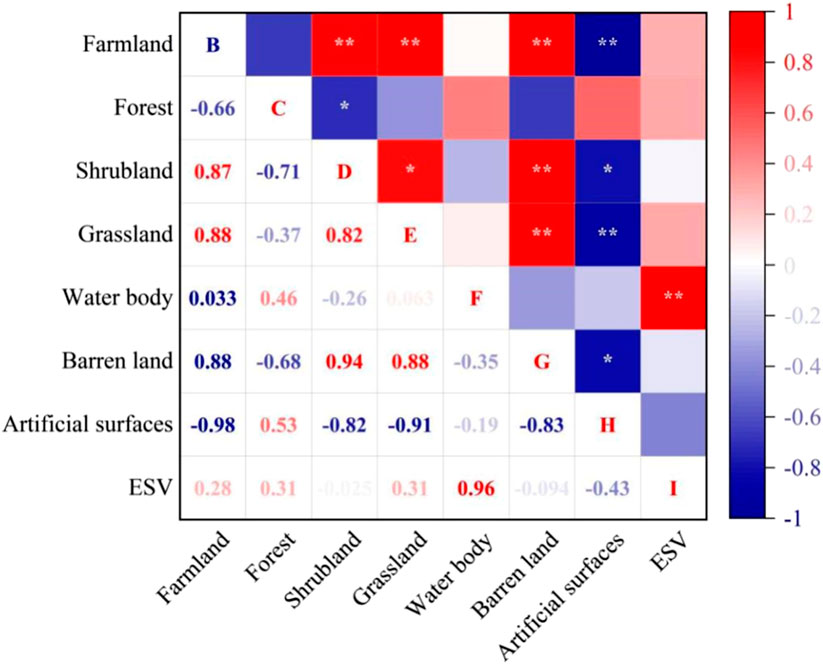
Figure 5. Correlation between land-use areas and ESV in the HREEB. Note: *P ≤ 0.05, **P ≤ 0.01.
The single-factor detection results for 2000–2020 (Figure 6) revealed that the P-values of all factors were below 0.005, indicating their significant influence on the geographic distribution of the ESV. Among these factors, LUC, NDVI and soil type exhibited q-values greater than 0.3, demonstrating their high explanatory contributions to the ESV geographic distribution. DEM and distance from roads consistently showed q-values above 0.1, representing secondary influencing factors. Interaction detection analysis (Figure 7) further highlighted that land-use change, NDVI and soil type remained the primary drivers of the ESV geographic distribution. The q-values for any interaction between two factors exceeded those of single-factor detection, with certain interactions (e.g., X5, X6, X7, X9, X10 and X12) increasing to above 0.1 and some even surpassing 0.2. This suggested that interactions between factors amplified their driving effects on the ESV spatial distribution.
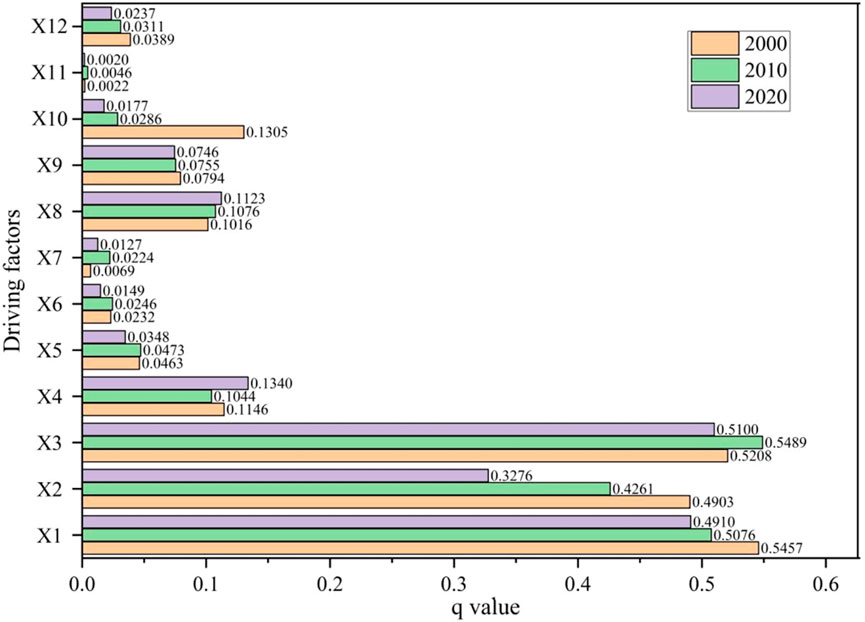
Figure 6. Results of single-factor detection during 2000–2020.
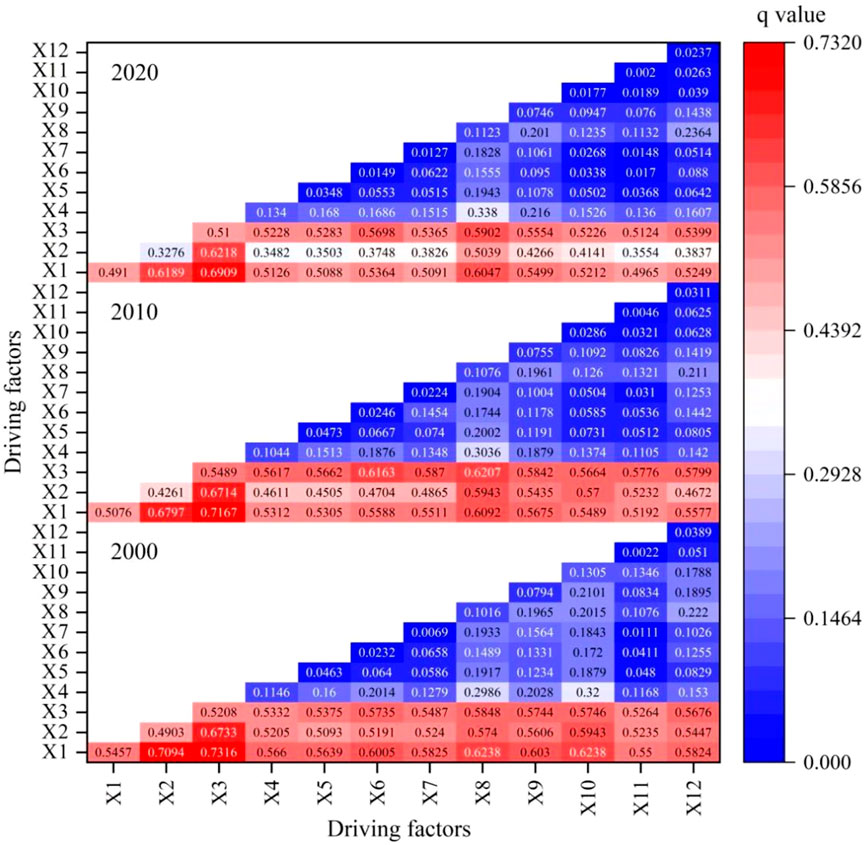
Figure 7. Results of interaction detection during 2000–2020.
4 Discussion
4.1 Driving factors of the ESV spatial differentiation
The link between land use and ecosystem services during urbanization is now a major research priority (Chen and Liu, 2021; Sarkar et al., 2024). As urbanisation progresses, reducing natural resources, such as farmlands, forests and water bodies, coupled with expanding construction land, will inevitably lead to ecological degradation, triggering environmental pollution, soil erosion, floods and droughts, and causing food insecurity. These interconnected problems further exacerbate a decline in ecosystem service functions (Li and Xie, 2024; Nolander and Lundmark, 2024; Pham and Lin, 2023). We observed that changes in the water body area in the HREEB were highly significantly positively correlated with the overall ESV, with the ESV equivalent of water bodies being 1,462.83 times that of artificial surfaces. Additionally, the areas of farmlands and green spaces, such as forests, shrubs and grasslands, exhibited positive correlations with the ESV, with their ESV equivalents being significantly higher than those of artificial surfaces. This underscores the critical role of blue and green spaces in sustaining and enhancing regional ecosystem services.
Policy interventions have been instrumental in mitigating the impact of LUC on the ESV (Tang et al., 2019). Since 2000, a series of policies aimed at land resource conservation and ecological restoration has implemented. For instance, between 2000 and 2002, the “Several Opinions on Further Improving the Pilot Work of Returning Farmlands to Forests and Grasslands” and the “Overall Plan for the South-to-North Water Diversion Project” were approved, significantly increasing the forest and water body areas. However, from 2005 to 2015, the reduction of water bodies and farmlands notably decreased the overall ESV. This trend underscores the growing tension between resource consumption and ecosystem service functions during urbanisation. In response, the 2016 “Notice on the Comprehensive Delimitation of Permanent Basic Farmland and the Implementation of Special Protection” policy was implemented to curb excessive reductions in farmland areas. While effective in stabilising farmland areas, it failed to address the decline in water body, forest and grassland areas, continuously decreasing the ESV. This suggests that isolated farmland-protection policies are insufficient to address broad ecosystem degradation, necessitating more comprehensive ecological conservation measures (Newbold et al., 2015).
LUC exerts profound and complex impacts on the ESV (Cao et al., 2021; Zhang P. et al., 2023), with climate change, terrain and land-cover types (e.g., NDVI) also closely linked to ecosystem service functions (Chen et al., 2023; Li et al., 2024; Liu et al., 2024). Through geographic detector model analysis, this study identified land-use type, NDVI and soil type as key drivers of ESV changes. Previous study on the driving forces of ESV in the Yangtze and Yellow River Basins found that land use type is the dominant factor in ESV changes (Fang et al., 2021). Wang Z. et al. (2023) found in their research on the HREEB that vegetation such as forests, grasslands, rice paddies, and water bodies had higher coverage and higher ESV. The above researches are basically consistent with the results of this study. Whereas DEM and distance from roads played secondary roles. Furthermore, slope, annual average temperature, annual rainfall, population density and total grain yield exhibited a synergistic effect, collectively amplifying their influences on the geographic distribution of ESV. This demonstrated that multi-factor interactions dramatically improve the explanatory capacity of ESV spatial patterns (Zhang et al., 2022). In the HREEB, areas with a high population density and low NDVI, typically located near urban centres, exhibit reduced ESVs. In contrast, regions with higher NDVI, often in rural areas with fewer artificial surfaces, displayed high ESVs. Notably, the Dabie Mountains and natural reserves, characterised by high NDVI and low population density, consistently demonstrated an elevated ESV. The soil-type distribution also significantly influenced vegetation growth and water-resource allocation (Gavrilescu, 2021; Valentin et al., 1999), thereby shaping the ESV spatial variability. Variations in soil types, as in the case of paddy fields south of the Huai River, dry farmlands to the north, Entisols (immature soils) and Luvisols (semi-leached soils) in mountainous areas, etc., directly affected vegetation distribution and ecosystem service performance. Therefore, the synergistic mechanism between land use type, NDVI, and soil type is complex and multidimensional, and the three jointly affect the ESV through direct and indirect pathways. Land-use change is the main driving force behind changes in ecosystem structure, which can reshape the composition and function of ecosystems by altering surface cover types. The degree of matching between land-use type and soil type can affect the potential for vegetation growth, thereby regulating the role of NDVI in ESV.
4.2 Impact of different land-use development scenarios on regional development
The simulation results for the three scenarios revealed distinct implications for regional development. Under the ND scenario, where land-use changes continued the 2010–2020 trend without intervention, water body, forest and farmland areas were projected to decline, whereas artificial surfaces would expand. This scenario highlights the risks of unchecked urbanization as reducing high-ESV land types, such as forests and water bodies, significantly decreases the overall ESV. In the FPD scenario, the food security was maintained, but the disregard for ecological conservation led to a sustained reduction in the ESV. This underscores the necessity for not only safeguarding farmlands but also restricting the conversion of forests into farmlands and curbing artificial surface expansion.
By contrast, the EP scenario demonstrated a balanced approach, integrating ecological conservation with farmland protection. This scenario effectively safeguarded natural reserves, water bodies and forests while minimizing the conversion of farmlands into artificial surfaces. Consequently, it afforded the highest overall ESV among the three scenarios, illustrating that ecological protection and farmland development could be mutually reinforcing. Rational land-use planning and ecological conservation are thus essential for promoting sustainable regional development.
To achieve this balance, the government should rigorously implement a sustainable development plan for the HREEB. Strengthening management systems to simultaneously promote food security and ecological protection is critical. Specific measures include enhancing the protection of water resources, forests, wetlands and farmlands, improving ecological compensation mechanisms, promoting ecological agriculture and increasing public education and technological innovation to enhance resource-utilization efficiency and sustainable environmental management.
4.3 Limitations and future research
This study reveals the complex dynamic relationship between land use change and ESV in specific ecological barrier areas, particularly quantifying the enormous potential benefits of EP scenario. This challenges the traditional development model that solely pursues land use expansion, emphasizes the necessity of incorporating ESV into regional development assessments. Although some progress has been made in this study, there are several limitations. (1) Despite the ESV equivalents were revised twice according to the yield and price of crops (wheat, rice and corn) and factors such as NPP, NDVI and annual rainfall, the inherent diversity and spatiotemporal variability of ecosystems complicate ESV assessments. Therefore, future research should focus on refining the ESV equivalents, particularly across different spatiotemporal scales, to improve accuracy. (2) The PLUS model’s Markov chain component predicts future LUC based on historical patterns without fully accounting for policy influences. Hence, future studies should integrate policy impacts into the model framework to enhance the reliability and precision of simulations. (3) Here is still a lack of research on the synergistic balance relationship between changes in different types of ecological service functions. In addition, the impact mechanism of ESV is extremely complex, and there is still broad exploration space, especially in the interaction and influence of driving factors. These future studies will further advance the role of ESV assessment in ecological conservation, national spatial planning, and green industry development.
5 Conclusion
This study investigated spatiotemporal LUC, ESV and their driving factors of the HREEB. The main findings of this research are as follows:
During the study period, the land use structure of HREEB was mainly farmland, but its area showed a decreasing trend, while the artificial surface area significantly increased, and the water area experienced a change of first increasing and then decreasing. Secondly, based on scenario simulation, future land use changes have a significant impact on ESV: ESV is expected to decrease under ND and FPD scenarios, while EP scenarios can achieve a significant increase in ESV. Land-use types (espacially water bodies and artifical surfaces), NDVI and soil type were identified as the crucial drivers of ESV variation.
The research results indicate that protecting water bodies and basic farmland, and limiting artificial surface expansion are key to maintaining the ecological service functions of HREEB. Therefore, policies should prioritize: (1) Strict protection of water bodies and permanent basic farmland, and promotion of ecological agriculture; (2) Strictly control the disorderly expansion of cities; (3) Proactively construct ecological corridors and restore key ecosystems such as wetlands. These specific measures are directly based on the analysis of key ESV driving factors, aiming to optimize land use, achieve coordinated development of regional economy, society, and ecological protection, and promote green and sustainable development.
Data availability statement
The original contributions presented in the study are included in the article/supplementary material, further inquiries can be directed to the corresponding author.
Author contributions
CL: Writing – original draft, Writing – review and editing. YW: Writing – original draft. BQ: Writing – original draft. YL: Writing – original draft. LN: Writing – original draft. HW: Writing – original draft. LL: Writing – original draft, Writing – review and editing. JM: Writing – original draft.
Funding
The author(s) declare that financial support was received for the research and/or publication of this article. This research was funded by the National Natural Science Foundation of China (Grant Number: 31971721), Natural Science Research Project of Universities in Anhui Province (Grant Number: 2024AH051725) and the Key Research Project of Huainan Normal University (Grant Numbers: 2023XJZD008 and 2023XJZD020).
Acknowledgments
The authors gratefully acknowledge Jie Yang and Xin Huang’s research team for providing the land-use data, as well as the various institutions and collaborative platforms for supplying the natural, social and economic data utilised in this study.
Conflict of interest
The authors declare that the research was conducted in the absence of any commercial or financial relationships that could be construed as a potential conflict of interest.
Generative AI statement
The author(s) declare that no Generative AI was used in the creation of this manuscript.
Publisher’s note
All claims expressed in this article are solely those of the authors and do not necessarily represent those of their affiliated organizations, or those of the publisher, the editors and the reviewers. Any product that may be evaluated in this article, or claim that may be made by its manufacturer, is not guaranteed or endorsed by the publisher.
References
Bateman, I. J., Harwood, A. R., Mace, G. M., Watson, R. T., Abson, D. J., Andrews, B., et al. (2013). Bringing ecosystem services into economic decision-making: land use in the United Kingdom. science 341, 45–50. doi:10.1126/science.1234379
Cao, Y., Kong, L., Zhang, L., and Ouyang, Z. (2021). The balance between economic development and ecosystem service value in the process of land urbanization: a case study of China’s land urbanization from 2000 to 2015. Land Use Policy 108, 105536. doi:10.1016/j.landusepol.2021.105536
Chen, C., and Liu, Y. (2021). Spatiotemporal changes of ecosystem services value by incorporating planning policies: a case of the Pearl River Delta, China. Ecol. Model. 461, 109777. doi:10.1016/j.ecolmodel.2021.109777
Chen, S., Liu, X., Yang, L., and Zhu, Z. (2023). Variations in ecosystem service value and its driving factors in the Nanjing metropolitan area of China. Forests 14, 113. doi:10.3390/f14010113
Chen, W., Zeng, J., Zhong, M., and Pan, S. (2021). Coupling analysis of ecosystem services value and economic development in the Yangtze River Economic Belt: a case study in Hunan Province, China. Remote Sens. 13, 1552. doi:10.3390/rs13081552
Chen, Z., Huang, M., Zhu, D., and Altan, O. (2021). Integrating remote sensing and a markov-FLUS model to simulate future land use changes in Hokkaido, Japan. Remote Sens. 13, 2621. doi:10.3390/rs13132621
Ci, M., Ye, L., Liao, C., Yao, L., Tu, Z., Xing, Q., et al. (2023). Long-term dynamics of ecosystem services and their influencing factors in ecologically fragile southwest China. Sustainability 15, 12331. doi:10.3390/su151612331
Costanza, R., de Groot, R., Sutton, P., van der Ploeg, S., Anderson, S. J., Kubiszewski, I., et al. (2014). Changes in the global value of ecosystem services. Glob. Environ. Change 26, 152–158. doi:10.1016/j.gloenvcha.2014.04.002
Daba, M. H., and You, S. (2022). Quantitatively assessing the future land-use/land-cover changes and their driving factors in the upper stream of the Awash River based on the CA–Markov model and their implications for water resources management. Sustainability 14, 1538. doi:10.3390/su14031538
Fang, L., Wang, L., Chen, W., Sun, J., Cao, Q., Wang, S., et al. (2021). Identifying the impacts of natural and human factors on ecosystem service in the Yangtze and Yellow River Basins. J. Clean. Prod. 314, 127995. doi:10.1016/j.jclepro.2021.127995
Fu, B., Li, Y., Wang, Y., Zhang, B., Yin, S., Zhu, H., et al. (2016). Evaluation of ecosystem service value of riparian zone using land use data from 1986 to 2012. Ecol. Indic. 69, 873–881. doi:10.1016/j.ecolind.2016.05.048
Gao, L., Tao, F., Liu, R., Wang, Z., Leng, H., and Zhou, T. (2022). Multi-scenario simulation and ecological risk analysis of land use based on the PLUS model: a case study of nanjing. Sustain. Cities Soc. 85, 104055. doi:10.1016/j.scs.2022.104055
Gavrilescu, M. (2021). Water, soil, and plants interactions in a threatened environment. Water 13, 2746. doi:10.3390/w13192746
Guan, D., Zhao, Z., and Tan, J. (2019). Dynamic simulation of land use change based on logistic-CA-Markov and WLC-CA-Markov models: a case study in three gorges reservoir area of chongqing, China. Environ. Sci. Pollut. Res. 26, 20669–20688. doi:10.1007/s11356-019-05127-9
Hasan, S. S., Zhen, L., Miah, M. G., Ahamed, T., and Samie, A. (2020). Impact of land use change on ecosystem services: a review. Environ. Dev. 34, 100527. doi:10.1016/j.envdev.2020.100527
He, N., Zhou, Y., Wang, L., Li, Q., Zuo, Q., and Liu, J. (2022). Spatiotemporal differentiation and the coupling analysis of ecosystem service value with land use change in Hubei Province, China. Ecol. Indic. 145, 109693. doi:10.1016/j.ecolind.2022.109693
Hernández-Blanco, M., Costanza, R., Chen, H., DeGroot, D., Jarvis, D., Kubiszewski, I., et al. (2022). Ecosystem health, ecosystem services, and the well-being of humans and the rest of nature. Glob. change Biol. 28, 5027–5040. doi:10.1111/gcb.16281
Hu, S., Chen, L., Li, L., Wang, B., Yuan, L., Cheng, L., et al. (2019). Spatiotemporal dynamics of ecosystem service value determined by land-use changes in the urbanization of Anhui province, China. Int. J. Environ. Res. public health 16, 5104. doi:10.3390/ijerph16245104
Jiang, W., Lü, Y., Liu, Y., and Gao, W. (2020). Ecosystem service value of the Qinghai-Tibet Plateau significantly increased during 25 years. Ecosyst. Serv. 44, 101146. doi:10.1016/j.ecoser.2020.101146
Li, H., Guan, Q., Fan, Y., and Guan, C. (2024). Ecosystem service value assessment of the Yellow River Delta based on satellite remote sensing data. Land 13, 276. doi:10.3390/land13030276
Li, H., Huang, Y., Zhou, Y., Wang, S., Guo, W., Liu, Y., et al. (2023). Spatial and temporal evolution of ecosystem service values and topography-driven effects based on land use change: a case study of the guangdong–Hong Kong–Macao greater Bay Area. Sustainability 15, 9691. doi:10.3390/su15129691
Li, X., Chen, D., Duan, Y., Ji, H., Zhang, L., Chai, Q., et al. (2020). Understanding land use/land cover dynamics and impacts of human activities in the Mekong Delta over the last 40 years. Glob. Ecol. Conservation 22, e00991. doi:10.1016/j.gecco.2020.e00991
Li, Y., and Xie, H. (2024). Spatial–temporal variation and correlation analysis of ecosystem service values and ecological risks in winter city Shenyang, China. Sci. Rep. 14, 18182. doi:10.1038/s41598-024-67651-0
Li, Z., Sun, Z., Tian, Y., Zhong, J., and Yang, W. (2019). Impact of land use/cover change on Yangtze River delta urban agglomeration ecosystem services value: temporal-spatial patterns and cold/hot spots ecosystem services value change brought by urbanization. Int. J. Environ. Res. Public Health 16, 123. doi:10.3390/ijerph16010123
Liang, X., Guan, Q., Clarke, K. C., Liu, S., Wang, B., and Yao, Y. (2021). Understanding the drivers of sustainable land expansion using a patch-generating land use simulation (PLUS) model: a case study in Wuhan, China. Comput. Environ. Urban Syst. 85, 101569. doi:10.1016/j.compenvurbsys.2020.101569
Lin, G., Yang, Z., Xu, L., Zhang, F., and Yang, R. (2023). Urban ecological network construction in loess Plateau regions in China-case study of Huanxian city. Alexandria Eng. J. 74, 153–169. doi:10.1016/j.aej.2023.05.035
Liu, S., Costanza, R., Farber, S., and Troy, A. (2010). Valuing ecosystem services: theory, practice, and the need for a transdisciplinary synthesis. Ann. N. Y. Acad. Sci. 1185, 54–78. doi:10.1111/j.1749-6632.2009.05167.x
Liu, S., Liu, J., and Shang, S. (2024). Attribution of climate change and human activities to spatiotemporal changes of ecological service value in Yunnan Province of China. Glob. Ecol. Conservation 55, e03221. doi:10.1016/j.gecco.2024.e03221
Liu, Y., Hou, X., Li, X., Song, B., and Wang, C. (2020). Assessing and predicting changes in ecosystem service values based on land use/cover change in the Bohai Rim coastal zone. Ecol. Indic. 111, 106004. doi:10.1016/j.ecolind.2020.106657
Mamat, A., Aimaiti, M., Saydi, M., and Wang, J. (2024). Evolution and driving forces of ecological service value in response to land use change in Tarim Basin, Northwest China. Remote Sens. 16, 2311. doi:10.3390/rs16132311
Newbold, T., Hudson, L. N., Hill, S. L., Contu, S., Lysenko, I., Senior, R. A., et al. (2015). Global effects of land use on local terrestrial biodiversity. Nature 520, 45–50. doi:10.1038/nature14324
Niu, H., An, R., Xiao, D., Liu, M., and Zhao, X. (2022). Estimation of ecosystem services value at a basin scale based on modified equivalent coefficient: a case study of the Yellow River Basin (Henan Section), China. Int. J. Environ. Res. Public Health 19, 16648. doi:10.3390/ijerph192416648
Nolander, C., and Lundmark, R. (2024). A review of forest ecosystem services and their spatial value characteristics. Forests 15, 919. doi:10.3390/f15060919
Peng, J., Hu, X., Wang, X., Meersmans, J., Liu, Y., and Qiu, S. (2019). Simulating the impact of grain-for-green programme on ecosystem services trade-offs in Northwestern Yunnan, China. Ecosyst. Serv. 39, 100998. doi:10.1016/j.ecoser.2019.100998
Peng, K., Jiang, W., Ling, Z., Hou, P., and Deng, Y. (2021). Evaluating the potential impacts of land use changes on ecosystem service value under multiple scenarios in support of SDG reporting: a case study of the Wuhan urban agglomeration. J. Clean. Prod. 307, 127321. doi:10.1016/j.jclepro.2021.127321
Pham, K. T., and Lin, T.-H. (2023). Effects of urbanisation on ecosystem service values: a case study of Nha Trang, Vietnam. Land Use Policy 128, 106599. doi:10.1016/j.landusepol.2023.106599
Qiu, H., Hu, B., and Zhang, Z. (2021). Impacts of land use change on ecosystem service value based on SDGs report--Taking Guangxi as an example. Ecol. Indic. 133, 108366. doi:10.1016/j.ecolind.2021.108366
Sannigrahi, S., Bhatt, S., Rahmat, S., Paul, S. K., and Sen, S. (2018). Estimating global ecosystem service values and its response to land surface dynamics during 1995–2015. J. Environ. Manag. 223, 115–131. doi:10.1016/j.jenvman.2018.05.091
Sannigrahi, S., Zhang, Q., Pilla, F., Joshi, P. K., Basu, B., Keesstra, S., et al. (2020). Responses of ecosystem services to natural and anthropogenic forcings: a spatial regression based assessment in the world's largest mangrove ecosystem. Sci. Total Environ. 715, 137004. doi:10.1016/j.scitotenv.2020.137004
Sarkar, S., Mallick, S. K., Manna, H., and Roy, S. K. (2024). Urbanization-induced land use dynamics and its impacts on present and future urban ecosystem services in the industrial cities of India. Earth Syst. Environ. 8, 869–893. doi:10.1007/s41748-024-00440-x
Shi, J., Shi, P., Wang, Z., Wang, L., and Li, Y. (2023). Multi-scenario simulation and driving force analysis of ecosystem service value in arid areas based on PLUS model: a case study of Jiuquan City, China. Land 12, 937. doi:10.3390/land12050937
Tang, H., Yun, W., Liu, W., and Sang, L. (2019). Structural changes in the development of China’s farmland consolidation in 1998–2017: changing ideas and future framework. Land Use Policy 89, 104212. doi:10.1016/j.landusepol.2019.104212
Tao, H., Hu, G., Fan, Y., Bai, Y., Liu, P., and Zhou, C. (2024). Assessing the value and sensitivity of ecosystem services based on land use in the middle and lower reaches of the Shiyang River. Environ. Res. Commun. 6, 035014. doi:10.1088/2515-7620/ad2f15
Valentin, C., d'Herbès, J.-M., and Poesen, J. (1999). Soil and water components of banded vegetation patterns. Catena 37, 1–24. doi:10.1016/S0341-8162(99)00053-3
Valle Junior, R. F., Varandas, S. G., Pacheco, F. A., Pereira, V. R., Santos, C. F., Cortes, R. M., et al. (2015). Impacts of land use conflicts on riverine ecosystems. Land use policy 43, 48–62. doi:10.1016/j.landusepol.2014.10.015
Wang, W., Guo, H., Chuai, X., Dai, C., Lai, L., and Zhang, M. (2014). The impact of land use change on the temporospatial variations of ecosystems services value in China and an optimized land use solution. Environ. Sci. and Policy 44, 62–72. doi:10.1016/j.envsci.2014.07.004
Wang, Y., Shataer, R., Zhang, Z., Zhen, H., and Xia, T. (2022). Evaluation and analysis of influencing factors of ecosystem service value change in Xinjiang under different land use types. Water 14, 1424. doi:10.3390/w14091424
Wang, Y., Zhang, Z., and Chen, X. (2023). Land use transitions and the associated impacts on carbon storage in the Poyang Lake Basin, China. Remote Sens. 15, 2703. doi:10.3390/rs15112703
Wang, Z., Wang, H., Liu, Z., Feng, R., and Pan, Y. (2023). Evolution of ecosystem service values and the response to landscape pattern change in the Huaihe river eco-economic belt. Land 12, 1405. doi:10.3390/land12071405
Wang, Z., Zhong, A., and Li, Q. (2024). Optimization of land use structure based on the coupling of GMOP and PLUS models: a case study of Lvliang City, China. Land 13, 1335. doi:10.3390/land13081335
Wei, R., Fan, Y., Wu, H., Zheng, K., Fan, J., Liu, Z., et al. (2024). The value of ecosystem services in arid and semi-arid regions: a multi-scenario analysis of land use simulation in the Kashgar region of Xinjiang. Ecol. Model. 488, 110579. doi:10.1016/j.ecolmodel.2023.110579
Winkler, K., Fuchs, R., Rounsevell, M., and Herold, M. (2021). Global land use changes are four times greater than previously estimated. Nat. Commun. 12, 2501. doi:10.1038/s41467-021-22702-2
Xia, H., Yuan, S., and Prishchepov, A. V. (2023). Spatial-temporal heterogeneity of ecosystem service interactions and their social-ecological drivers: implications for spatial planning and management. Resour. Conservation Recycl. 189, 106767. doi:10.1016/j.resconrec.2022.106767
Xie, G., Zhang, C., Zhang, L., Chen, W., and Li, S. (2015). Improvement of the evaluation method for ecosystem service value based on per unit area. J. Nat. Resour. 30, 1243–1254. doi:10.11849/zrzyxb.2015.08.001
Yang, C., Li, J., Jiang, S., Tian, Y., Li, C., Yang, W., et al. (2024). The impacts of land-use changes on ecosystem service value in the Yunnan–Kweichow Plateau, China. Sustainability 16, 1062. doi:10.3390/su16031062
Yang, J., and Huang, X. (2021). The 30 m annual land cover dataset and its dynamics in China from 1990 to 2019. Earth Syst. Sci. Data 13, 3907–3925. doi:10.5194/essd-13-3907-2021
Yu, H., Liu, D., Zhang, C., Yu, L., Yang, B., Qiao, S., et al. (2023). Research on spatial–temporal characteristics and driving factors of urban development intensity for Pearl River Delta region based on geodetector. Land 12, 1673. doi:10.3390/land12091673
Zhang, B., Wang, Y., Li, J., and Zheng, L. (2022). Degradation or restoration? The temporal-spatial evolution of ecosystem services and its determinants in the Yellow River Basin, China. Land 11, 863. doi:10.3390/land11060863
Zhang, P., Liu, L., Yang, L., Zhao, J., Li, Y., Qi, Y., et al. (2023). Exploring the response of ecosystem service value to land use changes under multiple scenarios coupling a mixed-cell cellular automata model and system dynamics model in Xi'an, China. Ecol. Indic. 147, 110009. doi:10.1016/j.ecolind.2023.110009
Keywords: land use, ESV, patch-generating land-use simulation, geographic detector, HREEB
Citation: Li C, Wu Y, Qiu B, Li Y, Ning L, Wang H, Liu L and Ma J (2025) Study on dynamic changes in land use and ecosystem service value in the Huaihe River ecological economic belt based on multi-scenario simulations. Front. Environ. Sci. 13:1617829. doi: 10.3389/fenvs.2025.1617829
Received: 28 April 2025; Accepted: 18 June 2025;
Published: 08 July 2025.
Edited by:
Eduardo Gomes, University of Lisbon, PortugalReviewed by:
Lei Wang, Beijing Academy of Agricultural and Forestry Sciences, ChinaYing Liu, Tianjin University, China
Copyright © 2025 Li, Wu, Qiu, Li, Ning, Wang, Liu and Ma. This is an open-access article distributed under the terms of the Creative Commons Attribution License (CC BY). The use, distribution or reproduction in other forums is permitted, provided the original author(s) and the copyright owner(s) are credited and that the original publication in this journal is cited, in accordance with accepted academic practice. No use, distribution or reproduction is permitted which does not comply with these terms.
*Correspondence: Ling Liu, YmV3ZjE1QDE2My5jb20=