 Xianbo Wu
 Xiaofeng Hui2
- 1Post-Doctoral Scientific Research Workstation, Harbin Bank Co., Ltd., Harbin, China
- 2School of Management, Harbin Institute of Technology, Harbin, China
- 3School of Economics, Shanghai University of Finance and Economics, Shanghai, China
As the world’s largest developing country and the large economy with carbon emission, China has opened 8 markets for carbon emission trading. This article uses the method of information entropy to study the dependence relationship within China’s carbon emission trading system from 2017 to 2021, and characterizes the core structure and dynamic evolution process of this dependence relationship. Research has found that, firstly, there is a broad dependence among the 8 carbon emission trading markets in China, and this dependence is changing with the process of economic development. Especially after China proposed the carbon peaking and carbon neutrality goals in 2020, the correlation between the 8 carbon markets has been significantly strengthened. Secondly, China’s carbon market presents a north-central-south distribution pattern, and the carbon market in the south is more important, which is also in line with the pattern of China’s economic development. Finally, the carbon market in Guangdong province has a higher level of development nationwide and plays an important role in China’s carbon emission trading system. This province has two carbon emission markets, namely the Shenzhen market and the Guangdong market, which are at the core of China’s carbon market system. This is closely related to the economic development level and industrial development model of Guangdong province. Based on the above conclusions, this study suggests that China’s carbon market can start from economically underdeveloped regions, fully leverage the latecomer advantages of these regions, and gradually introduce derivative products such as carbon futures in the development of the carbon spot market, improving the liquidity and effectiveness of the carbon market while avoiding the risks of the carbon spot market. Meanwhile, a reasonable determination of carbon market prices also requires the joint efforts of the market and the government.
1 Introduction
In recent years, the increase in carbon emissions has become a major factor contributing to the greenhouse effect and global climate change. In January 2020, the Bank for International Settlements (BIS) first proposed the concept of “green swan” to describe the significant risks caused by climate change. BIS believes that “green swans” have high uncertainty and potential systemic impacts, involving various aspects of the environment, geopolitics, and economic and social development, seriously threatening the survival and development of human society. The fundamental reason for the climate crisis caused by the “green swan” is the global warming caused by greenhouse gas emissions. Therefore, reducing greenhouse gas emissions such as carbon dioxide is a basic measure to address climate issues.
The issue of greenhouse gas emissions has become a common challenge facing human society today. Since the entry into force of the United Nations Framework Convention on Climate Change and the Kyoto Protocol, countries have successively established carbon trading markets to achieve the goal of reducing greenhouse gas emissions, promoting emissions reduction through market mechanisms.
As one of the largest carbon emitters, China has committed to reducing its carbon dioxide emissions per unit of GDP by over 65% by 2030 compared to 2005. To achieve this goal, China launched seven pilot projects in 2011 and established a nationwide carbon market in 2021. Carbon emission trading is a market-oriented environmental regulatory tool that is relatively effective in achieving carbon dioxide emission reduction targets. The pilot carbon market in China is the world’s second largest carbon market after the EU carbon market, and the national carbon market in China will surpass the EU to become the world’s largest carbon market. The effective operation of China’s carbon market has an important impact on achieving global greenhouse gas control goals.
China’s carbon finance market follows the idea of selecting pilot regions first, and adopts a quota based approach for carbon trading nationwide. It has greater decision-making power and marketization level in policy, so the development level of each market is not consistent. The existing carbon trading system is mainly based on each province, which has problems such as resource waste, administrative barriers, and weak economies of scale, resulting in significant fluctuations in various carbon finance pilot markets. At the same time, there are differences in the degree of air pollution and ecological conditions among different regions in China, which can easily trigger fluctuations in carbon finance trading between regions, leading to systemic risks in the national carbon finance market. Although the trading mechanisms and methods vary in different markets, the reasons for their emergence are the same, all due to the lack of a complete system to constrain them. Relatively speaking, the carbon finance market is more susceptible to external factors such as macroeconomic, policy risks, and air quality levels.
Currently, China’s economic and social development has entered a new era of comprehensively deepening reform and expanding opening up, and is in a critical period of transitioning from a high-speed growth stage to a high-quality development stage. The carbon emission trading market is an important tool to help China achieve efficient emission reduction and promote the achievement of the carbon peaking and carbon neutrality goals (Zhang et al., 2020). At present, the carbon market has been widely used in multiple regions around the world, among which the EU carbon market is the earliest established and most mature carbon market in the world. At present, China’s carbon market is still in the initial stage of continuous development, with widespread problems such as relatively single participants and insufficient application of financial tools. Therefore, studying the effectiveness and correlation of the carbon market in pilot areas of China and constructing a correlation network of carbon market prices is of great significance for understanding the development pattern and evolution of China’s carbon market from a macro perspective.
At present, scholars have made extensive explorations on the effectiveness of the carbon market, factors influencing prices, and its risks. In terms of market efficiency, Daskalakis and Markellos (2008) used the variance ratio test to study spot and futures trading in the EU carbon market, and found that the EU carbon market did not reach a weak form efficiency level in the first stage. Montagnoli and Vries (2010) used the variance ratio test method to study the EU carbon market and found that it did not reach weak efficiency in the first stage, but reached weak efficiency in the second stage. At the same time, through research on futures trading in the EU carbon market from 2008 to 2011, Daskalakis (2013) found that the market had already reached weak efficiency. Ibikunle et al. (2016) also confirmed that the EU carbon market has reached an effective level. Zhao et al. (2017) used unit root tests and run tests to study the carbon emission trading markets in Beijing, Shanghai, Tianjin, and Shenzhen, and found that all four carbon trading markets achieved weak form efficiency. Wen et al. (2020) found that the carbon market, serving as an effective financial market, provides the effective carbon emission control mechanism and environmental management tool for reducing carbon emissions and mitigating climate change.
In terms of trading rules, price influencing factors, and risks in the carbon emission rights market. Wu et al. (2019) proposed a systematic framework model based on the electricity market by studying various pilot markets in China to estimate the total carbon emission quota required for the current energy intensity of China’s GDP. Zhou and Yiwen (2019) explored the role of Chinese financial institutions in carbon finance and pointed out the complex issues that will arise when China constructs a national carbon emission market from the perspective of sound laws and carbon finance innovation. Lin and Jia (2019) used the CGE model to evaluate the influencing factors of carbon emission rights prices and found that there is a significant positive correlation between European carbon emission rights prices and emissions reductions, with some key factors more likely to affect transaction prices. Song et al. (2017) predicted the price of carbon emissions rights in China by establishing a fuzzy random model and taking into account the impact of relevant policies, providing theoretical reference for government regulations related to corporate carbon trading strategies and carbon demand policies. Zhu et al. (2019) used a new comprehensive model of grey correlation analysis and empirical mode decomposition to determine the multiple time scales of the European carbon emission market. As the price of carbon emission rights increases, there will be non-linear changes in the production costs and carbon emissions of enterprises.
In addition, on the issue of price and risk premium in the carbon market, Zhang et al. (2018) found at the Shenzhen Carbon Emission Rights Exchange that the classification of carbon emission exemptions does not result in a significant carbon risk premium. However, the classification method is extreme, and empirical results indicate a significant negative carbon risk premium for stocks that are extremely “dirty”. Wen et al. (2020) used data from 245 companies on the Shenzhen Carbon Emission Rights Pilot Exchange and used methods such as DID to find that the establishment of a carbon emission rights exchange significantly increased the carbon risk premium. Many scholars have shown in their research that the carbon risk premium is related to the construction of a carbon emission trading rights market. Dong et al. (2019) found that the establishment of a provincial-level carbon emission trading market in China can reduce the province’s carbon emissions in the short term, but cannot increase GDP. In the long run, the establishment of a carbon emission trading market can achieve sustainable economic benefits. Other scholars have studied the impact of carbon emission trading policies on carbon reduction, as well as the differences between different countries and regions (Wang L. et al., 2020; Wang S. et al., 2020; Wang Z. et al., 2020; Zheng et al., 2021), there are also some scholars focusing on the measures of carbon quotas in the carbon markets of various provinces in China (Gan et al., 2022). In recent years, the volatility correlation between China’s carbon emission market has become a hot research topic (Guo and Feng, 2021; Lili et al., 2020), however it mainly focuses on several early established markets, such as carbon markets in Hubei, Shenzhen, Guangzhou, etc (Wang and Duan, 2022; Xu, 2021; Lyu and Scholtens, 2024). In addition, research has also focused on the interdependence between the carbon market and other markets, such as the carbon market and traditional mineral energy markets (coal, oil, etc.) (Zheng et al., 2021; Kai et al., 2020; Nie et al., 2021; Jiang et al., 2020; Qiao et al., 2021; Liu and Jin, 2020; Chen et al., 2024).
From the above research, it can be concluded that: firstly, current research on the carbon market is mainly focused on developed carbon markets in Europe or America, while research on China’s carbon emission market is more focused on listed companies participating in the carbon market; Secondly, research on the carbon market mainly involves market effectiveness, factors influencing prices, price and risk premiums, etc. There is little research on the internal carbon markets of a certain economy or the carbon markets between different economies. Therefore, this article is based on the development of China’s domestic carbon market and studies the complex network structure and dynamic evolution of dependence relationship within the Chinese carbon market system.
In terms of the methods used in this article, traditional econometric methods are difficult to measure the complex correlations between variables and their complex network structure characteristics, and are often limited to the process of constructing econometric models, which often requires pre-set parameters or limited to linear conditions, resulting in poor accuracy of empirical econometric results. With the interdisciplinary application of financial physics methods such as mutual information and transfer entropy, their advantages of being unmodeled, data-driven, and suitable for nonlinear conditions have been further explored, especially their strong advantages in characterizing complex networks under complex system conditions. Therefore, they have been widely used in the research of multiple economic and financial time series correlation networks (Wang and Hui, 2017; Wang and Hui, 2018; Wu and Xiaofeng, 2020; Wu and Xiaofeng, 2021a; Wu and Xiaofeng, 2021b). This article uses the method of mutual information to construct the dependence relationship between China’s carbon markets, and displays the results and core structure of the dependence relationship through methods such as heat maps and maximum spanning trees.
By characterizing the dependence of the eight carbon markets in China, this study attempts to identify the market that is relatively leading in development or is in a core and critical position among the current eight carbon markets. At the same time, based on the location environment, market system design, liquidity and other conditions and indicators of each market, the appropriate policy recommendations are proposed for China’s future construction of a unified national carbon emission market.
The marginal contributions of this study are as follows:
1. Most of the existing studies focus on one or several carbon markets, such as Hubei carbon market or Shenzhen carbon market. Few studies put the eight carbon markets in China into one framework, and few studies systematically study the complex network structure among the eight carbon markets, especially the core topology among the markets. This study will fill the gap in this regard.
2. This study compares and analyzes the similarities and differences of the core structure of the dependence relationship among China’s eight carbon markets before and after the proposal of China’s carbon peak and carbon neutral goal, and uses the sliding window method to investigate the dynamic evolution of the dependence relationship, and examines the development of China’s carbon market from both static and dynamic aspects, which systematically shows the overall picture of the relevance of China’s carbon market.
The following is the distribution of content in this article. The second part mainly introduces mutual information and kernel density estimation methods, the third part is data selection and basic mathematical statistics, the fourth part is the main results and analysis of the results, and the fifth part is the conclusions.
2 Methods
2.1 Mutual information
The relevant concept of information entropy comes from Shannon, who believes that information entropy can be used to measure the uncertainty of an event accurately. Usually the formula can be written as follows.
The entropy of a discrete random variable x could be expressed as (Wang and Hui, 2017; Wu and Xiaofeng, 2020):
where χ is the set of all possible ways that the random variable x may happen, and p(x) is the corresponding probability of the variable x. The above formula is a measure of the degree of uncertainty. Based on the actual application effect, the base of the logarithm is commonly set as 2, the unit is the bit.
Expand a single variable to two variables below. For the two random variables x and y, the joint entropy between them could be defined as (Wang and Hui, 2018; Wu and Xiaofeng, 2020):
where p(x, y) is the corresponding joint probability of the variable x and y.
The definition of mutual information (short for MI) between the variable X and Y could be defined as the following Formula 3 (Wang and Hui, 2017; Wu and Xiaofeng, 2020; Villaverde et al., 2014).
According to the above Formula 1, 2 the formula of MI could also be rewritten as the following Formula 4 (Wang and Hui, 2018; Wu and Xiaofeng, 2020; Steuer et al., 2002).
The mutual information between two variables measures the disclosure of the information from one variable to the other. If two variables have an independent relationship with each other, then their mutual information value is 0; If there is an interdependence between two variables, their mutual information value is greater than 0 (mutual information is always non negative), and the stronger the interdependence, the greater the value of mutual information (Wu and Xiaofeng, 2021a; Wu and Xiaofeng, 2021b; Kinney and Atwal, 2014).
2.2 Kernel density estimation
Let
Where h is the window parameter, which could be also known as the bandwidth, and
Where S is the value of determinant of its covariance matrix.
The selection of bandwidth is an important step in kernel density estimation. Drawing on previous research and practical experience (Yang et al., 2013), this study selects the optimal bandwidth according to the following Formula 7 (Wang and Hui, 2017; Wu and Xiaofeng, 2021a; Wu and Xiaofeng, 2021b).
The probability density of samples could be obtained by kernel density estimation, and then the entropy formula could be obtained as follows (Wang and Hui, 2018; Wu and Xiaofeng, 2021b).
Combined with Formulas 4, 8 we can get the final formula to calculate the mutual information value of the two variables, as shown in Formula 9 (Wu and Xiaofeng, 2021b).
This study uses the method of mutual information to measure the dependence among the eight carbon trading markets in China, this method can be applied under nonlinear conditions and can effectively depict the complexity of time series relationships; As well as, the kernel density estimation, as the non parametric estimation method, does not rely on the distribution of data and parameter settings. So both the method of mutual information and the kernel density estimation could more accurately depict the degree of correlation between various carbon trading markets in China.
The mutual information method used in this paper is a common method in information theory to measure the dependence between Chinese carbon markets by capturing the correlation of data between time series. This method is data-driven and does not need to preset the parameters in advance. It can be used in both linear and nonlinear situations. Therefore, this method can ensure the scientificity of the research method to the greatest extent. At the same time, the application of kernel density estimation can not only relax the limit on the probability distribution of time series samples, but also ensure the scientific nature of statistical analysis.
3 Data
This study uses the closing price of the daily market data of 8 carbon trading markets in China’s carbon emission trading system, including Beijing, Shenzhen, Tianjin, Guangdong, Shanghai, Hubei, Chongqing, and Fujian, as the research object. The data selected in this study comes from the Wind database, and the time range of the data is from January 2017 to December 2021, a total of 5 years of the daily closing price, and each market has 1212 observations. The detail of the 8 carbon trading markets are shown in Table 1.
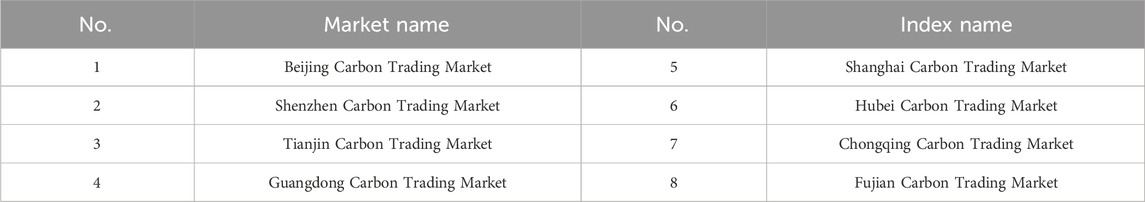
Table 1. The numbers and names of the 8 carbon trading markets of China.
According to the experience of previous literature, this paper calculates the logarithmic return of each carbon trading market daily closing price according to Formula 10. Where p(t) and p(t-1) are the daily closing price of the market on dates t and t-1 respectively, R(t) is the logarithmic return of the market daily closing price on date t.
The stability of the time series is the basis for calculating mutual information. This article uses the Augmented Dickey Fuller test (ADF) to measure the stability of the logarithmic return time series of China’s 8 carbon trading markets daily closing prices; Meanwhile, the Jarque Bera test is also used to examine the logistic return series of Gaussian distribution. As shown in Table 2, all of the 8 carbon trading markets daily closing price logistic return series are stationary and they do not observe Gaussian distribution.
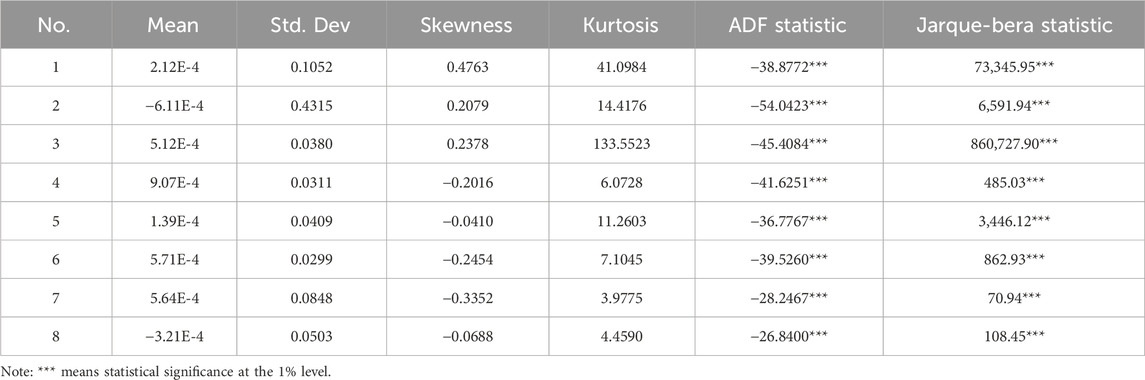
Table 2. Statistical characteristics of the 8 carbon trading markets.
4 Results and discussion
4.1 Mutual information value among the markets
In this section, we first calculate the mutual information values between the daily logarithmic returns of the eight carbon markets in China’s carbon emission trading system, representing the degree of dependence between each carbon market. Due to the impact of the COVID-19 in early 2020, the operation of most Chinese enterprises, the overall demand and development of social economy have been greatly affected; At the same time, due to the proposal of China’s carbon peaking and carbon neutrality goals in 2020, these will inevitably affect the adjustment of enterprises’ demand for carbon emissions rights. Therefore, 2020 is used as the boundary point to explore the dependence within China’s carbon emission trading system from 2017 to 2019, and from 2020 to 2021. In order to have a clear observation of the results of the dependence relationship, and to clearly compare the changes of the dependence relationship in China’s carbon emission trading system before and after 2020, the launch of the carbon peaking and carbon neutrality goals, this paper uses the thermodynamic chart to express the calculation results of mutual information.
Figure 1 shows the dependence relationships within China’s carbon emission trading system between 2017 and 2019, as well as between 2020 and 2021. The numbers in the horizontal and vertical axes of the figure are the labels of the eight carbon markets in Table 1, and the values of the dependence relationships between the eight markets are replaced by the tables in the figure, if the value of MI between market
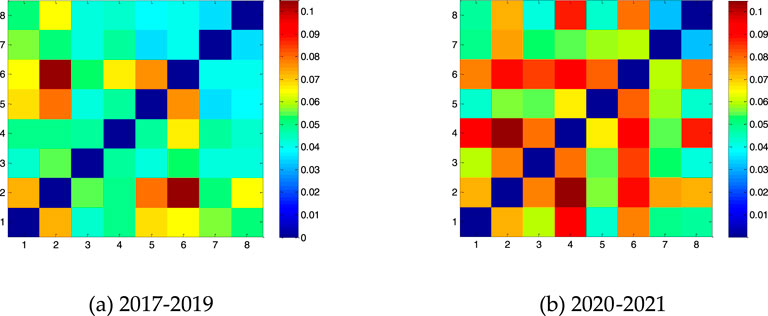
Figure 1. Colormaps of the MI among the 8 markets during the 5 years. (a) 2017-2019. (b) 2020-2021.
From the results in Figure 1, it can be seen that from 2017 to 2019, except for the strong dependence between the Shenzhen market (NO.2) and the Hubei market (NO.6), the dependence between other markets was relatively weak, especially the Tianjin market (NO.3), Guangdong market (NO.4), Chongqing market (NO.7), and Fujian market (NO.8), which have the weakest dependence with other markets; Secondly, from 2020 to 2021, the dependence within China’s carbon emission trading system was strong, with the strongest dependence between the Shenzhen market (NO.2) and the Guangdong market (NO.4), and the dependence between other markets increased compared to the 3 years from 2017 to 2019; Finally, a common feature of the two graphs is summarized, which is that the strongest dependence between the markets during both periods is between the Shenzhen market (NO.2) and other markets. This indicates that the connection between the Shenzhen carbon emission trading market and other markets is closer, which is not only related to the economic prosperity and number of enterprises in Shenzhen, but also because the Shenzhen carbon emission trading market was established earlier than other markets, The corresponding trading system is more perfect, and the participants in this carbon emission trading market are more extensive, which has prompted other markets and their carbon emissions trading participants to strengthen their correlation with the Shenzhen Carbon Emission trading market.
Next, calculate the node strength of the dependence between the eight carbon emission trading markets in China from 2017 to 2019, and from 2020 to 2021. The node strength reflects the sum of mutual trust values between each market and the other seven markets during each period, as shown in Formula 11, and NS is the abbreviation for node strength:
Where Wij is the MI (the abbreviation for Mutual Information, as shown in Equation 4 between the carbon trading market i and market j, and i≠j.
Figure 2 shows the node strengths of 8 markets within two intervals. The number in horizontal axis is the No. of each market in Table 1, and the number in vertical axis represents the value of node strength. Here, we will uniformly adjust the range of the vertical coordinates of the two intervals to 0-0.6, so that we can more clearly compare the changes in the strength of each market node in the two intervals.
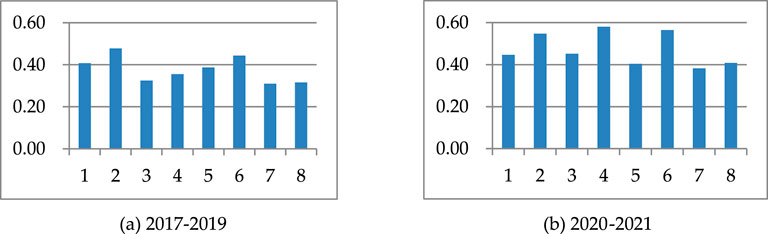
Figure 2. The NS value of the 8 markets in the two stages in the 5 years. (a) 2017-2019. (b) 2020-2021.
Firstly, from the results shown in Figure 2, it can be observed that the node strength of each market in the 2 years 2020–2021 was greater than their node strength in the 3 years 2017–2019. This indicates that after 2020, the carbon peaking and carbon neutrality goals were proposed, the dependence between China’s eight major carbon markets has become closer. In addition, the three carbon markets with the highest node intensity after 2020 are the Shenzhen market (NO.2), Guangdong market (NO.4), and Hubei market (NO.6), which also echoes the results shown in the heat map in Figure 1.
Secondly, Table 3 shows the node strength of 8 markets over the two periods, as well as the mean and changes in the strength of each market node (represented by standard deviation). From the results shown in Table 3, it can be observed that among all eight carbon markets, the Guangdong market (NO.4) experienced the greatest changes before and after the proposal of the carbon peaking and carbon neutrality goals, with a standard deviation of 0.1123 between the two stages. Specifically, the node strength of the Guangdong market (NO.4) jumped from the fifth place before 2020 (at this time, the node strength was 0.3562) to the first place in the 2020 to 2021 stage (at this time, the node strength was 0.5808). Combining the results of Figure 2 and Table 3 with the above analysis, it can be found that during the 2020 to 2021 period, two of the three carbon markets with the highest node strength are located in Guangdong Province (namely Shenzhen market (NO.2) and Guangdong market (NO.4)). It is particularly noteworthy that the node strength of Guangdong market (NO.4) has rapidly increased in the second stages, which is related to the industrial structure of Guangdong and the carbon emission reduction pressure of various cities in Guangdong Province. According to the Assessment Report on Collaborative Management of Carbon Dioxide and Air Pollution in Chinese Cities (2020), from 2015 to 2019, only one-third of the nine inland cities in the Guangdong - Hong Kong - Macao Greater Bay Area achieved carbon dioxide emissions reduction, and the other two-thirds of cities had varying degrees of increase in carbon dioxide emissions, indicating that the burden of carbon emissions reduction in the Greater Bay Area is still relatively heavy; In addition, the industrial structure of Guangdong Province accounts for a relatively large proportion of the total energy consumption in the secondary industry (about 60%) in the energy consumption layout, which leads to a relatively large proportion of high carbon emission energy consumption such as coal, oil, and gas in the Greater Bay Area. Therefore, the Shenzhen market (NO.2) and the Guangdong market (NO.4), two carbon emission markets located in Guangdong Province, have more participants and more active trading. Therefore, they also have a strong dependence with other markets and have a strong node strength.
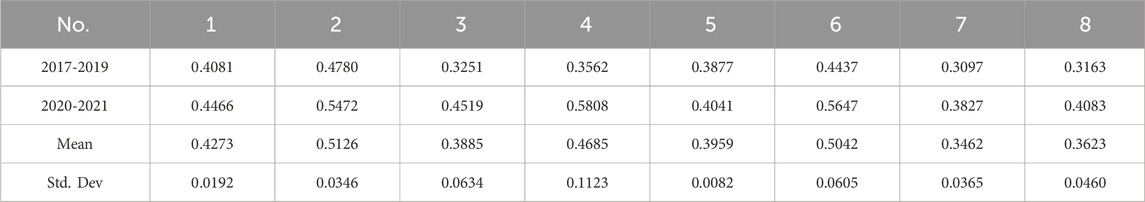
Table 3. The description of the 8 markets’ node strength in the two stages respectively.
In addition, a longitudinal comparison was conducted between the two intervals, and the mean and standard deviation of the node strength of the eight carbon markets during the 2017-2019 period were 0.3781 and 0.0582, respectively, lower than the corresponding values of 0.4733 and 0.0740 during the 2020-2021 period. This indicates that the dependence between various markets in China’s carbon emission trading system has strengthened since 2020, and the differences in importance of each market in the entire carbon emission trading system have gradually widened.
Finally, from the results of Figure 2 and Table 3, it can be found that the node strength of the four carbon markets, Tianjin market (NO.3), Shanghai market (NO.5), Chongqing market (NO.7), and Fujian market (NO.8), are relatively small in both stages, all below 0.4. This indicates that the correlation between the four carbon markets and other markets is weak.
Overall, China’s carbon market belongs to a policy-driven market, and some market prices have not fully responded to external information, making it difficult for carbon trading prices to reflect all information in the market (Du et al., 2020).
Beijing, Shanghai, and Tianjin, as the most developed regions in China’s economy, have not shown a strong central position in the whole carbon trading markets. On the contrary, Hubei which is relatively underdeveloped, is in a relatively core position in the entire carbon emission system. This indicates that economically underdeveloped regions can improve carbon trading activity and operational stability through the design and optimization of trading systems. This also provides us with an important inspiration, which is that the exploration of China’s carbon emission market does not necessarily need to start from the most economically developed regions. Relatively underdeveloped regions can fully achieve the advantage of latecomers in developing carbon emission markets.
Generally speaking, the unit emission reduction cost in developed regions is higher than that in developing regions. Because the cost of energy structure adjustment, improvement of energy consuming technology and equipment in developed regions is very high. The significant difference in emission reduction costs is precisely the inherent reason why developing regions have a latecomer advantage. Compared to several other regions, Hubei Province has an unbalanced economic development, and the overall level of development needs to be improved. The cost of enterprise emission reduction is relatively the lowest. In addition, as a major industrial province in China, Hubei Province has a large energy consumption and carbon emissions, and its endogenous emission reduction demand is fully guaranteed. Therefore, it can effectively improve the trading activity and continuity of the carbon market.
At the same time, the Hubei Exchange has also formulated various institutional designs to increase trading volume and stabilize price fluctuations. For example, the Hubei market allows individual investors to participate in carbon trading, which greatly enhances trading liquidity and avoids price fluctuations caused by trading volume suspensions.
Compared to traditional financial markets, China’s carbon market has shortcomings in terms of liquidity and market efficiency (Liu et al., 2020). Especially in carbon markets such as Chongqing, Tianjin, Fujian, and Beijing, the trading volume is very inactive, and most of the transactions in some markets are concentrated in the implementation period. This leads to insufficient investor response to market information and insufficient marketization, resulting in insufficient market trading volume and liquidity, ineffective formation of market mechanisms, and poor market efficiency (Lili et al., 2020). At the same time, the unreasonable allocation of carbon free quotas in some markets has led to oversupply, causing price signals to lose their incentive effect (Zhou et al., 2023), for example, the carbon trading pilot market in Chongqing has low market transparency and participation enthusiasm, resulting in a severe oversupply of the originally established carbon quotas.
4.2 Maximum spanning tree
The maximum spanning tree is an effective method for clearly characterizing the core structure of the dependence relationship between each node. By selecting the maximum edge weight between two nodes, the dependence relationship between the two is constructed (Kwapien et al., 2017). Figure 3 shows the results of using the maximum spanning tree method to depict the core structure of the dependence between the eight carbon markets in China’s carbon emission trading system from 2017 to 2019, and from 2020 to 2021. The numbers at each point are the labels of each carbon market (see Table 1). At the same time, in order to clearly observe the position of each node in the maximum spanning tree, nodes at the edge position are marked in green, and nodes at the intermediate position are marked in yellow and pink.
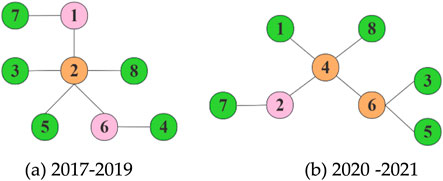
Figure 3. Maximum spanning trees (MSTs) of the 8 markets in the 5 years. (a) 2017-2019. (b) 2020-2021.
As shown in Figure 3, firstly, we can find that among the eight carbon markets, only the Shenzhen market (NO.2) and the Hubei market (NO.6) appeared as intermediary nodes during both periods. The Beijing market (NO.1) served as an intermediary node between 2017 and 2019, while the Guangdong market (NO.4) became a new intermediary node between 2020 and 2021; It can also be easily seen that the other four carbon markets have always been at the edge of the core structure. Therefore, it can be considered that the core structure of the dependence among the eight carbon markets within China’s carbon emission trading system exhibits a relatively stable feature, and the Shenzhen and Hubei markets have always been intermediate nodes.
In addition, pay attention to the number of edges owned by each node in the intermediary position during the periods 2017-2019, and 2020-2021. Generally speaking, in a complex network, the more edges there are between a node and other nodes, the more prominent the node’s position as the core in the entire network, and the stronger its centrality and importance. During the period from 2017 to 2019, the Shenzhen market (NO.2) had 5 edges in the maximum spanning tree structure, while the other two carbon markets in intermediary positions, namely the Beijing market (NO.1) and the Hubei market (NO.6), only had 2 edges; During the period from 2020 to 2021, the Guangdong market (NO.4) had 4 edges in the maximum spanning tree structure, while the other two carbon market markets located at intermediate nodes, namely the Hubei market (NO.6) and the Shenzhen market (NO.2), had 3 edges and 2 edges, respectively. From the above results, it can be seen that during the periods of 2017-2019 and 2020-2021, the two carbon markets located in Guangdong Province, China, namely the Shenzhen market (NO.2) and the Guangdong market (NO.4), respectively, have the highest number of carbon markets that maintain the strongest dependence with other carbon markets. Therefore, it can be considered that the carbon market in Guangdong Province has a higher level of development nationwide and plays an important role in China’s carbon emission trading system. This result is consistent with the analysis of the heat map above.
Furthermore, the four carbon markets mentioned above have a geographical distribution characteristic of presenting a “north-central-south” pattern. The Beijing market (NO.1) belongs to the carbon market in northern China, the Hubei market (NO.6) belongs to the carbon market in central China, and the Shenzhen market (NO.2) and Guangdong market (NO.4) are the carbon markets in southern China. Of course, the above analysis also shows that the carbon market in southern China is more important, this is also in line with the pattern of China’s economic development.
The eight carbon markets in China are located in different regions, and the industry structure varies in each region. Hubei, Guangdong, and Shenzhen, these three carbon markets, occupy an extremely important position in China’s carbon market (Lili et al., 2020). Meanwhile, due to the influence of geographical location and market location, the dependence between the carbon markets in Guangdong and Shenzhen is more evident (Zhu et al., 2020). On the other hand, the macroeconomic environment in which the carbon markets in Guangdong and Shenzhen are located is relatively similar, so the influencing factors of the two markets are also basically similar (Dai et al., 2022).
Finally, the Tianjin market (NO.3), Shanghai market (NO.5), Chongqing market (NO.7), and Fujian market (NO.8), all four carbon emission markets, remained at the marginal position both from 2017 to 2019 and from 2020 to 2021. This indicates that the four markets mentioned above have only one largest edge connected to other markets and have weak dependence with other markets. It should be pointed out that although Shanghai is the most developed city in China, and it is the economic and financial center, due to the highly developed tertiary industry in the Yangtze River Delta region, the demand for carbon emissions rights in the local and surrounding areas is not high. Therefore, the importance of the Shanghai market (NO.5) in China’s overall carbon emissions trading system is not strong.
The economic mechanisms of these relationships:
A highly active market means a large amount of trading, quoting, and inquiry behavior, which accelerates the price discovery process within the market, allowing its carbon price to reflect the real supply and demand relationship and market expectations more quickly and accurately. Participants in other markets, such as investors, emission control companies, intermediaries, etc., will closely monitor the price signals of this active market and consider their important reference information. Their buying and selling decisions and price expectations will be influenced by the dynamics of this active market, leading to price fluctuations in their market becoming synchronized with the active market, manifested as increased correlation between markets.
In addition, an active market is not only the source of price information, but also the gathering and dissemination center of non price information such as policy interpretation, industry dynamics, and macroeconomic expectations. A large number of participants trade, discuss, and analyze in this market, enabling relevant information to spread faster and more widely. At the same time, participants in other markets will adjust their strategies after absorbing this information, resulting in their market behavior being more in line with the pace of active markets, and the correlation between markets naturally increases.
From the perspective of investor sentiment, active markets are more likely to form and amplify specific market emotions, such as optimism and panic. This emotion can quickly spread to other markets through media reports, analyst reports, participant exchanges, and other channels, affecting the confidence and behavior of other market participants, leading to a convergence of market fluctuations.
Therefore, as analyzed above, the correlation between active markets and all other markets is generally stronger. In a network diagram, this means that the nodes represented by the market have more edges with greater weights connected to other nodes. This directly leads to its very high centrality.
An active market is the core node for information generation, aggregation, and diffusion, as well as the main distribution center for cross market arbitrage capital. The information transmission or capital flow between other markets often requires the most active, informative, and liquid market as an intermediary. For example, from the results in Figure 3, it can be seen that during the time range of 2014-2019, information from the Shenzhen market (NO.2) needs to be quickly transmitted to the Guangdong market (NO.4), which may first be captured and amplified by active traders in the Hubei market (NO.6), and then transmitted to the Guangdong market (NO.4). This makes the active market play a key bridging role in the network, with high intermediary centrality. Due to the rapid impact of information and price changes in active markets on other markets, its “distance” to other nodes in the network, i.e. the number of steps required for information transmission or price linkage, is relatively short, making it easier to “reach” other parts of the network. In addition, an active market not only has multiple connections, but also often has stronger connections with other relatively important nodes in the network. This strong alliance further enhances its centrality.
Once a market becomes central due to activity, it will attract more participants, more information, and more capital inflows, thereby further consolidating its activity and central position, forming a positive feedback loop. This reflects the self reinforcement of network structure.
4.3 Dynamic evolution of the dependence relationship
The empirical research in the above two parts examines the dependence and structural characteristics of the eight carbon markets in China’s carbon emission trading system from 2017 to 2019, and 2020 to 2021, respectively. In order to more accurately characterize the characteristics of the dependence relationship and identify the changes in the dependence relationship within China’s carbon emission trading system from 2017 to 2021, the sliding window method is used to investigate the dynamic evolution process of the dependence relationship among eight carbon markets.
In this study, based on the sample time span from 2017 to 2021, the sliding window width is set to 240, which is the trading data of 1 year; The sliding distance of each window is set to 60, which is the trading data for the every quarter. According to the above sliding window and sliding distance settings, the time series data used in this study can be divided into 17 windows.
Figure 4 shows the average mutual information between the eight carbon markets in China’s carbon emission trading system within each window from 2017 to 2021. From the graph, it can be seen that after the fourth window, although the average mutual information value between carbon markets fluctuates, it remains stable overall. It is worth noting that in the 12th window, the average mutual information value between the eight carbon markets reached the maximum, and at this time, the window contains the time series of the first three-quarters of 2020. Therefore, it can be considered that although most regions and enterprises in Chinese Mainland stopped production in the early stage of the epidemic in 2020, with the explicit proposal of China’s the carbon peaking and carbon neutrality goals in 2020, as well as the gradual resumption of production in Chinese Mainland since May 2020, the correlation between the eight carbon markets in China’s carbon emission trading system has increased.
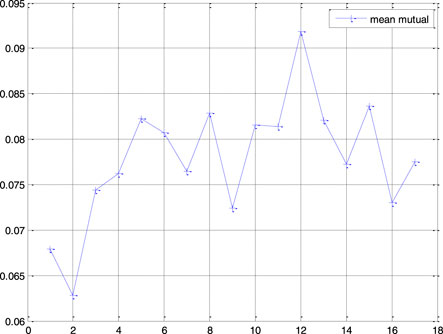
Figure 4. Average mutual information among 8 carbon markets.
Figure 5 shows the carbon market with the maximum and minimum node strengths in China’s carbon emission trading system within each of the 17 sliding windows. The numbers in the horizontal axis of Figure 5 represent the position of the 17 sliding windows, while the numbers in the vertical axis represent the labels of the eight carbon markets in Table 1. From the graph, it can be observed that the markets with the highest node strength are mainly concentrated in the carbon markets located in Guangdong Province, namely the Shenzhen market (NO.2) and the Guangdong market (NO.4). Among all 17 sliding windows, these two markets became the strongest nodes in a total of 13 (9 + 4) windows. Especially in the 14th to 17th sliding windows, the Guangdong market (NO.4) has always been at the strongest node position, which is consistent with the above analysis, that is, the Guangdong market has become an important intermediary node in China’s carbon emission trading system after 2020. Correspondingly, the markets with the minimum node strength are Tianjin market (NO.3), Shanghai market (NO.5), Chongqing market (NO.7), and Fujian market (NO.8). This indicates that these four markets have the smallest dependence relationship with other markets and the weakest correlation with other markets, which is consistent with the static analysis results of the maximum spanning tree mentioned above.
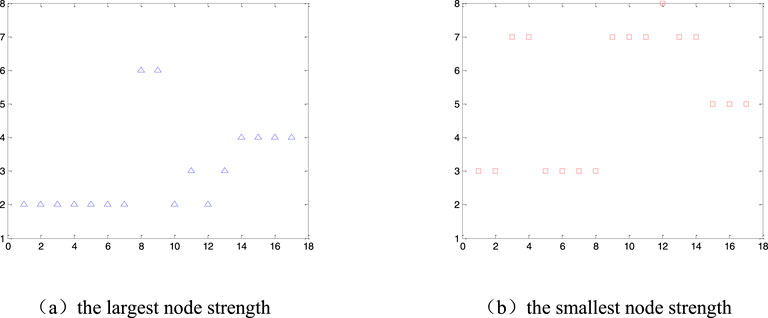
Figure 5. The markets with the largest or smallest node strength: (a) the largest node strength. (b) the smallest node strength.
The uncertainty of economic policies is also one of the reasons for the large fluctuations in the trend of the interdependence mentioned above. In recent years, China’s energy consumption structure has been improving, and the reliance on traditional energy sources such as coal has been decreasing for high-quality economic development. However, fossil fuels such as coal remain the most fundamental source of energy for industrial operation, production, and daily life. Therefore, due to the strong dependence of economic development on coal, which is time-varying, the price fluctuations of the carbon market also have time-varying characteristics, and the dependence between different markets will also exhibit time-varying characteristics (Wang X. et al., 2020; Li et al., 2020; Deng et al., 2023; Wang et al., 2024).
As shown in Table 4, it represents, in the total 17 sliding windows, with which market, a certain carbon emission trading market maintains the strongest dependence relationship, or in other words, which carbon emission trading market is most closely related to the certain one. For example, in the position of matrix (A, B), the initial value is 0; When the maximum MI value of market A related to market B, then we add 1 to the position of matrix (A, B). From Table 4 we can see that the table is not symmetric, because the maximum weight edge of market A may relate to market B, however the maximum weight edge of market B may relate to the another market, such as C or D, which leads to asymmetry in this table. In the following Table 4, the number in the first row and the first column are the No. shown in Table 1.
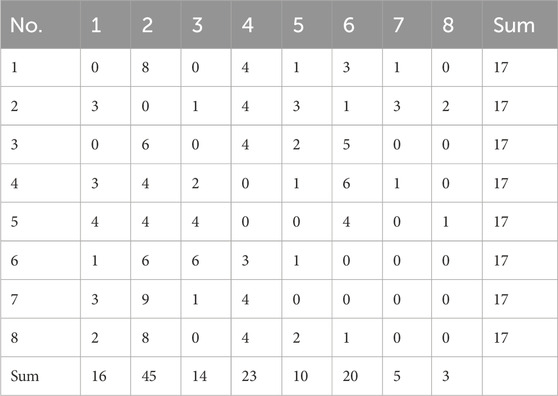
Table 4. Total number of the strongest edge between the markets in the 17 rolling windows.
It can be observed from the results in Table 4. Firstly, among all 17 windows, the Shenzhen market (NO.2), Guangdong market (NO.4), and Hubei market (NO.6) have the highest number of edges compared to other carbon markets, with the highest number 45, 23, and 20 respectively. This indicates that for the remaining seven carbon markets in China’s carbon emission trading system, excluding itself, out of a total of 119 (17 * 7) strongest dependencies, the Shenzhen market (NO.2) accounted for 45, the Guangdong market (NO.4) accounted for 23, and the Hubei market (NO.6) accounted for 20, which is higher than the number of strongest dependencies between each market and other markets (17). Specifically, for the Shenzhen market (NO.2), among the 17 strongest dependencies in all its windows, there has been the strongest dependence relationship between this market and all other 7 markets, and all other 7 markets also maintain a certain degree of strongest dependence relationship with this market, which does not exist in all other markets. Therefore, it can be further believed that, The Shenzhen market (NO.2) has the widest and most common correlation within China’s carbon emission trading system.
Secondly, the Chongqing market (NO.7) and the Fujian market (NO.8) have the least number of largest edges, 5 and 3 times respectively. This indicates that among the 119 strongest economic dependencies among the other 7 carbon markets, there are only 5 and 3 markets that maintain the strongest economic dependencies with the Chongqing market (NO.7) and the Fujian market (NO.8), and the Shenzhen market (NO.2) is the market with the closest relationship to the two markets mentioned above, Specifically, three out of the five strongest dependencies in the Chongqing market (NO.7) were between the Shenzhen market, while two out of the three strongest dependencies in the Fujian market (NO.8) were between the Shenzhen market.
Finally, the other three carbon markets, namely the Beijing market (NO.1), Tianjin market (NO.3), and Shanghai market (NO.5), have the highest number of edges with other carbon markets, with 16, 14, and 10 times respectively. Although the cities where these three markets are located are directly under the central government of China (with four municipalities in China, namely Beijing, Tianjin, Shanghai, and Chongqing), their economic development and political status are particularly prominent, However, from its position in the entire dependence network, the development level and importance of its carbon market are not high. This conclusion also echoes the research conclusion of the static analysis above.
4.4 Discussion on geographical clustering phenomenon
Regarding the geographical distribution of the eight carbon emission trading markets in China, it is worth noting that some of these markets are located in nearby cities or within the same province. Is there a spatial clustering phenomenon between China’s carbon markets? The above phenomenon will be tested based on the results shown in Table 4 and Figure 3.
For the current eight carbon markets, the cities where Beijing market (NO.1) and Tianjin market (NO.3) are located are adjacent, while the cities where Shenzhen market (NO.2) and Guangdong market (NO.4) are located in the same province. Below from the perspective of the core structures of the dependence between Beijing market (NO.1) and Tianjin market (NO.3), as well as Shenzhen market (NO.2) and Guangdong market (NO.4), examine whether there is a phenomenon of geographical clustering between the markets based on their correlation characteristics across all windows.
Firstly, for the Beijing market (NO.1) and Tianjin market (NO.3): Both Beijing and Tianjin are municipalities directly under the central government of China and important economic and trade centers in northern China. Among them, Beijing is China’s political, cultural, and technological innovation center; Tianjin is adjacent to Beijing and serves as the gateway for northern China’s opening up to the outside world. It is also a shipping center, logistics center, and modern manufacturing base in northern China. From the results shown in Figure 3, it can be observed that the Beijing market (NO.1) and Tianjin market (NO.3) do not have a common edge in the core structure diagram of the dependence relationship; And from the results shown in Table 4, it can be observed that among all 17 sliding windows, the two markets do not have the largest edge between each other. Therefore, it can be considered that there is no geographical clustering phenomenon between the Beijing market (NO.1) and the Tianjin market (NO.3).
Secondly, for the Shenzhen market (NO.2) and the Guangdong market (NO.4): Guangdong Province is the largest economic province in China, serving as the forefront of China’s reform and opening up and a window for introducing the western economy, culture, and technology. Shenzhen is a window of China’s reform and opening up, a special economic zone, a national economic center city, an international city, and a center for technological innovation. Shenzhen is a provincial-level city in Guangdong Province. From the results shown in Figure 3, it can be observed that between 2017 and 2019, the Shenzhen market (NO.2) and the Guangdong market (NO.4) did not have a common edge in the core structure diagram of the dependence relationship. However, between 2020 and 2021, the Guangdong market (NO.4) was at the center of the core structure of the dependence relationship, and had a common edge with the Shenzhen market (NO.2); Meanwhile, in the results shown in Table 4, it can be observed that among the 17 windows, the Shenzhen market (NO.2) maintains the maximum edge between the 4 windows and the Guangdong market (NO.4), while the Guangdong market (NO.4) also maintains the maximum edge between the 4 windows and the Shenzhen market (NO.2), accounting for nearly a quarter of the proportion (4/17).
Therefore, it can be considered that there is a certain degree of geographical clustering phenomenon between the Shenzhen market (NO.2) and the Guangdong market (NO.4), but this phenomenon is not obvious, or it became more prominent in the period after 2020, and this phenomenon is only reflected in relatively active carbon markets, such as the Shenzhen market (NO.2) and the Guangdong market (NO.4).
5 Conclusion
To address the crisis caused by global climate change and achieve the goal of carbon neutrality, China actively explores the development and continuous improvement of an influential carbon market. This article focuses on the correlation between eight carbon emission trading markets in China in recent years. The mutual information method is used to explore the characteristics of the dependence relationship between the markets from 2017 to 2021. The maximum spanning tree method is used to construct and compare the core structure of the dependence relationship, and the sliding window method is used to examine the dynamic evolution of the dependence relationship. The main research conclusions of this article are as follows.
Firstly, there is a broad dependence between the eight carbon emission trading markets in China, and this dependence is changing with the process of economic development. Especially after China proposed the carbon peaking and carbon neutrality goals in 2020, the correlation between the eight carbon markets has been significantly strengthened.
Secondly, overall, the carbon market in China presents a “north-central-south” distribution pattern. The carbon market in northern China is centered around the Beijing market (NO.1), while the carbon market in central China is centered around the Hubei market (NO.6). The carbon market in southern China is centered around the Shenzhen market (NO.2) and the Guangdong market (NO.4), and the carbon market in the south is more important, which is also in line with the pattern of China’s economic development.
Furthermore, the geographical clustering phenomenon within China’s carbon market system is not obvious, and it only began to become prominent after 2020, and this phenomenon is only reflected in relatively active carbon markets, such as the Shenzhen market (NO.2) and the Guangdong market (NO.4).
Finally, the carbon market in Guangdong Province has a higher level of development nationwide and plays an important role in China’s carbon emission trading system. The province has two carbon emission markets, namely the Shenzhen market (NO.2) and the Guangdong market (NO.4), which are at the core of China’s carbon market system. This is closely related to the economic development level and industrial development model of Guangdong Province.
Based on the above research conclusions, in the development process of China’s future carbon market, especially after the carbon peaking and carbon neutrality goals are proposed, the correlation between carbon markets gradually strengthens. This requires market regulators to pay more attention to the prominent role of the Beijing market (NO.1), Shenzhen market (NO.2), Guangdong market (NO.4), and Hubei market (NO.6) in the core position of the carbon market correlation network, especially the development and stability of the carbon market in Guangdong Province, in order to ensure the healthy and stable operation of other carbon markets that maintain strong dependence with it.
The practical significance of the conclusions drawn from this study and the exploration of the underlying reasons can be summarized as follows.
Firstly, the exploration of China’s carbon emission market does not necessarily need to start from the most economically developed regions. Relatively underdeveloped regions can fully achieve the advantage of being a latecomer in developing the carbon emission market.
Secondly, it is necessary to explore and innovate various institutional designs, enrich relevant carbon finance products, increase the development of carbon finance derivatives, especially carbon futures, and leverage the price discovery function of futures (Ma and Lianyong, 2022; Zhou et al., 2021), thereby to increase the trading volume of the carbon emissions market, promote the market liquidity, and leverage the risk management function of the market. The variety and richness of financial products in the financial market directly affect the investment of market participants and risk hedging. Therefore, increasing the liquidity of the carbon market is crucial, but attention should be paid to suppressing market speculation, because the purpose of the carbon market is not to trade, but to force enterprises to save energy and reduce emissions and upgrade industrial structure through market mechanisms.
Finally, enhancing the marketization level of the carbon market, leveraging the role of the market and government in the construction of the carbon trading market, and forming a reasonable pricing mechanism to avoid unreasonable allocation of carbon free quotas, is also an important guarantee for the liquidity of the carbon trading market.
At present, China’s carbon market is in a critical period of transformation from the eight regional carbon markets mentioned above to the national carbon market. Some of the conclusions of this study and the practical significance derived from it will provide useful reference for the establishment of the national carbon market.
Future research will focus on the dependence between carbon markets and other financial or energy markets, fully tapping into the financial attributes of carbon markets and characterizing this dependence from multiple perspectives of complex networks. In addition, the main focus is on studying the trading rules of various carbon trading markets and finding carbon trading system arrangements that are suitable for regions with different levels of economic development in China.
Data availability statement
The raw data supporting the conclusions of this article will be made available by the authors, without undue reservation.
Author contributions
XW: Software, Conceptualization, Writing – review and editing, Writing – original draft, Methodology. XH: Funding acquisition, Supervision, Writing – review and editing. JC: Data curation, Writing – original draft, Methodology, Investigation.
Funding
The author(s) declare that financial support was received for the research and/or publication of this article. This research was funded by National Natural Science Foundation of China (Grant No. 71532004; 71773024).
Conflict of interest
Author XW was employed by Harbin Bank Co., Ltd.
The remaining authors declare that the research was conducted in the absence of any commercial or financial relationships that could be construed as a potential conflict of interest.
Generative AI statement
The author(s) declare that no Generative AI was used in the creation of this manuscript.
Publisher’s note
All claims expressed in this article are solely those of the authors and do not necessarily represent those of their affiliated organizations, or those of the publisher, the editors and the reviewers. Any product that may be evaluated in this article, or claim that may be made by its manufacturer, is not guaranteed or endorsed by the publisher.
References
Charles, A., Darné, O., and Fouilloux, J. (2013). Market efficiency in the European carbon markets. Energy Policy. 60, 785–792. doi:10.1016/j.enpol.2013.05.036
Chen, Z.-H. J., Zhao, S.-Yu, Song, H.-B., Yang, M.-Y., and Li, S.-P. (2024). Dynamic volatility spillover relationships between the Chinese carbon and international energy markets from extreme climate shocks. Int. Rev. Econ. and Finance 92, 626–645. doi:10.1016/j.iref.2024.02.005
Dai, P. F., Xiong, X., Huynh, T. L. D., and Wang, J. (2022). The impact of economic policy uncertainties on the volatility of European carbon market. J. Commod. Mark. 26, 100208. doi:10.1016/j.jcomm.2021.100208
Daskalakis, G. (2013). On the efficiency of the European carbon market: new evidence from phase II. Energy Policy 54 (3), 369–375. doi:10.1016/j.enpol.2012.11.055
Deng, Y., Jiang, W., and Wang, Z. (2023). Economic resilience assessment and policy interaction of coal resource oriented cities for the low carbon economy based on AI. Resour. Policy 82, 103522. doi:10.1016/j.resourpol.2023.103522
Dong, F., Dai, Y., Zhang, S., Zhang, X., and Long, R. (2019). Can a carbon emission trading scheme generate the porter effect? Evidence from pilot areas in China. Sci. Total Environ. 653, 565–577. doi:10.1016/j.scitotenv.2018.10.395
Du, J., Pan, M., Chen, Y., and Duan, Y. (2020). An efficiency-based allocation of carbon emissions allowance: a case study in China. J. Clean. Prod. 251, 119346. doi:10.1016/j.jclepro.2019.119346
Gan, L., Ren, H., Cai, W., Wu, K., Liu, Y., and Liu, Y. (2022). Allocation of carbon emission quotas for China's provincial public buildings based on principles of equity and efficiency. Build. Environ. 216, 108994. doi:10.1016/j.buildenv.2022.108994
Guo, L. Y., and Feng, C. (2021). Are there spillovers among China’s pilots for carbon emission allowances trading? Energy Econ. 103, 105574. doi:10.1016/j.eneco.2021.105574
Ibikunle, G., Gregoriou, A., Hoepner, A. G. F., and Rhodes, M. (2016). Liquidity and market efficiency in the world’s largest carbon market. Br. Account. Rev. 48 (4), 431–447. doi:10.1016/j.bar.2015.11.001
Jiang, C., Wu, Y., Li, X., and Li, X. (2020). Time-frequency connectedness between coal market prices, new energy stock prices and CO2 emissions trading prices in China. Sustainability 12, 2823. doi:10.3390/su12072823
Kai, C., Chao, Z., and Wen, W. H. (2020). Asymmetric dependence structures between emission allowances and energy markets: new evidence from China's emissions trading scheme pilots. Environ. Sci. Pollut. Res. 27, 21140–21158. doi:10.1007/s11356-020-08237-x
Kinney, J. B., and Atwal, G. S. (2014). Equitability, mutual information, and the maximal information coefficient. PNAS 111 (9), 3354–3359. doi:10.1073/pnas.1309933111
Kwapien, J., Oswiecimka, P., Forczek, M., and Drozdz, S. (2017). Minimum spanning tree filtering of correlations for varying time scales and size of fluctuations. Phys. Rev. E 95, 052313. doi:10.1103/physreve.95.052313
Li, Z. Z., Su, C. W., Chang, T., and Lobonţ, O. R. (2020). Policy-driven or market-driven? evidence from steam coal price bubbles in China. Resour. Policy 78, 102878. doi:10.1016/j.resourpol.2022.102878
Lili, Z., Wen, F., and Xiong, W. (2020). Interaction among China carbon emission trading markets: nonlinear granger causality and time-varying effect. Energy Econ. 91, 104901. doi:10.1016/j.eneco.2020.104901
Lin, B., and Jia, Z. (2019). What are the main factors affecting carbon price in emission trading scheme? A case study in China. Sci. Total Environ. 654, 525–534. doi:10.1016/j.scitotenv.2018.11.106
Liu, X., and Jin, Z. (2020). An analysis of the interactions between electricity, fossil fuel and carbon market prices in Guangdong, China. Energy Sustain. Dev. 55, 82–94. doi:10.1016/j.esd.2020.01.008
Liu, X., Zhou, X., Zhu, B., and Wang, P. (2020). Measuring the efficiency of china’s carbon market: a comparison between efficient and fractal market hypotheses. J. Clean. Prod. 271 (10), 122885. doi:10.1016/j.jclepro.2020.122885
Lyu, C., and Scholtens, B. (2024). Integration of the international carbon market: a time-varying analysis. Renew. Sustain. Energy Rev. 191, 114102. doi:10.1016/j.rser.2023.114102
Ma, Y., and Lianyong, F. (2022). Analysis of the market effectiveness of pilot carbon emission trading markets in China. Operations Res. Manag. Sci. 31 (8), 195–202. doi:10.12005/orms.2022.0271
Montagnoli, A., and Vries, F. P. D. (2010). Carbon trading thickness and market efficiency. Energy Econ. 32 (6), 1331–1336. doi:10.1016/j.eneco.2010.04.001
Nie, D., Li, Y., and Li, X. (2021). Dynamic spillovers and asymmetric spillover effect between the carbon emission trading market, fossil energy market, and new energy stock market in China. Energies 14, 6438. doi:10.3390/en14196438
Qiao, S., Zhao, C. X., Zhang, K. Q., and Ren, Z. Y. (2021). Research on time-varying two-way spillover effects between carbon and energy markets empirical evidence from China. Front. Energy Res. 9, 789871. doi:10.3389/fenrg.2021.789871
Song, Y., Liu, T., Liang, D., Li, Y., and Song, X. (2017). A fuzzy stochastic model for carbon price prediction under the effect of demand-related policy in China's carbon market. Ecol. Econ. 157, 253–265. doi:10.1016/j.ecolecon.2018.10.001
Steuer, R., Kurths, J., Daub, C. O., Weise, J., and Selbig, J. (2002). The mutual information: detecting and evaluating dependencies be-tween variables. Bioinformatics 18, 231–240. doi:10.1093/bioinformatics/18.suppl_2.s231
Villaverde, A. F., Ross, J., Moran, F., and Banga, J. R. (2014). MIDER: network inference with mutual information distance and entropy reduction. PloS One 9 (5), e96732. doi:10.1371/journal.pone.0096732
Wang, B., and Duan, M. (2022). Consignment auctions of emissions trading systems: an agent-based approach based on China. S practice. Energy Econ. 112, 106187. doi:10.1016/j.eneco.2022.106187
Wang, J., Dai, P.-F., Chen, X. H., and Nguyen, D. K. (2024). Examining the linkage between economic policy uncertainty, coal price, and carbon pricing in China: evidence from pilot carbon markets. J. Environ. Manag. 352, 120003. doi:10.1016/j.jenvman.2023.120003
Wang, L., Peng, C., Shi, W., and Zhu, M. (2020). Carbon dioxide emissions from port container distribution: spatial characteristics and driving factors. Transp. Res. Part D. Transp. Environ. 82, 102318. doi:10.1016/j.trd.2020.102318
Wang, S., Wang, X., and Tang, Y. (2020). Drivers of carbon emission transfer in China—an analysis of international trade from 2004 to 2011. Sci. Total Environ. 709, 135924. doi:10.1016/j.scitotenv.2019.135924
Wang, X., Liu, C., Chen, S., Chen, L., Li, K., and Liu, N. (2020). Impact of coal sector’s de-capacity policy on coal price. Appl. Energy 265, 114802. doi:10.1016/j.apenergy.2020.114802
Wang, X. D., and Hui, X. F. (2017). Mutual information based analysis for the distribution of financial contagion in stock markets. Discrete Dyn. Nat. Soc. 2017, 1–13. doi:10.1155/2017/3218042
Wang, X. D., and Hui, X. F. (2018). Cross-sectoral information transfer in the Chinese stock market around its crash in 2015. Entropy 20, 663–14. doi:10.3390/e20090663
Wang, Z., Chen, H., Huo, R., Wang, B., and Zhang, B. (2020). Marginal abatement cost under the constraint of carbon emission reduction targets: an empirical analysis for different regions in China. J. Clean. Prod. 249, 119362. doi:10.1016/j.jclepro.2019.119362
Wen, F., Wu, N., and Gong, X. (2020). China’s carbon emissions trading and stock returns. Energy Econ. 86, 104627. doi:10.1016/j.eneco.2019.104627
Wu, J., Guo, Q., Yuan, J., Lin, J., Xiao, L., and Yang, D. (2019). An integrated approach for allocating carbon emission quotas in China’s emissions trading system. Resour. Conservation and Recycl. 143, 291–298. doi:10.1016/j.resconrec.2019.01.001
Wu, X., and Xiaofeng, H. (2020). Risk transmission of the regions in the yangtze river economic belt. Discrete Dyn. Nat. Soc., 8876883. doi:10.1155/2020/8876883
Wu, X., and Xiaofeng, H. (2021a). Dependence relationship and spatial stratified heterogeneity in the eastern coastal economic belt of China. Complexity, 6645451. doi:10.1155/2021/6645451
Wu, X., and Xiaofeng, H. (2021b). The impact of COVID-19 on the dependence of Chinese stock market. Discrete Dyn. Nat. Soc., 5588562. doi:10.1155/2021/5588562
Xu, Y. (2021). Risk spillover from energy market uncertainties to the Chinese carbon market. Pacific-Basin Finance J. 67, 101561. doi:10.1016/j.pacfin.2021.101561
Yang, C., Shen, Y., and Xia, B. (2013). Evolution of shanghai stock market based on maximal spanning trees. Mod. Phys. Lett. B 27 (03), 1350022. doi:10.1142/s021798491350022x
Zhang, M., Gregory, A., and Russell, B. (2018). Carbon emissions and stock returns: evidence from the Chinese pilot emissions trading scheme. Theor. Econ. Lett. 8 (11), 2082–2094. doi:10.4236/tel.2018.811136
Zhang, Y., Li, S., Lou, T., and Gao, J. (2020). The effect of emission trading policy on carbon emission reduction: evidence from an integrated study of pilot regions in China. J. Clean. Prod. 265, 121843. doi:10.1016/j.jclepro.2020.121843
Zhao, X. G., Wu, L., and Li, A. (2017). Research on the efficiency of carbon trading market in China. Renew. Sustain. Energy Rev. 79 (11), 1–8. doi:10.1016/j.rser.2017.05.034
Zheng, Y., Yin, H., Zhou, M., Liu, W. H., and Wen, F. H. (2021). Impacts of oil shocks on the EU carbon emissions allowances under different market conditions. Energy Econ. 104, 105683. doi:10.1016/j.eneco.2021.105683
Zhou, H., Ping, W., Wang, Y., Wang, Y., and Liu, K. (2021). China’s initial allocation of interprovincial carbon emission rights considering historical carbon transfers:program design and efficiency evaluation. Ecol. Indic. 121, 106918–106988. doi:10.1016/j.ecolind.2020.106918
Zhou, K., and Yiwen, L. (2019). Carbon finance and carbon market in China: progress and challenges. J. Clean. Prod. 214, 536–549. doi:10.1016/j.jclepro.2018.12.298
Zhou, X., Niu, A., and Lin, C. (2023). Optimizing carbon emission forecast for modelling China's 2030 provincial carbon emission quota allocation. J. Environ. Manag. 325, 116523. doi:10.1016/j.jenvman.2022.116523
Zhu, B., Yuan, L., and Shunxin, Y. (2019). Examining the multi-timescales of European carbon market with grey relational analysis and empirical mode decomposition. Phys. A 517, 392–399. doi:10.1016/j.physa.2018.11.016
Keywords: carbon emission trading market in China, dependence relationship, dynamic evolution, mutual information, maximum spanning tree (MST)
Citation: Wu X, Hui X and Cao J (2025) Research on the dependence relationship and the dynamic evolution in the carbon emission trading system of China. Front. Environ. Sci. 13:1630188. doi: 10.3389/fenvs.2025.1630188
Received: 17 May 2025; Accepted: 16 July 2025;
Published: 25 July 2025.
Edited by:
Xu Zhao, Shandong University, Weihai, ChinaReviewed by:
Yi Zhang, Northeastern University at Qinhuangdao, ChinaZhidong Liu, Dongbei University of Finance and Economics, China
Copyright © 2025 Wu, Hui and Cao. This is an open-access article distributed under the terms of the Creative Commons Attribution License (CC BY). The use, distribution or reproduction in other forums is permitted, provided the original author(s) and the copyright owner(s) are credited and that the original publication in this journal is cited, in accordance with accepted academic practice. No use, distribution or reproduction is permitted which does not comply with these terms.
*Correspondence: Xianbo Wu, ODkyOTk5OTIwQHFxLmNvbQ==