 Moxian Dai1,2
 Hongchao Dun
- 1Key Laboratory of Mechanics on Disaster and Environment in Western China, Lanzhou University, Lanzhou, China
- 2College of Civil Engineering and Mechanics, Lanzhou University, Lanzhou, China
- 3Economy and Technology Research Institute, Electric Power Corporation, State Grid, Beijing, China
With the rapid global expansion of wind and photovoltaic power generation in desert regions, transmission lines selection has become crucial for effective renewable energy delivery. This study develops a new evaluation framework for transmission lines siting in desert environments through wind-blown sand dynamics analysis. Leveraging global desert distribution data and ECMWF Reanalysis v5 Land(ERA5-Land) wind field data (2001 2020), we quantified 20-year sand drift potential patterns and established a comprehensive scoring system for infrastructure suitability assessment. The study findings reveal that global desert sand movement exhibits distinct spatial distribution patterns. Temporally, all monitored regions demonstrate a continuous intensification of sand drift potential, with South America showing the most rapid growth rate, while Asia and Africa maintain relatively stable patterns. The developed scoring system effectively identifies optimal transmission lines selection through multivariate analysis of aeolian processes. This methodology provides decision-makers with science-based tools for energy infrastructure planning in aeolian-active regions, particularly supporting sustainable development of desert renewable energy projects.
1 Introduction
As a crucial part of transmission projects, transmission lines selection is not only linked to the planning and construction of the entire power grid, but also exerts a far-reaching influence on local economic development and residents’ daily lives (Khan et al., 2019). In recent years, with the rapid development of information technology and satellite maps, through computer technology, the geographic information data of the planned area can be quickly obtained for transmission lines selection. Technologies such as the Global Positioning System and high-definition satellite maps have also provided important support for transmission lines selection.
Transmission lines selection not only needs to take into account geographical conditions such as terrain, landforms and surrounding buildings (Eroğlu and Aydin, 2015), but also the comprehensive impact of construction costs and social environment. It is a three-dimensional and multi-objective decision-making problem involving multiple factors such as geographical environment and engineering investment (Shandiz et al., 2018). The traditional method of transmission lines selection usually involves manual investigation of the geological environment, engineering investment and social environment, and subjectively selects the planning scheme of the transmission lines. This method has disadvantages such as being unable to fully consider the geographical environmental influencing factors of transmission lines selection and having strong subjectivity. In fact, the problem of transmission lines selection planning can be transformed into a path optimization problem, but complex geographic information factors must be taken into account. Currently, transmission lines selection at home and abroad generally adopts the computer-aided method to assist manual path selection.
In recent years, there are different methods and theories on transmission lines selection. This paper summarizes the research methods of transmission lines selection, such as artificial survey method (Wang, 2021), traditional mathematical programming (Sheng et al., 2022), intelligent algorithm (Zhang et al., 2020), simulation (Khaing and Soe, 2016) and so on. The manual measurement steps are tedious, and most of them require workers to obtain geographic information data on the spot, then carry out path correction and constantly verify the feasibility of the line. With the development of modern computer technology and communication technology, geographic information technology (GIS) is widely used in the study of transmission lines selection. In view of the problems in traditional transmission lines selection, such as many constraints and difficult decision-making, this paper uses modern Remote Sensing technology to obtain Remote Sensing image geographic information in the planning area, and adopts GIS data processing platform, quantifying and integrating complex geographic information (Xie et al., 2020; Schito et al., 2018; Cruz-Chavez et al., 2020; Huang et al., 2015; Demircan et al., 2011). It can be seen that in recent years, the research on path optimization based on raster model mainly focuses on the optimization of raster data in space and the combination with intelligent algorithms. Among them, the methods of establishing a raster data information model mainly include analytic hierarchy process (AHP) (Bagli et al., 2011), interval AHP (Wang et al., 2018), neural network-based AHP(Huang et al., 2021), etc. Meanwhile, path optimization algorithms mainly focus on the traditional Dijkstra algorithm (Santos et al., 2019) and particle swarm optimization algorithm (Zhou et al., 2015; Liu, 2020), A * algorithm (Antikainen, 2013), genetic algorithm (Eroğlu and Aydin, 2013; Zhou et al., 2020), bee colony search algorithm (Eldrandaly et al., 2015), improved ant colony algorithm (Wang et al., 2019) and so on.
However, for some special environmental factors, such as arid environments like deserts (Zedan et al., 1983), the quantification of environmental factors in the above-mentioned research lacks credibility. In arid terrains such as deserts, restricted by line planning and geographical conditions, the transmission lines project is relatively close to the surrounding sand dunes in some cases. At this time, this sand dune - transmission lines has a strong coupling effect: On the one hand, the sand bed boundaries of dune landforms affect the surrounding wind fields and wind-sand flow structures. The damage caused by this type of wind-sand flow, which differs from that in flat surface conditions, to transmission line projects passing through such areas has received relatively little attention. It is necessary to explore the applicability of transmission lines in this situation. On the other hand, the existence of the transmission lines projects itself also affects the already complex flow field structure around the sand dunes. In fact, the formation of a specific morphology of the sand dunes is the result of achieving a dynamic balance with the surrounding flow field. Then, whether the flow field will cause deformation of the surrounding sand dunes after the interference of the transmission lines projects is a very worthy issue of attention. It may have a long-term impact on the structural safety of transmission lines projects and even the surrounding ecological environment (Chen et al., 2025; Wang et al., 2025). Therefore, it is necessary to start from the mechanism of wind-sand flow and study the influence of parameters such as wind-sand intensity, sand drift potential and dune flow on power transmission projects.
Based on the research of wind-sand activities in the wind-sand environment, this study obtained the spatial distribution and frequency of wind-sand activities in major desert areas around the world. Taking the sand drift potential (DP), resultant drift potential (RDP) and the wind direction variability (WDV) as evaluation indices, quantified environmental factors, and gave the evaluation score for transmission lines selection based on the above three evaluation indices. DP characterizes the overall intensity of regional wind-sand activity and RDP characterizes the direction and efficiency of net sand transport, indicating the dominant direction of dune migration and primary sand burial risk. WDV characterizes the degree of wind direction variation and wind field stability, where high variability signifies complex dune morphology with high activity levels. This study constructs a quantitative evaluation model to provide wind-sand environmental assessment scores for transmission lines routes, aiming to provide data and theoretical support for the selection of transmission lines in desert areas.
2 Data and methods
2.1 Data source
Its surface mapping relies on global 500 m resolution images captured by the multi-channel Moderate-resolution Imaging Spectroradiometer (MODIS) Terra satellite, including products like MCD12Q1: MODIS Land Cover Type Product (500 m) and MOD13Q1/MYD13Q1: Vegetation Indices (250 m). The images have undergone cloud shielding/atmospheric correction, and the images from August were used to obtain the bare soil not covered by snow. This month’s choice might distort some desert areas in the Southern Hemisphere, but except for South America introduced later, most of these desert areas (especially in Australia and Southern Africa) are largely unaffected by snow. The pixel value range for each band (red, green, blue) is from 0 to 255, with 255 representing the highest reflectivity. Before image classification, mask the areas with pixel values greater than 200 to avoid snow-covered areas, and mask the areas with pixel values less than 20 to avoid dense vegetation and ocean/water bodies.
On this basis, the automatic image classification method is adopted to extract the global distribution of desert areas. In the classification of global land surfaces, unsupervised methods are usually adopted because the required training data is sparse. In the unsupervised method, image processing tools are utilized to create a certain number of clusters based on the differences in reflectivity to classify multi-band images. In contrast, supervised techniques are trained using real ground reflection data of known surface types, and pixels classify them into specific surface categories based on their proximity to the truth of the ground. Parajuli et al. developed a detailed land surface map of the Middle East and North Africa (MENA) region by visually inspecting high-resolution Google Earth Pro images, which includes 12 types of land surfaces and provides high-precision details of dust sources in the region in digital format. Parajuli and Zender created an exhaustive training sample set using the entire polygon set obtained from this map to classify global dust sources using supervised techniques. Subsequently, the RGB image Mosaic was divided into different surface types using the maximum likelihood method in ArcGIS.
In the subsequent processing, this global desert data is re-sampled into grid cells with a resolution of 0.1°to make the resolution the same as that of the ERA5-Land global wind field reanalysis product of the European Centre for Medium-Range Weather Forecasts.
The wind data are from the components of the east wind u10 and north wind v10 at a height of 10 m of the ERA5-Land reanalysis product. The data accuracy is hourly temporal resolution and 0.1°spatial resolution. In this study, the hourly wind data of ERA5-Land covered the period from 2001 to 2020, so the research period was 20 years. The spatial resolution of this data has reached approximately 30 km, and the temporal resolution has reached once per hour. These data describe global climate change more precisely than ever before, providing coherent, complete and high-resolution reanalysis data on the state of the atmosphere and land. Furthermore, the coastline data is obtained by using the Global Self-consistent Hierarchical High-resolution Geography (abbreviated as GSHHG) dataset.
2.2 Data processing
Sand drift potential (abbreviated as DP) is a core indicator characterizing the intensity of regional wind-sand activities and the evolution trend of wind-sand landforms, and its Unit is the Vector Unit (VU). The sand drift potential comprehensively reflects the synergistic effect of wind speed and wind direction. By quantifying the transport capacity of surface sand particles driven by wind, it provides a scientific basis for the prevention and control of wind and sand disasters, desertification control and ecological engineering design. In arid and semi-arid areas, sand drift potential directly affects the shaping and evolution of the surface morphology and is a key parameter for studying the regional wind energy environment (Yizhaq et al., 2020).
According to Lettau’s sand transport equation (Equation 1), (Lettau, 1978),
where
The equation is simplified as follows (Equation 2), (Fryberger and Dean, 1979),
where
In the calculation process of sand drift potential, it is first necessary to obtain the wind speed data of u 10 and v10 at a height of 10 m in the ERA5-Land reanalysis product. These data provide a basis for the subsequent analysis. After obtaining the wind speed data, it is necessary to filter out the wind speed records that are greater than the threshold wind speed. Threshold wind speed is the critical wind speed at which sand particles start to be transported by wind. Only when the wind speed exceeds this threshold will a significant sand transport phenomenon occur. For the screened valid wind speed records, annual statistics are conducted in the two directions of u and v respectively. The wind direction frequency, average wind speed and blowing time (frequency) of sand-rising wind in each direction are calculated respectively. The wind direction frequency reflects the relative occurrence frequency of the sand-raising wind in a specific direction, the average wind speed indicates the intensity characteristics of the sand-raising wind in that direction, and the blowing time shows the persistence of the sand-raising wind’s effect in that direction.
After obtaining
in the formula:
The formula for the resultant sand drift potential is as follows (Equation 4):
where
The formula for the rate of change of wind direction is as follows (Equation 5):
where:
2.3 Evaluation method
According to the existing wind-sand concept framework, the sand drift capacity represented by the average values of DP and RDP is reclassified into low energy (<50 VU), medium energy (
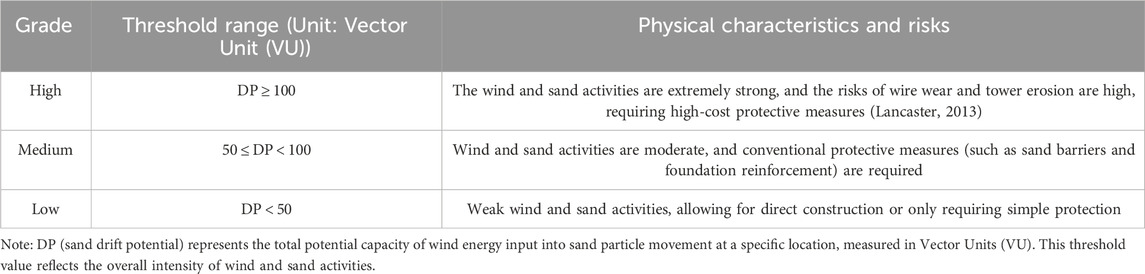
Table 1. Sand Drift Potential (DP) classification.
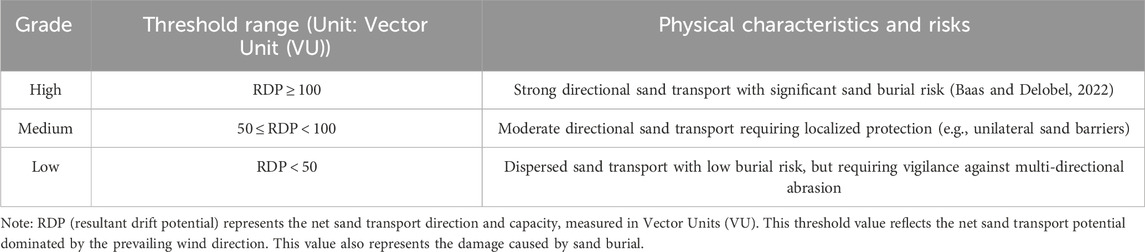
Table 2. Classification of resultant drift potential (RDP).
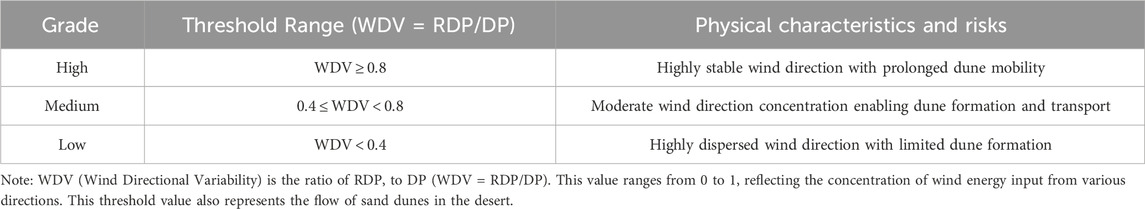
Table 3. Classification of directional variability (WDV).
Therefore, a detailed set of empirical judgments has been established: Firstly, when the total sand drift potential
Based on the above empirical judgment, the applicable rules for the cross-suitability scores of DP, RDP and WDV after reclassification are established: For transmission lines, the DP and RDP of low energy, medium energy and high energy are the first and second layers of the application rules respectively, and the WDV of low ratio, medium ratio and high ratio is the third layer. The Analytic Hierarchy Process is adopted to analyze the weight magnitudes of the influence of the above different levels of factors on the transmission lines. These hierarchical combinations finally determine the score of the suitability evaluation. Based on the analysis of relevant data and expert judgment, different weight magnitudes are assigned to each parameter. DP weight: 40%, wind and sand intensity is the basic risk factor; RDP weight: 35%, directionally affecting the protection cost; WDV weight: 25%, direction stability determines the complexity of protection. The specific scoring situation is shown in Table 4. The comprehensive score = (DP score *0.4) + (RDP score *0.35) + (WDV score *0.25). When the score is 1, the risk is the smallest and it is suitable for the selection and construction of transmission lines. When the score is 3, the risk is the greatest and it is not advisable to select and construct transmission lines.
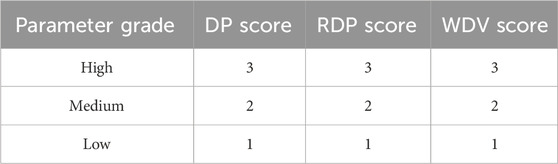
Table 4. Parameter scoring rules.
This study’s evaluation framework for transmission line siting outperforms existing methods with several key advantages. Unlike traditional GIS path optimization techniques that rely on static factors, this research innovatively incorporates dynamic wind-sand parameters to quantify desert environmental risks from their physical nature. It constructs a multi-level risk assessment system based on these parameters, achieving multi-objective decision-making through carefully assigned weights, which overcomes the insufficient quantification of environmental factors in traditional approaches. Additionally, a dynamic threshold classification system is established, enabling objective risk evaluation. The framework also features an objective siting process via a comprehensive scoring mechanism, minimizing the bias of subjective judgment. Overall, this framework offers a scientific decision-making tool for desert renewable energy transmission projects.
3 Results and discussion
3.1 The spatial distribution of wind and sand activities in desert areas
The global desert distribution of the grid cells obtained in this paper with a resolution of 0.1°is shown in Figure 1. Deserts globally cluster in two dominant zones: (1) the subtropical arid belt (30°N), spanning continuously from North Africa (e.g., Sahara) through West Asia to Central/East Asia (e.g., Taklimakan Desert), and (2) continental interiors, including western Australia (Great Victoria), southwestern North America (Sonoran), and western South America (Atacama/Patagonia). The Asia-Africa desert corridor emerges as the largest and most aeolian-active region, while China’s northwestern deserts (Kubuqi, Tengger) – driven by ”Dual Carbon” strategy demands–prioritize urgent transmission infrastructure (e.g., Ordos/Tengger energy bases); conversely, deserts in Africa (beyond North Africa), South America, and Australia remain lower-priority zones due to economic or demographic constraints.
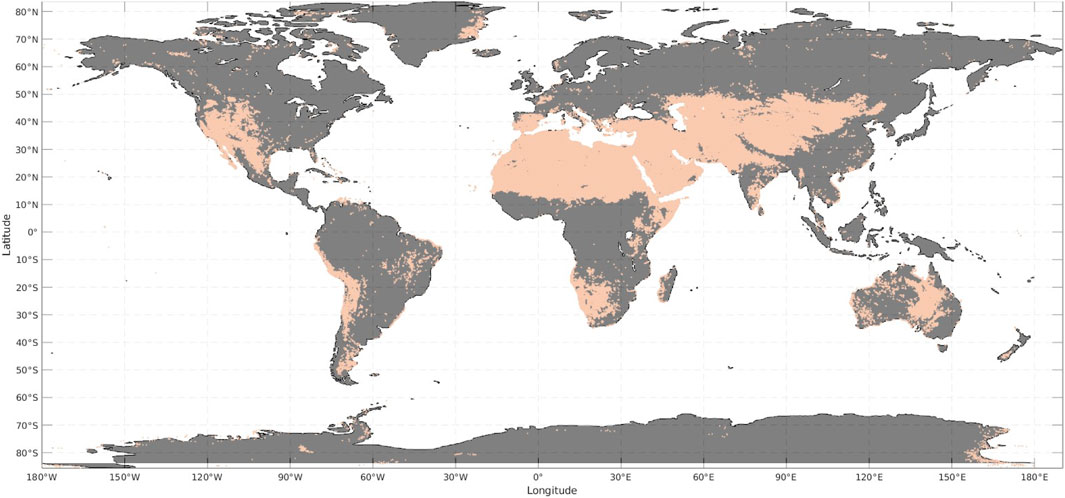
Figure 1. Global Spatial Distribution of Deserts. (The spatial resolution of figure is 0.1 based on data from 2020).
Global deserts exhibit distinct clustering in sand drift potential (DP), resultant drift potential (RDP), and wind direction variability (WDV) during 2001–2020 (Figure 2). Mean values of DP (103.7 VU) and RDP (97.4 VU) show parallel spatial distributions, with high-energy zones (DP > 150 VU) concentrated primarily across North Africa (Northern Somalia, Central Chad, Western Sahara) and Asia (Northern/Western China, Southern Mongolia, Southwest Pakistan). These zones correlate strongly with major dust sources, confirming DP’s efficacy in characterizing regional wind energy intensity and aeolian erosion risks. Notably, RDP high-value clusters (>150 VU) cover a smaller spatial extent than DP due to vector summation effects, yet remain anchored in similar regions–particularly highlighting directional sand transport threats in North Africa and East Asia.
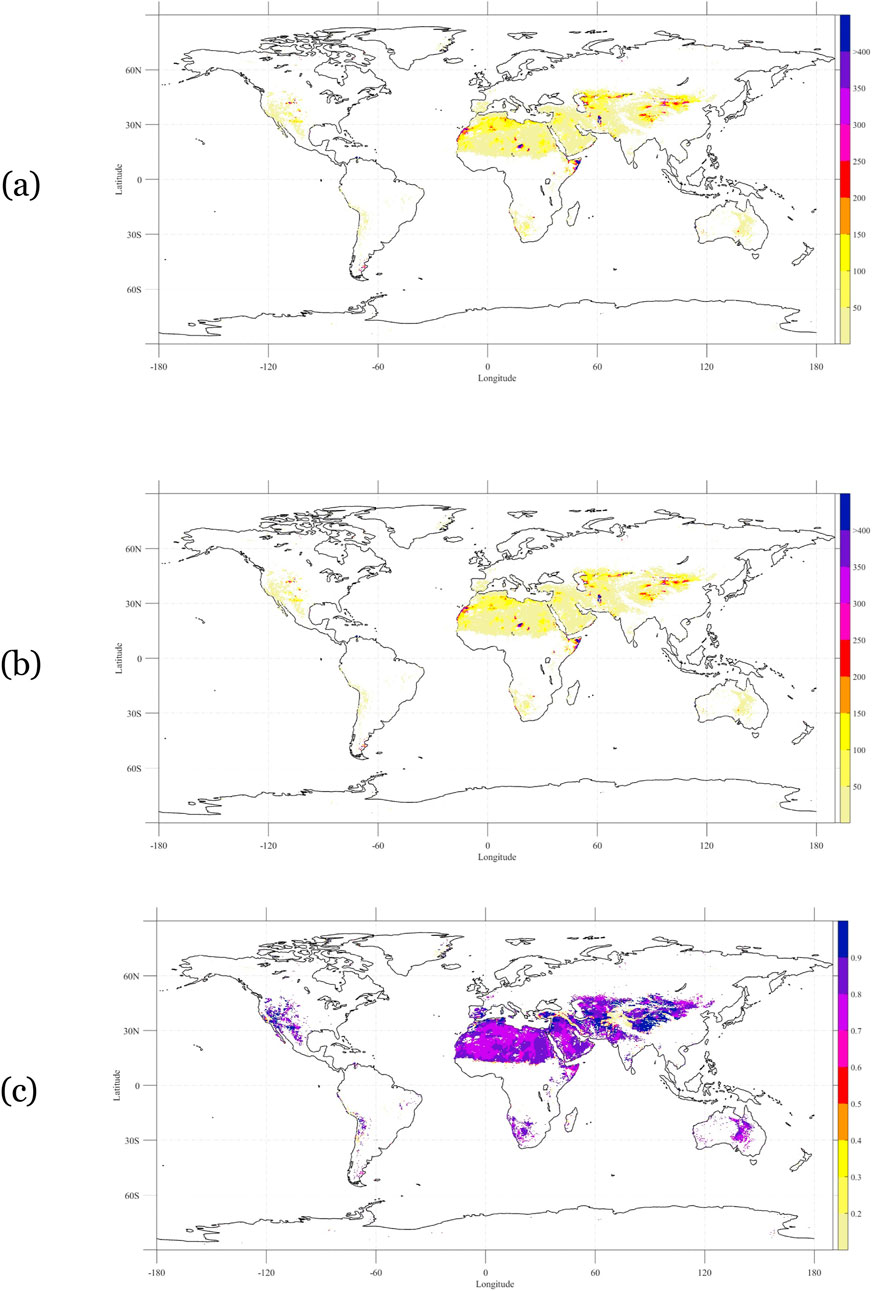
Figure 2. Spatial distribution of the mean (a) DP(VU), (b) RDP(VU), and (c) WDV from 2001 to 2020 (0.1°spatial resolution).
WDV averages 0.77 globally, with values >0.7 dominating 78% of deserts (Figure 2c). This indicates sustained dune mobility across most arid landscapes. Lower WDV zones (<0.7), where complex dune forms prevail, cluster marginally in desert peripheries–notably Southeast Sudan, Northeast Saudi Arabia, and Central Australia. Such areas face compounded challenges: multidirectional abrasion risks to transmission lines and dynamic dune-field evolution.
Compared with the results of the mean, the spatial distribution of the standard deviations of DP, RDP and WDV in global deserts does not show a very obvious agglomeration effect (Figure 3). Among them, the standard deviations of DP and RDP adopt the same defined interval size (20 VU) and symbol color, but the final threshold >160 VU (exceeding 20 VU) includes all the parts >160 VU. The standard deviation of WDV adopts the defined interval size of 0.1, and the final threshold is greater than 0.32, including all parts greater than 0.32. The standard deviation of DP in most areas is less than 40 VU. The aggregation of DP > 40 VU mainly occurs in Africa (such as northern Somalia, central and northwestern Chad, and northern Western Sahara) and Asia (such as northern and western China, southern Mongolia, and southwestern Pakistan). Most of these areas are close to high mountains or the sea. The airflow is strongly influenced by terrain, extreme weather, etc., resulting in more complex wind conditions in local areas and increasing the standard deviation of DP. The distribution of the standard deviation of RDP is very close to that of DP, which also indicates that terrain and local special climate are the main factors affecting wind speed and direction. The spatial distribution of the standard deviation of WDV is relatively more average, mostly in a state of <0.12, and no particularly obvious aggregation area appears. This might be because most of the aggregation areas of the standard deviations of DP and RDP overlap and cancel each other out. A small number of areas with relatively high values are mostly distributed at the edge positions of deserts in various continents. These areas are located in the initial regions where deserts were formed, and the wind conditions and geographical conditions are more complex. Even human disturbances exist, resulting in a relatively high standard deviation of WDV.
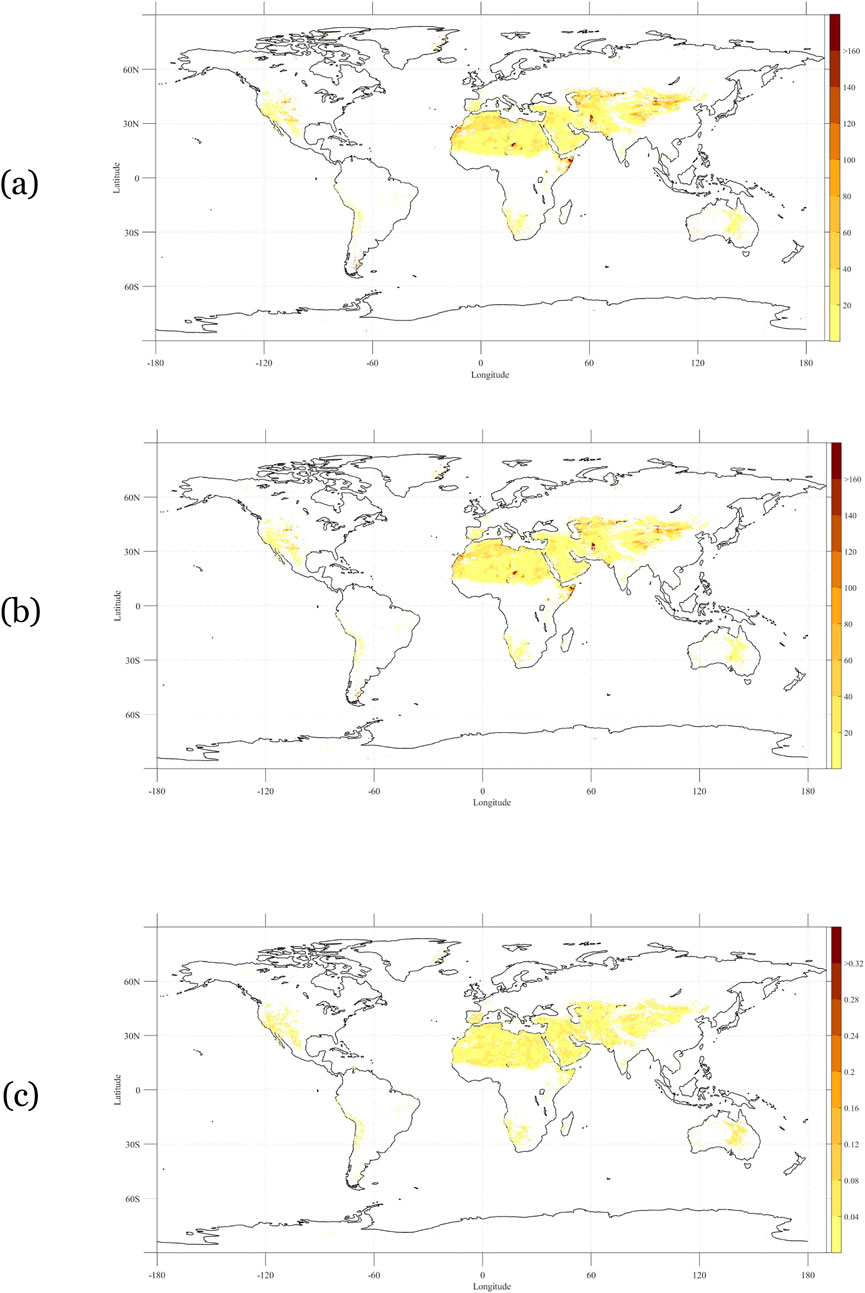
Figure 3. Spatial distribution of the standard deviations of (a) DP(VU), (b) RDP(VU), and (c) WDV from 2001 to 2020 (0.1 spatial resolution).
3.2 The changing trend of sand and dust activities in desert areas
Global deserts exhibit significant increases in sand drift potential (DP) and resultant drift potential (RDP) from 2001 to 2020 (Figure 4), with trends ranging from −4.5 to 10.8 VU/yr. Most regions show moderate growth (0–2 VU/yr), particularly across North Africa and the Arabian Peninsula. This intensification correlates with global warming, suggesting heightened risks of dust emissions and dune mobility that threaten transmission infrastructure. Notably, China’s northern regions demonstrate DP/RDP reductions exceeding 4 VU/yr, indicating favorable conditions for transmission line maintenance.
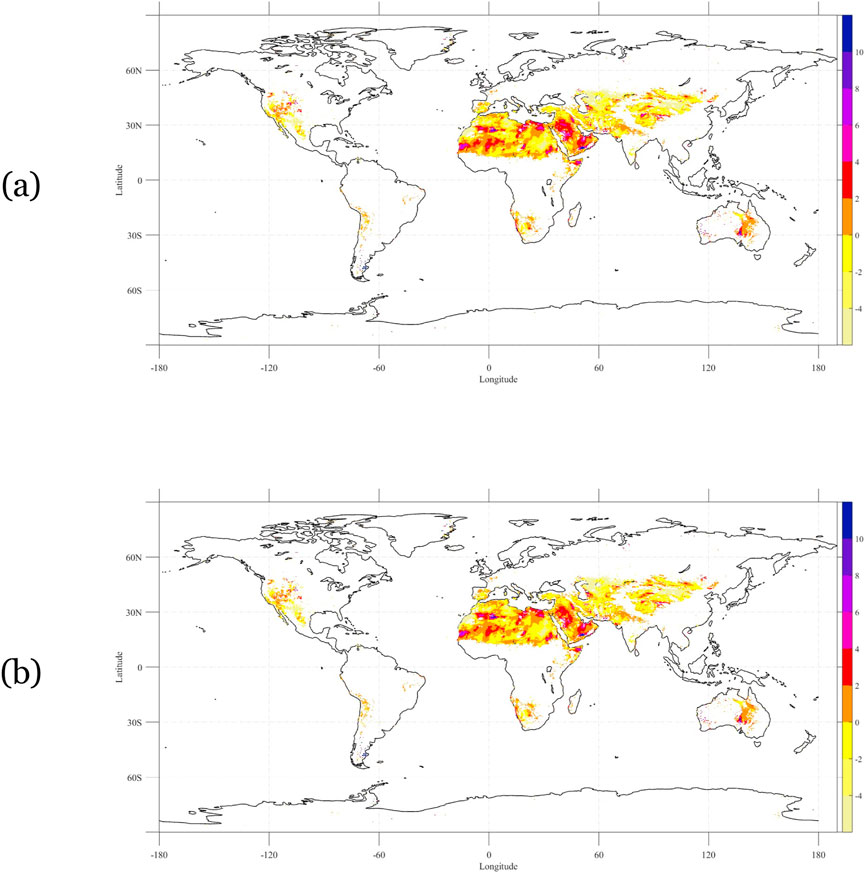
Figure 4. Spatial distribution of the Changes Trends of (a) DP(VU/yr) and (b) RDP(VU/yr) from 2001 to 2020 (0.1 spatial resolution).
Spatial patterns reveal accelerated growth (>2 VU/yr) in aeolian hotspots like central Chad and northern Somalia, where climate sensitivity amplifies global warming impacts. DP and RDP trends show strong covariance, as directional wind variability partially offsets kinetic energy gains in dominant transport pathways, potentially moderating desert expansion rates.
The spatial distribution of the standard deviations of the corresponding DP and RDP change trends is shown in Figure 5. The standard deviation of the DP change trend and the standard deviation of the RDP change trend adopt the same defined interval size (0.7 VU/yr) and symbol color. The final threshold of the standard deviation of the changing trends of DP and RDP > 5.6 VU/yr includes all the parts > 5.6 VU/yr. The standard deviation of the DP variation trend in most areas is less than 0.7 VU/yr, while the clustered areas with a value greater than 0.7 VU/yr mainly occur in the marginal areas of major desert regions. These areas are located in the initial regions of desert formation, with more complex wind conditions and geographical conditions, and even human disturbances exist. The complex geographical and meteorological environment leads to complex wind conditions in local areas, increasing the standard deviation of the DP variation trend. The distribution of the standard deviation of the RDP variation trend is basically consistent with that of DP. It can be seen that the terrain and local special climate not only affect the wind speed, but also simultaneously act on the change of wind direction.
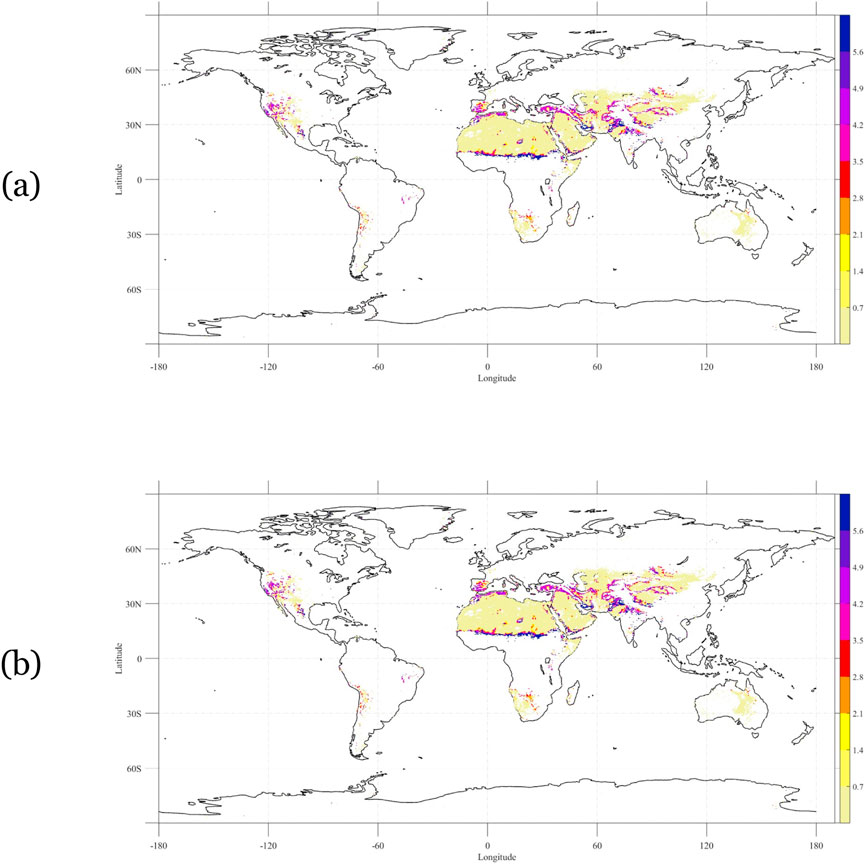
Figure 5. The spatial distribution of the standard deviations of the changes trends of (a) DP(VU/yr) and (b) RDP(VU/yr) from 2001 to 2020 (0.1 spatial resolution).
The increasing trend of DP and RDP in global deserts indicates that the possibility of dust pollution and dust coverage is on the rise. Figure 6 shows the interannual variation of DP in Africa, Asia, Australia, North America, Europe and South America from 2001 to 2020. Figure 7 shows the interannual variation of RDP in Africa, Asia, Australia, North America, Europe and South America from 2001 to 2020.
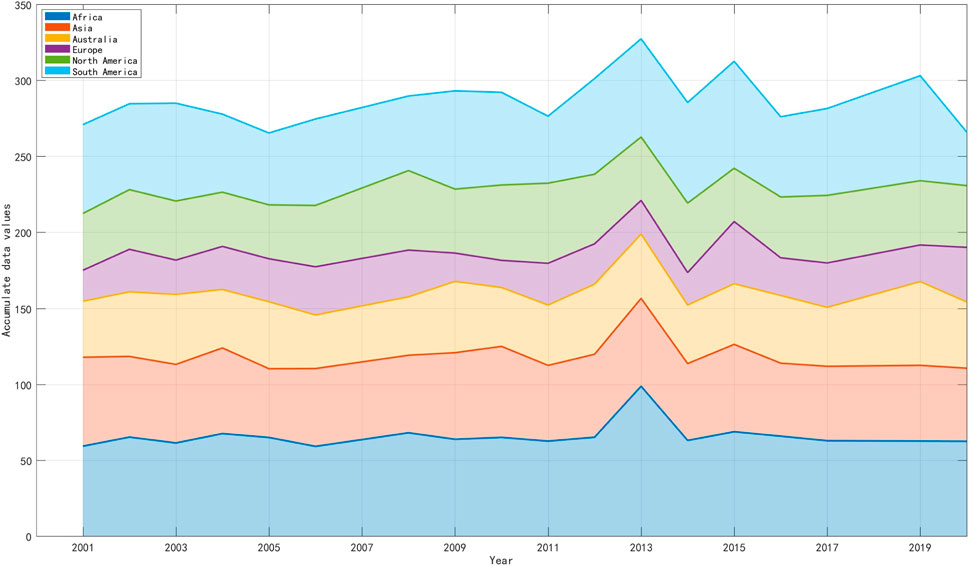
Figure 6. Interannual variations of DP in Africa, Asia, Australia, Europe, North America and South America from 2001 to 2020(Figure corresponds to the order from bottom to top. Accumulate data value is the sum of the average DP of the continents, measured in Vector Units (VU)).
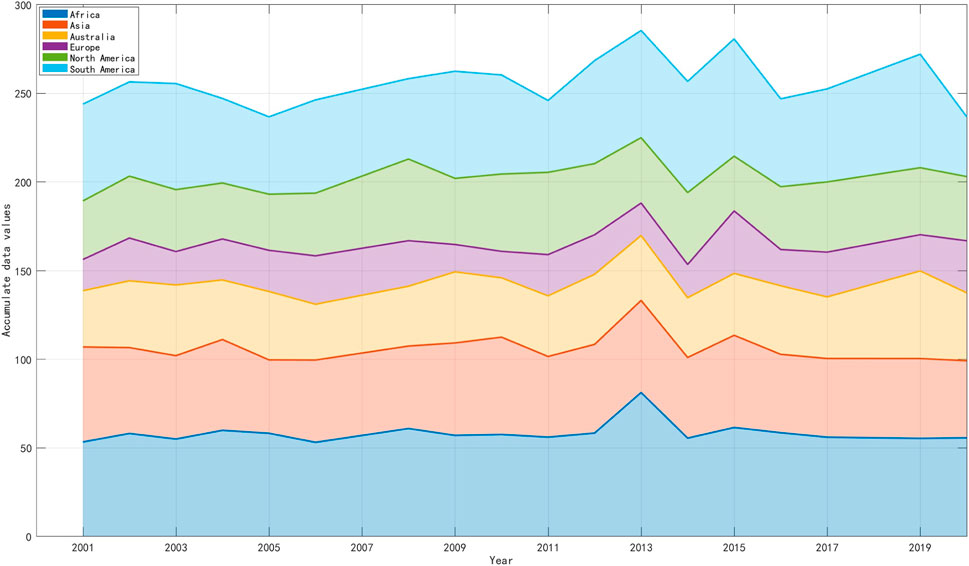
Figure 7. Interannual variations of RDP in Africa, Asia, Australia, Europe, North America and South America from 2001 to 2020(Figure corresponds to the order from bottom to top. Accumulate data value is the sum of the average DP of the continents, measured in Vector Units (VU)).
The continental scale analysis shows that there are obvious regional differences in each continent. Although South America exhibits the most rapid growth in Dust Potential and Regional Dust Potential, its environmental relevance remains limited due to constrained desert areas. Africa demonstrates low DP/RDP growth despite extensive desert coverage, suggesting potential conflicts between future energy development demands and aeolian risks. Asia shows a moderate decline in DP, creating favorable conditions for ongoing transmission projects in arid western China. Conversely, Australia, North America, and Europe maintain steady increases (0.2–0.25 VU/yr), which will progressively elevate infrastructure maintenance costs.
3.3 Suitability assessment of the route selection for transmission lines in desert areas
In this study, DP, RDP and WDV were respectively used as indicators characterizing wind-sand intensity, quicksand burial and dune formation. Finally, the changes of the above three indicators are intersected and the suitability score is conducted according to the application rules.
The scoring system construction begins with reclassifying DP, RDP, and WDV. DP is categorized into low
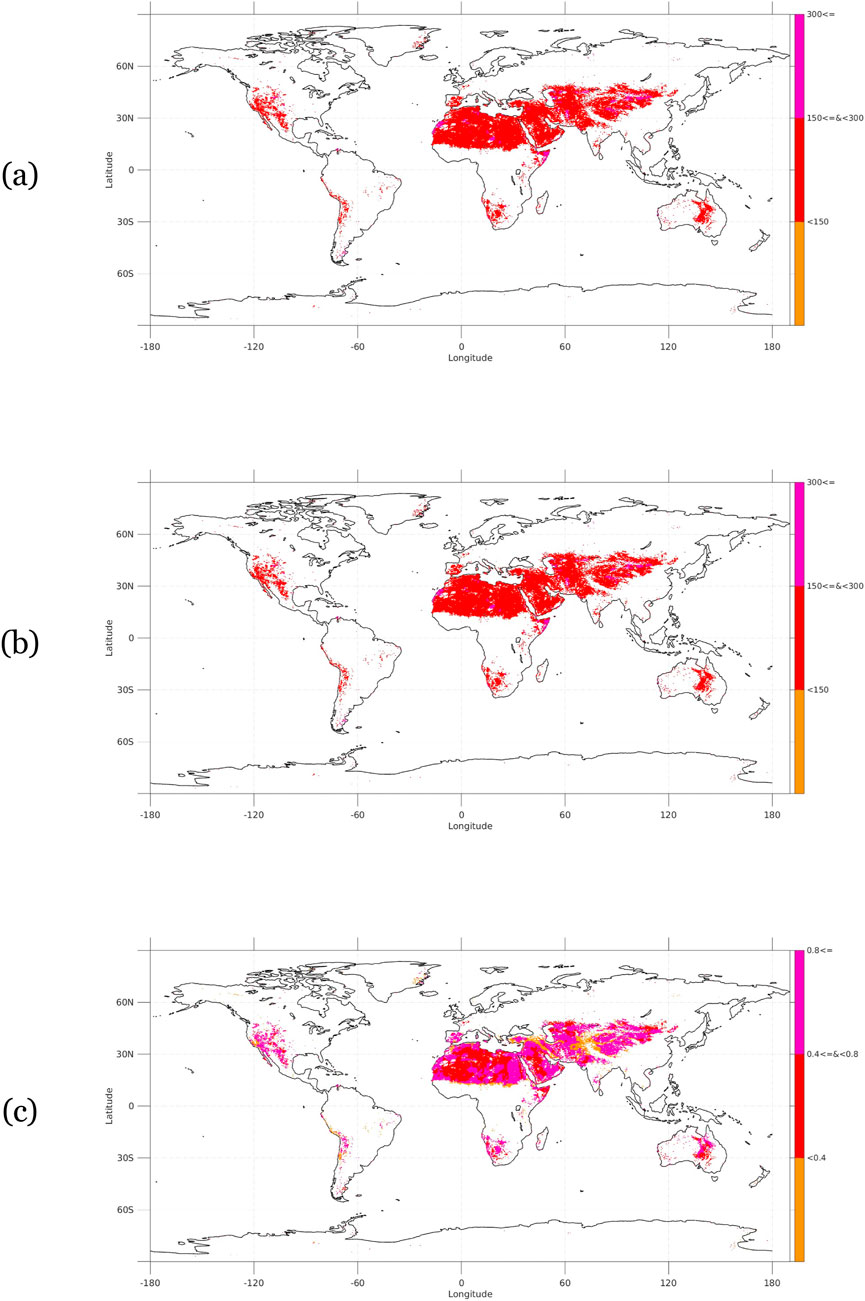
Figure 8. The sand drift capacity represented by the average values of DP and RDP is reclassified into low energy
RDP classifications (low/medium/high ratio) show continental variations (Figure 8b): Africa and Asia account for 66.2%/32.8% (low), 44.1%/33.5% (medium), and 57.5%/41.6% (high) of global deserts. Excluding Antarctica, continental rankings follow medium
WDV is classified as low
All the DP mean values, RDP mean values and WDV mean values are reclassified and crossed, and the score of transmission lines selection is obtained according to the application rules. The specific rules of application are shown in table 5. The upward trends of DP (from low energy, medium energy to high energy), RDP (from low energy, medium energy to high energy) and WDV (from low energy, medium energy to high energy) are all unfavorable for the selection and construction of transmission lines. Figure 9 shows the distribution of suitability scores for transmission lines in global desert areas.
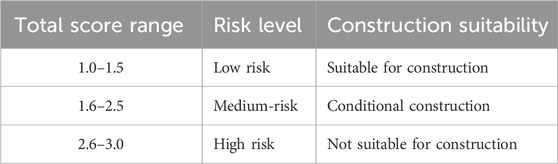
Table 5. Criteria for suitability determination.
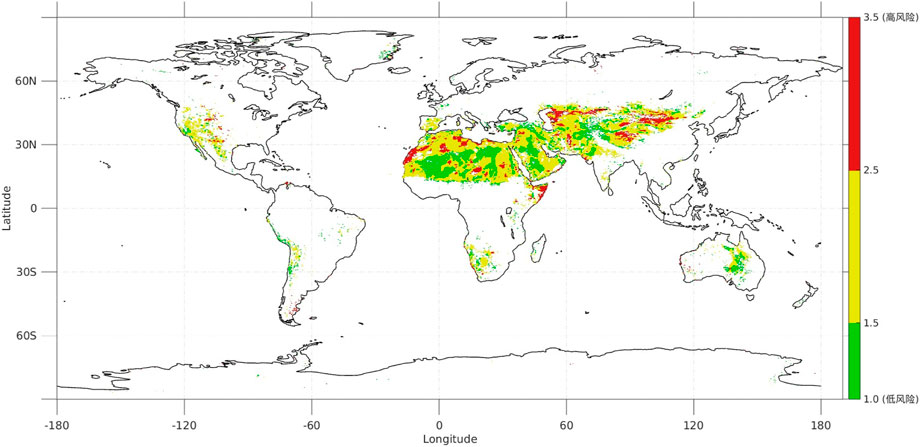
Figure 9. Distribution of Suitability Scores for transmission lines in Global Desert Areas (0.1 spatial resolution) (Green indicates a score of 1.0–1.5, which is suitable for the selection of transmission lines. Yellow represents 1.6–2.5, which is a conditionally suitable line selection. Red indicates that a score of 2.6–3.0 is not suitable for line selection).
Figure 9 presents the frequency distribution of transmission lines suitability scores in the deserts of Africa, Asia, Australia, North America, Europe and South America. North America: The western region shows a mixed distribution of green (low risk), yellow and red (medium to high risk). South America: Predominantly green, indicating a mainly low-risk situation. Europe: Presents a combination of green and yellow areas. Africa: The northern region, especially near the Mediterranean Sea, shows extensive yellow and red, indicating high-risk areas. Asia: The central and western regions (such as Central Asia and West Asia) show yellow and red, while Southeast Asia has more green. Australia: The eastern region is concentrated in green, reflecting a low-risk environment. High-risk areas (red and yellow) are concentrated around 30°N latitude, including North Africa, the Middle East and Central Asia. These areas may face challenges such as extreme temperatures, sandstorms or droughts, threatening power transmission lines. Low-risk areas (green), such as parts of the Americas and eastern Australia, may benefit from more stable natural conditions and face less environmental pressure on transmission lines infrastructure. The results reveal significant regional differences in the risks of transmission lines, which are closely related to local climate and geographical factors. This should provide a basis for the selection and construction of transmission lines.
4 Conclusion
This study adopts a wind-sand physics perspective, utilizing three fundamental aeolian parameters derived from its principles: (1) Total Drift Potential (DP) to quantify wind-sand intensity, (2) Resultant Drift Potential (RDP) to assess shifting sand burial potential, and (3) Wind Direction Variability (WDV) to characterize dune formation dynamics. Combined with the global desert distribution data and wind field reanalysis data, the mean value of DP, The scoring criteria were constructed by redividing the mean values of RDP and WDV, and a scoring system was proposed to determine the best site selection in the construction projects of global desert transmission lines. Due to the unknown fitness and limitations of empirical parameters of global deserts, our scoring system uses 20-year averages and changing trends to quantify the threat level of wind-sand disasters in deserts. The results show that the suitability scores for transmission lines selection in the global desert environment are mostly between 1.0 and 2.5, which are suitable for transmission lines selection and conditional selection. Meanwhile, the suitability scores for transmission lines selection vary significantly regionally and are related to the local climate and geographical conditions.
Data availability statement
The original contributions presented in the study are included in the article/supplementary material, further inquiries can be directed to the corresponding author.
Author contributions
MD: Investigation, Writing – original draft, Data curation, Conceptualization, Methodology. YW: Methodology, Formal Analysis, Writing – original draft, Visualization, Conceptualization, Funding acquisition. SZ: Visualization, Software, Funding acquisition, Investigation, Writing – review and editing, Validation, Data curation, Formal Analysis. HD: Visualization, Resources, Conceptualization, Writing – review and editing, Data curation, Validation, Methodology.
Funding
The author(s) declare that financial support was received for the research and/or publication of this article. Authors wishing to acknowledge financial support from State Grid Corporation of China Headquarters Technology Project Funding (108-202218280A-2-225-XG). The funder was not involved in the study design, collection, analysis, interpretation of data, the writing of this article, or the decision to submit it for publication.
Acknowledgments
Thanks to Copernicus Climate Change Service for the ERA5-Land hourly averaged data from 1950 to present.
Conflict of interest
Authors YW and SZ were employed by Electric Power Corporation, State Grid.
The remaining authors declare that the research was conducted in the absence of any commercial or financial relationships that could be construed as a potential conflict of interest.
Generative AI statement
The author(s) declare that no Generative AI was used in the creation of this manuscript.
Publisher’s note
All claims expressed in this article are solely those of the authors and do not necessarily represent those of their affiliated organizations, or those of the publisher, the editors and the reviewers. Any product that may be evaluated in this article, or claim that may be made by its manufacturer, is not guaranteed or endorsed by the publisher.
References
Antikainen, H. (2013). Using the hierarchical pathfinding A* algorithm in GIS to find paths through rasters with nonuniform traversal cost. ISPRS Int. J. Geo Inf. 2, 996–1014. doi:10.3390/ijgi2040996
Baas, A. C., and Delobel, L. A. (2022). Desert dunes transformed by end-of-century changes in wind climate. Nat. Clim. Change 12, 999–1006. doi:10.1038/s41558-022-01507-1
Bagli, S., Geneletti, D., Geneletti, D., and Orsi, F. (2011). Routeing of power lines through least-cost path analysis and multicriteria evaluation to minimise environmental impacts. Environ. Impact Assess. Rev. 31, 234–239. doi:10.1016/j.eiar.2010.10.003
Chen, D., Zhang, Y., Cheng, J., Zhang, R., and Jiang, Z. (2025). Characteristics and prevention measures of wind-sand disaster along the transmission corridor in desert areas. Land Degrad. and Dev. 36, 3558–3574. doi:10.1002/ldr.5585
Cruz-Chavez, M. A., Moreno-Bernal, P., Rivera-Lopez, R., Avila-Melgar, E. Y., Martinez-Bahena, B., and Cruz-Rosales, M. H. (2020). GIS spatial optimization for corridor alignment using simulated annealing. Appl. SCIENCES-BASEL 10, 6190. doi:10.3390/app10186190
Demircan, S., Aydin, M., and Durduran, S. S. (2011). Finding optimum route of electrical energy transmission line using multi-criteria with q-learning. Expert Syst. Appl. 38, 3477–3482. doi:10.1016/j.eswa.2010.08.135
Eldrandaly, K. A., Hassan, M. M., and AbdelAziz, N. M. (2015). A modified artificial bee colony algorithm for solving least-cost path problem in raster GIS. Appl. Math. and Inf. Sci. 9, 147–154. doi:10.12785/amis/090119
Eroğlu, H., and Aydin, M. (2015). Optimization of electrical power transmission linesrouting using ahp, fuzzy ahp, and GIS. Turkish J. Electr. Eng. Comput. Sci. 23, 1418–1430. doi:10.3906/elk-1211-59
Eroğlu, H., and Aydin, M. (2013). “Genetic algorithm in electrical transmission lines path finding problems,” in 2013 8th International Conference on Electrical and Electronics Engineering (ELECO), 112–116. doi:10.1109/eleco.2013.6713814
Fryberger, S. G., and Dean, G. (1979). Dune forms and wind regime. A study Glob. sand seas 1052, 137–169.
Huang, D., Xu, M., Hu, A., Sun, J., Sun, Y., Song, W., et al. (2021). Selection of transmission line route considering geological disaster risk. Smart Power 49, 73–78. doi:10.3969/j.issn.1673-7598.2021.07.012
Huang, P., Jin, H., Ma, X., Fang, Z., and Liu, R. (2015). Application of 3d GIS technology in the path selection of transmission line. Electr. Technol. 16, 125–128. doi:10.3969/j.issn.1673-3800.2015.03.031
Khaing, Y. H., and Soe, O. (2016). Fuzzy inference system approach to restoration path optimization in power transmission lines. Am. Sci. Res. J. Eng. Technol. Sci. 26, 109–123.
Khan, I. A., Naik, K., Ahmed, M., and Al-Tekreeti, M. (2019). “Ranking of routes for electrical transmission lines using GIS and image processing techniques,” in 2019 IEEE electrical power and energy conference (EPEC) (IEEE), 1–8.
Lettau, K. (1978). Experimental and micrometeorological field studies of dune migration. Explor. World’s driest Clim., 110–147.
Liu, W. (2020). “The planning model of transmission line using bidirectional particle swarm optimization based on time series,” in 2020 international conference on computer, information and telecommunication systems (CITS), 1–5. doi:10.1109/CITS49457.2020.9232469
Santos, A. H. M., de Lima, R. M., Pereira, C. R. S., Osis, R., Medeiros, G. O. S., de Queiroz, A. R., et al. (2019). Optimizing routing and tower spotting of electricity transmission lines: an integration of geographical data and engineering aspects into decision-making. Electr. Power Syst. Res. 176, 105953. doi:10.1016/j.epsr.2019.105953
Schito, J., Hayek, U. W., and Raubal, M. (2018). Enhanced multi criteria decision analysis for planning power transmission lines. Geogr. Inf. Sci. 15 (16), 1–15. doi:10.4230/LIPIcs.GIScience.2018.15
Shandiz, S. G., Doluweera, G., Rosehart, W., Behjat, L., and Bergerson, J. (2018). Investigation of different methods to generate power transmission line routes. Electr. Power Syst. Res. 165, 110–119. doi:10.1016/j.epsr.2018.08.012
Sheng, J., Liu, J., Xie, F., Jiang, K., Chang, J., and Zhu, W. (2022). Intelligent transmission line selection method based on bidirectional dynamic programming. Control Eng. China 29, 515–521. doi:10.14107/j.cnki.kzgc.20210269
Wang, F. (2021). Analysis and application of digital line selection technology for transmission lines. Inn. Mong. Electr. Power, 92–94. doi:10.19929/j.cnki.nmgdljs.2021.0065
Wang, Q., Shi, L., Huang, H., Yang, Y., Liu, P., and Liu, J. (2018). Research on power transmission line path planning based on improved particle swarm optimization algorithm. Guangdong Electr. Power 31, 135–141. doi:10.3969/j.issn.1007-290X.2018.009.017
Wang, S., Bai, W., Tian, Y., Zhang, H., and Fu, Y. (2025). “Numerical simulation of barchan dune movement and burial around transmission tower,” in International conference on civil engineering (Springer), 241–253.
Wang, Y., Lu, X., and Zuo, Z. (2019). “Autonomous vehicles path planning with enhanced ant colony optimization,” in 2019 chinese control conference (CCC), 6633–6638. doi:10.23919/ChiCC.2019.8866128
Xie, J., Su, D., Lu, S., Jia, Y., Sun, M., and Guo, J. (2020). Key technology of transmission line path planning based on improved ant. Electr. Meas. Instrum. 57, 122–128. doi:10.19753/j.issn1001-1390.2020.04.019
Yizhaq, H., Xu, Z., and Ashkenazy, Y. (2020). The effect of wind speed averaging time on the calculation of sand drift potential: new scaling laws. Earth Planet. Sci. Lett. 544, 116373. doi:10.1016/j.epsl.2020.116373
Zedan, F. M., Akbar, M., Farag, A. S., Cheng, T. C., and Wu, C. Y. (1983). Review performance of hv transmission line insulators in desert conditions part I: review of research and methods adopted internationally. IEEE Trans. Electr. Insulation EI- 18, 97–109. doi:10.1109/TEI.1983.298653
Zhang, Q., Huang, H., and Chen, Y. (2020). Research on transmission line path based on optimal algorithms. Northeast Electr. Power Technol. 41, 38–41. doi:10.3969/j.issn.1004-7913.2020.01.012
Zhou, C., Zheng, J., Han, W., Miao, H., Shi, T., and Zhang, S. (2020). Research on path optimization and extension of transmission channel considering geographical environment factors. Electr. Meas. Instrum. 57, 13–18. doi:10.19753/j.issn1001-1390.2020.14.003
Keywords: transmission lines selection, sand drift potential, ERA5-land data, global desert, scoring system
Citation: Dai M, Wang Y, Zhu S and Dun H (2025) Site selection evaluation of transmission lines in desert areas based on wind-sand physics. Front. Environ. Sci. 13:1635961. doi: 10.3389/fenvs.2025.1635961
Received: 28 May 2025; Accepted: 29 June 2025;
Published: 31 July 2025.
Edited by:
Tao Wang, Chinese Academy of Sciences (CAS), ChinaReviewed by:
Di Hu, Xinjiang Agricultural University, ChinaPanli He, PLA Rocket Force University of Engineering, China
Copyright © 2025 Dai, Wang, Zhu and Dun. This is an open-access article distributed under the terms of the Creative Commons Attribution License (CC BY). The use, distribution or reproduction in other forums is permitted, provided the original author(s) and the copyright owner(s) are credited and that the original publication in this journal is cited, in accordance with accepted academic practice. No use, distribution or reproduction is permitted which does not comply with these terms.
*Correspondence: Hongchao Dun, ZHVuaGNAbHp1LmVkdS5jbg==