 Noah Z. Krasner1,2*
 Yudi Li1,2
 Dahlia C. Friis1,2
 Joaquin Benitez1,2Edward Stebbins1,2Pablo Pinilla1,2Pablo Maciel1,2
 Aemilia Thompson1,2Michael Wong1,2Daphne Condon1,2Rebecca A. Lybrand2
 Rebecca R. Hernandez1,2
- 1Wild Energy Center, Energy and Efficiency Institute, University of California, Davis, Davis, CA, United States
- 2Department of Land, Air, and Water Resources, University of California, Davis, Davis, CA, United States
Large, ground-mounted photovoltaic solar energy (GPV) development is expanding rapidly, but its impact on soils and ecosystem services is unresolved. The co-location of ecological restoration with photovoltaic (PV) solar energy generation, known as an ecovoltaic solar park, is proposed as a nature-based climate solution to restore these ecosystem services and improve soil conditions (e.g., erosion mitigation). In this study, a GPV in the Central Valley of California, United States was partially restored with a multifunctional native grassland seed mix. We sought to characterize 13 unique soil surface properties across microsites, elucidate early effects of native grassland restoration on these properties, and compare these results with an adjacent agricultural land-use type (i.e., vineyard). Among these were important physico-mechanical properties rarely studied at GPVs, including penetration resistance, surface failure shear strength, and saturated hydraulic conductivity. Areas under PV panels showed improved penetration resistance and soil moisture relative to sun-exposed areas. Newly restored areas had moister soils, too, but little to no improvement to soil physico-mechanical properties important for vegetation establishment. However, they exhibited slightly greater, but non-significant carbon stocks (to 5 cm) than unrestored areas, and accelerated soil carbon, organic carbon, and nitrogen accrual in zones of concentrated runoff. This study demonstrates initial evidence of soil-based ecosystem services supported from restoration activities at an ecovoltaic solar park, specifically in carbon sequestration, remediation for vegetation establishment, and synergistic relationships with unique microsite conditions from fixed-tilt GPV infrastructure. Additional studies at more GPVs, over longer periods of time, with greater standardization, and those that distinguish between distinct soil C fractions are necessary to fully elucidate complex interactions between soils and GPVs, especially in ecovoltaic contexts.
1 Introduction
In the pursuit of total decarbonization of global energy systems, large solar energy projects (i.e., utility-scale; greater than 1 MW [MW] (Gallaher et al., 2024)) are projected to expand at an unprecedented rate. New large, ground-mounted photovoltaic solar energy facilities (GPVs) are projected to triple over the next 5 years (International Energy Agency, 2021), in alignment with United Nations Sustainable Development Goal 7 (SDG; Affordable and Clean Energy) (United Nations, 2015). By 2050, solar (including distributed sources) is expected to be the primary source of global electricity, with a total capacity between 14 and 80 terawatts (TW) (Haegel et al., 2023).
Given that the majority of future solar capacity may be large, centralized, and land intensive (International Energy Agency, 2022), there is increasing concern that conventional GPV development to meet SDG 7 may undermine progress towards other SDGs (e.g., SDGs 2 [Zero Hunger] and 15 [Life on Land]) (Fuso Nerini et al., 2019). By 2050, GPVs are estimated to occupy up to 2%–5% of land in some nations (e.g., Japan and South Korea), potentially competing with other essential land uses such as agriculture or natural areas (Van De Ven et al., 2021; Hernandez et al., 2019; Hernandez et al., 2024). Soils are a natural capital that deliver economically critical ecosystem goods and services and thus are inextricably linked to and underpin 11 SDGs (Lal et al., 2021). As soils are one of the important determinants of a nation’s economic status, their inclusion in ecosystem services frameworks and their impact on policy and decision-making is essential (Dail et al., 1997; Adhikari and Hartemink, 2016).
Conventional GPV development is characterized by practices that present risks to soils and their associated ecosystem services. For example, deliberate soil compaction, grading, road construction, and removal of topsoil and vegetation directly degrade soil quality by increasing bulk density, decreasing hydraulic conductivity, damaging roots, and stripping essential nutrients (Tracy et al., 2011; Noor and Reeza, 2022; Hernandez et al., 2014). These impacts heighten risks of erosion and flooding (Hernandez et al., 2014) and impede future vegetation establishment (Tracy et al., 2011). Physico-mechanical properties like aggregate stability, penetration resistance, surface failure shear strength, and hydraulic conductivity are important indicators to characterize these risks, as well as for PV construction and restoration of native vegetation. Risks associated with soil erosion and stormwater runoff mismanagement are particularly high at conventional GPVs, with potential to violate state and federal policies protecting water quality [e.g., Clean Water Act (United States Enviornmental Protection Agency, 2022)]. Further, during operation, GPVs alter microclimatic conditions and soil moisture patterns by shading and collecting rainfall below leading edges (Wu et al., 2022; Tanner et al., 2020), especially in fixed-tilt systems that cover some areas permanently, creating a structured, repeating pattern of “microsites” [or “micropatches” at single-axis tracking GPVs (Li et al., 2025)]. These effects have been documented to modulate hydrological properties (Wu et al., 2022; Mulla et al., 2024), vegetation communities (Moscatelli et al., 2022; Uldrijan et al., 2021; Tanner et al., 2021) and soil carbon (C) cycling in many climates (Armstrong et al., 2016; Choi et al., 2020; Lambert et al., 2021; Krasner et al., 2025; Dvořáčková et al., 2024), which may hinder ecosystem services of lands occupied by GPV infrastructure if not managed intentionally.
Soil C is doubly critical to consider in the development and operation of GPVs. First, soil C is an important component to the minimization of life-cycle C intensity of generated electricity. Soil C fluxes from GPV development may vary by climate and other site contexts (Krasner et al., 2025). However, isolated studies indicate that without effective intervention, practices associated with conventional GPV development can induce a net loss in terrestrial C (Armstrong et al., 2016; Choi et al., 2020), potentially releasing up to 50 g-CO2 kW h-1. Rangarajan et al. (2022) estimated similar adverse outcomes from the development of concentrating solar power (CSP) facilities, which may attribute 7%–137% of total life-cycle CO2 emissions from soil C loss (Rangarajan et al., 2022), though there exist disparities between CSP and PV. Increased carbon intensity of generated electricity counteracts the emissions-saving benefit of solar energy and impedes net-zero goals (Van De Ven et al., 2021; Lambert et al., 2021; Krasner et al., 2025).
Second, soil C plays a fundamental role in overall soil health and ecosystem function. Soil C is a key driver of aggregate formation, and therefore soil structure, stabilization, and erosion resistance (Cotrufo and Lavallee, 2022; Fuhrmann and Zuberer, 2021). Soil organic matter (SOM) content is directly linked to cation exchange capacity (Cotrufo and Lavallee, 2022) and pH (Ryals et al., 2014), which directly affect a soil’s ability to retain and supply essential nutrients to plants. Understanding the relative magnitudes of and fluxes between C pools is necessary to evaluate key indicators of ecosystem function like microbial respiration and photosynthesis.
This study aims to inform ecovoltaics: the restoration of GPV land assets to recover or enhance ecosystem services (Hernandez et al., 2024) (e.g., water retention, soil C sequestration, and biodiversity) that provide value to people and the surrounding environment (Martin, 2017). Other multi-use solar project types (e.g., agrivoltaics and rangevoltaics) share similar practices and goals to ecovoltaics (Hernandez et al., 2024), and therefore may benefit from soil-related findings observed at ecovoltaic parks. Global acceleration of GPV rollout requires novel and ecologically-informed design approaches to effectively minimize undesired changes to soils and ecosystems. However, the complex and context-dependent interactions between soils and GPVs have remained underexplored to date, especially at ecovoltaic solar parks (Krasner et al., 2025).
1.1 Research niche and objective statement
Previous work on the interface between GPVs and soils has focused mostly on microclimate (e.g., temperature, wind, radiation), with many studies also contextualizing findings with soil texture and order (Krasner et al., 2025). Though more recent studies have measured soil C in conventional GPVs and ecovoltaic parks (Carvalho et al., 2024; Zhao et al., 2025; Zhang et al., 2025), soil physico-mechanical properties important for erosion control and vegetation establishment have rarely been studied in a multi-use solar context; no study to date has investigated penetration resistance, surface shear strength, or soil structure. While most studies have opted for spatial granularity of two (Moscatelli et al., 2022; Armstrong et al., 2016; Lambert et al., 2021) to four microsites (Choi et al., 2024), none have sampled at finer resolution. Also, many studies may not use the word “microsite,” further highlighting unstandardized language and methods for the characterization of GPVs (Cagle et al., 2023). While recent meta-analyses have found neutral effects of GPV development on soil C on average, especially in grasslands, these findings lack insight into management differences (e.g., conventional vs. ecovoltaic or agrivoltaic), obfuscating conclusions from individual studies (Zhang et al., 2023; Chen et al., 2024).
This study’s goals are to (i) characterize 13 unique soil surface properties at a fixed-tilt GPV in the Central Valley of California, USA, (ii) quantify the effects of native grassland restoration on these properties, (iii) evaluate the structure of fixed-tilt GPV microsites, and (iv) understand implications for SOC stocks among experimental conditions, including an agricultural land-use. Results from this study inform the relationship between GPVs and soil surface properties; an empirical understanding of these relationships may inform the potential of restoration at ecovoltaic solar parks as a nature-based climate solution in accordance with operational and logical constraints of electric power generation. As GPV operators increasingly deputize as land managers, this study interrogates the critical role of land management of GPVs in similar contexts, especially for management of compaction, erosion, hydrology, and soil C, emphasizing the importance of research on the interplay between GPVs and soils.
2 Materials and methods
2.1 Site information and experimental conditions
This study was conducted at the Rancho Seco Solar II Project (hereafter Rancho Seco), a 160 MW bifacial GPV northeast of Clay in the county of Sacramento, California, United States (Figure 1; Supplementary Material 1). Land use prior to operation (i.e., before 2021) was grassland and cattle-grazed pasture, adjacent to the non-operational nuclear thermoelectric power plant. Comparative measurements were taken at the Bronco Wine Company vineyard directly west of Rancho Seco (Figure 1), as vineyards are a prevalent agricultural landscape in California and are subject to intense management with some similarities to GPVs. All sampled areas had soils classified as Redding gravelly loam, characterized by a prominent coarse fraction (5%–30%) and substantial clay content (10%–30%) (United States Department of Agriculture Natural Resources Conservation Service, 2024; National Cooperative Soil Survey, 2018).
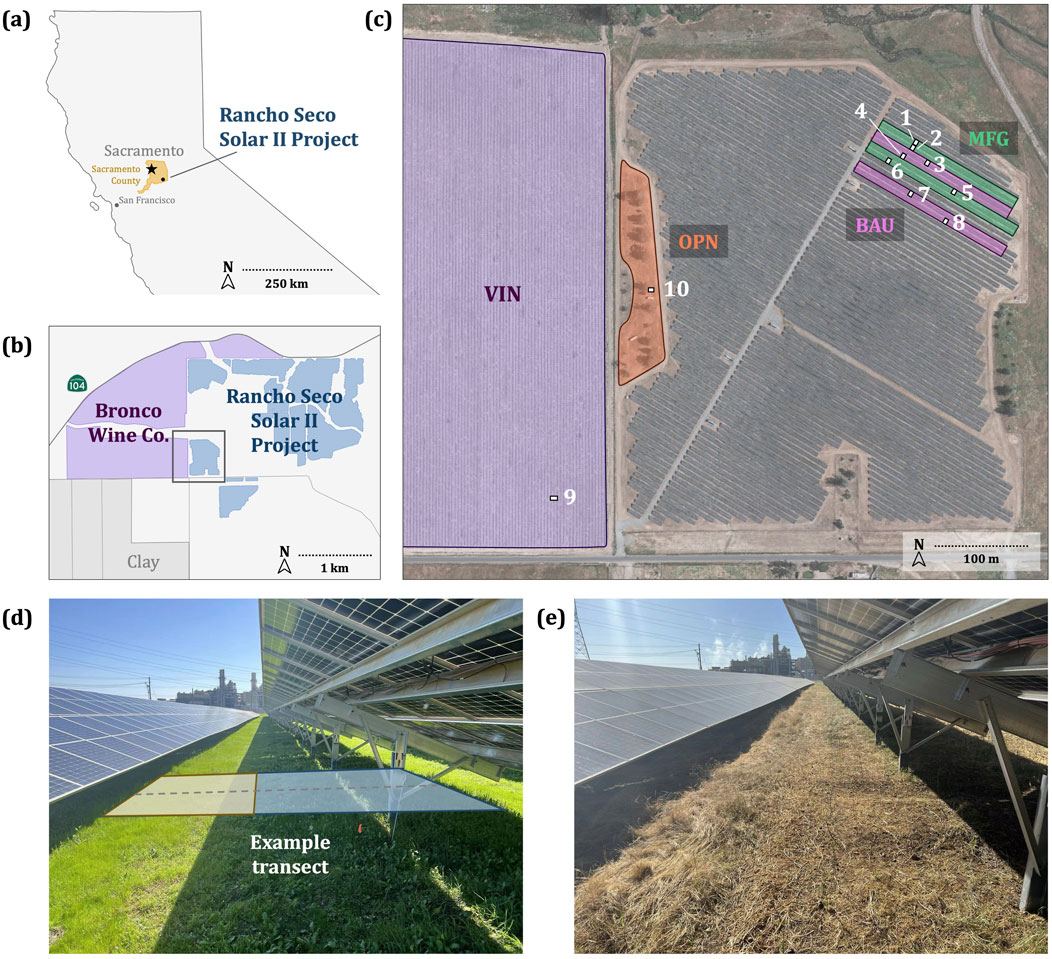
Figure 1. Site geography. (a) Location of Rancho Seco Solar II Project within Sacramento County (yellow) and California, United States. (b) Rancho Seco Solar II Project (blue), Bronco Wine Co. vineyards (purple), and boundaries for the census-designated place of Clay (gray). The inset box in (b) frames (c) which highlights experimental conditions (BAU = business as usual, MFG = multifunctional grassland, OPN = open, semi-natural area, VIN = vineyard) and transects (white, numbered) within the study area. Within the array, one transect was randomly chosen per string. (d) An MFG plot with an overlay of an example transect in March 2024, facing east-southeast. More detail on transect geometry in Figure 2. (e) The same MFG plot in May 2024.
Soil properties in four experimental conditions were compared: (i) an unrestored control within the PV array footprint (i.e., under and/or between PV panels, and excluding roads and other auxiliary land assets) representative of the majority of the site (i.e., business as usual, BAU), (ii) multifunctional grassland restoration within the PV array (i.e., MFG), (iii), relatively undisturbed, semi-natural open space outside of the PV array footprint but within the GPV fenceline (i.e., OPN), and (iv) the adjacent Bronco Wine Co. vineyard (i.e., VIN; Figure 1c). Sampling in the PV array (i.e., BAU and MFG conditions) occurred on 11 May 2024, and on 15 May 2024 for OPN and VIN conditions. No major weather events occurred between the two sampling days. Long-term sampling, though desired, was prohibited due to logistical and technical constraints of the site.
Restoration in the 7-acre MFG treatment began in 2022, consisting of annual winter seeding of ten common California Central Valley grasses (dominated by Bromus carinatus, Elymus glaucus, and Hordeum brachyantherum; Supplementary Material 2) and minor weed suppression activities (Supplementary Material 1). The grassland restoration’s multifunctionality was aimed at numerous ecosystem functions, including erosion resistance, soil C sequestration, water retention, and biodiversity. Though these benefits were not completely realized within the timeframe of this study, the name was kept to demonstrate clear restoration intention. An auxiliary survey in BAU and MFG conditions showed greater vegetation cover in sunlit interspaces and runoff zones, and significantly more grass cover in MFG than BAU (p = 0.02; Supplementary Material 6).
The OPN condition was characterized by relatively undisturbed soils, dry annual non-native grasses (e.g., Avena barbata, A. fatua, B. diandrus, H. murinum), sparse patches of native grasses (e.g., B. carinatus, H. brachyantherum), and native annuals (e.g., Eschscholzia lobbii) between a row of pines (e.g., Pinus sabiniana). It did not include access roads or other developed areas within the GPV. The VIN condition was characterized as a commercial, drip irrigated, top wire cordon vineyard in the California Central Valley’s Lodi American Viticultural Area (Borden Ranch sub-appellation; known for cobbly, free-draining soils). Growers failed to confirm the specific grape grown at this site, though it was speculated to be Zinfandel.
2.2 Soil properties and transect structure
Thirteen soil properties were measured, including (i) penetration resistance (n = 260 data points in 44 profiles), (ii) saturated hydraulic conductivity (Ksat; n = 20), (iii) surface failure shear strength (surface τf; n = 112), (iv) gravimetric water content (GWC; n = 63 hori-hori samples and n = 23 core samples), (v) total carbon (TC; n = 63), (vi) total organic carbon (TOC; n = 63), (vii) total inorganic carbon (TIC; n = 63), (viii) calcium carbonate (CaCO3) content (n = 63), (ix) total nitrogen (TN; n = 63), (x) carbon to nitrogen (C:N) ratio (n = 63), (xi) soil organic carbon (SOC) stocks (n = 63), (xii) bulk density (BD; n = 63), and (xiii) soil texture (n = 23). (iv) to (x) were obtained from hori-hori samples, (iv), (xii), and (xiii) were obtained from core samples, and (xi) was obtained by a combination of both (Section 2.3).
Field measurements and samples (Section 2.3) were structured in transects. Identically shaped transects were used in BAU, MFG, and OPN conditions (Figure 2a; 6.10 m × 4.04 m), while an alternate shape was used in the VIN condition to better suit the site’s unique geometry (Figure 2b; 6.71 m x ∼3 m). The former was constrained by PV panel racking: longitudinally by leading edges of adjacent PV panel strings, and laterally by support posts. Microsites were defined as “horizontal strips” within BAU and MFG transects parallel to the PV panel strings hypothesized to show distinct traits from one another (Figure 2a). They were compared individually, grouped by presence of shade or sun (i.e., a-d vs. e-k; Figure 2a), and by presence of runoff zones (i.e., a, h, and k vs. all else). Microsites a, h, and k were positioned at zones of concentrated rainfall runoff produced by the fixed PV panels, with microsite h corresponding to the thin gap between tiers of PV panels within a single string. Measurements and samples were collected on lines parallel to the transect centerline (i.e., across microsites, perpendicular to PV panel strings or trellises). As the VIN condition was irrigated under the trellises, areas close to drip emitters were avoided by sampling laterally.
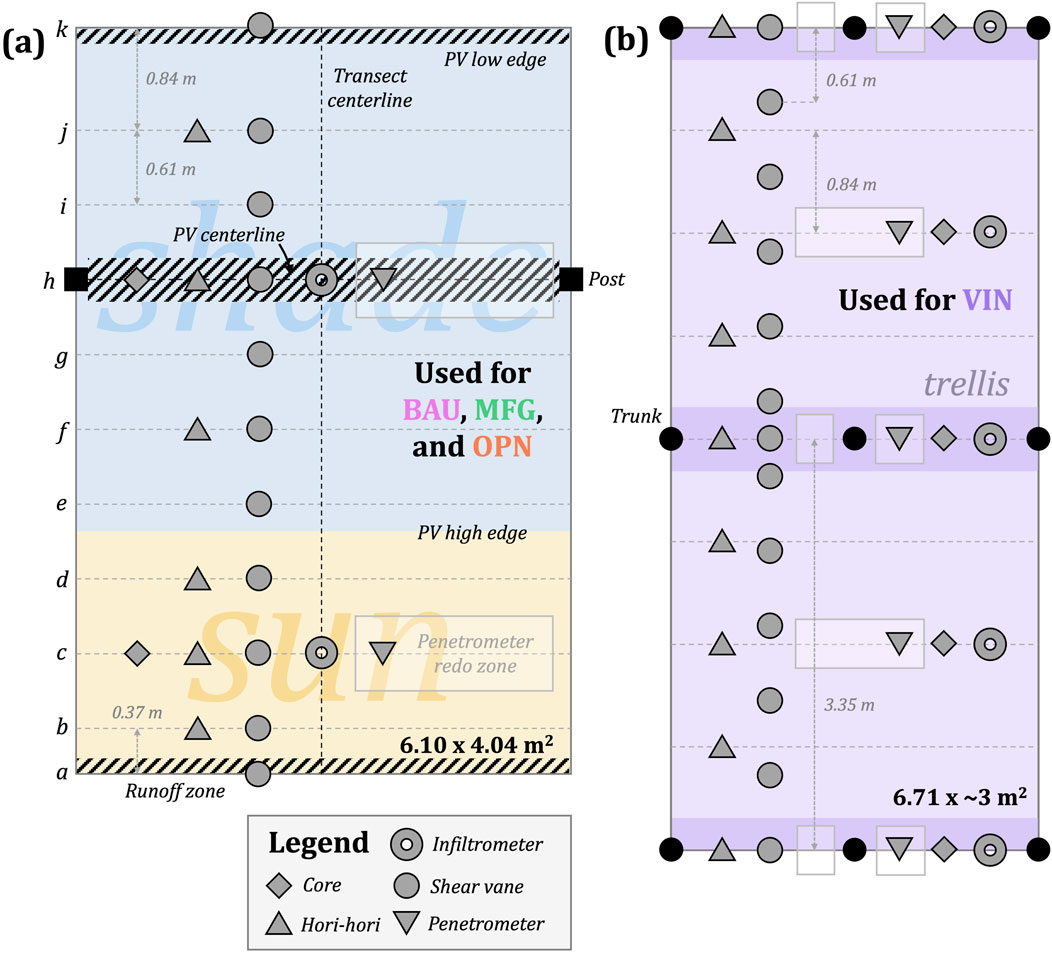
Figure 2. Transect design for the large, ground-mounted photovoltaic solar energy facility and adjacent vineyard (VIN). (a) Designed to capture relationships among PV panel-induced microsites (a–k), soil surface properties, and experimental conditions; employed at the business as usual (BAU), multifunctional grassland (MFG), and open (OPN) conditions. Destructive sampling nodes included soil extracted with a soil core (n = 2 per transect) and a hori-hori (i.e., weed knife, n = 6). Soil measurements were collected with an infiltrometer (n = 2), shear vane (n = 11), and penetrometer (n = 2). Zones of concentrated rainfall runoff (i.e., microsites a, h, and k; hatched) apply only to BAU and MFG. The top edge of the transect was aligned SSW (210°) in BAU and MFG, and due west (270°) in OPN. (b) Modified transect design employed at the VIN condition and designed to capture relationships among trellis design and production and soil surface properties. It was oriented with its top edge facing due west (270°). The arrangement in (b) was designed to mimic the sampling density seen in (a).
Ten total transects were sampled among the four experimental conditions (i.e., four in BAU, four in MFG, and one each in OPN and VIN; Figure 1c). Transects were chosen randomly in BAU and MFG at a rate of one per PV panel string (i.e., two per plot). The OPN transect was chosen to be a low-traffic area representative of the condition (e.g., not directly under a tree). Because the VIN condition appeared relatively uniform, the transect was chosen randomly and far from field edges. Only one OPN and VIN transect were selected to maximize sampling within the PV array while reconciling numerous logistical limitations (more information in Section 4.3).
2.3 Measurement protocols
2.3.1 Non-destructive measurements
Penetration resistance measurements were taken with an Innoquest Inc.™ SpotOn® Digital Soil Compaction Meter (i.e., penetrometer) in accordance with the product manual (Innoquest and Inc, 2017). For each measurement point, the penetrometer was inserted into the soil and peak resistance was recorded in 4-in (10.2-cm) increments marked on the instrument. If an obstacle (e.g., a rock) was felt before the entire 2-ft (61-cm) profile could be measured, the measurement was recorded and reattempted laterally from the original sampling point until success (Figure 2). Numerous additional profiles per transect (i.e., between 1–3) were measured in the “penetrometer redo zone,” time and space permitting (Figure 2).
Surface τf measurements were taken with a Gilson Company Inc. Pocket Shear Vane Tester Set HM-504A (i.e., shear vane) in accordance with the product manual and instructional video (Gilson Company Inc, 2024; ASTM D8121/D8121M-19, 2019).
Ksat measurements were taken with a Turf-Tec IN2-W Infiltrometer (i.e., infiltrometer) in accordance with the product manual and instructional video (Turf-Tec International, 2024; Turf-tec, 2020). If abnormal activity occurred during measurement (e.g., all water infiltrated quickly from failure to seal or macropore tunneling occurred), the run was dismissed and a new transect (Section 2.2) was selected randomly in the same PV panel string until success.
2.3.2 Destructive sampling
Amorphous soil samples (i.e., samples of unspecified volume) were taken with a hori-hori (hereafter, “hori-hori samples”) (Nisaku, 2024). For each sample point, a small area (∼2–5 cm diameter) was cleared of vegetation and debris. Then, the top ∼10 mm of soil was sampled and tinned (∼15–100 g wet soil per sample).
Soil samples of known volume (hereafter, “core samples”) were taken with an AMS, Inc. 2-in inner diameter by 2-in depth Soil Core Sampler Cup (measured volume of 89.74 cm3 ≈ 120 g wet soil) (AMS and Inc, 2024). Mechanical and practical considerations limited sampling with a longer core, including hard soils and low PV racking (Section 4.3). For each sample point, a small area (∼8 cm diameter) was cleared of vegetation and debris. Then, a slide hammer and soil cup assembly was struck into the soil until full, and carefully tinned with a palette knife.
Hori-hori samples were sent to the UC Davis Analytical Laboratory, where preprocessing included drying at 40 °C, massing (to find Partial Dry Matter), pulverizing to 2 mm, and further grinding to 0.25 mm (60 mesh). They were then flash combusted to find total C (TC), total organic C (TOC), total inorganic C (TIC), CaCO3 content, and total N (TN) (UC Davis Analytical Lab, 2022a; Association of Official Analytical Chemists, 1997).
Core samples were massed, dried at 60 °C until constant mass (∼1 week), and re-massed to find gravimetric water content (GWC; to supplement Partial Dry Matter from hori-hori samples; Section 2.4.1) and bulk density (BD). Then, the dry samples were sent to the UC Davis Analytical Laboratory for a texture analysis via typical sieving and hydrometer methods (UC Davis Analytical Lab, 2022b; Sheldrick and Wang, 2025).
2.4 Data processing and statistical tests
2.4.1 Data recording and processing
Data were recorded and cleaned in Microsoft Excel (Supplementary Material 5). Ksat was directly calculated and recorded in the field (i.e., mm·hr-1) by dividing observed infiltration by the duration of the test. Then, units were sensibly converted (i.e., to cm·hr-1).
Penetration resistance was recorded by digital instrument readout (in kPa) in the field. Missed measurements (i.e., the machine did not read; n = 4 of 264 data points) were left blank to avoid assumptions associated with linear interpolation. Obstructed data points and those deeper (n = 51) were replaced by the device’s upper limit of detection (6,500 kPa).
Surface τf measurements were recorded in kg·cm-2 in the field, then multiplied by the corresponding conversion factor for vane geometry (i.e., 2.5 in the OPN condition, 1 for all others). Then, units were sensibly converted (i.e., to kPa).
C:N ratio was calculated by dividing TC by TN, obtained from hori-hori samples. GWC was taken as the complement to Partial Dry Matter.
Core sample volume was calculated by averaging digital caliper measurements of the soil cup. BD was calculated by dividing dry sample mass by this quantity. GWC was calculated similarly to the hori-hori samples; but, because of differences in sampling depth and precision, these data were handled and notated separately.
SOC stocks were estimated by multiplying observed TOC concentrations by the closest BD value within the transect. SOC stocks were calculated from two samples from different depths, and may therefore introduce uncertainty. But, this method was chosen to maximize sample size in accordance with site constraints, despite its limitations (Section 4.3). In the case of the VIN condition, where some TOC measurements were exactly between two BD measurements, the mean of the two BD values was used. SOC stocks were estimated to a depth of 5 cm, as this study sampled at the soil surface. But, because the Kyoto Protocol and other international climate agreements call for standardized estimation of SOC stocks to a depth of 30 cm (United Nations, 1998; Stolbovoy et al., 2005), 5-cm SOC stocks were quadratically extrapolated to 30 cm (Silver et al., 2010) to allow for external comparison and account for the estimated distribution of SOC in California grassland soils (Supplementary Material 7). Because this method introduces additional uncertainty from lack of knowledge of the specific SOC profile of this site, these results were not reported in the main body of this study.
2.4.2 Statistical tests
Statistics were performed in R version 4.3.3 (Supplementary Material 5) (R Core Team, 2024). Comparisons were made among experimental conditions (i.e., BAU vs. MFG vs. OPN vs. VIN; averaging across microsites), among microsites overall (i.e., microsite a vs. b vs. c, etc.; averaging across BAU and MFG conditions), between sun and shade microsites within the PV array (i.e., BAU and MFG only; microsites a-d vs. e-k), and between runoff and non-runoff zones within the PV array (i.e., BAU and MFG only; microsites a, h, and k vs. all others). The sun vs. shade and runoff vs. non-runoff comparisons were done in three ways: agnostic of conditions (i.e., combined BAU and MFG), isolated for BAU, and isolated MFG. They were only made for properties collected in more than two microsites (e.g., TC), as the comparisons would be redundant for data collected in exactly two microsites (i.e., c and h; e.g., BD).
For each soil property × comparison, Levene’s test was used to assess data for heteroscedasticity. Linear models (LMs) were created for homoscedastic data, while generalized least squares (GLS) models were employed for heteroscedastic data. Model residuals were then tested for violations of normality with Shapiro-Wilk and D’Agostino-Pearson tests, with unequal variance adjustment for the heteroscedastic data. If Shapiro-Wilk and D’Agostino-Pearson tests disagreed, residuals were assessed for violations of normality by visual inspection of a quantile-quantile plot.
To find and quantify differences among these comparisons, different methods were required based on normality and heteroscedasticity. Standard analysis of variance (ANOVA) and Tukey-Kramer post-hoc tests were applied to the LMs for normal, homoscedastic data. ANOVA and differences in estimated marginal means (EMMs) were applied to the GLS models for normal, heteroscedastic data. Kruskal–Wallis and Nemenyi post-hoc tests were applied to non-normal, homoscedastic data. A series of Fligner-Policello tests with Holm family-wise error correction were performed on non-normal, heteroscedastic data.
3 Results
3.1 Soil physical properties
Soils were classified predominantly as sandy loam across all experimental conditions (Supplementary Material 3). Clay content ranged from 5%–25%, and did not differ significantly between experimental conditions or microsites (p = 0.1069 and 0.7761 respectively; Figures 3d, 4c). Neither Ksat nor BD differed significantly between experimental conditions (p = 0.5201 and 0.1695 respectively; Figures 3a,c), nor between microsites within the PV array (p = 0.8924 and 0.5661 respectively; Figures 4a,b).
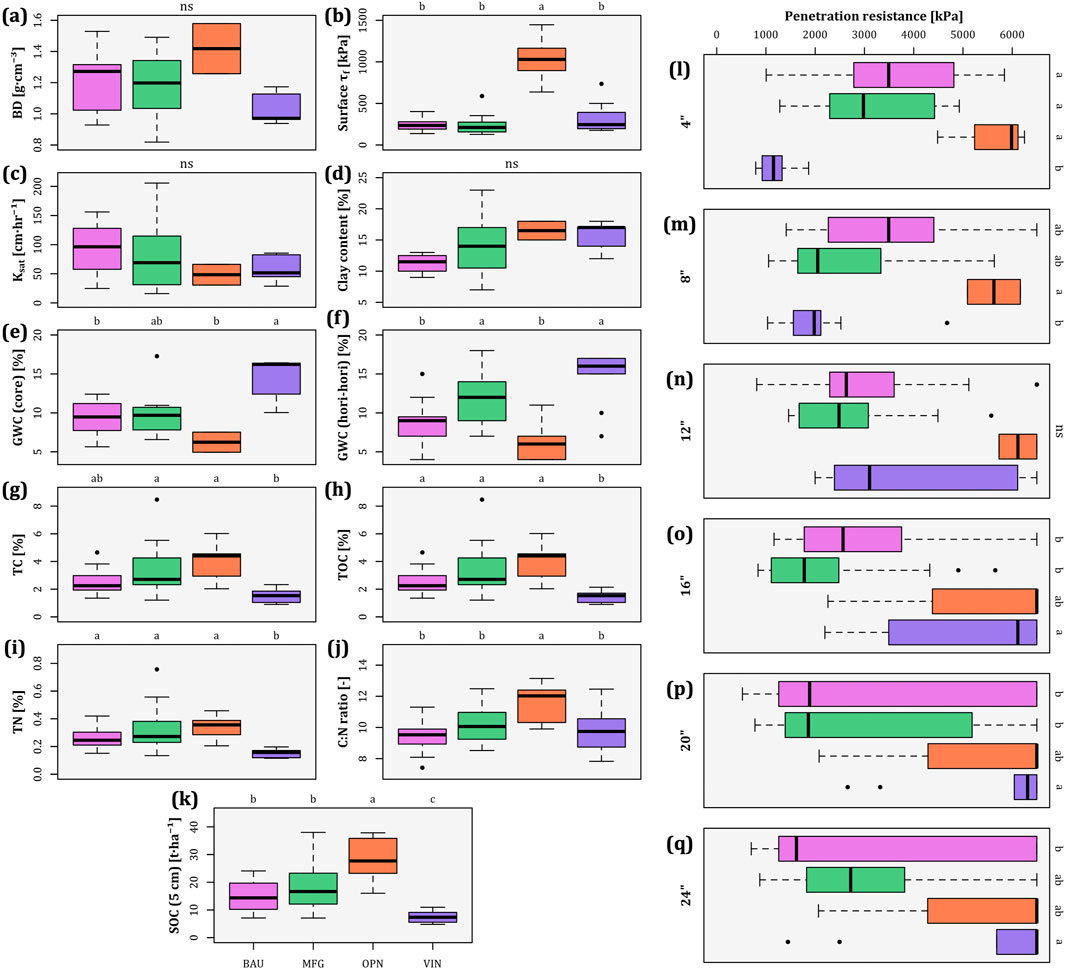
Figure 3. Boxplots of treatment-level differences in (a) bulk density (BD), (b) surface shear strength (surface τf), (c) saturated hydraulic conductivity (Ksat), (d) clay content, (e) gravimetric water content from core samples (GWC [core]), (f) gravimetric water content from hori-hori samples (GWC [hori-hori]), (g) total carbon (TC), (h) total organic carbon (TOC), (i) total nitrogen (TN), (j) C:N ratio, (k) soil organic carbon stock to 5 cm depth (SOC [5 cm]), and (l–q) penetration resistance at depths of 4–24 inches, among experimental conditions at a large, ground-mounted photovoltaic solar energy facility (BAU = business as usual, MFG = multifunctional grassland, OPN = semi-natural, open space) and adjacent vineyard (VIN). Compact letter displays of multiple comparison tests are displayed on the top axes of subplots (a–k) and right axes of subplots (l–q) (ns = non-significant).
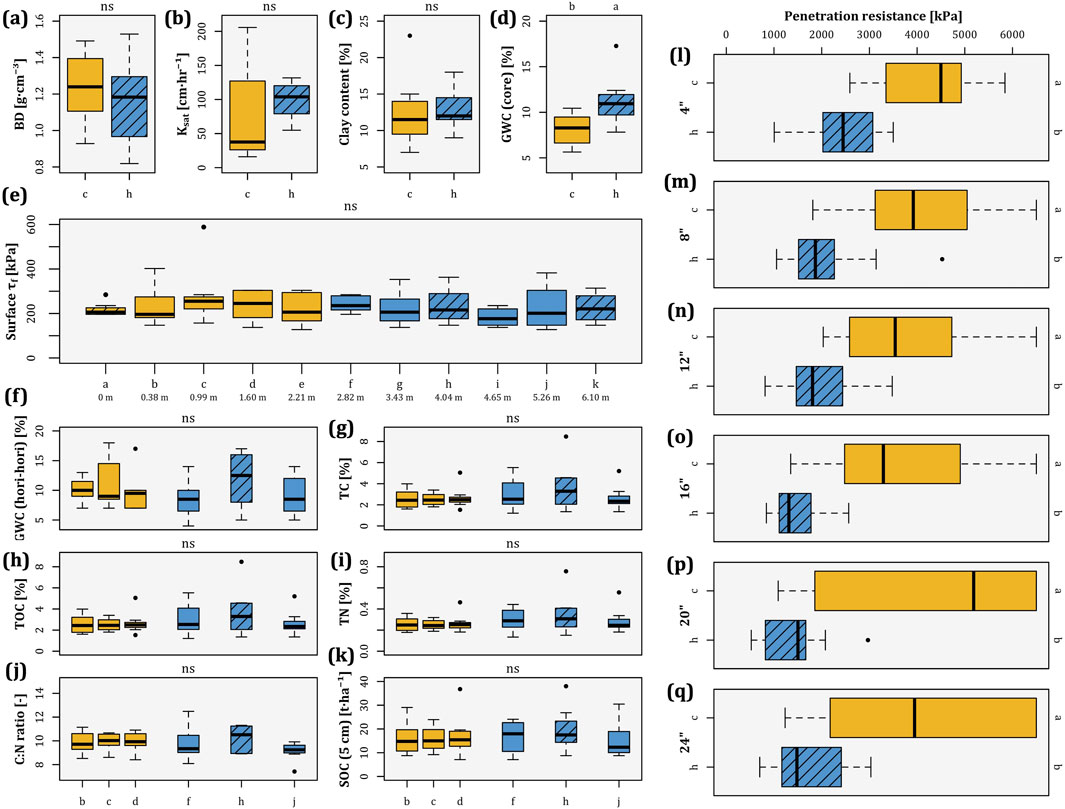
Figure 4. Boxplots of microsite-level differences in (a) bulk density (BD), (b) saturated hydraulic conductivity (Ksat), (c) clay content, (d) gravimetric water content from core samples (GWC [core]), (e) surface shear strength (surface τf), (f) gravimetric water content from hori-hori samples (GWC [hori-hori]), (g) total carbon (TC), (h) total organic carbon (TOC), (i) total nitrogen (TN), (j) C:N ratio, (k) soil organic carbon stock to 5 cm depth (SOC [5 cm]), and (l–q) penetration resistance at depths of 4–24 inches, among microsites (labelled a-k) at a large, ground-mounted photovoltaic solar energy facility. Each microsite’s distance measured south-southwestward, perpendicular from the adjacent string’s leading edge, is shown in (e); distances are not to scale. Yellow boxes denote “sun”, blue boxes denote “shade”, hatched boxes denote “runoff”, and unhatched boxes denote “non-runoff”. Compact letter displays of multiple comparison tests are displayed on the top axes of subplots (a–k) and right axes of subplots (l–q) (ns = non-significant).
Soils from hori-hori samples were significantly wetter in the MFG treatment than in BAU and OPN (p = 0.0010 and 0.0012, respectively; Figure 3f); however, these differences between conditions were not observed in core samples (Figure 3e). For both methods, the greatest mean GWC was observed in the VIN condition (Figures 3e,f), owing to the use of drip irrigation. Within the PV array, core samples were wetter in microsite h (i.e., center of shaded area, including runoff) than c (i.e., center of interspace area) p = 0.0166; Figure 4d), though it remains unresolved whether this was due to effects of shading or runoff. Isolating the MFG treatment, hori-hori samples were wetter in runoff zones (p = 0.0184; Figure 6b). Differences in hori-hori GWC were not observed within BAU only, BAU and MFG combined, in any sun vs. shade comparisons (Figure 5b), or any individual microsite comparisons (Figure 4f).
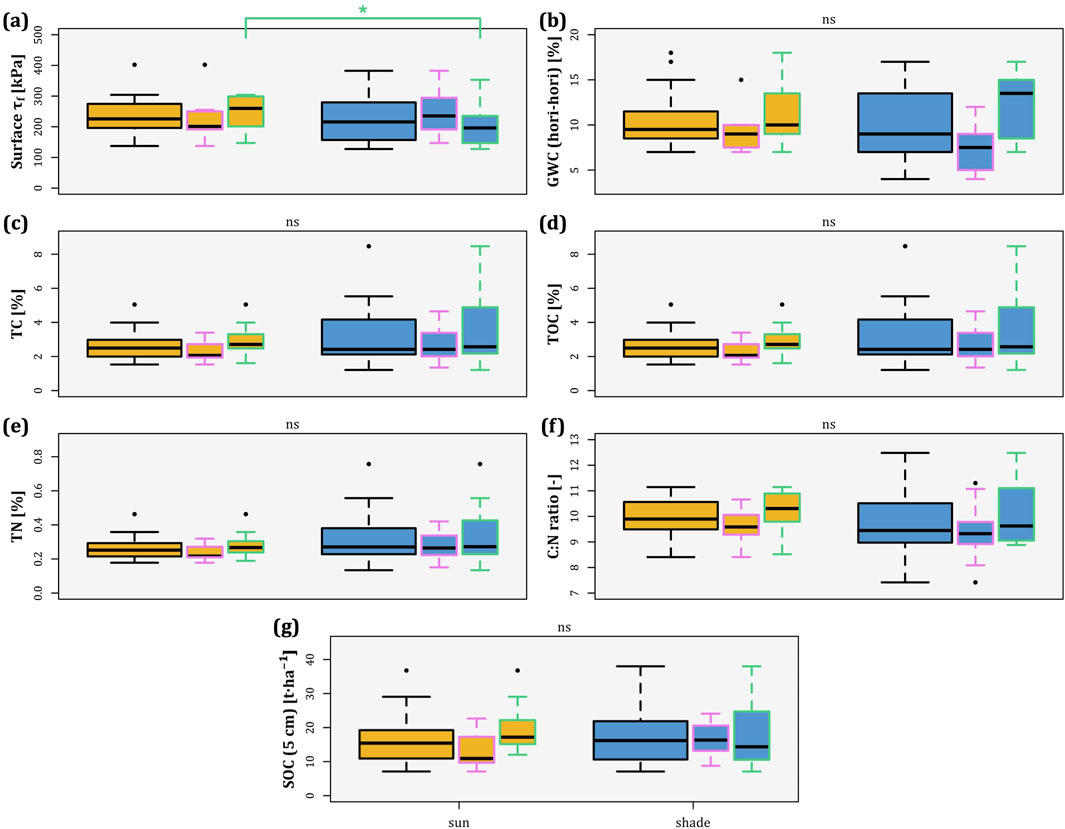
Figure 5. Boxplots of (a) surface shear strength (surface τf), (b) gravimetric water content from hori-hori samples (GWC [hori-hori]), (c) total carbon (TC), (d) total organic carbon (TOC), (e) total nitrogen (TN), (f) C:N ratio and (g) soil organic carbon stock to 5 cm depth (SOC [5 cm]) between groups of sun (yellow) and shade (blue) microsites at a large, ground-mounted photovoltaic solar energy facility. Outline colors correspond to comparisons overall (i.e., agnostic of treatment; black), considering business as usual only (BAU; pink), and considering multifunctional grassland only (MFG; green). Significance levels of comparison tests are displayed on the top axes of each subplot (ns = non-significant; * = significant, such that p < 0.05).
3.2 Soil mechanical properties
Surface τf was significantly greater in the OPN condition than elsewhere (p < 0.0001; Figure 3b). Within the MFG treatment, surface τf was less in the shade than in the sun (p = 0.0130; Figure 5a). However, this was not observed in the BAU condition or in BAU and MFG combined (Figure 5a). Runoff and non-runoff zones did not differ in surface τf (p ≥ 0.9176; Figure 6a).
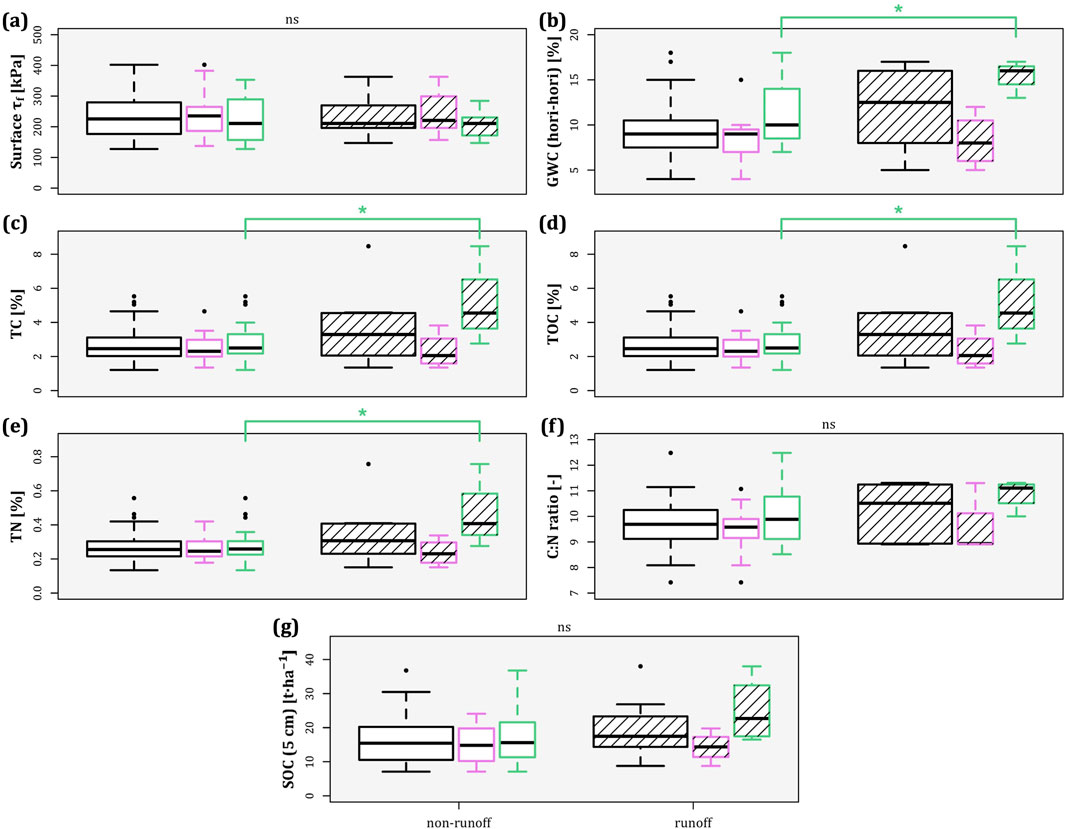
Figure 6. Boxplots of (a) surface shear strength (surface τf), (b) gravimetric water content from hori-hori samples (GWC [hori-hori]), (c) total carbon (TC), (d) total organic carbon (TOC), (e) total nitrogen (TN), (f) C:N ratio and (g) soil organic carbon stock to 5 cm depth (SOC [5 cm]) between groups of runoff (hatched) and non-runoff (non-hatched) microsites at a large, ground-mounted photovoltaic solar energy facility. Outline colors correspond to comparisons overall (i.e., agnostic of treatment; black), considering business as usual only (BAU; pink), and considering multifunctional grassland only (MFG; green). Significance levels of comparison tests are displayed on the top axes of each subplot (ns = non-significant; * = significant, such that p < 0.05).
The top 8 inches (20.3 cm) of soil were significantly less resistant to penetration (i.e., softer) in the VIN condition than in OPN (p ≤ 0.0340 and 0.0498 respectively; Figures 3k,l). There were no significant differences among BAU, MFG, and OPN conditions, though OPN was more resistant to penetration (i.e., harder) throughout the 24-inch (61.0-cm) profile (Figures 3l–q). Microsite h (i.e., center of shaded area with runoff) was much less resistant to penetration than microsite c throughout the entire profile (p ≤ 0.0003; Figures 4l–q), though it remains unresolved whether this was an effect of shading or runoff.
3.3 Soil chemical properties
The VIN condition had significantly lower TOC and TN concentrations than the rest of the conditions (p < 0.0377 and 0.0047, respectively; Figures 3h,i), and lower TC than MFG and OPN (p < 0.0009; Figure 3g). BAU, MFG, and OPN conditions did not differ in TC, TOC, or TN, but OPN was highest and BAU was lowest on average for each property (Figures 3g–i). TIC concentration and CaCO3 content were completely undetectable in BAU, MFG, and OPN conditions, and barely detectable in the VIN condition (n = 2 samples greater than the limit of detection). Soil in the OPN condition had a greater C:N ratio than any of the other conditions (p ≤ 0.0145; Figure 3j).
Within the MFG treatment, runoff zones had greater TC, TOC, and TN than non-runoff zones (p = 0.0365, 0.0365, and 0.0440 respectively; Figures 6c–e). These differences were not observed in BAU or overall within the PV array (Figures 6c–e). There were no significant differences among individual microsites for any soil chemical property (Figures 4g–k), nor when aggregated for sun and shade (Figures 5c–g).
Soils in the MFG treatment had ∼25% greater average SOC stock (18.67 t·ha-1–5 cm depth) than BAU (14.88 t·ha-1; Figure 3k and Supplementary Material 7). While this difference was not statistically significant (p = 0.2111), it may signal potential for longer-term C sequestration in ecovoltaic parks, given adequate management. Though, longer-term sampling is required for more definitive conclusions, especially in light of such a small difference thus far, and the typical time frame required to confidently detect SOC changes against background noise (Smith, 2004). The OPN condition had the greatest SOC stock (p ≤ 0.0161), and the VIN condition had the least (p < 0.0386), the latter likely from intense agricultural activities (e.g., tilling, heavy machinery, etc.). There were no differences in SOC stock among microsites, individual (Figure 4k) nor either aggregated comparison (Figures 5g, 6g).
4 Discussion
4.1 Analysis of results
4.1.1 Soil physico-mechanical properties and microsite granularity
Soils from core samples were wetter in microsite h than c, but no differences were detected among individual microsites for GWC in hori-hori samples. Core samples included deeper soil than hori-hori samples, so this supports the hypothesis that microsite differences in GWC only occurred below the shallow surface (<∼2 cm depth), likely due to soil drying more readily at the surface. A large body of agrivoltaics and ecovoltaics studies corroborate the effects of PV shading on soil moisture (Choi et al., 2024; Chen et al., 2024; Zhang et al., 2024; Kannenberg et al., 2023), but few have highlighted this particular phenomenon (Shang et al., 2023).
Soils in the VIN condition had the lowest penetration resistance, likely because of tilling. Within the PV array, the dramatic difference in penetration resistance between microsites c and h may be partially explained by more pronounced differences in GWC at greater depths, as increased GWC reduces penetration resistance (Lardy et al., 2022). Greater prior vehicle traffic in sun microsites and subsequent formation of a compaction layer may also explain this difference, at least at moderate depths (Choi et al., 2020), though field measurements nor information from site operators were able to verify this hypothesis. No study has investigated these soil mechanical properties in ecovoltaic parks to this date.
Soil properties were measured in up to eleven microsites in pursuit of elucidating the effects of PV panel shading, runoff collection to leading edges, and appropriate spatial granularity for future observations. While radiation and hydrological properties have been modeled as a gradient across a GPVs (Wu et al., 2022), for practical reasons, many soils-focused studies at GPVs have only sampled at limited microsites (e.g., shade under PV panels vs. sun interspace, or zones east and west of single-axis tracking panels) (Moscatelli et al., 2022; Armstrong et al., 2016; Lambert et al., 2021; Choi et al., 2024). Because significant differences in some properties were observed between runoff and non-runoff zones, sufficient microsite resolution must be characterized by sampling more granularly than a “sun vs. shade” dichotomy, with a keen focus on runoff zones and other features. For example, future study of soils at fixed-tilt sites like Rancho Seco likely warrant three to four microsites for maximal granularity without sacrificing replication: e.g., interspace, shade without runoff, shade with runoff, and leading edge. However, some physico-mechanical properties likely do not necessitate future measurement in more granular microsites, as they tended to vary little within sun and shade zones. Microsite-targeted restoration, tracking capabilities, and other features may complicate the application of these findings at other GPVs.
4.1.2 Soil C
The MFG treatment had a slightly greater average SOC stocks and amplified TC and TOC in runoff zones after only 2 years of restoration, indicating potential for soil C sequestration. Though only the top 5 cm of topsoil was sampled, similar increases in SOC stocks deeper in the soil profile may be encouraged by deep plumes of soil moisture from runoff zones and establishment of perennial root systems (Lal, 2009; Lal, 2019; Manning et al., 2015). Literature has shown mixed results on soil C sequestration with ecovoltaic practices (Krasner et al., 2025), with some successful outcomes (Lambert et al., 2022) and others still in search of the best management practices for their specific site contexts (Armstrong et al., 2016; Choi et al., 2020).
The OPN condition had a significantly greater average SOC stock than either condition within the PV array, likely from a relative lack of disturbance. Therefore, granted the OPN condition can serve as an adequate space-for-time replacement for prior land use at this site, PV construction and/or operation have likely released appreciable stores of soil C at the soil surface. Other field studies have also shown that conventionally developed, unrestored GPVs (i.e., analog to the BAU condition) negatively affect C cycling (Moscatelli et al., 2022; Lambert et al., 2021). Ecovoltaics may serve as a tool to partially mitigate management-driven C emissions in these conventionally developed sites, but this study’s findings cast doubt on the sequestration of additional C (e.g., for carbon credits). However, ecovoltaics may confer numerous benefits other than soil C sequestration (e.g., pollinator habitat, habitat continuity for mammals, erosion control, water holding capacity, aesthetics and community acceptance, etc.; Supplementary Material 4), which must be considered when planning to remediate a GPV (Hernandez et al., 2019; Walston et al., 2024; Cypher et al., 2021). Furthermore, much more thorough and long-term sampling is required to parse these differences in SOC stocks (Smith, 2004), especially in light of the novelty of ecovoltaics.
Critically, low-impact site design and construction (e.g., conforming to natural grading, minimizing vegetation disturbance, designating tread paths for heavy machinery to minimize soil disturbance, avoiding wet-season construction to minimize compaction, etc.) is a more certain way to preserve ecosystem function and SOC stocks at GPVs. However, opportunity still lies in synergizing restoration with microsites to augment the land’s existing capacity for soil C sequestration (or other ecosystem services) beyond what would be possible without GPV development, as demonstrated by the runoff zones in this study.
Contextualization with other land uses is vital in understanding landscape impacts and evaluating the large-scale feasibility of ecovoltaics. Rangeland soils in the Sacramento Valley have SOC stocks averaging approximately 15 t-C·ha-1–10 cm (Carey et al., 2020), suggesting that the disturbance from GPV development at Rancho Seco is roughly comparable to grazing on average. However, many factors may influence the SOC impacts of grazing at a particular site (e.g., land use history, background soil conditions, grazing intensity, and GPV presence in rangevoltaics applications); thus, more targeted and harmonized observation is necessary to systematically compare grazing to GPVs, both conventional and multi-use (Thomas, 2025). Greatly reduced SOC stocks in the VIN condition (i.e., by ∼50%), demonstrate that viticulture depletes SOC stocks much more than GPV development and operation, conventional or restored.
4.1.3 Soil N and other factors important for vegetation
The MFG treatment also had greater TN concentrations in the central PV runoff zone. C:N ratio was depressed in BAU and MFG conditions as compared to OPN, indicating C uptake was likely not limited by N stocks. However, outcompetition of native grassland species by R. raphanistrum and other annual weeds (Supplementary Material 6) introduces the concern that some soil N may have been held as NH4+ via biological nitrification inhibition (BNI) (O’Sullivan et al., 2017). Limitation of available nitrogen for desired perennial grasses may have diminished soil C uptake, and may even limit C storage pathways into recalcitrant mineral-associated organic matter (MAOM) (Bai and Cotrufo, 2022; Cotrufo et al., 2019). While many previous ecovoltaics studies have measured TN concentrations (Moscatelli et al., 2022; Choi et al., 2020; Lambert et al., 2022), few have partitioned N into separate pools (e.g., organic, inorganic, microbial) important for their distinct influences in fertility and restoration (and therefore soil C dynamics) (Armstrong et al., 2016; Lambert et al., 2021), warranting future study in this area.
There has been study on other important aspects of soil nutrition in GPV contexts as well, but research efforts are yet to strongly align. Choi et al. found that vegetated areas under PV panels improved soil nutrient content (e.g., P, K, Ca, Mg, etc.) and overall quality over time (Choi et al., 2023). Also, Moscatelli et al. observed significantly increased P concentrations in unrestored soils under PV panels compared to an adjacent fallow field (Moscatelli et al., 2022). Varied effects on soil pH have been observed in past studies, including overall acidification of GPV soils in grassland systems (Zhang et al., 2023). Other factors like cation exchange capacity (CEC) have been measured, but not yet investigated in detail (Tanner et al., 2020; Moscatelli et al., 2022).
An auxiliary vegetation survey highlighted reduced abundance and diversity in the shade overall (Supplementary Material 6), but with localized abundance in runoff zones, mirroring TC, TOC, TN, and GWC patterns and corroborating studies at similar sites (Lambert et al., 2021; Lambert et al., 2022; Schindler et al., 2018). Though it was hypothesized that abiotic conditions (e.g., penetration resistance, soil moisture, bulk density) would be improved in the shade and therefore usher vegetation establishment, concentrated runoff (or lack thereof) may be a greater driver of vegetation establishment and persistence, especially in a water-limited environment like the semi-arid grasslands of California’s Central Valley (Knapp and Sturchio, 2024). Further, hydrological factors are essential to germination and root development of restored plant species (Choi et al., 2024; Unger and Kaspar, 1994). Vegetation establishment was likely sensitive to other unmeasured factors, too, such as shading or competition with noxious weeds.
4.2 Vegetation management
This study tested some best management practices for ecovoltaics widely agreed upon by industry stakeholders. Solar developers and scientists alike champion immediate vegetation (re)establishment after disturbance, ideally of perennial grass communities with dense roots, to mitigate erosion and soil moisture losses (Zhu et al., 2015; Zhao et al., 2020; Machovina and Feeley, 2017; Belmonte, 2024). Though restoration was non-ideal, multi-use solar practitioners generally recognize that any plant cover, even weeds, provides essential ecosystem services. This study additionally sought to establish vegetation communities tolerant to shade conditions under PV panels. The two most dominant seeded species (i.e., B. carinatus, E. glaucus; Supplementary Material 2b and 2c) were tolerant to partial shade (Calscape, 2024a; Calscape, 2024b), but were much more robust in sunlit interspaces and runoff zones (Supplementary Material 6).
Weed suppression is a critical part of vegetation management, especially in early establishment of an ecovoltaic park. Typical best practices for large-scale projects include herbicide application, shallow tillage, mulching, occasional mowing, rotational grazing, and/or cover crop cultivation to control noxious weeds and prevent aggressive species from overtaking newly established seedlings (Abbas et al., 2018). While this site included management practices to encourage growth of target species (e.g., raking, mulching), it did not include adequate targeted weed suppression and site preparation activities.
4.3 Study limitations
This study’s unique site and geographic context provided many experimental challenges. Some, including (i) potential presence of the federally listed endangered California tiger salamander (Ambystoma californiense), (ii) low and dense configuration of PV panels, and (iii) rocky terrain, hindered the use of heavy mechanical sampling equipment, and therefore the depth of sampling. Instrument measurements were frequently blocked by rocks, too, resulting in slowed or incomplete data collection, especially in the case of the infiltrometer and penetrometer. The fast-approaching dry season prevented seasonal sampling, and logistical challenges to site access limited overall research efforts.
Restoration in the MFG treatment demonstrated minor evidence of vegetation establishment and improvements to soil surface properties, though aspirations of multifunctionality were limited by a number of factors. First, restoration lacked sufficient site preparation (e.g., initial herbicide application, decompaction, tilling, solarization, soil amendments, etc.), a critical component for the successful establishment of a restored vegetation community. The aforementioned site-specific challenges restricted the use of machinery to loosen compacted soil, essential for seed germination and root development. Premature and overstocked grazing in the growing season after seeding (i.e., spring 2023) thwarted perennial establishment. Additionally, the dominance of invasive and noxious plants was exacerbated by the site managers' reluctance to use chemical spraying (2,4-D, the only herbicide permitted on the property) for continuous weed suppression, further impeding the emergence and growth of desired, less competitive grass species. Also, though seeded species were shade-tolerant, their preference for full sun might have further reduced their competitiveness (e.g., possibly via reduced germination rate (Hernandez et al., 2020)) in the shade.
More sampling in the OPN and VIN conditions could reduce variability, reduce concerns of spatial auto-correlation, and improve understanding of soil properties outside of the PV array. A single-transect design may not have completely accounted for landscape heterogeneity, despite adjacency, potentially obscuring the effects of management. Bulk density cores and surface hori-hori samples were unharmonized in the VIN treatment, possibly increasing variability of SOC estimates, too. Additional sampling in more contexts (e.g., rangelands, roads, other developed areas) could provide further insight on prior land conditions and more granular analysis of land uses within the GPV fenceline. Sampling within the PV array was limited to eight transects between two conditions, but observation of additional transects could decrease variability from inherent soil heterogeneity and more strongly highlight treatment differences. Furthermore, direct adjacency of BAU and MFG plots might have allowed seeds to spread to the leading edges of BAU plots, though this effect was likely negligible due to manual seeding methods and PV panels obstructing seed spread.
Hori-hori samples were selected for C and N quantification, despite mismatching with bulk density estimations from core samples, because they were much easier to replicate given site constraints. Core sampling was limited by hard, rocky soils and other aforementioned challenges, only allowing few shallow samples (5 cm). When used in a 5 cm estimate, ∼10 mm (1 cm) hori-hori samples may have overestimated and increased the variance of SOC stock estimates, as most soils have the greatest, yet most heterogeneous soil C concentrations at the surface (Silver et al., 2010). Cores collected to 30 cm, homogenized, and used for both TOC and BD quantification would provide standardized SOC stock estimations consistent with literature (United Nations, 1998; Stolbovoy et al., 2005; Smith, 2004), though the combination sampling method and quadratic extrapolation approach used in this study (Supplementary Material 7) obtained best available estimates with the provided limitations. Most SOC stock observations were less than 100 t-C·ha-1–30 cm, which corroborates estimations for the Central Valley presented by the California Air Resources Board (California Air Resources Board, 2018).
All sampling was conducted in the same season and at the same location, so changes over time or between GPVs were not observed. Sampling over time, in conjunction with measuring more sensitive soil C fractionations (e.g., POM C, POXC) and/or direct measurement of gas fluxes, may provide stronger evidence of soil C sequestration in ecovoltaic parks in future studies. To increase understanding of the effects of restoration on soil surface properties in GPVs globally, more comparable sites must be observed.
Outcomes from this study spur many long-term research questions to address in the interface between multi-use GPVs and soils. To what degree can sought-after co-benefits (e.g., improvements to soil physico-mechanical and hydrological properties) be realized at a given site after successful establishment of an ecovoltaic park? Will long-term (i.e., >10 years) management of an ecovoltaic park for soil C sequestration (e.g., perennial grassland establishment, infrequent mowing) sequester comparable soil C to the same practices in an open space? Or, significantly reduce life-cycle land use impacts of the site? Last, which properties are the most important and accessible to measure for setting and monitoring restoration goals–and how often should they be measured?
5 Conclusion
This study’s goals were to (i) characterize 13 unique soil surface properties at a fixed-tilt GPV in the Central Valley of California, USA, (ii) quantify the effects of native grassland restoration on these properties, (iii) evaluate the structure of fixed-tilt GPV microsites, and (iv) understand implications for SOC stocks among experimental conditions, including other land-uses.
As GPVs have a growing global land use footprint, this study was designed to evaluate the feasibility of on-site restoration to mitigate adverse impacts and support of ecosystem services at the soil surface. Overall, multifunctional grassland restoration was challenging owing to a lack of site preparation options for restoration, noxious weeds, and rocky soils. However, even this limited restoration approach increased soil moisture overall (likely via improved soil water holding capacity), alleviating water stress for future vegetation establishment. The multifunctional grassland treatment was highly effective (i.e., for TC, TOC, TN, and GWC) when paired with runoff zones while the BAU condition was not, spotlighting the importance of co-locating native seed banks with adequate establishment conditions. Furthermore, this study highlighted the management of auxiliary GPV land assets (i.e., analogous to the OPN condition), as these minimally disturbed lands may harbor more diverse plant communities and larger SOC stocks than areas inside the PV array, despite drier and more compacted soils. These open spaces make up ∼30% of GPV land area in the United States, and therefore must be considered equally to land within the PV array footprint (Levin, 2025).
Sampling took place in up to eleven microsites with varying degrees of sunlight exposure and concentration of runoff by PV panels. Most strikingly, runoff zones demonstrated accelerated soil C and N accrual when combined with grassland restoration. Shade microsites had softer soils (i.e., less surface shear strength) than sunny, interspace microsites, and a combination of shade and runoff improved penetration resistance and soil moisture. This study upholds that a site-specific, customized approach is necessary to understand environmental conditions at GPVs at the microsite scale. In particular, keen attention is needed to understand how runoff zones and other unique features of interest can be leveraged for restoration goals.
Regardless of ecovoltaics management, Rancho Seco outperformed Bronco Wine Co. in many soil surface properties. The Bronco Wine Co. vintner is the fourth largest producer of wine in the United States with over 140 km2 of vineyards (Bronco Wine Co., 2020), but worsening drought stress from climate change may shift suitability away from viticulture and toward GPVs (Shivers et al., 2018), magnifying the importance of local land use comparisons. These findings reflect the potential of GPVs to reduce soil degradation and ecosystem impacts compared to conventional agriculture, especially in conjunction with low-impact development practices and/or multi-use solar project types (i.e., ecovoltaics, agrivoltaics, or rangevolatics).
The site-specificity and novelty of ecovoltaics necessitates unprecedented nuance. More research must be done to assess the needs and goals of specific GPVs, as the applications from this study may be limited only to sites with similar characteristics. Further, longer-term and more detailed monitoring of soil C (e.g., finer partitions like POM and MAOM) in GPVs is timely. Maintaining and augmenting terrestrial carbon sinks will play a pivotal role in mitigating climate change and maintaining ecosystem function; hence, in light of rapid global expansion of GPVs, ecovoltaics provides a unique transdisciplinary opportunity to manage working lands sustainably.
Data availability statement
The datasets presented in this study can be found in online repositories. The names of the repository/repositories and accession number(s) can be found below: TSIP Solar Soil database: https://app.tsip.org/new/organizations/359.
Author contributions
NZK: Conceptualization, Data curation, Formal Analysis, Investigation, Methodology, Project administration, Software, Supervision, Visualization, Writing – original draft, Writing – review and editing. YL: Investigation, Resources, Supervision, Validation, Writing – review and editing. DCF: Investigation, Writing – original draft, Writing – review and editing. JB: Investigation, Writing – original draft, Writing – review and editing. ES: Investigation, Writing – original draft, Writing – review and editing. PP: Investigation, Writing – original draft, Writing – review and editing. PM: Investigation, Writing – original draft, Writing – review and editing. AT: Investigation, Writing – original draft, Writing – review and editing. MW: Investigation, Writing – original draft, Writing – review and editing. DC: Visualization, Writing – review and editing. RAL: Methodology, Supervision, Writing – review and editing. RRH: Conceptualization, Funding acquisition, Methodology, Project administration, Resources, Supervision, Validation, Writing – review and editing.
Funding
The author(s) declare that financial support was received for the research and/or publication of this article. NZK, YL, and RRH were supported by funding from the Electric Power Research Institute (EPRI; Award 10014423; Results in this paper do not imply endorsement of EPRI). NZK, YL, DCF, JB, DC, and RRH were supported by the University of California Office of the President’s California Climate Action Seed Grant (Award A24-1267). RAL was supported by the UC Davis Hatch Multi-State Research Fund (#13U02). RRH was also supported by the Agricultural Experiment Station Hatch projects CA-R-A-6689-H and CA-D-LAW-2352-H.
Acknowledgments
The authors would like to thank Alonzo Pineda from NovaSource Power Services and Rodrigo Sandobal from Bronco Wine Co. for site access. We would also like to thank the friendly staff at the UC Davis Analytical Lab for their support in sample processing. Furthermore, we’d like to thank Elliott Steele from the Wild Energy Center and Andrew Brandino from the UC Davis Statistical Laboratory for support in statistical analysis.
Conflict of interest
The authors declare that the research was conducted in the absence of any commercial or financial relationships that could be construed as a potential conflict of interest.
The author(s) declared that they were an editorial board member of Frontiers, at the time of submission. This had no impact on the peer review process and the final decision.
Generative AI statement
The author(s) declare that no Generative AI was used in the creation of this manuscript.
Any alternative text (alt text) provided alongside figures in this article has been generated by Frontiers with the support of artificial intelligence and reasonable efforts have been made to ensure accuracy, including review by the authors wherever possible. If you identify any issues, please contact us.
Publisher’s note
All claims expressed in this article are solely those of the authors and do not necessarily represent those of their affiliated organizations, or those of the publisher, the editors and the reviewers. Any product that may be evaluated in this article, or claim that may be made by its manufacturer, is not guaranteed or endorsed by the publisher.
Supplementary material
The Supplementary Material for this article can be found online at: https://www.frontiersin.org/articles/10.3389/fenvs.2025.1646181/full#supplementary-material
Abbreviations
ANOVA, analysis of variance; BAU, business as usual; BNI, biological nitrification inhibition; BD, bulk density; C, carbon; Ca, calcium; CaCO3, calcium carbonate; CEC, cation exchange capacity; GPV, large, ground-mounted photovoltaic solar energy power plant; GWC, gravimetric water content; HSD, (Tukey’s) honestly significant difference; K, potassium; LULCC, land use and land cover change; MAOM, mineral-associated organic matter; MFG, multifunctional grassland; Mg, magnesium; MW, megawatt; N, nitrogen; NH4+, ammonium; OPN, semi-natural, open area beyond the PV array footprint within the GPV fenceline; P, phosphorus; POM, particulate organic matter; POXC, permanganate oxidizable carbon; PV, photovoltaic; SOC, soil organic carbon; SOM, soil organic matter; SSW, south-southwest; TC, total carbon; TIC, total inorganic carbon; TN, total nitrogen; TW, terawatt; TOC, total organic carbon; VIN, vineyard
References
Abbas, T., Zahir, Z. A., Naveed, M., and Kremer, R. J. (2018). “Limitations of existing weed control practices necessitate development of alternative techniques based on biological approaches,”Adv. Agron. 147. 239–280. doi:10.1016/bs.agron.2017.10.005
Adhikari, K., and Hartemink, A. E. (2016). Linking soils to ecosystem services — a global review. Geoderma 262, 101–111. doi:10.1016/j.geoderma.2015.08.009
AMS, Inc (2024). 2” X 2” soil core sampler cup. AMS, Inc. Available online at: https://www.ams-samplers.com/2-x-2-scs-cup/.
Armstrong, A., Ostle, N. J., and Whitaker, J. (2016). Solar park microclimate and vegetation management effects on grassland carbon cycling. Environ. Res. Lett. 11, 074016. doi:10.1088/1748-9326/11/7/074016
ASTM D8121/D8121M-19 (2019). Approximating the shear strength of cohesive soils by the handheld vane shear device (ASTM D8121).
Bai, Y., and Cotrufo, M. F. (2022). Grassland soil carbon sequestration: current understanding, challenges, and solutions. Science 377, 603–608. doi:10.1126/science.abo2380
Bronco Wine Co. (2020). The biggest wine company you’ve never heard Of. Minn. Mon. Available online at: https://www.minnesotamonthly.com/sponsored/the-biggest-wine-company-youve-never-heard-of/.
Cagle, A. E., Shepherd, M., Grodsky, S. M., Armstrong, A., Jordaan, S. M., and Hernandez, R. R. (2023). Standardized metrics to quantify solar energy-land relationships: a global systematic review. Front. Sustain. 3, 1035705. doi:10.3389/frsus.2022.1035705
California Air Resources Board. (2018). An inventory of ecosystem carbon in california’s natural and working lands.
Calscape (2024a). California brome grass; Bromus carinatus. Available online at: https://calscape.org/Bromus-carinatus-(California-Brome-Grass).
Calscape (2024b). Blue wildrye; Elymus glaucus. Available online at: https://calscape.org/Elymus-glaucus-(Blue-Wildrye).
Carey, C. J., Weverka, J., DiGaudio, R., Gardali, T., and Porzig, E. L. (2020). Exploring variability in rangeland soil organic carbon stocks across California (USA) using a voluntary monitoring network. Geoderma Reg. 22, e00304. doi:10.1016/j.geodrs.2020.e00304
Carvalho, F., Healing, S., and Armstrong, A. (2024). Enhancing soil carbon in solar farms through active land management: a systematic review of the available evidence. Environ. Res. Ecol. 3, 042001. doi:10.1088/2752-664x/ad8ce4
Chen, X., Chen, B., Wang, Y., Zhou, N., and Zhou, Z. (2024). Response of vegetation and soil property changes by photovoltaic established stations based on a comprehensive meta-analysis. Land 13, 478. doi:10.3390/land13040478
Choi, C. S., Cagle, A. E., Macknick, J., Bloom, D. E., Caplan, J. S., and Ravi, S. (2020). Effects of revegetation on soil physical and chemical properties in solar photovoltaic infrastructure. Front. Environ. Sci. 8, 140. doi:10.3389/fenvs.2020.00140
Choi, C. S., Macknick, J., Li, Y., Bloom, D., McCall, J., and Ravi, S. (2023). Environmental co-benefits of maintaining native vegetation with solar photovoltaic infrastructure. Earth’s Future 11, e2023EF003542. doi:10.1029/2023ef003542
Choi, C. S., Macknick, J., McCall, J., Bertel, R., and Ravi, S. (2024). Multi-year analysis of physical interactions between solar PV arrays and underlying soil-plant complex in vegetated utility-scale systems. Appl. Energy 365, 123227. doi:10.1016/j.apenergy.2024.123227
Cotrufo, M. F., and Lavallee, J. M. (2022). “Soil organic matter formation, persistence, and functioning: a synthesis of current understanding to inform its conservation and regeneration,”Adv. Agron. 1–66. doi:10.1016/bs.agron.2021.11.002
Cotrufo, M. F., Ranalli, M. G., Haddix, M. L., Six, J., and Lugato, E. (2019). Soil carbon storage informed by particulate and mineral-associated organic matter. Nat. Geosci. 12, 989–994. doi:10.1038/s41561-019-0484-6
Cypher, B. L., Boroski, B. B., Burton, R. K., Meade, D. E., Phillips, S. E., Leitner, P., et al. (2021). Photovoltaic solar farms in California: can we have renewable electricity and our species, too? Calif. Fish Wildl. J. 107, 231–248. doi:10.51492/cfwj.hwisi.6
Daily, G. C., Matson, P. A., and Vitousek, P. M. (1997). “Ecosystem services supplied by soil,” in Nature’s services: societal dependence on natural ecosystems 113–132 (Washington D.C.; Covelo, CA: Island Press).
Dvořáčková, H., Dvořáček, J., Vlček, V., and Růžička, D. (2024). Are the soils degraded by the photovoltaic power plant? Cogent Food and Agric. 10, 2294542. doi:10.1080/23311932.2023.2294542
Fuhrmann, J. J., and Zuberer, D. A. (2021). “Carbon transformations and soil organic matter formation,” in Principles and applications of soil microbiology (Elsevier), 327–361. doi:10.1016/B978-0-12-820202-9.00013-7
Fuso Nerini, F., Sovacool, B., Hughes, N., Cozzi, L., Cosgrave, E., Howells, M., et al. (2019). Connecting climate action with other sustainable development goals. Nat. Sustain 2, 674–680. doi:10.1038/s41893-019-0334-y
Gallaher, A., Klionsky, S. M., Chen, Y., Becker, B., and Urban, M. C. (2024). Incorporating ecosystem services into solar energy siting to enhance sustainable energy transitions. Environ. Sci. Technol. 58, 21557–21568. doi:10.1021/acs.est.4c07894
Gilson Company Inc (2024). Pocket shear vane tester set (HM-504A). Available online at: https://www.globalgilson.com/pocket-shear-vane-set.
Haegel, N. M., Verlinden, P., Victoria, M., Altermatt, P., Atwater, H., Barnes, T., et al. (2023). Photovoltaics at multi-terawatt scale: waiting is not an option. Science 380, 39–42. doi:10.1126/science.adf6957
Hernandez, R. R., Easter, S., Murphy-Mariscal, M., Maestre, F., Tavassoli, M., Allen, E., et al. (2014). Environmental impacts of utility-scale solar energy. Renew. Sustain. Energy Rev. 29, 766–779. doi:10.1016/j.rser.2013.08.041
Hernandez, R. R., Armstrong, A., Burney, J., Ryan, G., Moore-O’Leary, K., Diédhiou, I., et al. (2019). Techno–ecological synergies of solar energy for global sustainability. Nat. Sustain 2, 560–568. doi:10.1038/s41893-019-0309-z
Hernandez, R. R., Tanner, K. E., Haji, S., Parker, I. M., Pavlik, B. M., and Moore-O’Leary, K. A. (2020). Simulated photovoltaic solar panels alter the seed bank survival of two desert annual plant species. Plants 9, 1125. doi:10.3390/plants9091125
Hernandez, R. R., Patten, T., Li, Y., Levin, M. O., Condon, D., Krasner, N. Z., et al. (2024). Defining voltaic landscapes for sustainability: Agrivoltaic, rangevoltaic, and ecovoltaic solar projects in California. doi:10.13140/RG.2.2.28245.33766
International Energy Agency (2021). World energy outlook 2021 – analysis. Available online at: https://www.iea.org/reports/world-energy-outlook-2021.
International Energy Agency (2022). Solar PV power capacity in the net zero scenario. Available online at: https://www.iea.org/data-and-statistics/charts/solar-pv-power-capacity-in-the-net-zero-scenario-2010-2030.
Kannenberg, S. A., Sturchio, M. A., Venturas, M. D., and Knapp, A. K. (2023). Grassland carbon-water cycling is minimally impacted by a photovoltaic array. Commun. Earth Environ. 4, 238. doi:10.1038/s43247-023-00904-4
Knapp, A. K., and Sturchio, M. A. (2024). Ecovoltaics in an increasingly water-limited world: an ecological perspective. One Earth 7, 1705–1712. doi:10.1016/j.oneear.2024.09.003
Krasner, N. Z., Fox, J., Armstrong, A., Ave, K., Carvalho, F., Li, Y., et al. (2025). Impacts of photovoltaic solar energy on soil carbon: a global systematic review and framework. Renew. Sustain. Energy Rev. 208, 115032. doi:10.1016/j.rser.2024.115032
Lal, R. (2009). Sequestering carbon in soils of arid ecosystems. Land Degrad. Dev. 20, 441–454. doi:10.1002/ldr.934
Lal, R. (2019). Carbon cycling in global drylands. Curr. Clim. Change Rep. 5, 221–232. doi:10.1007/s40641-019-00132-z
Lal, R., Bouma, J., Brevik, E., Dawson, L., Field, D. J., Glaser, B., et al. (2021). Soils and sustainable development goals of the united nations: an International union of soil sciences perspective. Geoderma Reg. 25, e00398. doi:10.1016/j.geodrs.2021.e00398
Lambert, Q., Bischoff, A., Cueff, S., Cluchier, A., and Gros, R. (2021). Effects of solar park construction and solar panels on soil quality, microclimate, CO2 effluxes, and vegetation under a mediterranean climate. Land Degrad. Dev. 32, 5190–5202. doi:10.1002/ldr.4101
Lambert, Q., Gros, R., and Bischoff, A. (2022). Ecological restoration of solar park plant communities and the effect of solar panels. Ecol. Eng. 182, 106722. doi:10.1016/j.ecoleng.2022.106722
Lardy, J. M., DeSutter, T. M., Daigh, A. L. M., Meehan, M. A., and Staricka, J. A. (2022). Effects of soil bulk density and water content on penetration resistance. Agric. and Env Lett. 7, e20096. doi:10.1002/ael2.20096
Li, Y., Armstrong, A., Simmons, C., Krasner, N. Z., and Hernandez, R. R. (2025). Ecological impacts of single-axis photovoltaic solar energy with periodic mowing on microclimate and vegetation. Front. Sustain. 6, 1497256. doi:10.3389/frsus.2025.1497256
Machovina, B., and Feeley, K. J. (2017). Restoring low-input high-diversity grasslands as a potential global resource for biofuels. Sci. Total Environ. 609, 205–214. doi:10.1016/j.scitotenv.2017.07.109
Manning, P., de Vries, F. T., Tallowin, J. R. B., Smith, R., Mortimer, S. R., Pilgrim, E. S., et al. (2015). Simple measures of climate, soil properties and plant traits predict national-scale grassland soil carbon stocks. J. Appl. Ecol. 52, 1188–1196. doi:10.1111/1365-2664.12478
Martin, D. M. (2017). Ecological restoration should be redefined for the twenty-first century. Restor. Ecol. 25, 668–673. doi:10.1111/rec.12554
Moscatelli, M. C., Marabottini, R., Massaccesi, L., and Marinari, S. (2022). Soil properties changes after seven years of ground mounted photovoltaic panels in central Italy coastal area. Geoderma Reg. 29, e00500. doi:10.1016/j.geodrs.2022.e00500
Mulla, D., Galzki, J., Hanson, A., and Simunek, J. (2024). Measuring and modeling soil moisture and runoff at solar farms using a disconnected impervious surface approach. Vadose Zone J. 23, e20335. doi:10.1002/vzj2.20335
National Cooperative Soil Survey (2018). Official series description - REDDING series. Available online at: https://soilseries.sc.egov.usda.gov/osd_docs/r/redding.html.
Nisaku, (2024). NJP650 the original HORI HORI NAMIBAGATA Japanese stainless steel weeding knife. Available online at: https://nisakujapan.com/products/nisaku-stainless-steel-weeding-knife-7-25-inch-blade-650-weeding-knife-serrated-blade.
Noor, N. F. M., and Reeza, A. A. (2022). Effects of solar photovoltaic installation on microclimate and soil properties in UiTM 50MWac solar park, Malaysia. IOP Conf. Ser. Earth Environ. Sci. 1059, 012031. doi:10.1088/1755-1315/1059/1/012031
O’Sullivan, C. A., Whisson, K., Treble, K., Roper, M. M., Micin, S. F., and Ward, P. R. (2017). Biological nitrification inhibition by weeds: wild radish, brome grass, wild oats and annual ryegrass decrease nitrification rates in their rhizospheres. Crop Pasture Sci. 68, 798. doi:10.1071/cp17243
R Core Team (2024). R: a language and environment for statistical computing. R Foundation for Statistical Computing.
Rangarajan, S., Hernandez, R. R., and Jordaan, S. M. (2022). Life cycle impacts of concentrated solar power generation on land resources and soil carbon losses in the United States. Front. Sustain. 3, 1021971. doi:10.3389/frsus.2022.1021971
Ryals, R., Kaiser, M., Torn, M. S., Berhe, A. A., and Silver, W. L. (2014). Impacts of organic matter amendments on carbon and nitrogen dynamics in grassland soils. Soil Biol. Biochem. 68, 52–61. doi:10.1016/j.soilbio.2013.09.011
Schindler, B. Y., Blaustein, L., Lotan, R., Shalom, H., Kadas, G. J., and Seifan, M. (2018). Green roof and photovoltaic panel integration: effects on plant and arthropod diversity and electricity production. J. Environ. Manag. 225, 288–299. doi:10.1016/j.jenvman.2018.08.017
Shang, W., Zhang, Z., Fu, G., Wang, Q., Li, Y., and Chang, L. (2023). Spatial heterogeneity of vegetation communities and soil properties in a desert solar photovoltaic power station of the hexi corridor, northwestern China. Pol. J. Environ. Stud. 32, 2795–2807. doi:10.15244/pjoes/160205
Sheldrick, B. H., and Wang, C. (2025). “Particle-size distribution,” in Soil sampling and methods of analysis, Canadian society of soil science (Ann Arbor, MI, USA: Lewis Publishers), 499–511.
Shivers, S. W., Roberts, D. A., McFadden, J. P., and Tague, C. (2018). Using imaging spectrometry to study changes in crop area in california’s central valley during drought. Remote Sens. 10, 1556. doi:10.3390/rs10101556
Silver, W. L., Ryals, R., and Eviner, V. (2010). Soil carbon pools in california’s annual grassland ecosystems. Rangel. Ecol. and Manag. 63, 128–136. doi:10.2111/rem-d-09-00106.1
Smith, P. (2004). How long before a change in soil organic carbon can be detected? Glob. Change Biol. 10, 1878–1883. doi:10.1111/j.1365-2486.2004.00854.x
Stolbovoy, V., Montanarella, L., Filippi, N., Selvaradjou, S.- K., Panagos, P., and Gallego, J. (2025). Soil sampling protocol to certify the changes of organic carbon stock in mineral soils of european union.
Tanner, K. E., Moore-O’Leary, K. A., Parker, I. M., Pavlik, B. M., and Hernandez, R. R. (2020). Simulated solar panels create altered microhabitats in desert landforms. Ecosphere 11, e03089. doi:10.1002/ecs2.3089
Tanner, K. E., Moore-O’Leary, K. A., Parker, I. M., Pavlik, B. M., Haji, S., and Hernandez, R. R. (2021). Microhabitats associated with solar energy development alter demography of two desert annuals. Ecol. Appl. 31, e02349. doi:10.1002/eap.2349
Thomas, N. (2025). Impacts of managed grazing on soil health at utility scale solar energy sites. Temple University. Available online at: https://www.proquest.com/docview/3215569954?pq-origsite=gscholar&fromopenview=true&sourcetype=Dissertations%20&%20Theses.
Tracy, S. R., Black, C. R., Roberts, J. A., and Mooney, S. J. (2011). Soil compaction: a review of past and present techniques for investigating effects on root growth: effect of soil compaction on root growth. J. Sci. Food Agric. 91, 1528–1537. doi:10.1002/jsfa.4424
Turf-Tec International (2024). IN2-W - turf-tec infiltrometer. Available online at: https://store.turf-tec.com/IN2lit.html.
UC Davis Analytical Lab (2022a). Total organic carbon - combustion method. Available online at: https://anlab.ucdavis.edu/analysis/Soils/322.
UC Davis Analytical Lab (2022b). Particle size analysis (Sand/Silt/Clay). Available online at: https://anlab.ucdavis.edu/analysis/Soils/470.
Uldrijan, D., Kováčiková, M., Jakimiuk, A., Vaverková, M. D., and Winkler, J. (2021). Ecological effects of preferential vegetation composition developed on sites with photovoltaic power plants. Ecol. Eng. 168, 106274. doi:10.1016/j.ecoleng.2021.106274
Unger, P. W., and Kaspar, T. C. (1994). Soil compaction and root growth: a review. Agron. J. 86, 759–766. doi:10.2134/agronj1994.00021962008600050004x
United Nations. (1998). Kyoto protocol to the united nations framework convention on climate change.
United Nations. (2015). General assembly resolution 70/1: transforming our world: the 2030 agenda for sustainable development.
United States Department of Agriculture Natural Resources Conservation Service (2024). Web Soil Surv. Available online at: https://websoilsurvey.nrcs.usda.gov/app/WebSoilSurvey.aspx.
United States Enviornmental Protection Agency (2022). EPA announces settlements to resolve clean water act violations at four solar farm construction sites in Alabama, Idaho and Illinois. Available online at: https://www.epa.gov/newsreleases/epa-announces-settlements-resolve-clean-water-act-violations-four-solar-farm.
Van De Ven, D.-J., Capellan-Peréz, I., Arto, I., Cazcarro, I., de Castro, C., Patel, P., et al. (2021). The potential land requirements and related land use change emissions of solar energy. Sci. Rep. 11, 2907. doi:10.1038/s41598-021-82042-5
Walston, L. J., Hartmann, H. M., Fox, L., Macknick, J., McCall, J., Janski, J., et al. (2024). If you build it, will they come? Insect community responses to habitat establishment at solar energy facilities in Minnesota, USA. Environ. Res. Lett. 19, 014053. doi:10.1088/1748-9326/ad0f72
Wu, C., Liu, H., Yu, Y., Zhao, W., Liu, J., Yu, H., et al. (2022). Ecohydrological effects of photovoltaic solar farms on soil microclimates and moisture regimes in arid northwest China: a modeling study. Sci. TOTAL Environ. 802, 149946. doi:10.1016/j.scitotenv.2021.149946
Zhang, Y., Tian, Z., Liu, B., Chen, S., and Wu, J. (2023). Effects of photovoltaic power station construction on terrestrial ecosystems: a meta-analysis. Front. Ecol. Evol. 11, 1151182. doi:10.3389/fevo.2023.1151182
Zhang, B., Zhang, R., Li, Y., Wang, S., Zhang, M., and Xing, F. (2024). Deploying photovoltaic arrays in degraded grasslands is a promising win-win strategy for promoting grassland restoration and resolving land use conflicts. J. Environ. Manag. 349, 119495. doi:10.1016/j.jenvman.2023.119495
Zhang, Y., Zhou, Q., Wang, X., Tian, Z., Liu, X., Chen, S., et al. (2025). Impact of photovoltaic panels on soil aggregate-associated organic carbon varies with grassland type. Land Degrad. Dev. 36, 4860–4873. doi:10.1002/ldr.5672
Zhao, Y., Liu, Z., and Wu, J. (2020). Grassland ecosystem services: a systematic review of research advances and future directions. Landsc. Ecol. 35, 793–814. doi:10.1007/s10980-020-00980-3
Zhao, F., Meng, Z., Liu, Y., Li, P., and Tang, G. (2025). Soil carbon and nitrogen changes due to soil particles redistribution caused by photovoltaic array. Front. Environ. Sci. 13, 1552447. doi:10.3389/fenvs.2025.1552447
Keywords: ecovoltaics, ecosystem services, grassland restoration, multi-use solar, photovoltaic solar energy, soil carbon sequestration, soil surface properties
Citation: Krasner NZ, Li Y, Friis DC, Benitez J, Stebbins E, Pinilla P, Maciel P, Thompson A, Wong M, Condon D, Lybrand RA and Hernandez RR (2025) Soil surface properties and implications for soil carbon sequestration in early-stage ecovoltaic grassland restoration. Front. Environ. Sci. 13:1646181. doi: 10.3389/fenvs.2025.1646181
Received: 13 June 2025; Accepted: 14 October 2025;
Published: 28 October 2025.
Edited by:
Kaibo Wang, Chinese Academy of Sciences (CAS), ChinaReviewed by:
Yaya Hasanah, Universitas Sumatera Utara, IndonesiaTaylor Bacon, Colorado State University, United States
Copyright © 2025 Krasner, Li, Friis, Benitez, Stebbins, Pinilla, Maciel, Thompson, Wong, Condon, Lybrand and Hernandez. This is an open-access article distributed under the terms of the Creative Commons Attribution License (CC BY). The use, distribution or reproduction in other forums is permitted, provided the original author(s) and the copyright owner(s) are credited and that the original publication in this journal is cited, in accordance with accepted academic practice. No use, distribution or reproduction is permitted which does not comply with these terms.
*Correspondence: Noah Z. Krasner, bnprcmFzbmVyQHVjZGF2aXMuZWR1