 Laura Esbrí1,2*
 Montserrat Llasat-Botija1,2
 Maria Carmen Llasat1,2
 Yolanda Sola1
 Nicola Loglisci3
 Erika Brattich4
 Sandra Racionero5
 Gert-Jan Steeneveld6
 Anna Mölter7
 Antonella Galizia8
 Lara Polo3
 Esther E. M. Peerlings6
 Carlo Cintolesi4
 Francesco Barbano4
 Muhammad Adnan9
 Lien Aerts9Pinhas Alpert10Gabriel Campos10Bio Mohamadou Torou11
 Silvana Di Sabatino4
 Antonio Parodi3
- 1Applied Physics Department, Universitat de Barcelona, Barcelona, Spain
- 2IdRA, Water Research Institute, Barcelona, Spain
- 3CIMA Research Foundation, Savona, Italy
- 4Department of Physics and Astronomy “Augusto Righi”, University of Bologna, Bologna, Italy
- 5Faculty of Economics and Business, University of Barcelona, Barcelona, Spain
- 6Meteorology and Air Quality Section, Wageningen University, Wageningen, Netherlands
- 7College of Engineering and Architecture, University College Dublin, Dublin, Ireland
- 8IMATI-CNR, National Research Council of Italy, Genova, Italy
- 9UHasselt, School of Transportation Sciences, Transportation Research Institute (IMOB), Hasselt, Belgium
- 10Department of Geophysics, The Porter School of the Environment and Earth Sciences, Tel Aviv University, Tel Aviv, Israel
- 11West African Science Service Centre on Climate Change and Adapted Land-Use (WASCAL), Ouagadougou, Burkina Faso
The H2020 I-CHANGE project (Individual Change of HAbits Needed for Green European transition) aims to actively engage citizens in tackling climate change through citizen science practices. To this end, I-CHANGE has collaborated with citizens and stakeholders across eight Living Labs (LLs) situated in seven countries representing diverse geographical and climatic regions. This paper presents the I-CHANGE Day, an event organized simultaneously in the eight LLs, with the aim of collecting and analyzing data on air pollution and meteorological variables through citizen science and raise public awareness on climate change and individual adaptation measures. The paper details the methodology adopted to facilitate the citizens’ participation and the implementation of the proposed activities in contrasting social and environmental settings, and the outcomes of these various citizen science activities. The two main activities implemented in the present case study were air pollution monitoring using Smart Citizen Kits (SCKs) and comparing personal temperature and humidity perception with observations acquired through MeteoTrackers sensors. The results show significant community involvement and provide useful insights for enhancing the effectiveness of international citizen science initiatives. They also highlight the importance of a co-creative process to capture different objectives and capabilities of LLs. Across all LLs, the activities presented engaged groups ranging from 8 to 60 citizens, who demonstrated high levels of interest and effectively acquired the skills to operate the low-cost sensors. This study further aims to facilitate the replication of the proposed campaign across other LLs in other areas of the globe.
1 Introduction
Climate change is one of the most pressing challenges of our time, requiring immediate interventions at both institutional and community levels. Rising global temperatures and the increased frequency, duration and intensity of extreme weather events highlight the urgent need for adaptation and mitigation strategies that involve both policymakers and citizens (IPCC, 2021). An interdisciplinary approach, integrating scientific research, technological innovation, and community-driven initiatives is essential for achieving long-term, sustainable climate resilience. These approaches, especially those directly involving individuals, offer a unique opportunity to address climate challenges to foster behavioral changes alongside policy measures (Muki, 2015; Hecker et al., 2018).
In this regard, there is a broad consensus on the contribution of individual behaviors to climate change, and on the importance of shifting these behaviors to enhance the efficacy of both collective and technological mitigation and adaptation measures. For example, the IPCC Sixth Assessment Report (IPCC, 2022) states that behavioral change can rapidly reduce global greenhouse gas (GHG) emissions from end-use sectors by at least 5% with policy support (high confidence). However, achieving such attitudinal shifts remains highly challenging, as knowledge alone is insufficient to drive change (Sabatier, 1987; Contandriopoulos et al., 2010). Instead, knowledge combined with the active participation and commitment of both citizens and communities may bring a change that is sustained over time (Brink and Wamsler, 2019; Khatibi et al., 2021). Hence, citizen science and Living Labs (LLs) present valuable opportunities, as they integrate both knowledge and engagement to foster long-term transformation. Citizen science refers to the active involvement of the general public in scientific research activities, either through the contribution of intellectual effort, local knowledge, or the development of tools and resources (European Commission, 2015; Muki, 2015; Muller et al., 2015; Vohland et al., 2021). Such engagement has the potential to foster a sense of ownership through awareness-rising and co-producing knowledge, and to empower individuals by enhancing their capacities (e.g., in environmental monitoring or climate-related action), while also contributing to community cohesion (Jordan et al., 2011; Collins et al., 2022; Skarzauskiene et al., 2024; Llasat-Botija et al., 2025). LLs constitute open innovation ecosystems in which researchers, private companies, citizens, and other societal stakeholders collaboratively explore and evaluate tools, services, and ideas (Santonen, 2018; Abernethy et al., 2022). In this regard, citizen science facilitates the identification, understanding and interpretation of observed environmental changes, while LLs provide a framework for co-designing potential solutions to the problems identified (Bulkeley et al., 2016; Veeckman and Temmerman, 2021).
The I-CHANGE project (2022–2025) is a Horizon 2020 EU research and innovation action financed by the European Green Deal that emphasizes the role of individual and collective behavioral change in achieving a sustainable and climate-resilient future (I-CHANGE consortium team, 2021). By integrating citizen science methodologies with low-cost monitoring tools, I-CHANGE seeks to empower individuals with the knowledge and tools needed to actively contribute to climate action. The project operates through a network of eight LLs across Europe, Middle East and Africa, which function as real-world experimental environments where local communities, scientists, and policymakers collaborate on climate-related challenges. The participating LLs are located in Amsterdam (Netherlands), Bologna (Italy), Barcelona (Spain), Dublin (Ireland), Genoa (Italy), Hasselt (Belgium), Jerusalem (Israel), Ouagadougou (Burkina Faso), providing a diverse set of contexts in which to test and refine participatory climate action strategies (Figure 1). Within the I-CHANGE LLs, citizen science is employed as a mechanism to address societal challenges associated with climate change and air pollution.
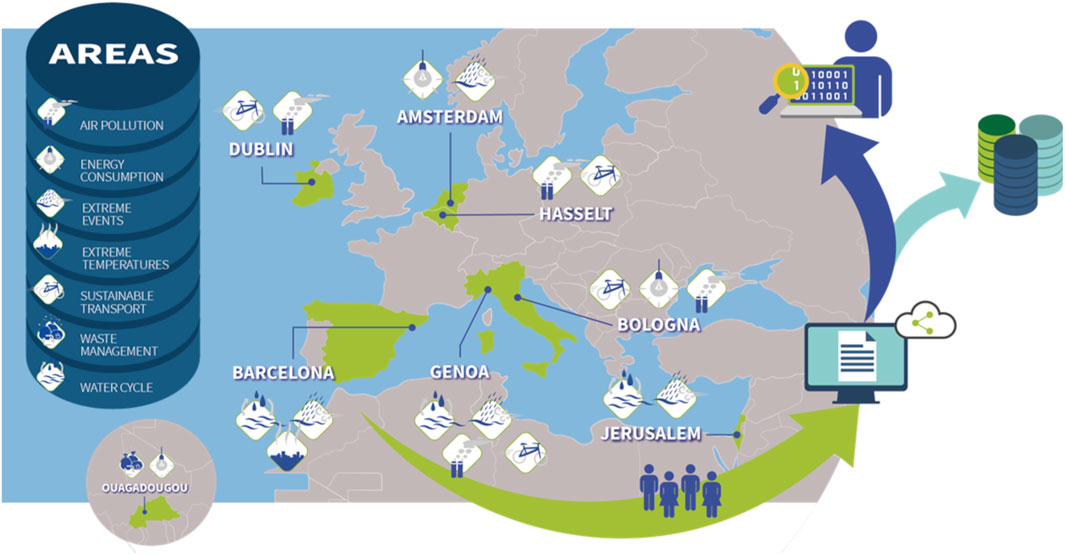
Figure 1. Spatial distribution of I-CHANGE LLs. Represents the location of the eight Living Labs of the I-CHANGE project and the different environmental monitoring activities they were most involved in. Figure developed by the I-CHANGE media team within the I-CHANGE project (© DEN Institute 2022; https://ichange-project.eu).
While previous studies have highlighted the role of citizen science in fostering engagement (Muki, 2015; Vohland et al., 2021) and its contributions to climate action (Muller et al., 2015), few have examined how large-scale, transnational citizen science initiatives can simultaneously enhance climate literacy, generate high-resolution data, and drive sustained behavioral change. Additionally, there is limited understanding of how socio-economic and environmental conditions shape the success of these initiatives across different geographic regions. In this context, the first objective of the present study is the development of a methodology to create two specific citizen science experiments and their implementation in a citizen-driven climate initiative across multiple geographic locations simultaneously. The second objective is to assess the level of particulate pollution and the level of comfort (observed temperature and humidity compared to perception levels) of the participants, as well as their adaptive capacities in relation to climate action. By combining instrumental measurements with participatory approaches, the study sought to demonstrate the feasibility and added value of large-scale, coordinated citizen science campaigns for both scientific knowledge and community engagement.
The paper is structured as follows: the Methods section describes the concept of the I-CHANGE LLs and the I-CHANGE Day (ICD); in addition, this section outlines the methodology followed in the different initiatives implemented during the ICD, including participant engagement, stakeholders and data collection processes; the Results section presents the collected data and findings from the citizen science activities and their interpretations; the Discussion and Conclusion sections finally summarize the results obtained and debate the broader implications of the initiative.
2 Materials and methods
The following subsections contextualize the concepts of the I-CHANGE project and LLs, the ICD initiative and the methods for the different citizens science activities implemented. It is worth remembering, here, that citizen science is, by design, a research-oriented practice in which members of the public contribute to advancing scientific knowledge while gaining learning and engagement benefits. This dual aim that combines robust scientific outputs and participant benefits has been demonstrated across domains such as biodiversity, astronomy, and water-quality monitoring (Lintott et al., 2008; Shirk et al., 2012; Sullivan et al., 2014).
2.1 The I-CHANGE Living Labs
As mentioned, the eight I-CHANGE LLs (Figure 1) are situated in diverse geographical and climatic regions, each addressing climate-related challenges specific to their local contexts. Each LL focuses on specific urban and peri-urban resilience themes, such as air pollution, extreme weather adaptation, energy consumption, and sustainable waste management and mobility, tailoring interventions to the unique socio-economic and environmental conditions of their respective regional and city contexts. Their interventions are shaped by both environmental conditions and stakeholder engagement, fostering citizen science initiatives tailored to the needs of each community.
The Northwest European LLs (Amsterdam, Dublin, and Hasselt) operate in temperate maritime and oceanic climates, characterized by relatively mild summers, cool winters, and frequent precipitation. These cities face climate risks related to extreme rainfall, flooding, urban heat and air pollution. The Amsterdam LL (AMLL) focuses on urban heat, extreme weather, and energy consumption, while the Dublin LL (DULL) emphasizes sustainable transport and air pollution. The Hasselt LL (HALL) promotes environmentally friendly mobility choices, aiming to reduce emissions and mitigate citizen exposure to air pollutants and temperature extremes.
In contrast, the Mediterranean LLs (Barcelona, Bologna, Genoa, and Jerusalem) are situated in warm-temperate and hot-summer Mediterranean climates, with hot, dry summers and wet winters. These cities struggle with urban heat islands, extreme weather events, water scarcity, and air pollution. The Barcelona LL (BALL) addresses extreme weather events, urban heat, and air pollution, while the Bologna LL (BOLL) investigates the role of green infrastructure, urban morphology and sustainable transport in affecting the spatial and temporal variability of air pollution and temperature extremes. The Genoa LL (GELL) focuses on hydro-meteorological risks such as flash floods and landslides, the water cycle, heat waves and air pollution, and the Jerusalem LL (JELL) explores extreme hydrometeorological events, the water cycle and heatwaves. Finally, the Ouagadougou LL (WALL), located in West Africa’s semi-arid climate, experiences extreme seasonal variation, prolonged dry seasons, and intense rainfall leading to flash floods. The lab primarily addresses waste management, urban flooding, and extreme weather adaptation in a rapidly expanding urban environment.
The LLs were established at different stages. While the Bologna, Dublin, and Hasselt LLs have been operational since 2016 in the context of the previous iSCAPE Horizon2020 project (https://cordis.europa.eu/project/id/689954) (iSCAPE project team, 2016), five others (Amsterdam, Barcelona, Genoa, Jerusalem, and Ouagadougou) were launched under the I-CHANGE project, between May and July 2022, benefiting from the prior experience of the earlier LLs. By engaging local communities in participatory research, the I-CHANGE LLs provide valuable insights into how climate change manifests in different urban settings and how citizen-driven adaptation strategies can enhance climate resilience. Their regional diversity allows for cross-comparative analysis of community engagement, environmental monitoring, and policy integration, strengthening the effectiveness of citizen science in climate action.
2.2 The I-CHANGE day
The ICD was conceived as a strategic collaborative cross-border response to the challenges of fostering behavioral change and advancing local knowledge on climate change impacts. Despite increasing awareness of the climate crisis, individual engagement often remains limited (Hall et al., 2024). Addressing this situation requires participatory approaches that move beyond passive information transfer (Phillips et al., 2019). By directly involving citizens in environmental observation, data interpretation and the co-design of scientific experiments, the ICD aimed to strengthen public agency and encourage more sustainable practices. At the same time, it provided a structured opportunity to collect fine-grained, locally relevant data to better understand the impacts of climate change and air quality, mitigation measures already in place and their implications for both the environment and the daily lives of citizens.
To bring this vision into practice, the ICD was held on 5 June 2024, World Environment Day, and within the framework of the European Green Week 2024. The initiative brought together the I-CHANGE LLs in a synchronized citizen science campaign, designed not only to engage participants in a scientific research activity but also to generate actionable insights and broaden the impact of the project’s goals. The activities were intentionally replicable and scalable, ensuring that findings could inform both local and broader climate policies and increase the environmental data availability. Additionally, the event provided an opportunity to assess the effectiveness of different engagement strategies, shedding light on best practices for fostering long-term citizen participation in environmental monitoring and advocacy. The activities were designed not only with these social aspects in mind but also to obtain observations. In this context, citizen science approaches have proven especially effective, enabling dense spatial and temporal data collection through public engagement (Rajagopalan et al., 2020; Clement et al., 2023), highlighting the values of local microclimate monitoring to better understand urban thermal dynamics and their implications for human comfort and energy use.
Different citizen science methodologies and tools were implemented during the ICD. The event design was led by the Barcelona LL of the University of Barcelona through a co-creative process carried out in an internal project workshop with the participation of all partners. This process resulted in the co-design of protocols for each activity, adaptable in their implementation details to the different local characteristics of the LLs. In line with participatory design approaches (Muki, 2015), researchers, local institutions, and citizens jointly defined the details of the experiments, including the selection of monitoring sites, the definition of walking or biking routes, and the means of transportation. For environmental monitoring, citizens deployed low-cost sensing technologies and received guidance on how to operate the devices, visualize the collected data, and understand how their contributions integrate into the project and improve local knowledge of climate change impacts. The two main instruments were the Smart Citizen Kit (SCK; Camprodon et al., 2019; Brattich et al., 2020), designed for fixed monitoring air pollution and meteorological variables, and the MeteoTracker (MT; Barbano et al., 2024; Loglisci et al., 2024), a portable mini-station for high-resolution mobile measurements of meteorological conditions. In parallel, citizens participated in perception-based monitoring, using qualitative scales to record expected and perceived thermal and humidity sensations across different urban spaces. Complementary activities were also conducted in some LLs, such as a Bioblitz (rapid biodiversity inventory involving volunteers and experts; Meeus et al., 2023) and a personal carbon footprint assessment (self-evaluation of individual contributions to greenhouse gas emissions), all of them being citizen science practices that combine data collection with awareness-raising. In addition, participants engaged in reflective practice sessions, where each group summarized the activity by identifying evidence, a concern, a proposal for neighborhood improvement, and an individual behavioral change they could implement in their lifestyle.
The selection of participants for the I-CHANGE Day activities was based on the existing stakeholder networks of each Living Lab, following the quadruple helix approach that integrates academia, civil society, public authorities, and business actors. Depending on the local context, participation was facilitated either via a key stakeholder who acted as a bridge to an interested group, or through the own communication channels of the LLs, such as newsletters and community mailing lists. As a result, the composition of participants varied across sites, reflecting both the diversity of local socio-environmental contexts and the availability of groups to take part on the day of the campaign.
To ensure transparency and societal impact, the outcomes of the ICD were communicated through multiple channels. All data collected during the campaigns were made openly accessible through the I-CHANGE Dashboard (https://ichange-project.eu/i-change-dashboard-your-gateway-to-climate-action/). This platform allowed participants in the various activities of the eight Living Labs to view both the measurements taken by their own group and those taken by other participating groups during I-CHANGE Day. At the end of the activities, facilitators dedicated time training participants in the use of the dashboard and to discussing preliminary results. In some cases, this final part took place in a relaxed setting (e.g., while having a drink), which facilitated open discussion. In addition, each Living Lab reported the findings back to their communities through tailored channels such as newsletters, private social media groups, or follow-up sessions in person with stakeholders. Beyond the local scale, the scientific results of the project were presented to the broader research community at the EGU2025 conference through posters, an oral contribution, and a dedicated splinter meeting open to participants. This multi-layered communication strategy aimed to ensure both direct feedback to citizens and broader dissemination of the knowledge generated.
The detailed protocols and materials are available in Supplementary Protocols S1, S2, and the details of implementation in each LL are in Supplementary Material. As part of a coordinated project effort, two groups of activities were launched approximately simultaneously in the different I-CHANGE LLs, as detailed below.
2.2.1 Air pollution monitoring with smart citizen kits (SCKs)
The first field campaign or activity aimed to qualitatively compare air pollution in some I-CHANGE LLs: Bologna, Barcelona, Dublin, Genoa and Ouagadougou. Apart from the intrinsic scientific interest of the comparison, the main aim was to create information for reflection and discussion among stakeholders.
To this purpose, the participating LLs installed several SCK, an easy-to-use and open-source environmental monitoring tool that includes different low-cost sensors for particulate matter (PM), carbon dioxide (CO2), noise levels and meteorological variables, among other indicators (Camprodon et al., 2019). Although the accuracy of this type of sensors is lower than that of official instruments, different studies have already demonstrated their usefulness and validity in citizen science experiments (Conrad and Hilchey, 2011; Brattich et al., 2020; Brett, 2022; Relvas et al., 2025). In addition, they provide information on areas far from official stations (usually several kilometers apart) that would otherwise not be well represented due to the high cost of extending the official networks (Kumar et al., 2015; Clements et al., 2017). Despite their limitations, these sensors enable widespread community participation in air quality monitoring, raising public awareness and providing valuable data for scientific research and policymaking (Watne et al., 2021; Mahajan et al., 2022).
Figure 2 summarizes the steps of the field campaign 1 with three main phases: before, during and after the completion of the data campaign. The complete activity protocol and materials can be found in Supplementary Protocol S1. The SCKs (Camprodon et al., 2019) were distributed among the selected volunteers from each LL after evaluating the possible installation sites that each one could offer. They were installed following the recommendation guidelines (Supplementary Protocol S1). Figure 3 shows two SCKs installed in schools in Barcelona, as an example of the installation.
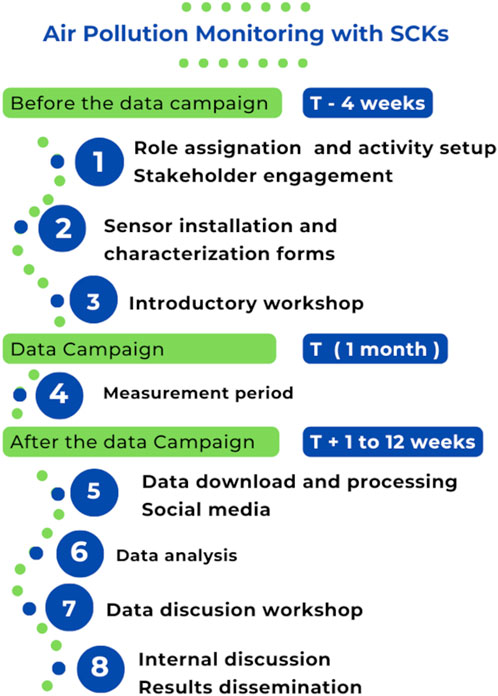
Figure 2. Implementation steps of Activity 1. Methodology followed for the ‘Air pollution monitoring with SCK’ campaign.
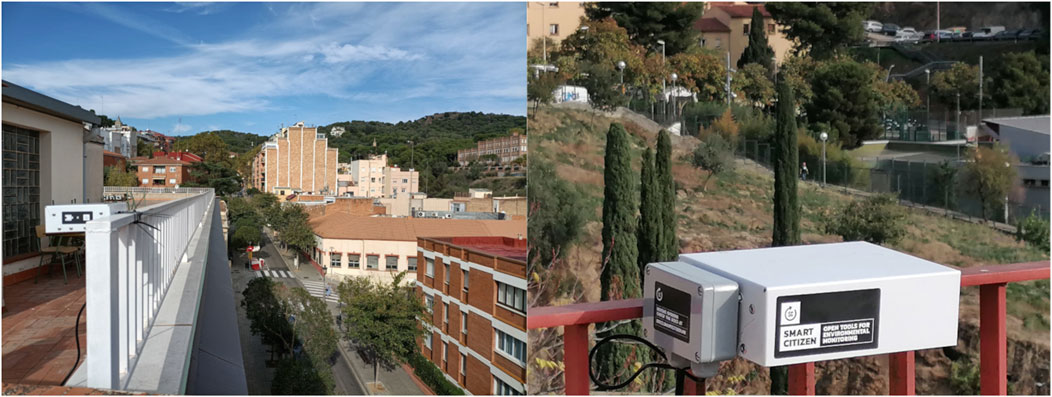
Figure 3. Example of Smart Citizen Kit locations. SCK low-cost air quality sensor installed on the rooftop of one of the engaged schools that have participated in the BALL activities (Col·legi Kotska, Barcelona).
The stakeholder engagement phase took place before the measuring period, building on the contact networks of each LL through stakeholder mapping and network-based recruitment. This stage included the role definition of participants and activity setup, combined with sensor installation and the completion of the characterization forms. These participatory preparations paved the way for the actual data campaign, which subsequently consisted of a set of activities for data analysis and results dissemination. Then the volunteer participants were asked to answer the I-CHANGE activity assessment survey, based on Com-B Model (Michie et al., 2011). This survey was the tool applied in the project to assess the impact of the activities. In addition, they also completed the sensor characterization forms (Supplementary Protocol S1 – Figure 1) and were informed about the details of the I-CHANGE project and the air pollution monitoring campaign. All procedures were supervised and assisted by the LLs staff. The measurement campaign spanned 1 month from around 5 June, i.e., 22 May to 19 June 2024. During this period, sensors collected 5-min resolution data for particulate matter CO2 concentrations and meteorological variables (air temperature, barometric pressure and relative humidity). PM concentrations were measured by a Plantower PMS5003 sensor, which categorized by size into coarse, fine and ultrafine particles (PM10, PM2.5, PM1 with diameters d ≤ 10 um, 2.5 um and 1.0 um, respectively). CO2 concentration was measured by a Sensirion SCD30 sensor and meteorological variables with Sensirion SHT-31 and NXP MPL3115A26. More information about the sensors included in the SCKs is detailed by Camprodon et al. (2019). Since the comparison between different seasons was limited to only 1 week, only basic statistical measures were calculated, such as the mean, median, and percentile distribution.
After the campaign, data was processed and graphically represented in form of time series and boxplots for a preliminary discussion with the stakeholders. Data analysis for field campaign 1 was conducted by computing daily and hourly averages for the available station data sets and representing them to better show the variations to the participants. Additional statistical analyses were performed to assess the correlation between time series measured at different stations within each LL with the objective of providing a robust and consistent justification for the observed differences. Spearman correlation and the non-parametric (Wilcoxon, 1945) signed-rank test were applied to the data.
2.2.2 Temperature variability across different urban environments and their perception (MTs)
This second activity was conducted during 5 June 2024 in the LLs of Amsterdam, Bologna, Barcelona, Dublin, Genoa, Hasselt and Jerusalem. Its objective was to compare actual and perceived temperatures in public spaces with previous expectations, and to analyze these perceptions with participants, considering the social functions and uses of these spaces.
The selected sensor for the activity was a MeteoTracker (MT), an innovative mini-weather station designed to measure meteorological variables on the move (Barbano et al., 2024; Loglisci et al., 2024). Participants collected mobile data by foot or bike and combined it with subjective perceptions to analyze heat distribution within cities. Although it is a low-cost sensor and has some accuracy limitations, previous studies have proven its usefulness for measuring temperature variations in urban environments with high spatial resolution (Rajagopalan et al., 2020; Clement et al., 2023; Barbano et al., 2024). Furthermore, the integration of local mobility and fine-scale sensors has been shown to provide insights into intra-urban temperature variability and the influence of urban morphology (Cabrera et al., 2021; Colangelo et al., 2022).
Figure 4 summarizes the steps of field campaign 2, which consisted of a brief introduction to the participants, co-design of a route with selected stops in relevant (for them) local places and the completion of the temperature and humidity expectations form, and MT setup, leading then to the actual data collection and, finally, time for discussion. Each LL tailored the protocol activity to their local contexts. Some LLs included additional activities such as measuring the carbon footprint (Hasselt) or a Bioblitz (Bologna) or the use of other devices such as a thermal camera (Amsterdam).
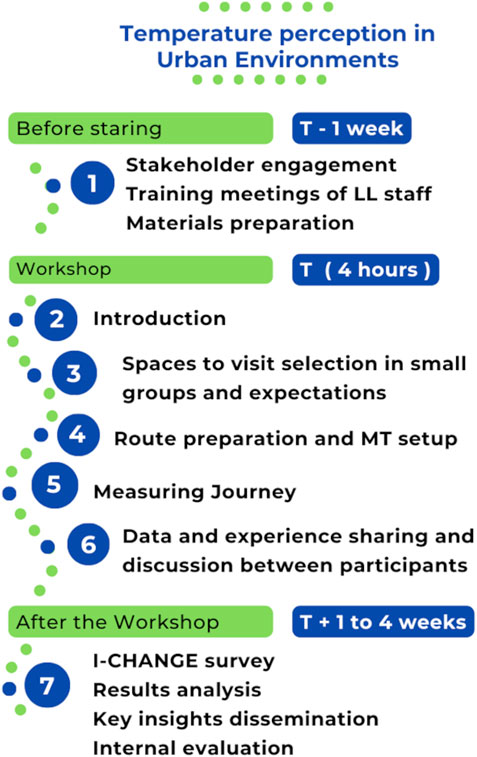
Figure 4. Implementation steps of Activity 2. Methodology and steps followed for the ‘Temperature perception in urban environments’ activity. Supplementary Protocol S2 – Table 2 details more information about its duration and the timeline for its implementation.
Before starting, it was necessary to select the location where the activity would be held, the social entity that would facilitate the meeting (civic center, library, botanic garden, etc.) and the level of involvement of stakeholders, in addition to preparing the materials that would be used. The engagement process consisted of publicity with posters, social networks, phone calls and emailing in collaboration with the stakeholders. The ethical aspects were considered following the I-CHANGE protocols (Abernethy et al., 2022; EU-PEARL, 2022; Mölter and Tjelle Holm, 2022). All data were anonymized through names specially created for the activity.
The activity was conducted as a workshop. After a presentation about the I-CHANGE project and the objectives of the activity, the participants reflected and selected the most relevant places for their everyday life on a map of the surrounding area. Divided into small groups, participants decided on the spaces to visit, classified them according to the categories corresponding to their social uses and individually filled the provided individual form with the expected temperature and relative humidity though a qualitative scale (Table 1). The participants prepared the routes and used the setup guide to configure the MT before starting the measuring journey. At each selected location, the participants added their in-situ temperature perception and the corresponding sensor measurement on the individual form and took a photograph. Back at the meeting point, a preliminary data analysis was conducted showing the online MeteoTracker platform (Meteo Tracker, 2025) and sharing the different individual forms. To conclude, each participant shared one evidence learned, one concern, one good practice in case of extreme temperatures and one proposal for improvement. Finally, the quantitative (sensor) and qualitative (perceptions, reflections) information were collected by each LL team and shared with the rest of the LLs. The details of the activity protocol and materials are described in the Supplementary Protocol S2.
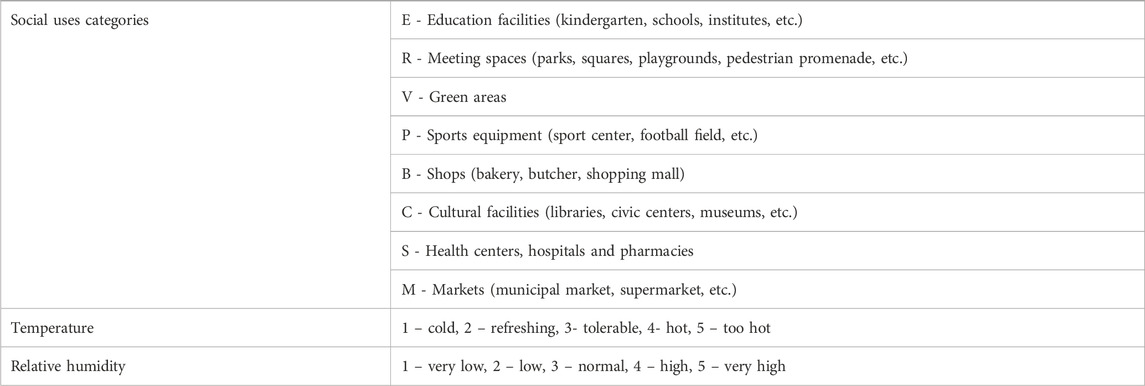
Table 1. Public spaces classification and temperature and relative humidity scales. Information provided to the participants regarding the classification of the public spaces uses and the perception scales with scores to express temperature and relative humidity.
After the workshop the participants completed the I-CHANGE survey. Data collected and results were analyzed thoroughly, and an inter-LL feedback meeting was organized for internal evaluation of the activity. A summary report with the final results was also prepared. The key insights were shared with all the stakeholders and disseminated through I-CHANGE social platforms and LLs communication networks (email listings, newsletters and social media), as described above in Section 2.2.
The individual forms provided observations about participants’ expectations on temperature and humidity, based on the perception scales described in Table 1, participant’s in-situ temperature feeling using the same scale and the in-situ temperature and relative humidity measurements obtained with the MT. In addition, those forms also contain information on age and gender of the participants and the space categorization with social uses. Descriptive statistics (mean, median, standard deviation, and interquartile ranges) were applied to summarize expectations and perception responses (scale 1–5) for temperature and humidity data. Data preprocessing included the removal of incomplete responses and the aggregation of records by Living Lab and space category. Individual perception responses were numerically coded and linked to the corresponding measured temperature and relative humidity values. Bar plots, scatterplots, and heat maps were generated to visualize distribution patterns across different LLs or space categories. A frequency analysis was conducted to compare temperature perception responses by age group, gender and space category. The analysis was performed in Python (version 3.11) using Pandas, Matplotlib, Seaborn, and NumPy within a Jupyter Notebook environment to ensure reproducibility and transparency of the workflow. The assessment of the activity impacts was also carried out through the I-CHANGE survey (Mezzacapo et al., 2025) and the feedback provided by the participants.
3 Implementation of the citizen science campaigns
The initiative engaged 219 participants (52 in Spain, 8 in Burkina Faso, 60 in Italy, 47 in Israel, 23 in Belgium, 19 in Ireland, 10 in Netherlands), deployed more than 22 MTs and led to the installation of 20 SCKs across five Living Labs (Table 2).
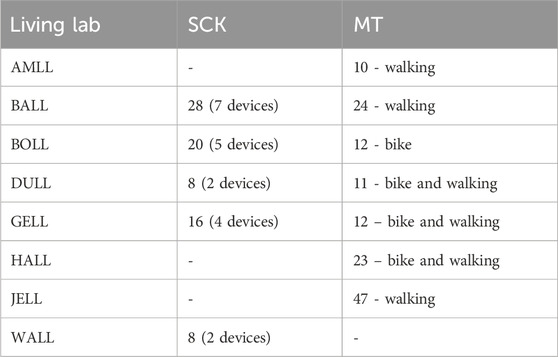
Table 2. Overview of number of participants and instruments employed in the ICD.
The synoptic situation from National Oceanic and Atmospheric Administration reanalysis (NCEP) for 5 June 2024 indicates a broad ridge at 500 hPa extending over southern Europe and the Mediterranean, associated with warm air masses, while colder air dominated northern Europe under a pronounced meridional gradient (Figure 5A). This configuration implies a southwesterly mid-level flow over Spain, enhancing upward motion locally. At the surface, a strong Atlantic high pushed a cold front through northern Europe, favoring cloudiness and unsettled weather over the Netherlands, Belgium and Ireland. Also, at surface level, an anticyclone centered over the Mediterranean favored sunny and dry conditions across southwestern regions (Italy and Israel) while a low over the Spain contributed to localized instability. For Burkina Faso, the reanalysis shows a warm air mass at 500 hPa associated with a thermal low at the surface, indicating hot and dry daytime conditions, possibly accompanied by localized instability. The corrected reflectivity satellite image (Visible Infrared Imaging Radiometer Suite) displays cloud cover and estimated daily rainfall (Figure 5B), reinforcing the presence of clear skies over the Mediterranean LLs (BALL, BOLL, GELL, and JELL), with some cloudiness observed over the northern LLs (AMLL, DULL, HALL) and WALL, as well as potential rainfall in the WALL and DULL regions.
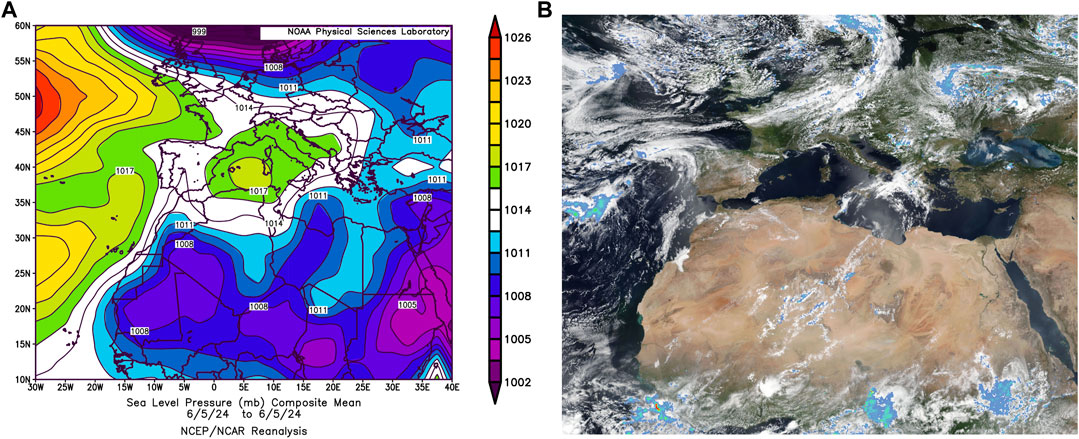
Figure 5. Synoptic situation during 5 June 2024. (A) Sea Level Pressure daily mean from NCEP-NCAR Reanalysis (source: NOAA Physical Sciences Laboratory, Boulder Colorado, https://psl.noaa.gov/). (B) Visible Infrared Imaging Radiometer Suite (VIIRS) Corrected Reflectance imagery (NASA/NOAA Suomi National Polar orbiting Partnership satellite) satellite image with the surface daily precipitation (AMSR2). Source: NASA Worldview application, https://worldview.earthdata.nasa.gov, part of the NASA Earth Science Data and Information System (ESDIS).
According to the weather records from official data available on Weather Spark website1, the LLs located in Southern Europe registered moderate atmospheric temperatures. Barcelona recorded a warm day with 2-m air temperatures between 20 °C and 24 °C under mostly sunny skies with noticeable wind, while Genoa experienced slightly milder temperatures (21 °C–22 °C) with partial cloud cover. Bologna, further inland, was warmer at 26 °C with clear skies and a minimum temperature of 17 °C. In contrast, northern European cities had significantly cooler conditions; Dublin saw a maximum temperature of 13 °C and a minimum of 7 °C with cloudy skies and light rain, while Amsterdam and Hasselt reported similar mild temperatures of 15 °C and 16 °C, respectively, with little to no precipitation. Meanwhile, Jerusalem experienced a warm and dry day, with temperatures reaching 32 °C and a nighttime minimum of 24 °C under clear skies. Ouagadougou weather conditions showed a temperature between 26 °C and 37 °C and mostly clear skies.
3.1 Air pollution monitoring with smart citizen kits (SCKs)
The low-cost sensors were installed following the co-design process, and the spatial distribution was strongly influenced by the interests and background of the participating stakeholders, as well as the technical requirements of the SCKs. Therefore, results were strongly influenced by the spatial distribution (Figure 6) and the particular environmental conditions during the limited period of study. Although a total of 20 SCKs participated in this campaign, only 10 (two per LL), are presented here.
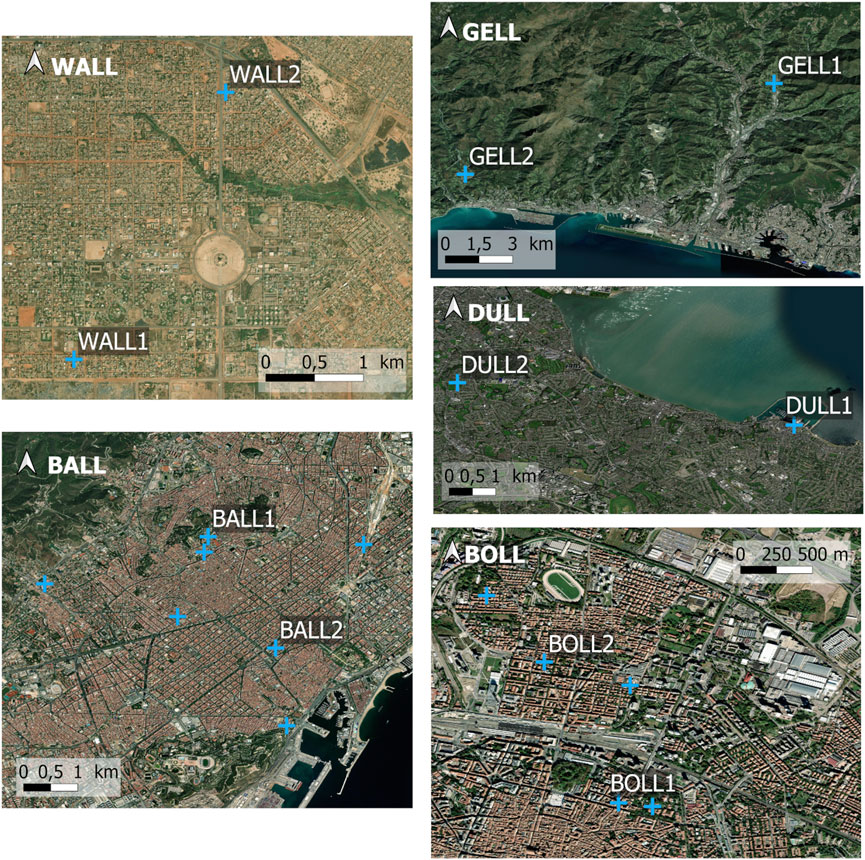
Figure 6. SCK spatial distribution. Location of the SCK sensors in each LL (blue crosses) over an ESRI satellite base layer. The sensors selected for the comparison are the ones indicated with a text label (LL name + sensor number).
A detailed scientific analysis of the air pollution measurement campaign is beyond the scope of this article; however, some interesting results that reinforce the importance of the citizen’s involvement and local characteristics have been highlighted. Figure 7 shows the evolution of PM2.5 concentration in the atmosphere between 4 June at 00 UTC and 6 June at 24 UTC, in the different LLs.
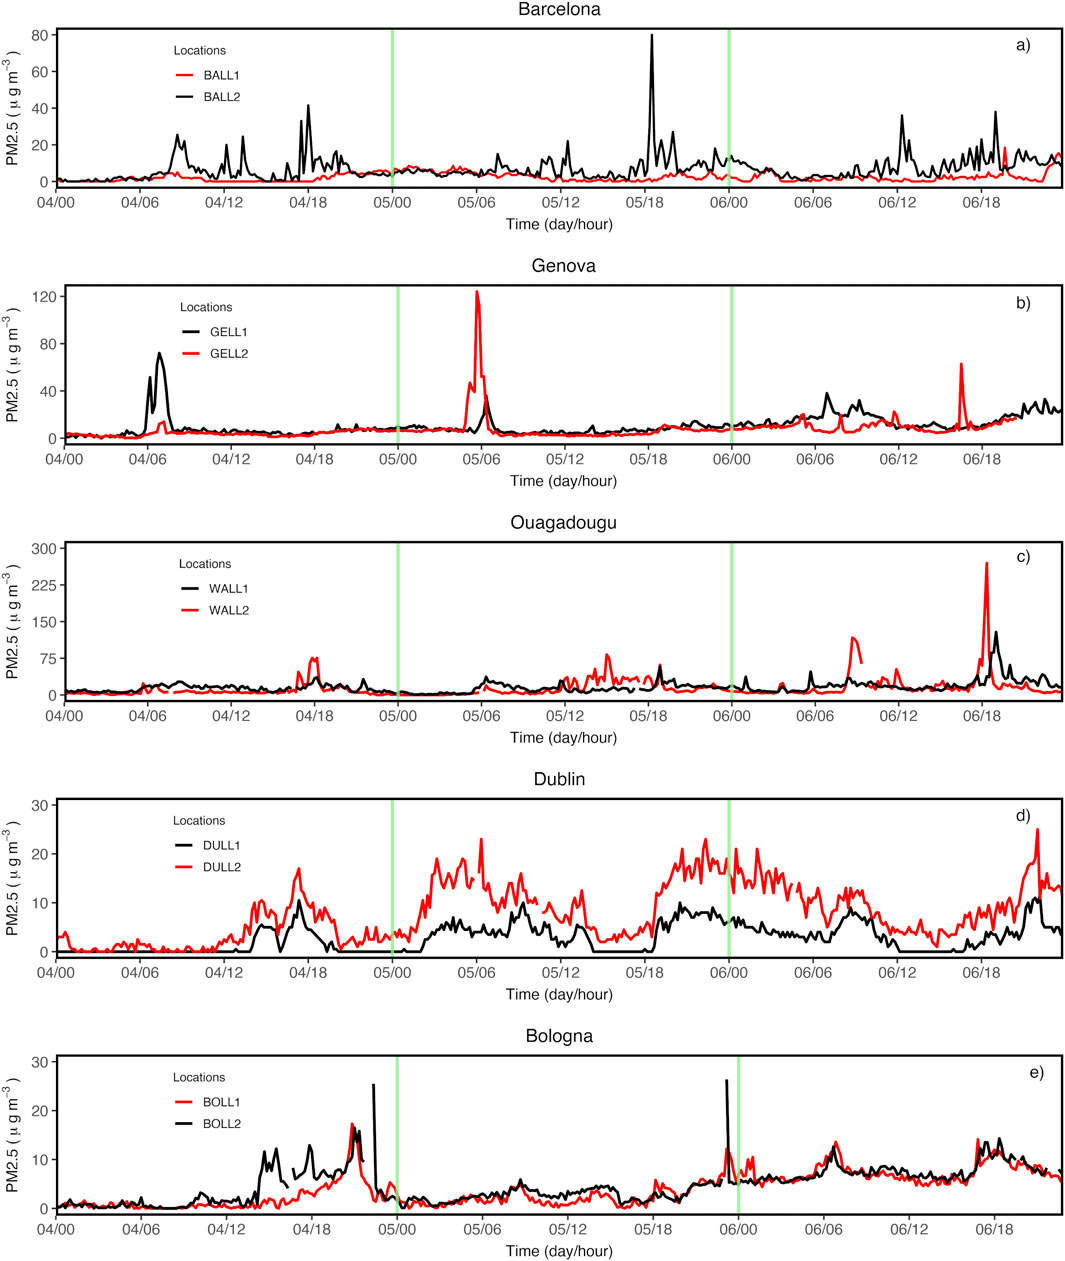
Figure 7. Observed atmospheric PM2.5 concentrations in 4–6 June 2024 period in five Living Labs in the I-CHANGE project. Data is presented with 10-min resolution for two stations of each LL. Vertical green lines separate the 3 days. The y-axis of each panel is adjusted to the observed values.
PM2.5 concentrations showed large spatial and temporal variability among the LLs during the ICD and the days before and after due to different meteorological and morphological factors at each LL. Two locations in Barcelona clearly exemplify the differences, as BALL2 recorded higher values (median 5.0 μg/m3, range 0.0–80 μg/m3), as it was located on a city center street with high traffic density, especially during rush hours. On the other hand, although BALL1 was located close to a touristic green area (park), the limited access of private cars and the larger distance to the street diminished PM2.5 concentrations (median 1.5 μg/m3, range 0.0–18.5 μg/m3). The lower limit of the range reflects the lack of sensitivity of the PMS5003 sensor for very low values, in agreement with Brattich et al. (2020). Similar differences were observed in Dublin, though without reaching such high peak values as those observed in BALL. DULL1 was installed near the Irish Sea and recorded lower values (median 2.5 μg/m3, range 0.0–11.5 μg/m3) than DULL2, which was inland in a suburban area (median 7.0 μg/m3 range 0.0–25.9 μg/m3). The highest values were recorded in Ouagadougou (median 7.0 μg/m3, range 0.0–269.5 μg/m3 in WALL1 and median 14.0 μg/m3, range 0.5–128.5 μg/m3 in WALL2), probably related to drier conditions combined with occasionally local surface-level instability and traffic, which can raise the dust due to the unpaved roads, allowing the resuspension of dust particles (Nana et al., 2012). These conditions are typical of the dry pre-monsoon phase in the region (Bou Karam et al., 2009). Locations in Bologna showed similar median values (median 3.1 μg/m3, range 0.0–17.3 μg/m3 for BOLL1 and median 4.4 μg/m3, range 0.0–171.0 μg/m3 for BOLL2), with large temporal variability, in some cases including quick and short increases in PM2.5 concentrations due to local factors for reasons that have yet to be carefully analyzed. Finally, peaks observed in Genoa could be related to road traffic jams affecting differently the two locations (median 8.0 μg/m3, range 0.0–72.0 μg/m3 for BOLL1 and median 5.6 μg/m3, range 0.0–124.1 μg/m3 for BOLL2).
The Spearman correlation between time series varies depending on the LL considered. For example, the BALL and WALL stations exhibit low to moderate correlations (ρ < 0.55), reflecting a weak relationship in the variation pattern between both stations. This suggests that local conditions have stronger influence than synoptic meteorological conditions or common daily traffic patterns. In contrast, other station pairs show higher correlations (ρ > 0.75), reflecting that they share common temporal dynamics, possibly driven by regional meteorological conditions or daily traffic patterns. Nevertheless, in all cases, the two stations at each LL show statistically significant differences in their median PM2.5 concentration over the three-day period, as determined by the Wilcoxon signed-rank test. This result arises the role of local factors that differentiate each particular station, such as proximity to emission sources (e.g., high traffic roads, green parks).
These results highlight the need to capture local differences using high density measurement networks, which can be achieved through public implication in citizen science projects.
In addition to PM concentrations, most of the SCKs included a photochemical sensor to determine CO2 concentration (Figure 8). From 4 to 6 of June, the registered values ranged between 390 and 465 ppm, which allows participants to compare with the values of global background reference stations, such as Mauna Loa (Hawaii). Local factors also emerged, and it can be clearly observed how the highest values were recorded at the Cima Castagna station (GELL2) which is located close to a large forest.
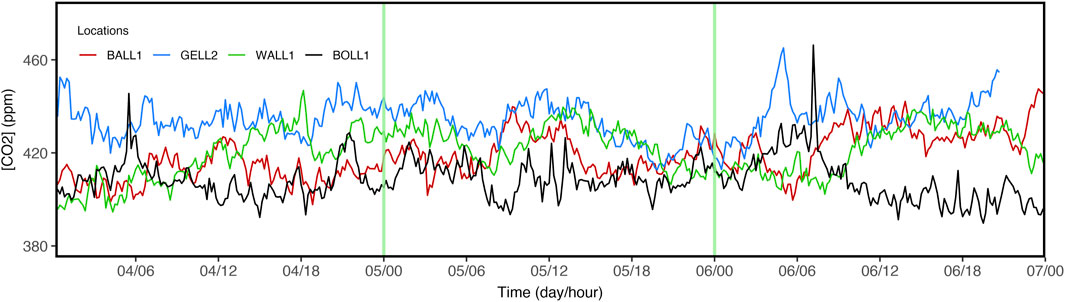
Figure 8. Observed atmospheric CO2 concentration variation from the 4–6 June 2024 in four I-CHANGE Living Labs. Data is presented with 10-min resolution for one station of BALL, WALL, GELL and BOLL. Vertical green lines separate the 3 days.
3.2 Temperature variability across different urban environments and their perception (MTs)
The activity was organized in collaboration between the research institutions of each LL and local stakeholders: a bike library, civic or scientific associations, or other public or private entities (e.g., a botanical garden). The work and meeting points took place in research centers, civic centers, the city center or recreative spaces (e.g., a pub). Participants were organized into groups to perform co-designed tours, either on foot (in 6 LLs) or by bicycle (in 4 LLs) with one or two MTs per group. Table 3 summarizes implementation details of the activity in each LL, including the stakeholders involved, the time and location of the activity, the number of participants, and the types and lengths of the routes chosen for taking measurements (walking or biking routes).
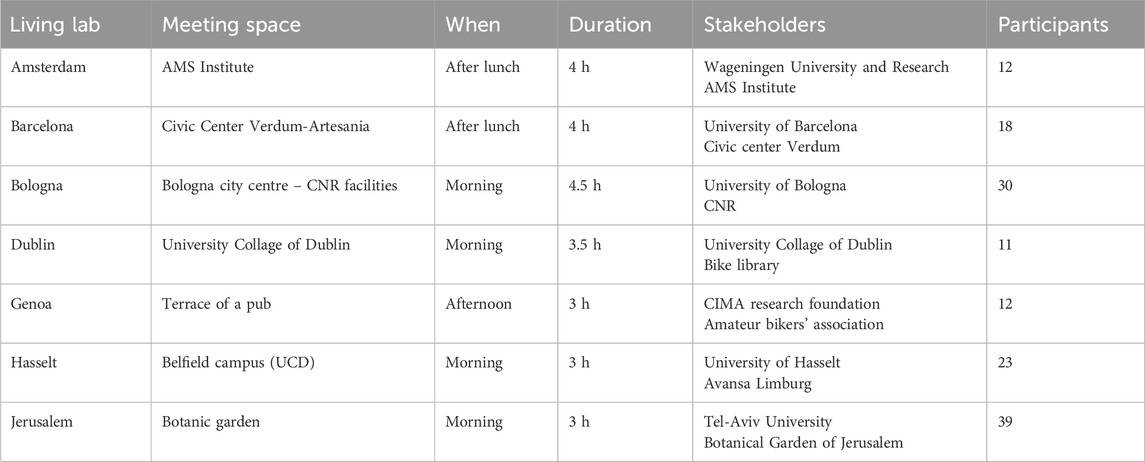
Table 3. Implementation details of the Temperature Perception in Urban Environments activity in each LL.
A total of 126 citizens participated (65% female, 26% male and 2% non-binary). Classifying the participants by age group, 19% ranged between 18 and 30, 33% were in the range from 30 to 50 years old and 47% were over 51 years. Data from the two younger groups reflects that more than 50% were students or workers related to the research centers (mostly engaged in AMLL, DULL and GELL). The majority of the participants were citizens without previous experience in the LL, with some exceptions in Genoa and Dublin. In all cases, one stakeholder connected citizens with the promoters of the activity in the LL.
The MT offered a very appealing and high-resolution way to measure atmospheric conditions near surface, but some technical barriers related to the individual configuration of the MT sensors complicated the activity process and, also, the citizen worries about the data quality and precision. In general, the participants found this activity engaging, as it not only allowed them to better know their neighborhood, but also to gain a different, scientific perspective. It was also an activity in which they had the possibility to interact with other people and share their experience, feeling a real, concrete contribution and personal participation to scientific research.
The meteorological data obtained with the MT sensors during the measuring routes is summarized in Table 4, while Figures 9, 10 show the different measuring points at the stops chosen by the participants, classified according to the space categories in Table 1. From all the routes in the LLs, 177 observations from the individual forms were obtained, 31% corresponding to meeting spaces (R), 21% to educational facilities (E), 20% to green areas (V), 8% to both health centers (S) and sports equipment (P), 5% to both cultural facilities (C) and markets and 2% to shops (B).
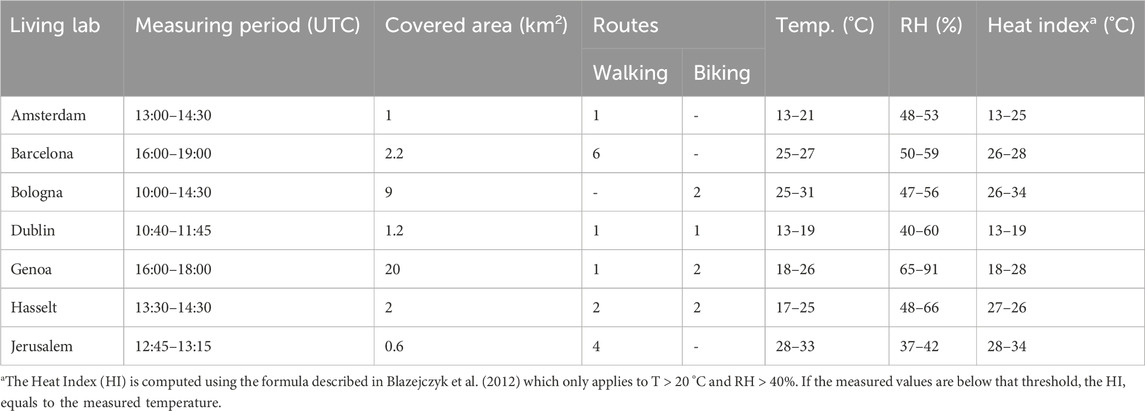
Table 4. Summary of the main meteorological observations of temperature perception activity.
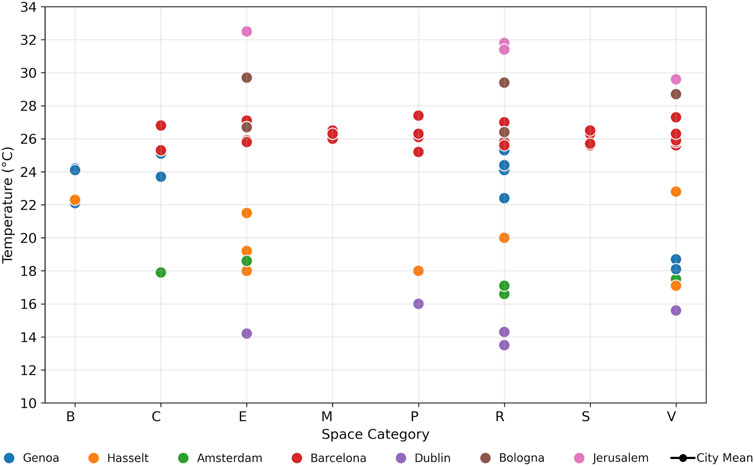
Figure 9. Temperatures registered with the MT. They are grouped by the space category of the visited spot (x-axis) in the different LLs (represented by different colors).
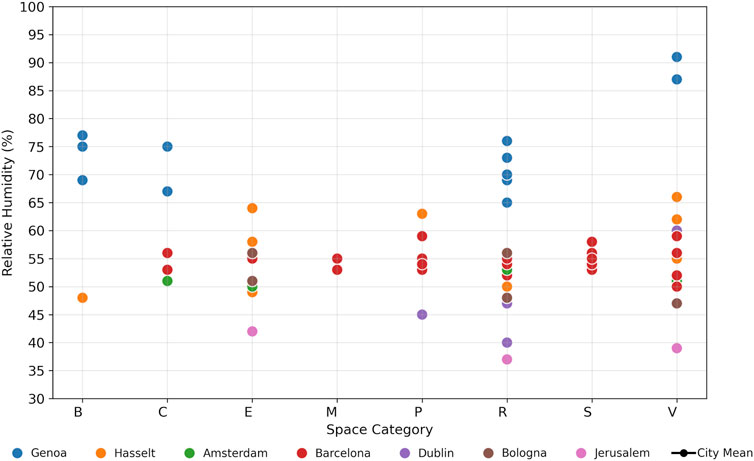
Figure 10. Relative Humidity registered with MT. The same as in Figure 9 but for the relative humidity registered by the MT.
As shown in Figure 9, the atmospheric temperatures measured by LL and space category highlight notable patterns across the different LLs. In Barcelona and Bologna, the mean temperatures across space categories showed minimal variation, less than 2 °C, whereas in Hasselt, Genoa, and Jerusalem, temperature differences between categories were more pronounced. Relative Humidity (RH) data (Figure 10) further indicates that the influence of space category on RH varies by city. Genoa, Hasselt, and Jerusalem exhibited the widest range of RH values across space categories, while RH remained relatively stable between spaces in Barcelona, Bologna, and Amsterdam.
The data regarding expectations from participants for temperature and humidity across different urban spaces (reported before the meteorological data collection) revealed relatively moderate expectations across the seven cities where the experiment was conducted.
The experiment showed median values that ranged between 3 (tolerable temperature/normal RH) and 4 (hot temperature/high RH) for both expected temperature and humidity. Temperature expectations for market spaces were higher than those for other categories. Green areas, health centers, education facilities, meeting spaces, and sports equipment showed a wide variability in temperature expectation scores.
Table 5 presents, for each LL, the average temperature and humidity measured by participants at the visited sites, categorized according to the perceived temperature scale. For each perception level (1–5), the mean temperature was calculated using all measurements from locations where participants reported that specific value. Although all LLs used the same categories, the associated temperature records present notable divergences among cities (LLs). Bologna has the highest temperature values across all levels, and Dublin the lowest. None of the participants rated their thermal sensation in any of the spaces as ‘Cold’, as could be expected considering the season. In both Dublin and Hasselt, all reported sensations fall into ‘Refreshing’ and ‘Tolerable’ categories. A correspondence between thermal sensations and recorded temperatures can be observed, except in the case of Barcelona, where the temperature differences across perception levels are minimal as regards the humidity.
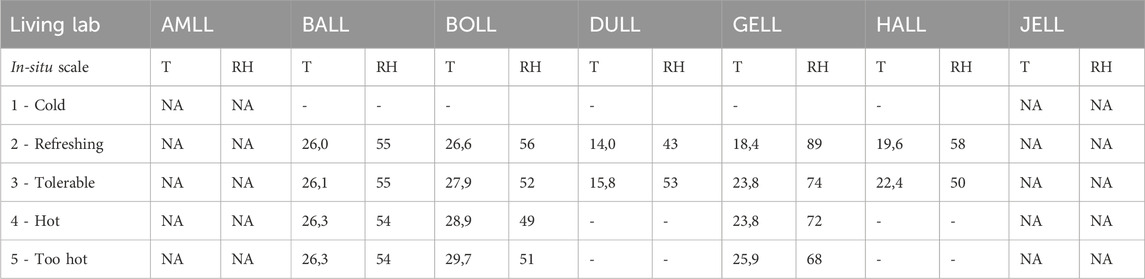
Table 5. Mean Temperature (T, °C) and RH (%) values obtained with the MT in each.
To compare differences between the expected temperature feeling and the temperature sensation in-situ, the numeric difference between paired ratings from the temperature scale (Table 1) is calculated. A response is defined as ‘warmer or cooler than expected’ when there is a one-point difference between the expected and in-situ temperature perception scores, and as ‘much warmer or much cooler than expected’ when the difference is two points. Only on a few occasions (6% of the total 177 observations), participants felt much warmer than expected in the spaces visited. Approximately 40% of observations were perceived as expected (no difference between the indices). When analyzing the results by gender, the percentage of observations perceived as expected rises to 50% for men (sample of 48 observations) and decreases to 34% for women (sample of 124 observations). Analyzing by age groups (18–30, 31–50, and >50 years), among the 18–30 age group, opinions are very heterogeneous, with more than 50% of observations (sample of 30) indicating that a perception of lower temperature than the actual one predominated, regardless of the type of place. In contrast, among the 31–50 age group (sample of 84 observations), nearly half of the participants perceived the temperature category as expected.
Considering the observations across all LLs (Figure 11) by space category, several patterns emerge. In market spaces (M), 67% of respondents reported feeling much cooler than expected. Cultural facilities (C) also exhibited a significant number of responses falling into the much cooler category (38%). Areas with shops (B) stood out, with 50% of respondents feeling warmer and an additional 25% feeling much warmer than anticipated. Green areas and meeting spaces were the most repeated space classification and also showed the highest variability. For green areas, 36% of participants felt cooler, 6% much cooler, 25% the same, 28% warmer and 6% much warmer. Educational (E) and Health related (S) spaces demonstrated a strong alignment with temperature expectations, with over half of respondents reporting that they felt the same as expected (54% and 53%, respectively).
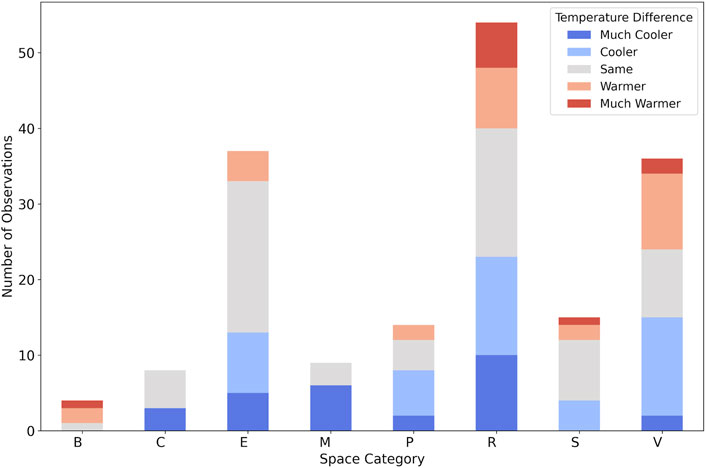
Figure 11. Recorded Citizens’ Temperature expectation vs. in-situ observations. Temperature comparison between expectations and in-situ feeling for the different spaces categories. Blue colors express a cooler sensation than expected (negative numbers) while red colors express a hotter feeling than expected.
The heatmap of Figure 12 illustrates these differences across cities and space categories, calculating the mean difference in temperature perception scores from all the observations in each city and space category, allowing a detailed understanding of the complex relationships between environmental factors and personal expectations across different settings. Participants generally exhibited lower-than-expected comfort levels in outdoor spaces across most cities (red colors in Figure 12), with particularly negative discrepancies in cities such as Dublin, Barcelona, and Bologna. This suggests that residents of these cities are typically exposed to more pronounced thermal discomfort than what was experienced on the specific survey day. In contrast, Genoa displayed a slight divergence, where participants felt cooler than they had anticipated. Notably, green areas in Dublin stood out, as participants reported feeling significantly warmer than expected. Similarly, thermal comfort in sports equipment exceeded expectations, with participants feeling more comfortable than anticipated. These results highlighted that places where people typically spend time standing or queuing, such as at a bus stop or in a zoo, tend to be imagined warmer than they actually feel. On the contrary, the general association with green areas is positive, and in some cases, people remember the place more refreshing than it feels. Areas near water bodies and parks were perceived as cooler, despite only minor variations in recorded temperatures. Participants expressed concern about certain urban environments in the context of high temperatures. These include wide streets, full paved squares, areas without vegetation, and places where people are required to wait for some time, such as bus stops. Urban playgrounds also emerged as a significant source of concern, as they are often perceived as poorly adapted to extreme heat conditions. Beyond increasing green areas, there is a clear need to review the materials used, and to incorporate more shading elements. Tactical urbanism strategies can also contribute to improving thermal comfort sensation. In this sense, implementing measures that enhance the perception of these spaces can help make daily activities more comfortable and safer, in the other hand water and vegetation may enhance thermal comfort through psychological mechanisms, beyond their physical cooling impact (Oliveira et al., 2014; Klemm et al., 2015).
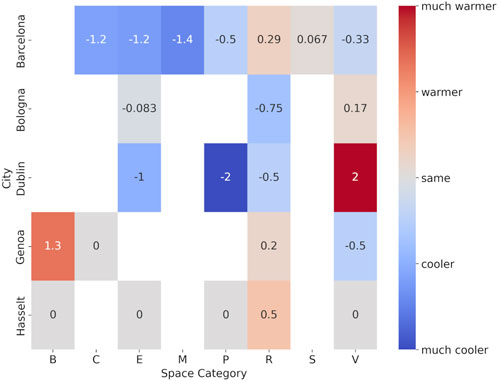
Figure 12. Temperature expectation vs. in-situ by LL. Heat map showing the differences between temperature scores for expectation versus in-situ feeling. The color scale is the same as in Figure 11.
4 Discussion
The ICD initiative demonstrated the potential of citizen science to generate valuable environmental data while fostering public engagement in climate change issues across diverse contexts in Europe, the Middle East, and Africa. The simultaneous implementation across eight Living Labs (LLs) facilitated a comparative analysis of environmental perceptions behaviors and brough a new approach on participatory environmental monitoring.
Citizen-collected data on air quality and temperature perception yielded significant spatial variability, highlighting the heterogeneity of urban microclimates and confirming the capacity of low-cost sensors (PM and CO2) in detecting local air pollution differences, in agreement with previous studies (Snyder et al., 2013; Castell et al., 2017). For example, differences in PM2.5 levels between sensors in central and peripheral Barcelona or coastal and inland Dublin aligned with local urban morphology and traffic density.
The Temperature Perception in Urban Environments activity revealed the complexity of comparing objective microclimatic conditions and subjective comfort levels. The MT data confirmed the heterogeneity of meteorological conditions in the different LLs, obtaining very different temperature and humidity ranges across different measuring points with higher variability within Dublin, Hasselt and Genova but very stable conditions in Barcelona and Bologna. While average temperature and humidity expectations ranged from tolerable (3) to hot (4), individual perceptions varied notably even under similar conditions. This suggests that thermal perception is influenced not only by meteorological parameters but also by spatial features such as vegetation, shade, pavement type, and the social use of spaces (Oliveira et al., 2014; Klemm et al., 2015). The characterization of spaces based on their social use revealed significant heterogeneities, highlighting the importance of urban morphology and spatial organization. These activities also provided a platform to explore the interplay between expectation and experience, particularly in vulnerable urban spaces like markets, playgrounds, and bus stops. Across all Living Labs, the social categories with more observations (green areas and meeting spaces) showed the wider spreads with approximately 25% of the participants expressing to have felt as expected, and a slightly higher percentages of cooler or much cooler than expected than for warmer or much warmer. Those results were highly influenced by the lower than usual temperatures in some cities (e.g., Barcelona) where participants are used to higher thermal stress and that fact influenced their expectations. Certain space categories were perceived exclusively as expected and cooler (such as cultural facilities, educational spaces, markets, and sports facilities), or as expected and hotter (shop areas). Notably, green areas in Dublin stood out for being perceived as much hotter than expected, highlighting their critical role in climate adaptation planning. Moreover, gender and age influenced thermal perception, reinforcing the need for inclusive, demographically aware planning approaches (van Hoof et al., 2021).
While the current findings offer valuable initial insights, drawing robust conclusions about the state of mitigation and adaptation in cities would require repeating the experiment across multiple occasions in the same locations, ideally involving consistent groups of participants. These findings underscore the value of integrating both psychological and spatial factors into urban heat adaptation strategies, particularly to protect vulnerable populations such as children and the elderly, emphasizing the critical need for well-designed environments around educational facilities, health centers, and social gathering areas to ensure thermal safety during periods of extreme heat (WHO Team et al., 2016; IPCC, 2022).
In addition to the sensor-based evidence, the initiative also contributed to raising environmental awareness and promoting climate action. The LLs included participatory spaces during the activities that fostered reflection and individual commitment. For example, in MT experiment (field campaign 2) the final reflective practice session invited participants to summarize the activity by formulating ‘evidence’, a ‘concern’, a ‘proposal for neighborhood improvement’, and a ‘personal behavior change’. These qualitative exercises were not systematically collected across all sites, since discussions took place in local languages and were difficult to compare due to the different geographical and socio-cultural contexts, but they proved effective in stimulating awareness and discussion at the local level. Similarly, in BALL more than 700 school students participated during the I-Change Day in a campaign associated with the deployment of SCK devices (field campaign 1), submitting anonymous proposals for individual actions to improve climate change mitigation. The most frequent suggestions highlighted classic sustainability measures such as increased use of public transport, recycling, and reducing electricity and water consumption, while newer proposals addressed dietary habits, shopping practices, and the role of digital technologies. Although not exhaustive of all LLs, these examples illustrate how citizen science activities can extend beyond data collection, engaging participants in critical reflection and supporting the emergence of behavioral change (Jordan et al., 2011; Frigerio et al., 2021; Khatibi et al., 2021).
Although participation levels varied across the Living Labs (LLs), these differences were largely due to the diversity of activities implemented, the specific requirements of each participant group (such as age, background, and digital literacy), and the adaptations made for each activity (e.g., whether participants undertook the route by bike or on foot). Additionally, the number of volunteers (LL staff) and the local context of each LL also played a role in determining the level of engagement. Engagement through local stakeholders was a key element of the project and was crucial to its overall success. In addition, several challenges emerged. Technical barriers, particularly related to sensor connectivity and calibration, limited data completeness and required sustained support from researchers. Future applications of the protocol should prioritize inclusive design, robust infrastructure, and co-creation with stakeholders to enhance both scientific output and community relevance.
These results illustrate the practical contributions of citizen science to local climate adaptation, particularly in revealing intra-urban environmental disparities and starting context-specific discussions about climate resilience. While previous works showed how citizen-collected data can complement official monitoring and add fine-scale variability (Sîrbu et al., 2015), this study extended this evidence by demonstrating the feasibility of conducting coordinated campaigns simultaneously across diverse urban context. The ability to link subjective perceptions with empirical environmental data proved essential in raising awareness and challenging existing assumptions. These findings are aligned with recent work emphasizing the role of citizen science in shaping awareness and adaptive responses (Danish et al., 2025). In this sense, ICD not only produced useful data but also activated local reflection processes that are critical for place-based climate policy development.
5 Conclusion
The ICD initiative implemented a methodology to address awareness, knowledge, and action through citizen science activities that tackled local environmental challenges, induced or exacerbated by climate change. This approach fostered meaningful citizen participation, where data collection not only supported learning, debate and reflection but also encouraged concrete actions.
The initiative confirmed that citizen involvement in data collection increases both environmental awareness and perceived empowerment in responding to climate threats. Citizens were not passive observers, but active interpreters of data, translating information into locally meaningful insights and proposed behavioral changes.
The use of mobile and fixed sensors revealed intra-urban differences in air quality and thermal comfort. Understanding these local variabilities is critical for designing effective adaptation strategies, that are sensitive to specific urban morphologies and social practices (Rajagopalan et al., 2020). Civic organizations and informal educational settings (schools, markets, associations) played a key role in recruiting participants from heterogenic demographics, sometimes less likely to engage in science. Complementary activities, such as workshops or local campaigns, extended the impact beyond the scientific goals of the initiative.
By combining sensor-based evidence with personal experiences and civic dialogue, the ICD proposed a methodology for carrying out citizen science activities, that is not only scientific and technically robust but also integrates social, cultural, and community contexts. This approach should guide future climate resilience strategies, particularly in urban contexts where behavioral change and infrastructure improvements must go hand in hand. Sustained investment in participatory data ecosystems and Living Lab models can thus contribute to more adaptive, inclusive, and responsive climate governance.
Data availability statement
The datasets presented in this study can be found in online repositories. The names of the repository/repositories and accession number(s) can be found below: I-CHANGE project dashboard (https://citizens4climate.com/map) MeteoTracker platform (https://app.meteotracker.com/) Smart Citizen Kit dashboard (https://smartcitizen.me/kits/).
Author contributions
LE: Writing – original draft, Methodology, Validation, Investigation, Data curation, Conceptualization, Formal Analysis, Visualization, Writing – review and editing. ML-B: Formal Analysis, Data curation, Methodology, Investigation, Writing – original draft, Conceptualization, Writing – review and editing. ML: Writing – original draft, Supervision, Writing – review and editing, Investigation, Methodology, Conceptualization. YS: Data curation, Writing – original draft, Investigation, Writing – review and editing, Methodology. NL: Conceptualization, Writing – original draft, Methodology, Writing – review and editing. EB: Project administration, Methodology, Writing – review and editing, Investigation. SR: Writing – review and editing, Methodology, Conceptualization. G-JS: Investigation, Writing – review and editing, Methodology. AM: Investigation, Writing – review and editing, Methodology. AG: Methodology, Investigation, Writing – review and editing. LP: Investigation, Methodology, Writing – review and editing. EP: Writing – review and editing, Investigation, Methodology. CC: Writing – review and editing, Investigation, Methodology. FB: Writing – review and editing, Investigation. MA: Investigation, Methodology, Writing – review and editing. LA: Writing – review and editing, Investigation. PA: Investigation, Writing – review and editing. GC: Investigation, Writing – review and editing. BT: Writing – review and editing, Investigation. SD: Project administration, Writing – review and editing, Supervision. AP: Writing – review and editing, Project administration, Supervision.
Funding
The author(s) declare that financial support was received for the research and/or publication of this article. This project, I-CHANGE (2022–2025) has received funding from the European Union’s Horizon 2020 research and innovation programme under grant agreement No 101037193.
Acknowledgments
This study was conducted as part of the I-CHANGE project (2022–2024, EC grant agreement 101037193). We thank all participants and institutions involved in the project and Living Labs for their contributions to data collection and analysis. We are very grateful to all the staff from the I-CHANGE Living Labs teams for their role in implementing the LL activities, and to Juan Quintero Marín (University College Dublin) for his contribution to this paper. We would also like to acknowledge the key role played by all stakeholders who engaged in the initiative and made the organization of the I-CHANGE Day possible: AMS Institute (Amsterdam, the Netherlands), Civic Centre Verdum (Ajuntament de Barcelona, Spain), Bike Library (Dublin, Ireland), Genoa Amateur Bikers’ Association (Genoa, Italy), the socio-cultural non-profit organization Avansa Limburg (Hasselt, Belgium), the Botanical Garden of Jerusalem (Jerusalem, Israel), the Paglayiri Market and Cité An Market (Ouagadougou, Burkina Faso), as well as Laura Ceraldi, Josep María Perelló, Marc Gasulla, Jordi Cherta, Carles Mesa, and Marcos Lloret from the Jesuïtes Educació Foundation.
Conflict of interest
The authors declare that the research was conducted in the absence of any commercial or financial relationships that could be construed as a potential conflict of interest.
The author(s) declared that they were an editorial board member of Frontiers, at the time of submission. This had no impact on the peer review process and the final decision.
Generative AI statement
The author(s) declare that Generative AI was used in the creation of this manuscript. Generative AI was used to assist in the linguistic refinement of certain sections of the manuscript. The authors verify and take full responsibility for all content, and confirm that the scientific concepts, data interpretation, and conclusions were developed entirely by the authors.
Any alternative text (alt text) provided alongside figures in this article has been generated by Frontiers with the support of artificial intelligence and reasonable efforts have been made to ensure accuracy, including review by the authors wherever possible. If you identify any issues, please contact us.
Publisher’s note
All claims expressed in this article are solely those of the authors and do not necessarily represent those of their affiliated organizations, or those of the publisher, the editors and the reviewers. Any product that may be evaluated in this article, or claim that may be made by its manufacturer, is not guaranteed or endorsed by the publisher.
Supplementary material
The Supplementary Material for this article can be found online at: https://www.frontiersin.org/articles/10.3389/fenvs.2025.1650360/full#supplementary-material
Footnotes
1https://weatherspark.com, last accessed 18/06/2025
References
Abernethy, P., Artell, J., Lambertini, L., Molter, A., Ommer, J., Parodi, A., et al. (2022). Citizen science in living labs for just transitions: guidelines to promote the engagement and awareness raising of citizens (I-CHANGE D1.2).
Barbano, F., Brattich, E., Cintolesi, C., Ghafoor Nizamani, A., Di Sabatino, S., Milelli, M., et al. (2024). Performance evaluation of MeteoTracker Mobile sensor for outdoor applications. Atmos. Meas. Tech. 17, 3255–3278. doi:10.5194/amt-17-3255-2024
Blazejczyk, K., Epstein, Y., Jendritzky, G., Staiger, H., and Tinz, B. (2012). Comparison of UTCI to selected thermal indices. Int. J. Biometeorol. 56, 515–535. doi:10.1007/s00484-011-0453-2
Bou Karam, D., Flamant, C., Tulet, P., Chaboureau, J., Dabas, A., and Todd, M. C. (2009). Estimate of Sahelian dust emissions in the intertropical discontinuity region of the west African monsoon. J. Geophys. Res. Atmos. 114, 13106. doi:10.1029/2008JD011444
Brattich, E., Bracci, A., Zappi, A., Morozzi, P., Sabatino, S. D., Porcù, F., et al. (2020). How to get the best from low-cost particulate Matter sensors: guidelines and practical recommendations. Sensors 20, 3073. doi:10.3390/S20113073
Brett, A. (2022). Information as power: democratizing environmental data. Utah Law Rev. 1. doi:10.26054/0d-1n1y-s8a0
Brink, E., and Wamsler, C. (2019). Citizen engagement in climate adaptation surveyed: the role of values, worldviews, gender and place. J. Clean. Prod. 209, 1342–1353. doi:10.1016/j.jclepro.2018.10.164
Bulkeley, H., Coenen, L., Frantzeskaki, N., Hartmann, C., Kronsell, A., Mai, L., et al. (2016). Urban living labs: governing urban sustainability transitions. Curr. Opin. Environ. Sustain 22, 13–17. doi:10.1016/J.COSUST.2017.02.003
Cabrera, A. N., Droste, A., Heusinkveld, B. G., and Steeneveld, G.-J. (2021). The potential of a smartphone as an urban weather station—an exploratory analysis. Front. Environ. Sci. 9, 673937. doi:10.3389/fenvs.2021.673937
Camprodon, G., González, Ó., Barberán, V., Pérez, M., Smári, V., de Heras, M. Á., et al. (2019). Smart citizen kit and station: an open environmental monitoring system for citizen participation and scientific experimentation. HardwareX 6, e00070. doi:10.1016/j.ohx.2019.e00070
Castell, N., Dauge, F. R., Schneider, P., Vogt, M., Lerner, U., Fishbain, B., et al. (2017). Can commercial low-cost sensor platforms contribute to air quality monitoring and exposure estimates? Environ. Int. 99, 293–302. doi:10.1016/j.envint.2016.12.007
Clement, A., Troxler, T., Keefe, O., Arcodia, M., Cruz, M., Hernandez, A., et al. (2023). Hyperlocal observations reveal persistent extreme urban heat in southeast Florida. J. Appl. Meteorol. Climatol. 62, 863–872. doi:10.1175/JAMC-D-22-0165.1
Clements, A. L., Griswold, W. G., Abhijit, R. S., Johnston, J. E., Herting, M. M., Thorson, J., et al. (2017). Low-cost air quality monitoring tools: from research to practice (A workshop summary). Sensors 17, 2478. doi:10.3390/S17112478
Colangelo, G., Sanesi, G., Mariani, L., Parisi, S. G., and Cola, G. (2022). A circulation weather type analysis of urban effects on daily thermal range for milan (italy). Atmos. (Basel) 13, 1529. doi:10.3390/atmos13091529
Collins, S. A., Sullivan, M., and Bray, H. J. (2022). Exploring scientists’ perceptions of citizen science for public engagement with science. J. Sci. Commun. 21, A01. doi:10.22323/2.21070201
Conrad, C. C., and Hilchey, K. G. (2011). A review of citizen science and community-based environmental monitoring: issues and opportunities. Environ. Monit. Assess. 176, 273–291. doi:10.1007/s10661-010-1582-5
Contandriopoulos, D., Lemire, M., Denis, J.-L., and Tremblay, É. (2010). Knowledge exchange processes in organizations and policy arenas: a narrative systematic review of the literature. Milbank Q. 88, 444–483. doi:10.1111/j.1468-0009.2010.00608.x
Danish, M., Labib, S., Ricker, B., and Helbich, M. (2025). A citizen science toolkit to collect human perceptions of urban environments using open street view images. Comput. Environ. Urban Syst. 116, 102207. doi:10.1016/J.COMPENVURBSYS.2024.102207
EU-PEARL (2022). Ethical guide (I-CHANGE D1.7). Available online at: https://eu-pearl.eu/d1-7-recommended-ethical-information-governance-and-security-policies-for-irps/.
European Commission (2015). Open innovation, open science, open to the world – a vision for Europe. Luxembourg: Publications Office of the European Union. Available online at: https://data.europa.eu/doi/10.2777/061652 (Accessed May 13, 2025).
Frigerio, D., Richter, A., Per, E., Pruse, B., and Vohland, K. (2021). “Citizen science in the natural sciences,” in The science of citizen science (Cham: Springer International Publishing), 79–96. doi:10.1007/978-3-030-58278-4_5
Hall, D. M., Avellaneda-Lopez, P. M., Ficklin, D. L., Knouft, J. H., and Lowry, C. (2024). Citizen silence: missed opportunities in citizen science. Bioscience 74, 319–321. doi:10.1093/biosci/biae020
Hecker, S., Bonney, R., Haklay, M., Hölker, F., Hofer, H., Goebel, C., et al. (2018). Innovation in citizen science – perspectives on science-policy advances. Citiz. Sci. 3, 4. doi:10.5334/cstp.114
IPCC (2021). in Climate change 2021 – the physical science basis. eds V. Masson-Delmotte, P. Zhai, A. Pirani, and et al (Cambridge University Press). doi:10.1017/9781009157896
IPCC (2022). in Climate change 2022 - mitigation of climate change. eds P. R. Shukla, J. Skea, R. Slade, A. Al Khourdajie, R. van Diemen, D. McCollum, and et al (Cambridge University Press). doi:10.1017/9781009157926
iSCAPE project team (2016). Improving the smart control of air pollution in Europe. doi:10.3030/689954
Jordan, R. C., Gray, S. A., Howe, D. V., Brooks, W. R., and Ehrenfeld, J. G. (2011). Knowledge gain and behavioral change in citizen-science programs. Conserv. Biol. 25, 1148–1154. doi:10.1111/j.1523-1739.2011.01745.x
Khatibi, F. S., Dedekorkut-Howes, A., Howes, M., and Torabi, E. (2021). Can public awareness, knowledge and engagement improve climate change adaptation policies? Discov. Sustain. 2, 18. doi:10.1007/s43621-021-00024-z
Klemm, W., Heusinkveld, B. G., Lenzholzer, S., and van Hove, B. (2015). Street greenery and its physical and psychological impact on thermal comfort. Landsc. Urban Plan. 138, 87–98. doi:10.1016/j.landurbplan.2015.02.009
Kumar, P., Morawska, L., Martani, C., Biskos, G., Neophytou, M., Di Sabatino, S., et al. (2015). The rise of low-cost sensing for managing air pollution in cities. Environ. Int. 75, 199–205. doi:10.1016/j.envint.2014.11.019
Lintott, C. J., Schawinski, K., Slosar, A., Land, K., Bamford, S., Thomas, D., et al. (2008). Galaxy zoo: morphologies derived from visual inspection of galaxies from the sloan digital sky survey. Mon. Not. R. Astron Soc. 389, 1179–1189. doi:10.1111/j.1365-2966.2008.13689.x
Llasat-Botija, M., Esbrí, L., Rigo, T., and Llasat, M. C. (2025). The application of citizen science to evaluate the emergency and the response of the population in the October 2019 flash flood event in the francolí river (NE Spain). Water (Basel) 17, 610. doi:10.3390/w17050610
Loglisci, N., Milelli, M., Iurato, J., Galia, T., Galizia, A., and Parodi, A. (2024). Validation of citizen science meteorological data: can they be considered a valid help in weather understanding and community engagement? Sensors 24, 4598. doi:10.3390/s24144598
Mahajan, S., Chung, M. K., Martinez, J., Olaya, Y., Helbing, D., and Chen, L. J. (2022). Translating citizen-generated air quality data into evidence for shaping policy. Humanit. Soc. Sci. Commun. 9 (1), 122–18. doi:10.1057/s41599-022-01135-2
Meeus, S., Silva-Rocha, I., Adriaens, T., Brown, P. M. J., Chartosia, N., Claramunt-López, B., et al. (2023). More than a bit of fun: the multiple outcomes of a bioblitz. Bioscience 73, 168–181. doi:10.1093/biosci/biac100
MeteoTracker (2025). MeteoTracker dashboard. Available online at: https://app.meteotracker.com/#!/ (Accessed May 19, 2025).
Mezzacapo, U., Voltolina, D., Gencarelli, C. N., Esposito, G., Mondini, A., Salvati, P., et al. (2025). Drivers and barriers of sustainable behaviours among young generations in a climate-vulnerable Italian city. Int. J. Disaster Risk Reduct. 121, 105420. doi:10.1016/j.ijdrr.2025.105420
Michie, S., van Stralen, M. M., and West, R. (2011). The behaviour change wheel: a new method for characterising and designing behaviour change interventions. Implement Sci. 6, 42. doi:10.1186/1748-5908-6-42
Mölter, A., and Tjelle Holm, N. K. (2022). Methodological guide for citizen engagement in living labs in ICHANGE with the description of the learning platform (I-CHANGE D1.8).
Muki, H. (2015). Citizen science and policy: a European perspective | wilson center. Available online at: https://www.wilsoncenter.org/publication/citizen-science-and-policy-european-perspective (Accessed May 12, 2025).
Muller, C. L., Chapman, L., Johnston, S., Kidd, C., Illingworth, S., Foody, G., et al. (2015). Crowdsourcing for climate and atmospheric sciences: current status and future potential. Int. J. Climatol. 35, 3185–3203. doi:10.1002/joc.4210
Nana, B., Sanogo, O., Savadogo, P. W., Daho, T., Bouda, M., and Koulidiati, J. (2012). Air quality study in urban centers: case study of ouagadougou, Burkina Faso. FUTY J. Environ. 7, 1–18. doi:10.4314/FJE.V7I1.1
Oliveira, S., Vaz, T., and Andrade, H. (2014). Perception of thermal comfort by users of urban green areas in Lisbon. Finisterra 49, 113–131. doi:10.18055/Finis6464
Phillips, T. B., Ballard, H. L., Lewenstein, B. V., and Bonney, R. (2019). Engagement in science through citizen science: moving beyond data collection. Sci. Educ. 103, 665–690. doi:10.1002/sce.21501
Rajagopalan, P., Andamon, M. M., and Paolini, R. (2020). Investigating thermal comfort and energy impact through microclimate monitoring-a citizen science approach. Energy Build. 229, 110526. doi:10.1016/j.enbuild.2020.110526
Relvas, H., Lopes, D., and Armengol, J. M. (2025). Empowering communities: advancements in air quality monitoring and citizen engagement. Urban Clim. 60, 102344. doi:10.1016/J.UCLIM.2025.102344
Sabatier, P. (1987). Knowledge, policy-oriented learning, and policy change: an advocacy coalition framework. Knowledge 8, 649–692. doi:10.1177/0164025987008004005
Santonen, T. (2018). “Comparing living Lab(s) and its’ competing terms popularity,” in ISPIM innovation conference: innovation, the name of the game. Editors I. Bitran, S. Conn, K. R. E. Huizingh, O. Kokshagina, M. Torkkeli, and M. Tynnhammar (Stockholm: ISPIM).
Shirk, J. L., Ballard, H. L., Wilderman, C. C., Phillips, T., Wiggins, A., Jordan, R., et al. (2012). Public participation in scientific research: a framework for deliberate design. Ecol. Soc. 17, art29. doi:10.5751/ES-04705-170229
Sîrbu, A., Becker, M., Caminiti, S., De Baets, B., Elen, B., Francis, L., et al. (2015). Participatory patterns in an international air quality monitoring initiative. PLoS One 10, e0136763. doi:10.1371/JOURNAL.PONE.0136763
Skarzauskiene, A., Mačiulienė, M., and Kovaitė, K. (2024). Citizen engagement in climate adaptation surveyed: identifying challenges in education and capacity building. Eur. J. Educ. 59, e12732. doi:10.1111/ejed.12732
Snyder, E. G., Watkins, T. H., Solomon, P. A., Thoma, E. D., Williams, R. W., Hagler, G. S. W., et al. (2013). The changing paradigm of air pollution monitoring. Environ. Sci. Technol. 47, 11369–11377. doi:10.1021/es4022602
Sullivan, B. L., Aycrigg, J. L., Barry, J. H., Bonney, R. E., Bruns, N., Cooper, C. B., et al. (2014). The eBird enterprise: an integrated approach to development and application of citizen science. Biol. Conserv. 169, 31–40. doi:10.1016/j.biocon.2013.11.003
van Hoof, J., Marston, H. R., Kazak, J. K., and Buffel, T. (2021). Ten questions concerning age-friendly cities and communities and the built environment. Build. Environ. 199, 107922. doi:10.1016/J.BUILDENV.2021.107922
Veeckman, C., and Temmerman, L. (2021). Urban living labs and citizen science: from innovation and science towards policy impacts. Sustainability 13, 526. doi:10.3390/su13020526
Vohland, K., Land-Zandstra, A., Ceccaroni, L., Lemmens, R., Perello, J., Ponti, M., et al. (2021). The science of citizen science. Springer International Publishing. doi:10.1007/978-3-030-58278-4
Watne, Å. K., Linden, J., Willhelmsson, J., Fridén, H., Gustafsson, M., and Castell, N. (2021). Tackling data quality when using low-cost air quality sensors in citizen science projects. Front. Environ. Sci. 9, 733634. doi:10.3389/fenvs.2021.733634
WHO Team, Centre for Environment and Health (BON), and Environment and Health Impact Assessment (EHI) (2016). Urban green spaces and health. Available online at: https://www.who.int/europe/publications/i/item/WHO-EURO-2016-3352-43111-60341?utm_source=chatgpt.com (Accessed May 19, 2025).
Keywords: citizen science, extreme temperatures, air pollution, adaptation, co-creation, participatory science
Citation: Esbrí L, Llasat-Botija M, Llasat MC, Sola Y, Loglisci N, Brattich E, Racionero S, Steeneveld G-J, Mölter A, Galizia A, Polo L, Peerlings EEM, Cintolesi C, Barbano F, Adnan M, Aerts L, Alpert P, Campos G, Torou BM, Di Sabatino S and Parodi A (2025) Implementing citizen science activities for climate action: the I-CHANGE Day. Front. Environ. Sci. 13:1650360. doi: 10.3389/fenvs.2025.1650360
Received: 19 June 2025; Accepted: 15 October 2025;
Published: 29 October 2025.
Edited by:
Jennifer Ann Salmond, The University of Auckland, New ZealandReviewed by:
Goran Trbic, University of Banjaluka, Bosnia and HerzegovinaPrabal Barua, Jahangirnagar University, Bangladesh
Copyright © 2025 Esbrí, Llasat-Botija, Llasat, Sola, Loglisci, Brattich, Racionero, Steeneveld, Mölter, Galizia, Polo, Peerlings, Cintolesi, Barbano, Adnan, Aerts, Alpert, Campos, Torou, Di Sabatino and Parodi. This is an open-access article distributed under the terms of the Creative Commons Attribution License (CC BY). The use, distribution or reproduction in other forums is permitted, provided the original author(s) and the copyright owner(s) are credited and that the original publication in this journal is cited, in accordance with accepted academic practice. No use, distribution or reproduction is permitted which does not comply with these terms.
*Correspondence: Laura Esbrí, bGVzYnJpQG1ldGVvLnViLmVkdQ==