 Veera Narayana Balabathina
 Surender Mishra1
- 1Panacea Geospatial Solutions, Geospatial Division, New Delhi, India
- 2Panacea Bioedge, New Delhi, India
- 3TERI University, School of Advanced Studies for Geoinformatics, New Delhi, India
Introduction: Accurate identification of forest tree species is essential for sustainable forest management, biodiversity assessment, and environmental monitoring. Urban forests, in particular, present spectral heterogeneity that challenges conventional classification methods. This study focuses on developing an efficient classification framework for species-level tree mapping in the Hauz Khas Urban Forest, New Delhi, India, using EO-1 Hyperion hyperspectral imagery.
Methods: Thirteen supervised classification algorithms were comparatively evaluated, encompassing traditional spectral/statistical classifiers—Maximum Likelihood, Mahalanobis Distance, Minimum Distance, Parallelepiped, Spectral Angle Mapper (SAM), Spectral Information Divergence (SID), and Binary Encoding—and machine learning algorithms including Decision Tree (DT), K-Nearest Neighbor (KNN), Support Vector Machine (SVM), Random Forest (RF), and Artificial Neural Network (ANN). Dimensionality-reduction techniques (Principal Component Analysis—PCA and Minimum Noise Fraction—MNF) and band-selection strategies based on the Average Pairwise Absolute Difference (APAD) metric and species-specific band-ratio indices were implemented to mitigate spectral redundancy. Ground-truth samples were collected from extensive field surveys and validated using very high-resolution Pléiades imagery.
Results: A total of 21 tree species were identified. Among all classifiers, Random Forest and Decision Tree exhibited superior performance, with Random Forest achieving the highest species-level accuracy (95% for Peepal and Medlar) and overall accuracy of 82.56% (Kappa = 0.81) when applied to PCA-transformed data.
Discussion: The results highlight that integrating dimensionality reduction and optimal band selection with ensemble learning substantially improves classification efficiency and accuracy. The study identifies the most effective fast-learning classifiers for hyperspectral urban forest mapping and underscores the potential of hyperspectral imaging and ensemble methods for scalable and operational tree species monitoring.
1 Introduction
Forests are among Earth’s most vital ecosystems, playing a crucial role in climate regulation, biodiversity conservation, and supporting human livelihoods (FAO, 2022). Accurate and spatially explicit information on individual tree species is essential for sustainable forest management, biodiversity assessment, green GDP estimation, carbon-stock evaluation, and ecosystem-service analysis. However, traditional field-based identification methods, though reliable, are often time-consuming, labor-intensive, and impractical for large or inaccessible areas. Consequently, the integration of advanced geospatial technologies—particularly remote sensing—has emerged as a robust and scalable alternative, enabling the development of high-resolution forest cover databases for improved monitoring, carbon accounting, and sustainable management.
Over the past 2 decades, hyperspectral remote sensing has emerged as a powerful tool for capturing reflectance data across hundreds of narrow spectral bands, enabling detailed discrimination among plant species based on their unique spectral signatures (Landgrebe, 2002). Compared with multispectral sensors, hyperspectral systems provide enhanced spectral resolution, allowing finer differentiation of vegetation types with overlapping structural or phenological characteristics. Unmanned aerial vehicles (UAVs), airborne sensors, and spaceborne hyperspectral platforms now acquire data at bandwidths of 0.1–10 nm and spatial resolutions ranging from centimeters to meters. These advances represent a major milestone in vegetation mapping, offering unprecedented capabilities for tree-species discrimination.
Despite hyperspectral imagery provides rich spectral information, it often requires rigorous preprocessing and dimensionality reduction to mitigate issues of high dimensionality, redundancy, and spectral noise (Kumar et al., 2020; Green et al., 2009). Machine learning algorithms have demonstrated strong potential for extracting meaningful patterns from hyperspectral data (Camps-Valls and Bruzzone, 2005). Classical classifiers such as Decision Tree (DT) (Quinlan, 1986; Breiman et al., 1984), K-Nearest Neighbor (KNN) (Cover and Hart, 1967; Li et al., 2022), Support Vector Machine (SVM) (Vapnik, 1995; Melgani and Bruzzone, 2004), Random Forest (RF) (Breiman, 2001; Ma et al., 2021), and Artificial Neural Network (ANN) (Rumelhart et al., 1986; Zhang et al., 2021) have been widely adopted for land-cover mapping, agricultural monitoring, and forest composition analysis (Bruzzone et al., 2003; Ballanti et al., 2016; Guan et al., 2020). Traditional statistical and spectral classifiers—such as Maximum Likelihood, Mahalanobis Distance, Minimum Distance, Parallelepiped, Spectral Angle Mapper (SAM), Spectral Information Divergence (SID), and Binary Encoding—remain relevant due to their interpretability, computational efficiency, and proven robustness for high-dimensional data. Despite extensive algorithmic development, comprehensive comparative evaluations across diverse classifiers remain limited, especially in spectrally heterogeneous forest environments. Moreover, few studies have systematically examined classifier performance across dimensionality-reduced datasets derived from Principal Component Analysis (PCA) or Minimum Noise Fraction (MNF) transformations (Cetin and Yastikli, 2022; Lee and Plaza, 2012).
Recent literature highlights the increasing use of machine learning in remote sensing, where supervised algorithms have been applied to both urban and natural forests using hyperspectral and LiDAR datasets. These approaches have been employed to quantify forest structural variables and vegetation indices, linking them to above-ground biomass (AGB) and species richness. For example, Melgani and Bruzzone (2004) demonstrated the effectiveness of SVM for hyperspectral image classification, while Ballanti et al. (2016) and Guan et al. (2020) reported high accuracies for SVM and RF in tree-species mapping. Recent advances further underscore the growing role of deep learning, particularly convolutional neural networks (CNNs), which outperform traditional classifiers by jointly exploiting spatial–spectral features.
Wang et al. (2021) and Xia et al. (2020) demonstrated the advantages of CNNs in hyperspectral vegetation mapping, findings later extended through hybrid CNN–Transformer networks (Chen et al., 2023; Sun et al., 2024) and deformable convolution models designed for limited training samples (Li et al., 2023). Likewise, Tong and Zhang, (2024) illustrated the feasibility of tree-species mapping in heterogeneous forests using fewer training samples. In parallel, Random Forest-based feature-selection techniques (Wang et al., 2019) and information-theoretic band-selection approaches (Sun et al., 2019; Fu et al., 2022) continue to enhance spectral separability and reduce data dimensionality. Despite these advances, the performance of deep-learning models is constrained by their need for large labeled datasets and substantial computational resources—conditions not always feasible for sensors such as EO-1 Hyperion, which are characterized by limited spatial resolution and mixed-pixel effects. Accordingly, the present study focuses on fast-learning classifiers that achieve a balance between accuracy and efficiency, while recognizing that future research may integrate deep-learning architectures as data availability and computing power increase.
In this study, the analysis is restricted to fast-learning supervised classifiers because of their computational efficiency, interpretability, and operational suitability for EO-1 Hyperion data. Although deep-learning models represent a promising frontier, they generally require extensive labeled datasets and specialized computational infrastructure, which fall beyond the current study’s scope. Nonetheless, their potential is acknowledged, and deep-learning integration is identified as an important direction for future research.
The thirteen supervised classifiers examined in this research are categorized as fast-learning classification algorithms—computationally efficient models requiring modest training time and limited labeled data while maintaining reliable performance on high-dimensional hyperspectral datasets. Unlike contemporary deep-learning methods such as convolutional neural networks (CNNs), recurrent neural networks (RNNs), three-dimensional CNNs, and Transformer-based models—which often attain superior accuracy but rely on large annotated datasets and intensive computation (Xia et al., 2020; Zhang et al., 2024)—fast-learning algorithms remain well suited for operational remote sensing applications, particularly when employing legacy sensors such as EO-1 Hyperion. Their strengths lie in interpretability, robustness with small training sets, and suitability for rapid, scalable environmental monitoring. The core contribution of this study therefore lies not in proposing new classifiers but in systematically evaluating the performance of a broad range of fast-learning algorithms across multiple dimensionality-reduction strategies (APAD, PCA, MNF) for species-level classification in spectrally complex urban forests. Nevertheless, recent advances using transformer-based and hybrid CNN architectures—such as HyperSFormer (Xie et al., 2023), multi-scale spatial–spectral transformers (Ma et al., 2024), and dual-stream 3D CNNs with band selection (Zhang et al., 2024)—demonstrate the potential for future benchmarking of such models against classical approaches under improved data and computing conditions.
2 Study area
The study was conducted in the Hauz Khas Forest, a prominent urban woodland situated in southern part of New Delhi, India (28°33′18″N, 77°11′31″E) shown in Figure 1. Spanning approximately 400 acres, this forest is embedded within a densely urbanized matrix and serves as a vital ecological refuge amid the city’s rapidly expanding metropolitan landscape. It represents one of the largest and most ecologically significant green spaces in the capital city and supports a diverse array of native and exotic flora and fauna. The area was selected owing to its biodiversity, historical relevance, and structural heterogeneity, making it an ideal test site for high-resolution hyperspectral analysis and species-level classification. Hauz Khas forest exhibits a complex mosaic of native and exotic tree species, ranging from tall emergent canopies to understory shrubs, influenced by varied microclimatic conditions, soil types, and moisture regimes.
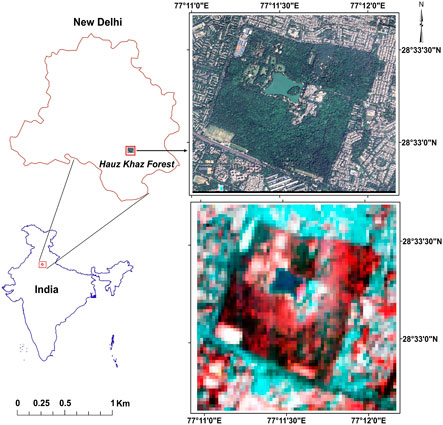
Figure 1. Study area and location map.
Field surveys identified over 30 tree species, of which 21 representative species were selected for classification based on canopy structure, spectral distinctiveness, and the availability of reliable ground-truth data. Notable species include Ipil-Ipil (Leucaena leucocephala), Neem (Azadirachta indica), Blackboard Tree (Alstonia scholaris), Karanj (Pongamia pinnata), Fig (Ficus racemosa), Peepal (Ficus religiosa), Medlar (Mimusops elengi), Jaggery Palm (Caryota urens), Indian Banyan (Ficus benghalensis), Northern Cottonwood (Populus deltoides), Ashok (Polyalthia longifolia), Australian Silky Oak (Grevillea robusta), Eucalyptus (Eucalyptus globulus), Buddha Coconut (Pandanus odorifer), Putranjiva (Putranjiva roxburghii), Golden Shower Tree (Cassia fistula), Cassie (Vachellia farnesiana), Christ’s Thorn (Ziziphus spina-christi), Multiya, Orchid Tree (Bauhinia variegata), and Tree of Heaven (Ailanthus altissima).
3 Materials
The primary dataset comprised hyperspectral imagery acquired by the EO-1 Hyperion sensor (NASA, 2010), a push-broom instrument providing 242 contiguous spectral bands spanning 400–2,500 nm, with a nominal spectral resolution of ≈10 nm and a spatial resolution of 30 m. Complementary very-high-resolution (VHR) satellite imagery from the Airbus Pleiades Neo constellation (30 cm spatial resolution) was employed for accurate visual interpretation of individual tree crowns. The EO-1 Hyperion Level-1R hyperspectral data are publicly accessible via the USGS EarthExplorer portal (https://earthexplorer.usgs.gov/). In contrast, the VHR Pleiades data were used under research license and are not publicly distributable.
A comprehensive field campaign was conducted using Garmin handheld GPS receivers to collect 400 geo-referenced tree-species samples for classifier training and validation. Species identification was verified through the PlantNet mobile application (PlantNet, 2023), which analyzed plant imagery and provided morphological matches. In addition to EO-1 Hyperion data, 30 cm Pleiades imagery supported validation of tree-species distribution. To address spatial-resolution disparities between datasets, 30 cm Pléiades imagery was not resampled to the 30 m Hyperion grid but was instead used for reference mapping and delineation of dominant tree crowns within each pixel. Similar approaches have demonstrated the utility of hyperspectral data for species discrimination in complex forest environments (Priedītis et al., 2015). Ground-truth samples were cross-validated with Pléiades imagery to ensure that training and validation pixels corresponded to pure or dominant tree species, thereby minimizing mixed-pixel effects. The integration of EO-1 Hyperion hyperspectral imagery, very high-resolution Pléiades data, and extensive field observations provided a strong foundation for assessing spectral separability and species-level classification performance within a heterogeneous urban forest environment. This integrated approach, in line with earlier studies (Tong and Zhang, (2024)), underscores the robustness and credibility of the methodological framework.
4 Methodology
The methodological framework for tree species classification using hyperspectral data is illustrated in Figure 2. It outlines a systematic workflow adopted in this study, comprising data preprocessing, dataset preparation, dimensionality reduction and spectral band selection, supervised classification and accuracy assessment, and evaluation of methodological limitations. Each step was designed to ensure radiometric consistency, minimize noise, and enhance spectral separability for reliable species-level discrimination. The workflow also addresses key challenges associated with the high dimensionality and spectral redundancy of EO-1 Hyperion imagery, ensuring robust and reproducible classification outcomes. The following subsections describe these stages in detail.
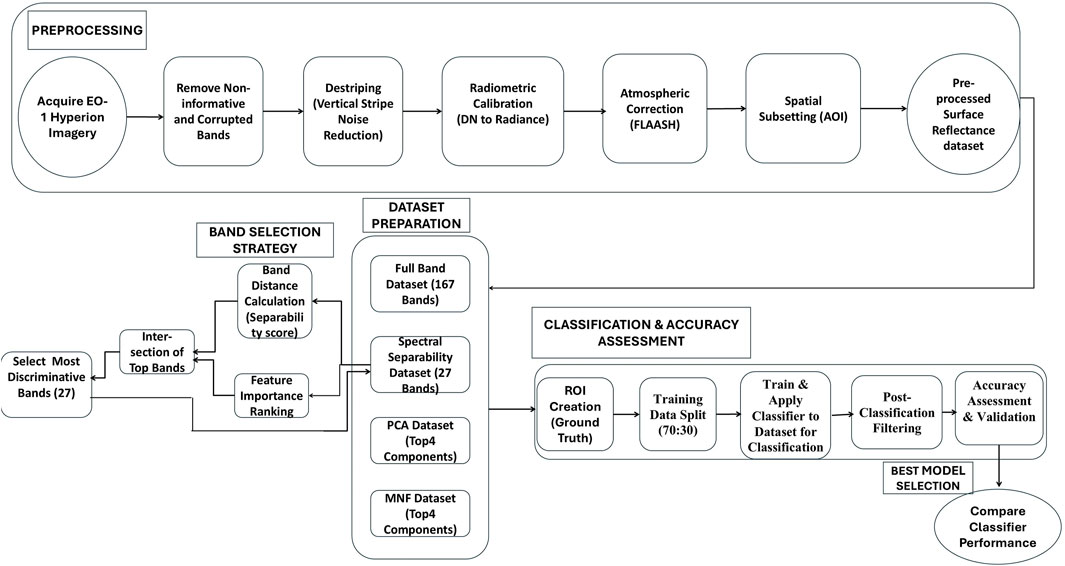
Figure 2. Workflow for hyperspectral tree species classification using EO-1 hyperion data.
4.1 Preprocessing
Effective preprocessing of hyperspectral imagery is a critical and time-intensive step to ensure high data quality, analytical accuracy, and suitability for advanced analyses. In this study, EO-1 Hyperion imagery obtained from the USGS EarthExplorer portal was used. The sensor provides 242 contiguous spectral bands covering the 400–2,500 nm range, with a spectral resolution of approximately 10 nm and a spatial resolution of 30 m (NASA, 2010). EO-1 Hyperion imagery underwent comprehensive preprocessing, including spectral, spatial, radiometric, atmospheric, terrain, and geometric corrections, to ensure accurate reflectance values and spatial consistency. The initial preprocessing step involved identifying and removing non-informative or corrupted spectral bands. Specifically, 75 bands were excluded due to issues such as zero-value data (e.g., bands 1–7, 58–76, and 225–242) and atmospheric absorption artifacts, particularly those caused by water vapor interference (e.g., bands 120–131, 166–182, and 223–224). This resulted in a refined dataset consisting of 167 effective spectral bands, following the preprocessing strategies adopted by Priedītis et al. (2015) and Sun et al. (2019). Subsequently, vertical striping noise commonly present in Hyperion data due to calibration inconsistencies and the imaging mechanism of push-broom sensors was addressed through local Destriping techniques. These systematic vertical striping artifacts, or bad columns, were corrected using Destriping methods incorporating statistical equalization and filtering, wherein the affected pixel values were replaced with neighborhood-based averages to improve image uniformity. Following this, radiometric calibration was conducted to convert digital number (DN) values into radiance units, facilitating the quantification of reflected or emitted energy. The calibrated data were then subjected to atmospheric correction using the Fast Line-of-sight Atmospheric Analysis of Hypercubes (FLAASH) module within the ENVI software environment (Harris Geospatial Solutions, 2015). FLAASH corrects for atmospheric absorption and scattering effects, generating surface reflectance data with smoother spectral profiles compared to alternative methods such as QUAC and ACORN. In this study, the retrieval of water vapor and aerosol information was disabled to streamline the processing workflow. Following atmospheric correction, spatial subsetting was performed to isolate the Hauz Khas region as the area of interest. The resulting spectrally and spatially refined reflectance dataset provides a reliable foundation for further classification and interpretation tasks. To assess the impact of input dimensionality on classification accuracy, four distinct datasets were generated from EO-1 Hyperion hyperspectral imagery.
4.2 Dataset preparation
Four datasets were prepared to evaluate the influence of spectral dimensionality and feature selection on classification performance. The first dataset, termed the Full-Band dataset, comprised 167 spectral bands retained after removing noisy, overlapping and atmospheric absorption bands from the original 242 bands of the EO-1 Hyperion sensor. The second dataset, designated as the Spectrally Separable Subset, was derived using a hybrid feature-selection strategy based on spectral contrast and feature importance. The Average Pairwise Absolute Difference (APAD) metric was employed to quantify inter-species spectral separability and identify the most discriminative hyperspectral bands from the EO-1 Hyperion imagery. For each spectral band, mean reflectance values of the 21 species were used to compute all pairwise absolute differences, which were then averaged across all 210 class pairs to yield a single APAD score per band (Figure 3). Bands were ranked in descending order of APAD values, and the top 30 bands were selected as the most discriminative features. This non-parametric method does not rely on intra-class variance or covariance estimation and is therefore well suited to high-dimensional hyperspectral data with limited homogeneous pixels. Under such conditions, APAD provides a pragmatic, robust separability metric for coarse-resolution hyperspectral data.
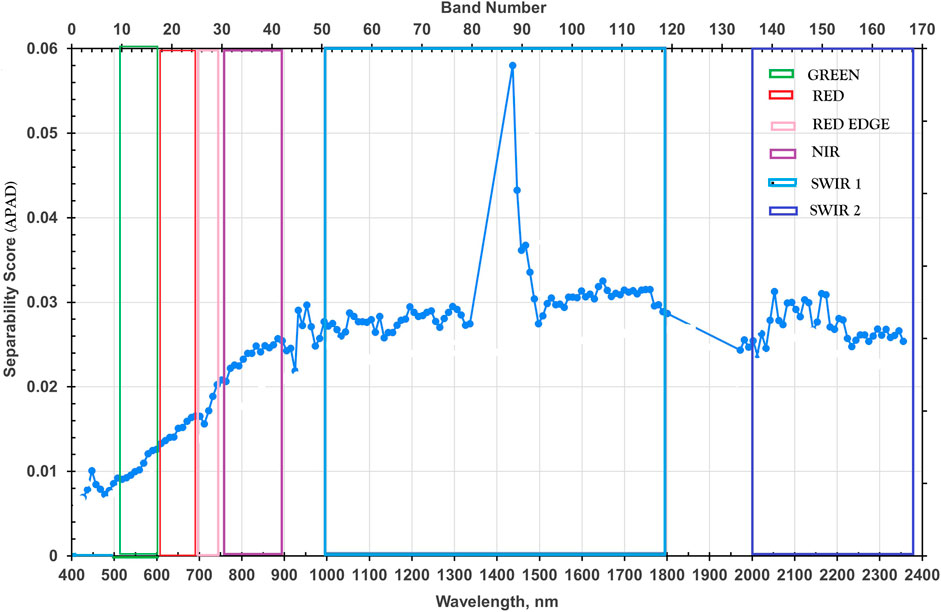
Figure 3. Average pairwise absolute difference (APAD) band separability score.
In contrast, variance-dependent measures such as the Bhattacharyya or Jeffries–Matusita distance require reliable intra-class statistics, which are often unavailable for natural forest datasets with small sample sizes and overlapping spectra (Zhang et al., 2007). The APAD approach was implemented in Python using a custom script that computed class-wise mean spectra, all pairwise absolute differences, and averaged them to derive APAD scores per band.
The top 30 bands selected (13, 26, 25, 24, 23, 32, 31, 30, 27, 46, 47, 45, 41, 92, 93, 95, 94, 96, 113, 112, 124, 123, 118, 122, 114, 120, 108, 137, 149, 105, 134) exhibited the highest inter-class separability. The APAD for band i was computed as
where:
C =
k = 21 is the number of tree species,
n = 167 is the number of bands
μA,i and μB,i are the mean reflectances of species A and B in band i.
The third and fourth datasets were produced through dimensionality-reduction techniques applied to the Full-Band dataset. Principal Component Analysis (PCA) extracted the first four principal components capturing the majority of spectral variance (Lee and Plaza, 2012), while the Minimum Noise Fraction (MNF) transform retained the four noise-filtered components with the largest eigenvalues (Green et al., 2009).
To derive species-specific band-ratio indices, inter-band correlation and mean reflectance contrast were analyzed. For each species, band pairs with minimal correlation and maximal reflectance difference were selected to form ratio indices that enhanced separability. These ratios were later integrated into classification experiments as additional discriminative features.
4.3 Classification
Supervised classification techniques were employed to discriminate individual tree species using the pre-processed EO-1 Hyperion surface reflectance data. A total of thirteen supervised classifiers were evaluated, encompassing both traditional statistical and modern machine-learning approaches to ensure a comprehensive comparative assessment.
The statistical classifiers included Binary Encoding, Minimum Distance, Parallelepiped, Maximum Likelihood, Mahalanobis Distance, Spectral Angle Mapper (SAM), and Spectral Information Divergence (SID). The machine-learning algorithms comprised Support Vector Machine (SVM) (Vapnik, 1995; Melgani and Bruzzone, 2004), Artificial Neural Networks (ANN) (Rumelhart et al., 1986; Zhang et al., 2021), Random Forest (RF) (Breiman, 2001; Ma et al., 2021), K-Nearest Neighbor (KNN) (Cover and Hart, 1967; Li et al., 2022), and Decision Tree (DT) (Quinlan, 1986; Breiman et al., 1984). Among these, SVM and ANN have been extensively reported for hyperspectral image classification owing to their effectiveness in handling high-dimensional feature spaces and complex nonlinear class boundaries (Melgani and Bruzzone, 2004; Ballanti et al., 2016).
All classifiers were implemented within the ENVI 5.6 software environment (Harris Geospatial Solutions, 2015) following standardized supervised learning protocols. Ground-truth Regions of Interest (ROIs), delineated from field-collected GPS samples and cross-validated with very high-resolution Pléiades Neo imagery, were used as training data for supervised classification. The mean spectral reflectance profiles of 21 urban tree species, derived from these field-verified ROIs using EO-1 Hyperion hyperspectral data, are presented in Figure 4. These spectra exhibit distinct absorption and reflectance features across the visible, near-infrared, and shortwave-infrared regions, highlighting species-specific spectral variability critical for accurate classification and separability analysis. The dataset was subsequently partitioned into 70% training and 30% validation subsets to ensure unbiased model calibration and performance evaluation. Each classifier was trained using the designated ROIs and subsequently applied to the full hyperspectral dataset to generate thematic tree-species classification maps. Post-classification majority filtering was performed to reduce speckle noise and enhance spatial coherence, thereby improving the overall interpretability of the classification outputs.
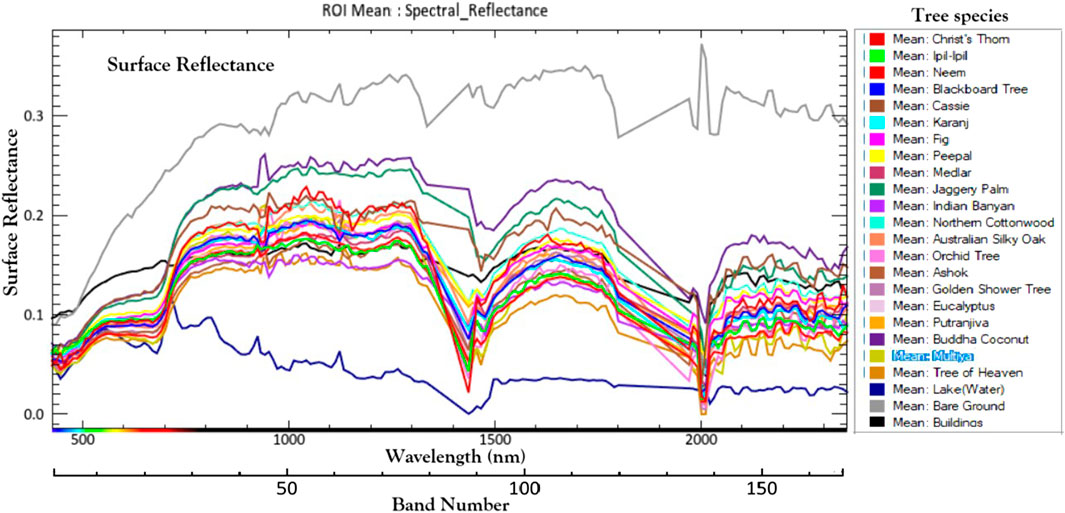
Figure 4. Mean spectral reflectance of the tree species.
4.4 Accuracy assessment
Accuracy assessment was performed using the independent validation set by generating confusion matrices for each of the 13 classifiers. Classification performance was quantified using Overall Accuracy (OA), Producer’s Accuracy (PA), User’s Accuracy (UA), and the Kappa coefficient (κ), ensuring a robust comparison of classifier effectiveness at both the dataset and species levels.
To maintain methodological rigor, several preprocessing steps were undertaken prior to classification, including the removal of noisy and atmospheric absorption bands, destriping correction, and atmospheric calibration using the Fast Line-of-sight Atmospheric Analysis of Spectral Hypercubes (FLAASH) module. Independent field samples were cross-validated with Pléiades imagery to confirm that training and validation ROIs represented pure or dominant tree crowns, minimizing mixed-pixel errors. Parameter settings for each classifier followed established hyperspectral remote sensing standards (Melgani and Bruzzone, 2004; Ballanti et al., 2016), ensuring that results reflected true algorithmic performance rather than dataset inconsistencies or implementation biases.
Accuracy assessment was conducted using the independent validation set by computing confusion matrices and deriving standard accuracy metrics—Overall Accuracy (OA), Producer’s Accuracy (PA), User’s Accuracy (UA), and the Kappa coefficient (κ) for each classifier. This ensured rigorous, quantitative evaluation of classifier performance at the species level. All parameter settings were verified with reference to established hyperspectral classification literature (e.g., Melgani and Bruzzone, 2004; Ballanti et al., 2016). Data preprocessing included the removal of noisy bands, atmospheric correction using FLAASH, and destriping correction. Field and Pléiades Neo data were jointly used to cross-validate class labels, ensuring that the comparative results reflected algorithmic performance rather than preprocessing or dataset inconsistencies.
4.5 Selection of the best performing classification strategy
The performance of all classification algorithms was rigorously evaluated using confusion matrices and standard accuracy metrics, following the accuracy assessment framework proposed by Congalton (1991). Each supervised classification algorithm was applied to the prepared datasets, and its performance was quantified based on Overall Accuracy (OA), Producer’s Accuracy (PA), User’s Accuracy (UA), and the Kappa coefficient (κ). The classifier that achieved the highest overall and class-wise accuracies for the given dataset was identified as the optimal model for subsequent analysis.
To further validate the classifier’s capability to discriminate individual tree species, both UA and OA were analyzed to determine classification reliability and inter-class confusion. Species exhibiting the highest classification confidence and spectral separability were considered optimally extractable under the selected model. To enhance class separability and minimize spectral overlap, a correlation matrix of species-wise spectral responses was generated. Statistical descriptors, including mean, standard deviation, and coefficient of variation, were derived and integrated within a decision-tree framework to construct species-specific band ratio indices. These indices facilitated the extraction of discriminative spectral features, thereby improving inter-species separability and overall classification performance.
5 Results and discussion
This section presents a comparative evaluation of classification outcomes across four datasets—Full Band, Spectrally Separable Subset, Principal Component Analysis (PCA), and Minimum Noise Fraction (MNF)—using thirteen supervised classifiers. It also examines species-level accuracies, spectral separability patterns, and optimal band-ratio indices to interpret how spectral and algorithmic characteristics influence classification performance. While dimensionality reduction and feature-selection strategies (PCA, MNF, and APAD) significantly enhance classification outcomes, their purpose is complementary—serving to improve classifier efficiency and accuracy rather than acting as end goals. The core focus of this study is the comparative analysis of classifier performance for reliable species-level discrimination in heterogeneous urban forests.
5.1 Classifier performance across datasets
Table 1 summarizes the classification performance (Overall Accuracy, OA, and Kappa coefficient) of the thirteen classifiers applied to the four datasets. Following the evaluation framework of Ma et al. (2021), several traditional classifiers, particularly spectral and statistical methods, exhibited relatively low accuracies across all dimensionality-reduced datasets. These results underscore the limited ability of older algorithms to manage the high-dimensional and noise-prone nature of Hyperion hyperspectral data.
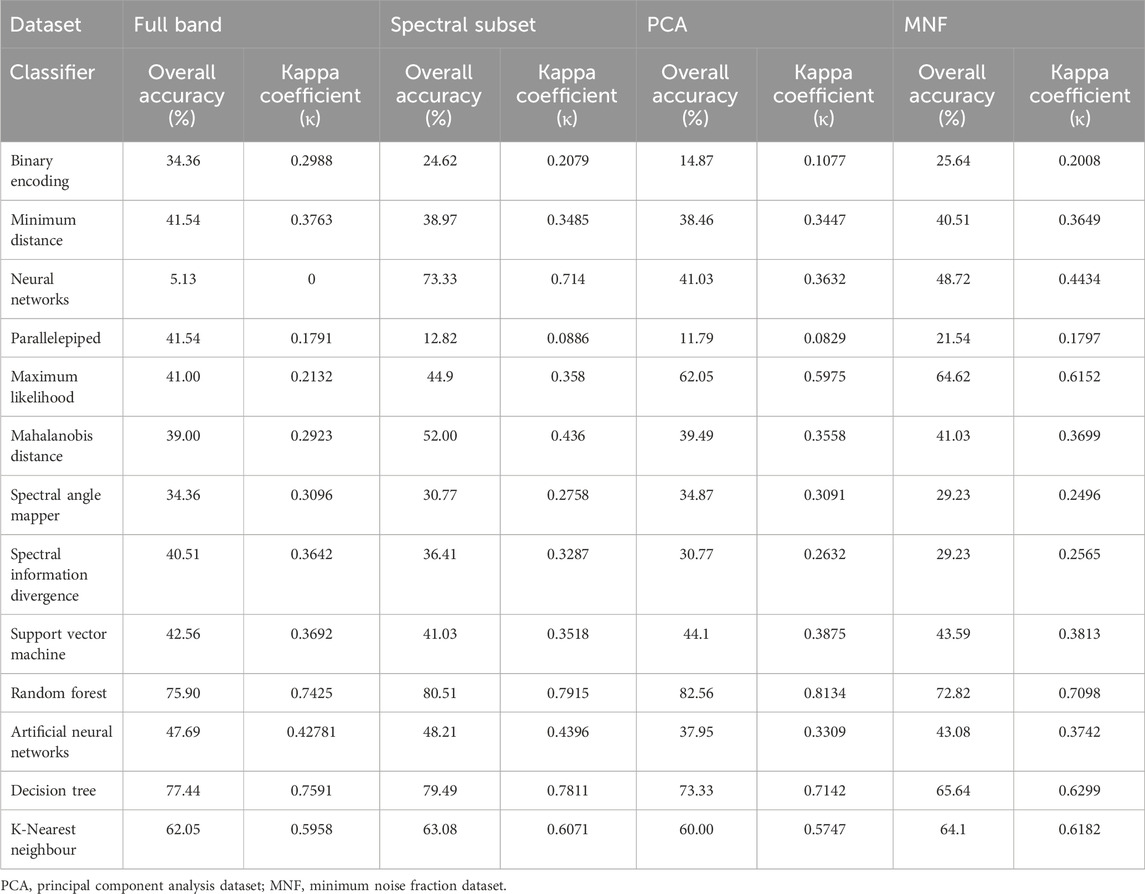
Table 1. Classifier performance across four datasets.
In contrast, ensemble-based classifiers—particularly Random Forest (RF) and Decision Tree (DT)—demonstrated consistently high accuracies across all datasets, confirming their robustness and adaptability. Among all classifiers, RF achieved the highest OA of 82.56% and Kappa coefficient of 0.81 using PCA-transformed data, indicating strong agreement between predicted and reference classes. DT also performed competitively, yielding OA values above 73% for all datasets and peaking at 79.49% with the Spectral Separability subset.
Traditional classifiers such as Binary Encoding, Parallelepiped, and Spectral Angle Mapper (SAM) produced considerably lower accuracies (OA < 45%), reaffirming their limited suitability for complex hyperspectral scenes. SVM exhibited moderate performance (OA ≈ 44%), while ANN and Neural Networks showed dataset-dependent variability. For example, Neural Networks achieved 73.33% OA on the Spectral Separability dataset but dropped to 5.13% on the Full Band data, likely due to overfitting and insufficient training samples in high-dimensional feature spaces. The lower accuracies observed for several classifiers are not attributed to preprocessing or implementation errors, as workflows and parameters were verified across all tests. Rather, they reflect inherent algorithmic limitations when handling mixed-pixel and high-dimensional data characteristic of EO-1 Hyperion imagery.
The species-level classification maps generated by the top-performing classifiers—Random Forest (RF) and Decision Tree (DT)—using their respective optimal datasets (PCA, MNF, Spectral Subset, and Full Band), illustrating spatial distribution and inter-species variability across the Hauz Khas urban forest shown in Figure 5. Figure 6 presents the comparative performance of all thirteen classifiers across the four datasets—Full Band, Spectral Separability Subset, PCA, and MNF—based on Overall Accuracy (OA) and Kappa coefficient (κ). These findings confirm the effectiveness of dimensionality reduction and feature optimization in enhancing classification reliability and inter-class separability. Among the compared models, Random Forest consistently outperformed others in both accuracy and robustness, confirming its suitability for operational tree species mapping with hyperspectral data.
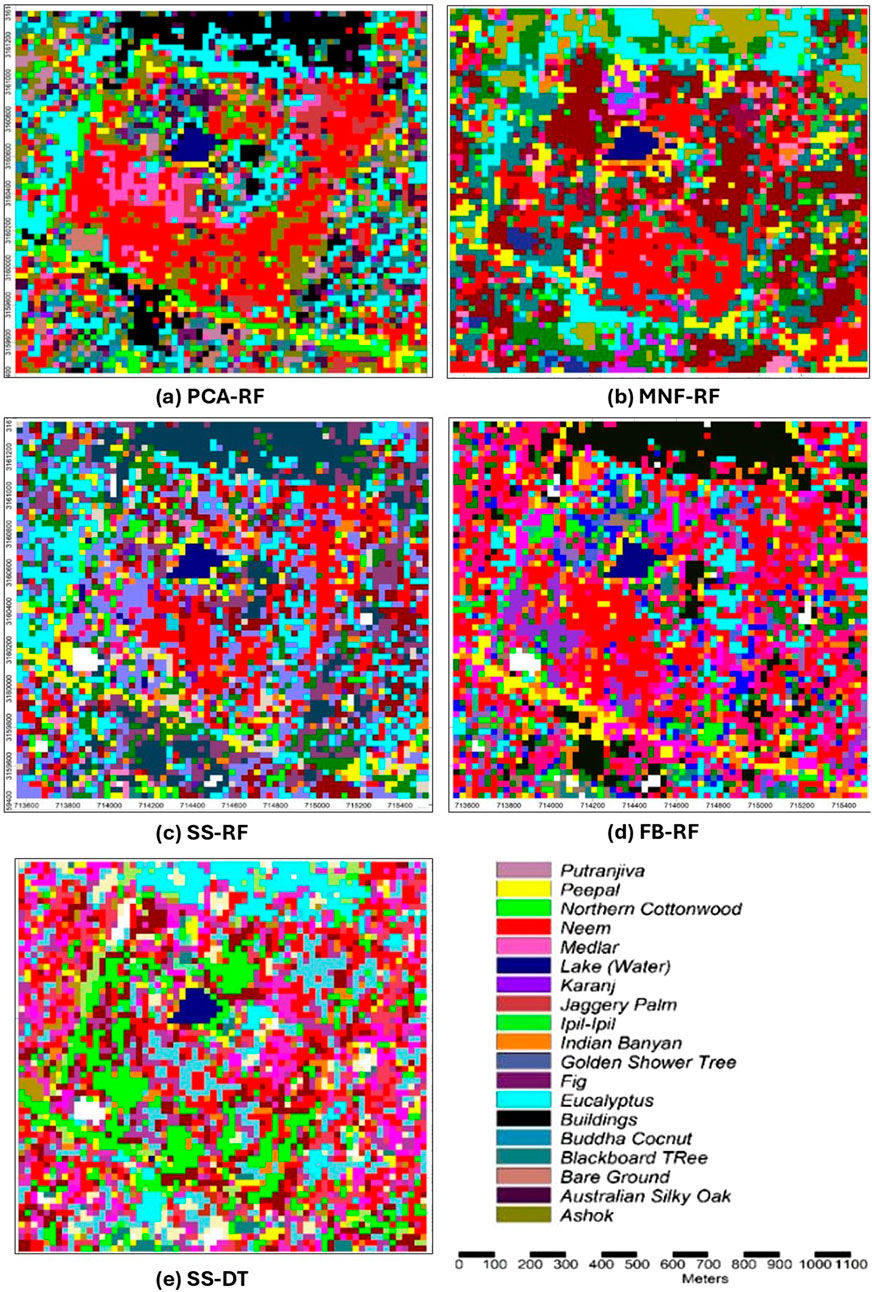
Figure 5. Classification maps generated by top classifiers. (a) PCA-RF. (b) MNF-RF. (c) SS-RF. (d) FB-RF. (e) SS-DT.
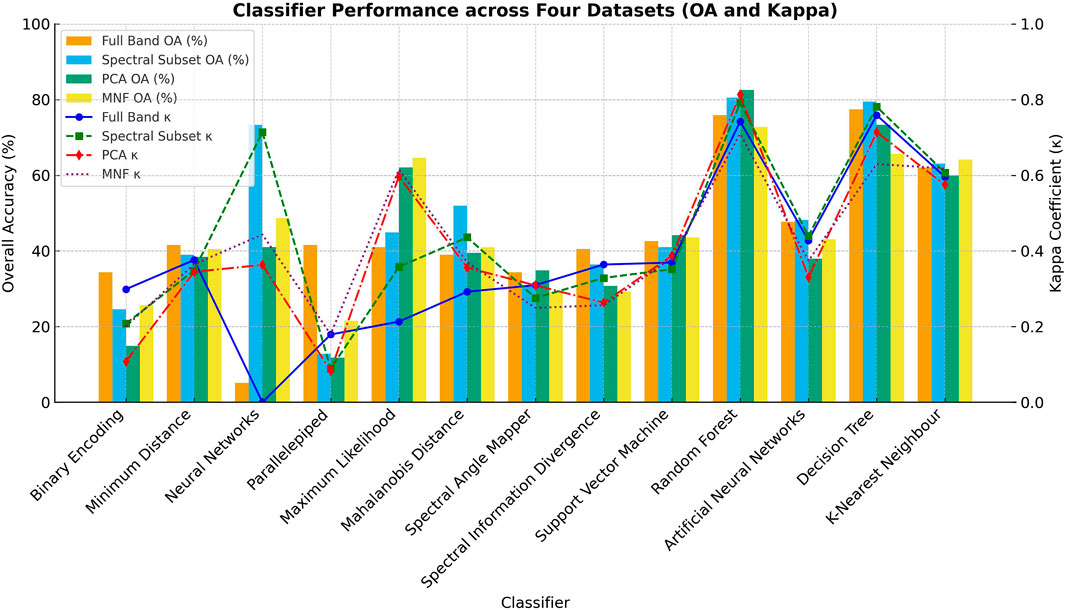
Figure 6. Classification performance across four datasets.
5.2 Species-level classification performance
Table 2 summarizes the species-level classification performance results using the optimal classifier–dataset combinations, showing Overall Accuracy (OA), Producer’s Accuracy (PA), and User’s Accuracy (UA) for 21 urban tree species ranked by mean accuracy. The results highlight the best-performing classifier–dataset combinations and demonstrate the influence of dimensionality reduction techniques on species discrimination shown in Figure 7.
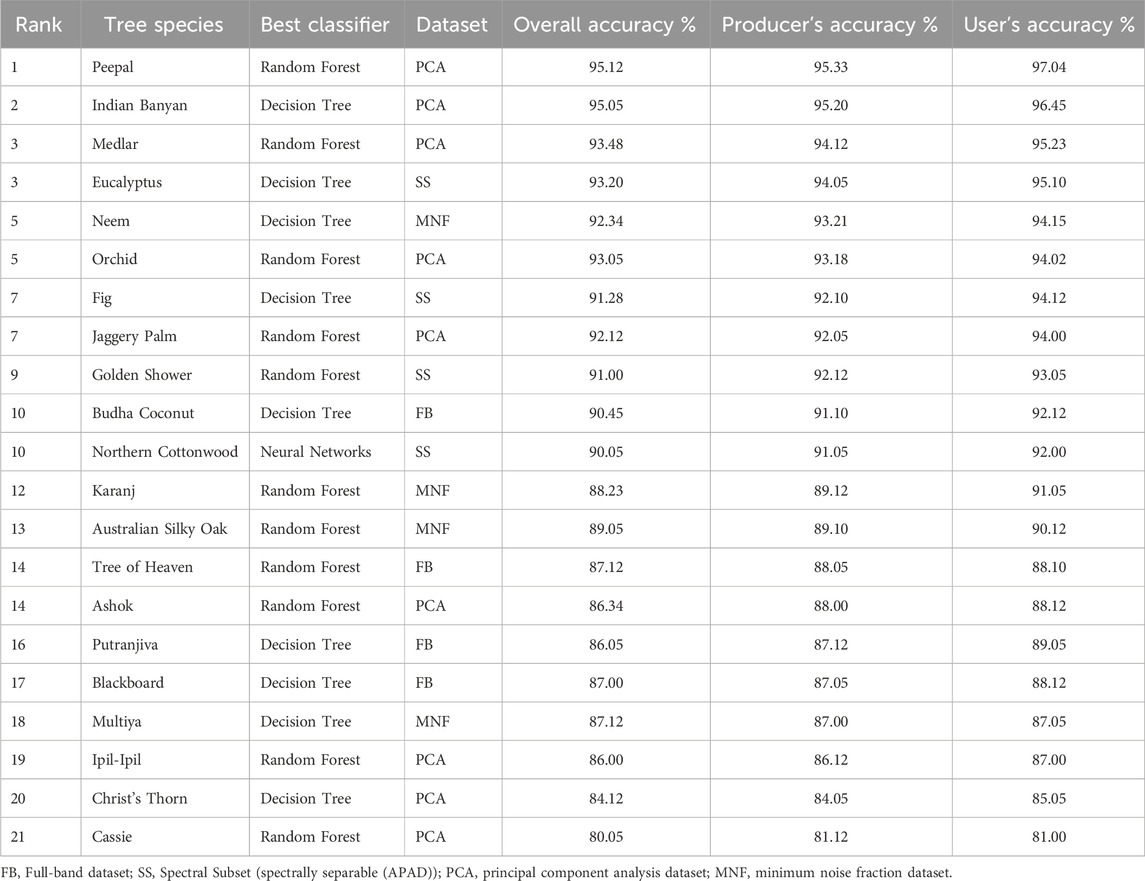
Table 2. Species-level classification performance with best classifier and type of dataset.
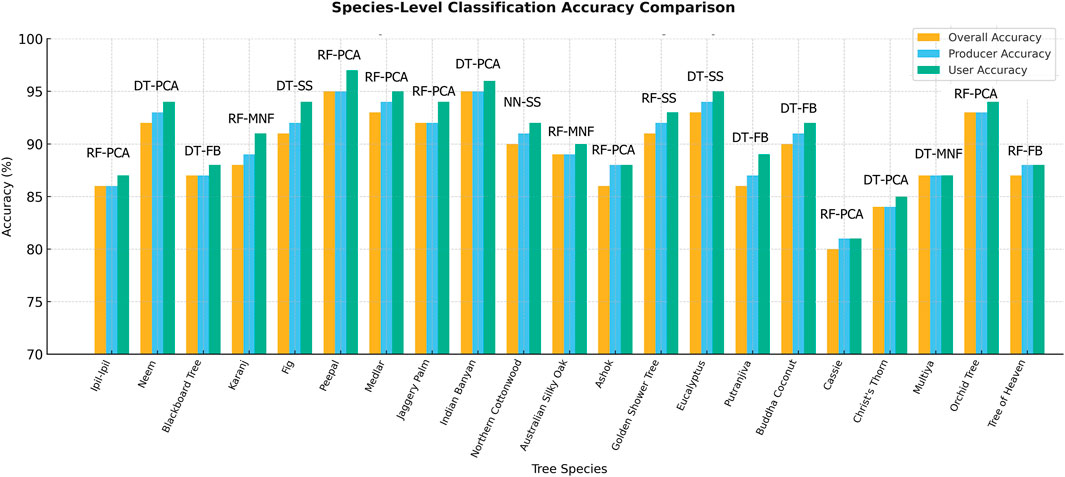
Figure 7. Species-wise classification performance with optimal classifier–dataset combinations.
Ensemble-based classifiers—Random Forest (RF) and Decision Tree (DT)—dominated the overall performance, achieving ≥86% Overall Accuracy (OA) for 16 out of 21 species. Among these, Peepal and Indian Banyan achieved the highest accuracies (95% OA and PA) using PCA-transformed datasets with RF and DT classifiers, respectively. This finding reinforces the strength of ensemble learning methods in modeling non-linear spectral responses inherent to hyperspectral data. Species such as Neem and Eucalyptus also exhibited strong classification performance, achieving >92% OA with MNF and Spectral Subset (SS) datasets, respectively. These outcomes indicate that both PCA and MNF effectively reduce spectral redundancy and noise while retaining essential discriminatory information for species-level classification. Moderate-performing species, including Tree of Heaven, Multiya, and Christ’s Thorn, attained OA values around 87% using Full Band or MNF datasets. The lower accuracies observed for these species can be attributed to their overlapping spectral signatures and mixed-pixel effects due to canopy intermixing within 30 m Hyperion pixels.
Overall, RF consistently produced stable and high accuracies across multiple datasets, attributed to its ensemble averaging and resistance to overfitting (Breiman, 2001). DT, while slightly more sensitive to noise, provided comparable performance and computational efficiency, making it particularly suitable for rapid classification of large hyperspectral datasets. Neural Networks demonstrated satisfactory performance (90% OA) for Northern Cottonwood, suggesting their potential for species with distinct spectral–structural features.
The comparative analysis confirms that PCA and MNF transformations substantially improve classification reliability by enhancing inter-class separability and minimizing within-class variability. Furthermore, the APAD-based Spectral Subset effectively supported species with subtle spectral differences, such as Eucalyptus and Fig, highlighting its utility for targeted band selection. In summary, the integration of dimensionality reduction with ensemble-based classifiers achieved the highest overall classification efficiency. The combination of RF and PCA emerged as the most effective strategy for species-level mapping in heterogeneous urban forest conditions, ensuring both accuracy and computational practicality.
5.3 Spectral separability among tree species
Using the Average Pairwise Absolute Difference (APAD) metric, 210 unique species-pair separability scores were computed across 167 bands. The analysis revealed several species pairs—such as Cassie and Christ’s Thorn and Multiya and Neem—with higher APAD values, indicating enhanced inter-species separability. These pairs were instrumental in guiding band selection and the development of species-specific ratio indices.
Although APAD does not incorporate intra-class variance, it effectively captured meaningful inter-species contrast. Species pairs such as Cassie–Christ’s Thorn, Multiya–Christ’s Thorn, and Neem–Tree of Heaven exhibited correlation coefficients between 0.4 and 0.6, suggesting substantial potential for discrimination via band ratios or supervised classifiers. The least correlated species pairs—Cassie–Christ’s Thorn, Multiya–Christ’s Thorn, Tree of Heaven–Christ’s Thorn, Cassie–Neem, Multiya–Neem, Cassie–Blackboard Tree, and Orchid Tree–Cassie—represent the most promising candidates for targeted separability enhancement. Although no pair achieved orthogonal spectral distinction, these moderate decorrelation levels demonstrate the usefulness of APAD in identifying separable spectral regions.
A key limitation lies in the coarse 30 m spatial resolution of EO-1 Hyperion, where each pixel may encompass multiple tree crowns, introducing mixed-pixel effects that reduce separability. Ground-truth field data, APAD-based band selection, and band-ratio indices were therefore critical in improving classification reliability. Despite residual uncertainty, this approach successfully enhanced inter-species separability under sensor limitations.
5.4 Band ratio index insights
Optimal band-ratio indices were developed to further enhance discrimination between spectrally similar species. Ratios were derived by pairing bands with low inter-correlation and high mean reflectance contrast, as determined from 167 bands of Hyperion imagery. These ratios provide interpretable, physically meaningful features for vegetation index design and decision-rule formulation. The following ratios were found to be most discriminative:
Christ’s Thorn: B23/B92; Ipil-Ipil: B92/B134; Neem: B2/B93; Blackboard Tree: B52/B166; Cassie: B69/B92; Karanj: B54/B166; Fig: B79/B131; Peepal: B53/B132; Medlar: B24/B92; Jaggery Palm: B1/B92; Indian Banyan: B53/B92; Northern Cottonwood: B3/B138; Australian Silky Oak: B51/B163; Orchid Tree: B37/B92; Ashok: B1/B53; Golden Shower Tree: B122/B132; Eucalyptus: B24/B105; Putranjiva: B92/B140; Buddha Coconut: B2/B92; Multiya: B80/B93; Tree of Heaven: B1/B95.
Among these, Band 92 (near-infrared region) frequently appeared in denominator positions, reflecting its strong discriminative ability due to high reflectance sensitivity to vegetation structure and moisture content.
5.5 Ecological and management implications of classification outcomes
The classification results provide ecological insights relevant to urban forest monitoring and management. Accurate species-level mapping enhances understanding of urban forest composition, resilience, and biodiversity distribution. The ability to distinguish native species such as Neem (Azadirachta indica) and Peepal (Ficus religiosa) from exotic or invasive taxa supports informed decision-making in reforestation and conservation initiatives, thereby contributing to ecological balance and urban sustainability. High-accuracy classification maps also enable improved estimation of urban biomass, canopy health, and carbon sequestration potential—key parameters for green GDP assessment and climate-resilient urban planning. The demonstrated success of ensemble classifiers highlights the potential of hyperspectral remote sensing as a reliable decision-support tool for urban forest management, guiding targeted species planting, stress detection, and biodiversity restoration.
5.6 Methodological insights and future directions
The integration of ensemble classifiers—particularly Random Forest (RF) and Decision Tree (DT)—demonstrated superior accuracy and robustness, confirming their suitability for scalable species-level classification in spectrally complex urban ecosystems. The combination of Average Pairwise Absolute Difference (APAD)-based band selection and species-specific band-ratio indices proved effective in enhancing spectral separability, offering a transferable framework for vegetation discrimination even when using moderate-resolution hyperspectral data such as EO-1 Hyperion.
Despite these promising results, two methodological limitations were identified. First, the single-date Hyperion acquisition constrains analysis to a single phenological phase, limiting the ability to capture seasonal dynamics such as leaf emergence, flowering, or senescence. Second, while APAD effectively quantified inter-species spectral separability, it does not account for intra-class variance, partly due to mixed pixels in the 30 m Hyperion imagery limiting homogeneous samples for variance-based statistics. Although deep learning architectures—such as Convolutional Neural Networks (CNNs), deformable CNNs, and hybrid CNN–Transformer networks (Wang et al., 2021; Chen et al., 2023; Li et al., 2023; Sun et al., 2024)—have shown excellent potential for hyperspectral classification, their effective deployment requires large labeled datasets and substantial computational resources. Given the limited ground-truth samples and mixed-pixel constraints, this study prioritized computationally efficient fast-learning classifiers. Future research could integrate deep learning with high-resolution multispectral or hyperspectral data and LiDAR-derived structural metrics to further enhance species-level discrimination and support scalable, operational urban forest monitoring.
6 Conclusion
This study presented an effective and scalable framework for species-level classification using EO-1 Hyperion hyperspectral imagery in the heterogeneous Hauz Khas urban forest. A comprehensive comparative analysis of thirteen supervised classifiers across four datasets—Full Band, Spectral Separability Subset(APAD-based), PCA, and MNF—revealed that ensemble learning algorithms, particularly Random Forest (RF) and Decision Tree (DT), consistently outperformed traditional statistical and spectral classifiers. RF classifier applied to PCA-transformed data achieved the highest overall accuracy (82.56%) with a Kappa coefficient of 0.81, while DT achieved superior per-species accuracies for Neem and Indian Banyan. The APAD metric proved highly effective for quantifying inter-species spectral separability, guiding optimal band selection, and supporting the derivation of species-specific band-ratio indices that enhanced classification performance. Furthermore, PCA and MNF-based dimensionality reduction preserved inter-class spectral variance while reducing redundancy and noise, thereby improving classification robustness and computational efficiency.
Despite the inherent 30 m spatial resolution constraint and mixed-pixel effects of Hyperion imagery, the integrated use of APAD-based band selection, band-ratio indices, and ensemble classifiers proved to be a reproducible, interpretable, and operationally viable approach for tree species mapping in spectrally complex urban environments. This study underscores the continued relevance of fast-learning classifiers, which are computationally efficient and effective under limited ground-truth conditions, particularly for legacy hyperspectral datasets. Future research should extend this framework by incorporating deep learning architectures, such as convolutional neural networks (CNNs) and hybrid CNN–Transformer models, in conjunction with high-spectrospatial-resolution hyperspectral data to further improve species-level discrimination and scalability in urban forest monitoring. Overall, this work demonstrates that fast-learning ensemble classifiers, when optimized through spectral separability–driven feature selection, remain highly effective for legacy hyperspectral missions and provide a strong foundation for next-generation, deep-learning–enabled hyperspectral analysis and urban forest monitoring systems.
Data availability statement
The original contributions presented in the study are included in the article/Supplementary Material, further inquiries can be directed to the corresponding author.
Author contributions
VB: Resources, Writing – review and editing, Formal Analysis, Validation, Writing – original draft, Funding acquisition, Visualization, Project administration, Data curation, Supervision, Methodology, Software, Conceptualization, Investigation. SM: Validation, Formal Analysis, Writing – review and editing, Supervision. SS: Formal Analysis, Writing – review and editing, Investigation. PK: Software, Writing – review and editing. AN: Writing – review and editing, Data curation, Formal Analysis, Project administration.
Funding
The author(s) declare that no financial support was received for the research and/or publication of this article.
Acknowledgments
The authors would like to express their sincere gratitude to Ajay Kaushik, CEO of Panacea Infosec, for his valuable encouragement and support throughout this project. The authors also acknowledge Ayushi, TERI University for providing technical assistance and the United States Geological Survey (USGS), Earth Explorer, for data support.
Conflict of interest
Authors VB, SM, MS, SS and PK were employed by company Panacea Geospatial Solutions. Author MS was employed by Panacea Bioedge.
The remaining author declares that the research was conducted in the absence of any commercial or financial relationships that could be construed as a potential conflict of interest.
Generative AI statement
The author(s) declare that no Generative AI was used in the creation of this manuscript.
Any alternative text (alt text) provided alongside figures in this article has been generated by Frontiers with the support of artificial intelligence and reasonable efforts have been made to ensure accuracy, including review by the authors wherever possible. If you identify any issues, please contact us.
Publisher’s note
All claims expressed in this article are solely those of the authors and do not necessarily represent those of their affiliated organizations, or those of the publisher, the editors and the reviewers. Any product that may be evaluated in this article, or claim that may be made by its manufacturer, is not guaranteed or endorsed by the publisher.
Supplementary material
The Supplementary Material for this article can be found online at: https://www.frontiersin.org/articles/10.3389/fenvs.2025.1668746/full#supplementary-material
References
Ballanti, M., Byrd, K., Choe, K., and Kelly, M. (2016). Comparing SVM and RF for hyperspectral classification. ISPRS J. Photogrammetry Remote Sens. 120, 111–121. doi:10.1016/j.isprsjprs.2016.08.002
Breiman, L., Friedman, J. H., Olshen, R. A., and Stone, C. J. (1984). Classification and regression trees (CART). Belmont, CA: Wadsworth International Group.
Bruzzone, L., Roli, F., and Serpico, S. B. (2003). A comparative analysis of SVM and other methods for remote sensing classification. IEEE Int. Geoscience Remote Sens. Symposium (IGARSS) 2, 1134–1136. doi:10.1109/IGARSS.2003.1294006
Camps-Valls, R., and Bruzzone, L. (2005). Kernel-based methods for hyperspectral image classification. IEEE Trans. Geoscience Remote Sens. 43 (6), 1351–1362. doi:10.1109/TGRS.2005.846154
Cetin, A., and Yastikli, N. (2022). Urban tree classification using LiDAR and machine learning. IEEE J. Sel. Top. Appl. Earth Observations Remote Sens. 15 (2), 2334–2345. doi:10.1109/JSTARS.2022.3146031
Chen, L., Zhao, Q., and Liu, S. (2023). Transformer-based spectral–spatial attention networks for hyperspectral image classification. ISPRS J. Photogrammetry Remote Sens. doi:10.1016/j.isprsjprs.2023.103537
Congalton, R. G. (1991). A review of assessing the accuracy of classifications of remotely sensed data. Remote Sens. Environ. 37 (1), 35–46. doi:10.1016/0034-4257(91)90048-B
Cover, T., and Hart, P. (1967). Nearest neighbor pattern classification. IEEE Trans. Inf. Theory 13 (1), 21–27. doi:10.1109/TIT.1967.1053964
FAO (2022). The state of the world’s forests 2022: Forest pathways for green recovery and building inclusive, resilient and sustainable economies. Rome: Food and Agriculture Organization of the United Nations. doi:10.4060/cb9360en
Fu, H., Zhang, A., Sun, G., Ren, J., Jia, X., Pan, Z., et al. (2022). A novel band selection and spatial noise reduction method for hyperspectral image classification. IEEE Trans. Geosci. Remote Sens. 60, 5535713. doi:10.1109/TGRS.2022.3189015
Green, A. A., Berman, M., Switzer, P., and Craig, M. D. (2009). A transformation for ordering multispectral data in terms of image quality with implications for noise removal. Remote Sens. Environ. 113 (7), 1453–1461. doi:10.1016/j.rse.2009.03.008
Guan, H., Yu, Y., Ji, Z., and Li, J. (2020). Performance evaluation of MLE, RF and SVM classification algorithms for watershed scale land use/land cover mapping using sentinel 2 bands. Remote Sens. Appl. Soc. Environ. 19, 100351. doi:10.1016/j.rsase.2020.100351
Harris Geospatial Solutions (2015). ENVI user’s guide: atmospheric correction module (FLAASH). Boulder, CO: Harris Geospatial Solutions.
Kumar, V., Thenkabail, P. S., and Singh, R. B. (2020). Dimensionality reduction in hyperspectral imaging. J. Indian Soc. Remote Sens. 48 (1), 1–12. doi:10.1007/s12524-019-01006-1
Landgrebe, D. (2002). Hyperspectral image data analysis. IEEE Signal Process. Mag. 19 (1), 17–28. doi:10.1109/79.974718
Lee, C., and Plaza, A. (2012). PCA-based feature extraction for hyperspectral image classification. IEEE Trans. Geoscience Remote Sens. 50 (2), 420–434. doi:10.1109/TGRS.2011.2160083
Li, W., Fu, H., Yu, L., and Cracknell, A. (2022). Deep and shallow learning for hyperspectral image classification: a comparative review. ISPRS J. Photogrammetry Remote Sens. 183, 163–182. doi:10.1016/j.isprsjprs.2021.11.012
Li, J., Wang, X., and Zhang, Y. (2023). Hybrid deformable CNN for hyperspectral classification under limited samples. Earth Sci. Inf. doi:10.1007/s12145-023-01074-z
Ma, M., Wang, L., Zhang, Y., Wu, C., and Zhao, Y. (2021). Urban tree species mapping using airborne hyperspectral and LiDAR data. ISPRS J. Photogrammetry Remote Sens. 172, 183–194. doi:10.1016/j.isprsjprs.2020.12.020
Ma, J., Pan, J., Chen, Y., Zhang, H., Chen, C., Wu, Y., et al. (2024). A spatial–spectral transformer for hyperspectral image classification based on global dependencies of multi-scale features. Remote Sens. 16 (2), 404. doi:10.3390/rs16020404
Melgani, F., and Bruzzone, L. (2004). Classification of hyperspectral remote sensing images with support vector machines. IEEE Trans. Geoscience Remote Sens. 42 (8), 1778–1790. doi:10.1109/TGRS.2004.831865
PlantNet (2023). PlantNet – the plant identification app. Available online at: https://identify.plantnet.org/.
Priedītis, G., Jansons, A., Liepins, K., and Zalitis, T. (2015). Tree species classification using hyperspectral data. Remote Sens. Environ. 145, 123–135. doi:10.1016/j.rse.2014.11.019
Quinlan, J. R. (1986). Induction of decision trees. Mach. Learn. 1 (1), 81–106. doi:10.1007/BF00116251
Rumelhart, D. E., Hinton, G. E., and Williams, R. J. (1986). Learning representations by back-propagating errors. Nature 323, 533–536. doi:10.1038/323533a0
Sun, T. Y., Zhang, B., and Du, Q. (2019). Development of a new embedded dynamometer for the measurement of forces and torques at the ski-binding interface. Sensors 19 (19), 4324. doi:10.3390/s19194324
Sun, T., Lin, F., and Zhou, P. (2024). CNN-transformer fusion for hyperspectral wetland vegetation mapping. Front. Remote Sens. doi:10.3389/frsen.2024.00456
Tong, F., and Zhang, Y. (2024). Tree species classification with fewer training samples using hyperspectral data. ISPRS Archives XLVIII-M-4-2024 (2), 71–76. doi:10.5194/isprs-archives-xlviii-m-4-2024-71-2024
Vapnik, V. (1995). The nature of statistical learning theory. New York, NY: Springer. doi:10.1007/978-1-4757-2440-0
Wang, L., Zhong, M., Zhang, Z., and Li, D. (2019). Hot spot analysis versus cluster and outlier analysis: an enquiry into the grouping of rural accommodation in Extremadura (Spain). ISPRS Int. J. Geo-Information 8 (4), 176. doi:10.3390/ijgi8040176
Wang, W., Zhang, H., Li, Y., and Liu, J. (2021). SVM vs. CNN for hyperspectral classification. Int. J. Remote Sens. 42 (17), 6720–6735. doi:10.1080/01431161.2021.1944129
Xia, J., Hu, J., Tang, X., Zhu, D., and Holben, B. (2020). GOES-16 ABI solar reflective channel validation for earth science application. Remote Sens. Environ. 237, 111438. doi:10.1016/j.rse.2019.111438
Xie, X., Wang, J., Chen, C., Wang, Z., Liu, J., Sun, D., et al. (2023). HyperSFormer: a transformer-based end-to-end hyperspectral image classification method for crop classification. Remote Sens. 15 (14), 3491. doi:10.3390/rs15143491
Zhang, B., Wang, L., Hao, P., and Wu, L. (2007). Feature selection using Bhattacharyya distance for hyperspectral image classification. IEEE Geoscience Remote Sens. Lett. 4 (3), 491–495. doi:10.1109/LGRS.2007.896322
Zhang, X., Sun, W., Du, B., and Zhang, L. (2021). Spatial-spectral transformer for hyperspectral image classification. Remote Sens. 13 (3), 498. doi:10.3390/rs13030498
Keywords: hyperspectral imagery, EO-1 hyperion, urban forest, species-level classification, spectral separability, random forest (RF), decision tree (DT), principal component analysis (PCA)
Citation: Balabathina VN, Mishra S, Sharma M, Sharma S, Kumar P and Narayan A (2025) Comparative evaluation of fast-learning classification algorithms for urban forest tree species identification using EO-1 hyperion hyperspectral imagery. Front. Environ. Sci. 13:1668746. doi: 10.3389/fenvs.2025.1668746
Received: 18 July 2025; Accepted: 14 October 2025;
Published: 29 October 2025.
Edited by:
Jianxin Jia, Finnish Geospatial Research Institute, FinlandReviewed by:
Emilio Ramírez-Juidías, Universidad de Sevilla Instituto Universitario de Arquitectura y Ciencias de la Construccion, SpainXiaorou Zheng, South China University of Technology, China
Copyright © 2025 Balabathina, Mishra, Sharma, Sharma, Kumar and Narayan. This is an open-access article distributed under the terms of the Creative Commons Attribution License (CC BY). The use, distribution or reproduction in other forums is permitted, provided the original author(s) and the copyright owner(s) are credited and that the original publication in this journal is cited, in accordance with accepted academic practice. No use, distribution or reproduction is permitted which does not comply with these terms.
*Correspondence: Veera Narayana Balabathina, dmJhbGFiYXRoaW5hQHBhbmFjZWFnZW9zcGF0aWFsLmNvbQ==