 Gunnar Brandt
 Agostino Merico
- 1Systems Ecology, Leibniz Center for Tropical Marine Ecology, Bremen, Germany
- 2School of Engineering and Science, Jacobs University, Bremen, Germany
The history of Easter Island and its supposed social-ecological collapse is often taken as a grim warning for the modern world. However, while the loss of a once lush palm forest is largely uncontested, causes and timing of the collapse remain controversial, because many paleoecological and archaeological data are afflicted with considerable uncertainties. According to a scenario named ecocide, the overharvesting of palm trees triggered a dramatic population decline, whereas a contrasting view termed genocide deems diseases and enslavement introduced by Europeans as the main reasons for the collapse. We propose here a third possibility, a slow demise, in which aspects of both ecocide and genocide concur to produce a long and slow decline of the society. We use a dynamic model to illustrate the consequences of the three alternatives with respect to the fate of the paleoecological system of the island. While none of the three model scenarios can be safely ruled out given the uncertainties of the available data, the slow demise appears to be the most plausible model scenario, in particular when considering the temporal pattern of deforestation as inferred from radiocarbon dates of charcoal remains.
1. Introduction
Easter Island, called Rapa Nui by its natives, has a contentious and elusive history despite the considerable archaeological and paleoecological research efforts undertaken over the last decades. Hundreds of giant statues known as moai (Flenley and Bahn, 2003) rising from a treeless landscape cloak the island's history in a shroud of mystery. Is Easter Island a paradigm for a Malthusian collapse or rather for a sustainable use of resources? Is it a parable for the human ruthlessness toward a fragile environment or yet another example of an early society destroyed by colonialism and slavery (Bahn and Flenley, 1992; Flenley and Bahn, 2003; Diamond, 2005; Hunt, 2007; McAnany and Yoffee, 2010; Mieth and Bork, 2010)? The answers to these questions have been attributed importance far beyond the specific case as Easter Island has been considered a general model of human-environment interactions on a global scale (Bahn and Flenley, 1992; Kirch, 1997; Rainbird, 2002).
While palynological analyses (Flenley and King, 1984; Flenley et al., 1991; Mann et al., 2008) and radiocarbon dates of charcoal remains (Mann et al., 2003; Mieth and Bork, 2004, 2005; Rolett and Diamond, 2004; Hunt and Lipo, 2006; Mulrooney, 2013) confirm reports of the first eye witnesses (Hunt, 2007) that the island was almost entirely deprived of its forest by the time Europeans discovered it in 1722 AD, there is no reliable evidence about the precise temporal dynamics of the human population and the timing of a potential collapse.
Not surprisingly, therefore, the two most commonly contended scenarios concerning the fate of the society, ecocide (Flenley and Bahn, 2003; Diamond, 2005) and genocide (Peiser, 2005; Hunt, 2007; Hunt and Lipo, 2011), differ greatly in the assumed population dynamics as well as in the causes for a demographic collapse, advocating respectively overexploitation of resources and the combined effects of introduced diseases and slavery. A plausible reconstruction of the population dynamics is, however, central to the notion of collapse, at least in an ecological or demographic sense (Middleton, 2012), and hence key for a comprehensive understanding of the island's past. The contrasting mechanisms for collapse reflect the strongly diverging assumptions regarding the ability of the islanders to sustainably manage their ecological resources and to adapt to environmental change.
According to the ecocide scenario, the human population increased steadily over several centuries and peaked at 15000 or even more (Diamond, 2005) before a rapid and drastic collapse occurred around 1680 AD (Heyerdahl and Ferdon, 1961; Flenley and Bahn, 2003; Diamond, 2005), i.e., at least three decades before the Europeans first set foot on the island. The human population grew too large to be sustained by the primary resource, the palm forest, and when the last tree was cut down a dramatic fall, supposedly accompanied by violence and intertribal warfare, followed (Bahn and Flenley, 1992; Flenley and Bahn, 2003; Diamond, 2005). While it is obvious that the islanders were not directly living from palm trees, the forest provided several valuable and difficult to substitute ecological services, including food from fruits and palm nuts, timber to construct houses and sea-going canoes for fishing (Flenley and Bahn, 2003), fuel (Orliac, 2000), nutrients for the meager soils after slash-and-burn clearance (Mieth and Bork, 2010), and the prevention of soil erosion (Stevenson et al., 2006). Moreover, the declining forest could have reduced also the rat population, which was probably brought in intentionally as a food item by the Polynesian colonists (Matisoo-Smith and Robins, 2004).
The decline of the palm forest might have complicated the survival of the islanders and urged them to adapt to the changing environment. Estimates of the population size reported by visitors in the decades following 1722 AD differ widely, ranging roughly between 600 and 2000 (Flenley and Bahn, 2003). Diamond (2005), however, proposes considerably higher numbers based on a population size of 2000 in 1864 AD, which was estimated by two missionaries after at least three smallpox epidemics and the devastating Peruvian slave raids of 1862 and 1863 AD.
In contrast, the genocide view asserts that the human population remained stable on a much lower level around 4000 for most of the period preceding the arrival of the Europeans (Hunt, 2007; Hunt and Lipo, 2011). A sequence of population overshoot and collapse is rejected based on a lack of direct evidence (Rainbird, 2002; Hunt, 2007; Hunt and Lipo, 2011). Deforestation is then attributed to humans and to a rapidly growing population of the Pacific rat (Steadman et al., 1994; Barnes et al., 2006), which effectively reduced the fertility of the forest by feeding on palm seeds (Hunt, 2007; Athens, 2009). The introduction of the rats hence made the fragile island ecosystem more vulnerable to anthropogenic change (Rolett and Diamond, 2004). However, relicts of extensive agriculture (Ladefoged et al., 2013) indicate the establishment of a sustainable livelihood while large parts of the forest were disappearing. The ultimate, determining reason for the eventual collapse of the human population is considered to be the arrival of Europeans who introduced devastating diseases and slavery (Diamond, 2005; Hunt, 2007).
We propose here a third possibility, a slow demise, which comprises aspects of both ecocide and genocide and is in line with very recent findings (Mulrooney, 2013) questioning a sudden, ecological and societal change prior to the island's discovery by Europeans. Under this scenario, the human population grew rapidly only during the first two centuries until reaching unsustainable numbers. Instead of a collapse, however, the human population experienced a slow and continuous decline, which lasted for the following three centuries. The arrival of Europeans therefore worsened the situation of a society that had been under the persistent stress of adaptation to the continuous depletion of the valuable services provided by the forest.
Based on recent archaeological evidence (Ladefoged et al., 2013), it is reasonable to consider that in all three scenarios islanders were able to develop agricultural practices that allowed them to meet a major part of their nutritional demand. The relative importance of the forest resource and of agriculture for the survival of the human population, however, may vary greatly depending on the different assumptions upon which the scenarios are founded.
We developed a mathematical model that accounts for the major elements of Easter Island's past paleoecology in order to explore the plausibility of the three scenarios also with respect to existing gaps and uncertainties in the available observational data. In line with the recent suggestions of Larsen and Simpson (2014), our ultimate aim here is to help broadening the “range of interpretive techniques” by using quantitative explorations of model scenarios.
The model is developed from the work of Basener et al. (2008) and consists of a set of coupled ordinary differential equations for the populations of humans, rats, and palm trees. The novel components of the model include agriculture as a means to sustain the human population and a simple epidemics module to account for the effect of introduced diseases. We created three scenarios that reproduce the distinct narratives in terms of the proposed human population dynamics as closely as possible. The three scenarios only differ by their parameterizations, but the underlying model formulation and structure are the same for all scenarios.
In contrast to most previous modeling studies on Easter Island (Brander and Taylor, 1998; Anderies, 2000; Dalton and Coats, 2000; Reuveny and Decker, 2000; Basener and Ross, 2004; D'Alessandro, 2007; Basener et al., 2008; Sprott, 2011; Motesharrei et al., 2014), we evaluate the simulations by comparing the model results against two compilations of radiocarbon dates (Hunt and Lipo, 2006; Mulrooney, 2013), because the frequency distribution of these radiocarbon dates provide a temporally resolved estimate of the forest clearance intensity, which can be directly compared to the forest clearance rate predicted by the model. Unlike other studies (Collard et al., 2010; Mulrooney, 2013; Shennan et al., 2013), therefore, we do not consider the radiocarbon frequencies as an indication of the size of the human population, but rather of the islanders' clearance activities. Being aware of the potential pitfalls in using radiocarbon dates as proxies for human activities (Surovell and Brantingham, 2007; Armit et al., 2013), we ascribe more importance to the similarity in the general form of the frequency distribution and the modeled clearance rate than to high frequency fluctuations, which may be due to sampling biases, the calibration curve, or the binning of the data.
Finally, the timing of the events simulated by our model is based on a recently reconstructed colonization chronology of Easter Island, which dates the arrival of the first Polynesians at around 1200 AD (Hunt and Lipo, 2006; Wilmshurst et al., 2011), although this seems to be still a point of debate given that some authors favor an earlier date (Mulrooney, 2013). In a recent paleoecological study of Lake Raraku sediments, however, (Cañellas Boltà et al., 2013; Rull et al., 2013) found that the main indicators of human presence (i.e., charcoal, as indicator of fires, and the weed Verbena litoralis, of American origin) were already present at ca. 450 BC and that the palm decline since these dates was gradual, rather than abrupt, and elapsed more than 1500 years, rather than three centuries. Note that such a scenario of a much longer chronology, which questions the orthodox opinion on timing but also on the origin of the first settlers, is not considered in our current study.
2. Materials and Methods
2.1. Model
We use an ordinary differential equation model that describes the temporal evolution of the populations of humans P, rats C, and palm trees T to simulate the paleoecological dynamics on Easter Island from the first settlement in 1200 AD to the mid 19th century (Basener et al., 2008). The system of equations is, thus, given by
where rP, rC, and rT respectively denote the growth rates of humans, rats, and palm trees. Palm trees are subject to a constant mortality mT and a variable loss that depends on the size of the human population P and on the specific clearance rate hT.
The growth rates of all three populations are variants of the logistic growth equation with μP, μC, and μT being the maximum growth rates of humans, rats, and palm trees, respectively:
The human carrying capacity is determined by two variable terms, the dimensionless clearance intensity T(T + Ts)−1 and the fraction of cleared land on the island (M − T)M−1, where Ts denotes the clearance half-saturation constant and M is the tree carrying capacity. KA and KT are hence the maximum human carrying capacities of agriculture and the forest, respectively.
The standard logistic equation only allows for positive growth rates thus excluding, by design, the decrease or collapse of populations. In our model, the carrying capacities for humans (Equation 4) and rats (Equation 5) are variable and can cause a shrinking of the corresponding populations when they decrease. By contrast, the carrying capacity for trees is constant and in the absence of humans (i.e., in the absence of deforestation), the island would be always covered by trees regardless of the presence of rats. Athens (2009), however, suggested that rats alone may have been responsible for a decline of a palm forest on the inhabited island of O'ahu (Hawaii). To account for this possibility, we added a small constant mortality of palm trees, which indirectly allows for the adverse impact of rats on palm trees.
Following the aim of building a parsimonious model for Easter Island, we deliberately chose the simplest possible approach by focusing on key resources. While accounting for additional factors like different agricultural techniques, yields of different crops, caloric needs of the islanders, climatic variability, composition of soils, or a social structure would have made our model appear more “realistic,” such an approach would have increased the uncertainties of the model results tremendously because of the much larger number of unknown parameters. Overly complex models are also prone to the problem of overfitting, i.e., they tend to reproduce the noise in the observations instead of the real patterns. Contrary to intuition, such an approach would impair the model skills thus leading to poor insights (Hawkins, 2004).
γ in Equation (5) is a scaling parameter that defines the maximum number of rats a tree can sustain and κ in Equation (6) quantifies the adverse effect that rats feeding on tree seeds have on the growth rate of palm trees. Harvesting hT is a saturating function of T with TS being the number of palm trees at which people reduce forest clearance to half the maximum clearance rate hmax. TS hence defines how sensitive human behavior is to a declining resource or, in other words, how aggressively people exploit their primary resource
Our model comprises an epidemic component in which the human population P is subdivided into susceptible (S), infected (I), and recovered (R) individuals (Kermack and McKendrick, 1932). This describes the effects of introduced European diseases on the non-immune portion of the population after 1722 AD (Hunt, 2007):
For positive growth rates (rP > 0) the SIR model becomes
with the infection rate β, the recovery rate ν, and the mortality rate mI, the latter reflecting the fraction of infected humans not surviving a disease. Offspring lack immunity against European diseases and, thus, enter the population as susceptible S. In contrast, a shrinking as a consequence of a decreasing carrying capacity (cf. Equation 4) affects all people regardless of their health state. The SIR model for rP < 0 is hence given by
I, R, and β are set to zero for the time antecedent the arrival of Europeans, while an initial infection of 10 individuals is assumed in 1722 AD.
2.2. Parameterisation and Sensitivity Analysis
The parameter values used in the model are afflicted with uncertainties as most quantities and processes are not directly measurable for an archaeological system. Nevertheless, reference values for comparable systems, which can be understood as sound estimates, are available for most key parameters. More specifically, the carrying capacities for the human populations are chosen according to the claimed peak populations in the three scenarios and the different contributions of the forest resource and agriculture to the total carrying capacities reflect the contrasting assumptions of the three scenarios. Published reference values are available for the growth rate of ancient populations (3%) (Birdsell, 1957), the density of the Polynesian rat on Hawaii (45 individuals per acre corresponding to approximately 1.8 million individuals for Easter Island) (Wirtz, 1972), the maximum number of trees on Easter Island (16000000) (Mieth and Bork, 2010), the spatial growth rate of a forest in Puerto Rico (0.065 y−1) (Acevedo et al., 2012) and the case-fatality rate for smallpox infections (20–60%) (Barquet and Domingo, 1997). The specific values used for the three scenarios oscillate around the references within reasonable ranges (cf. Table 1).
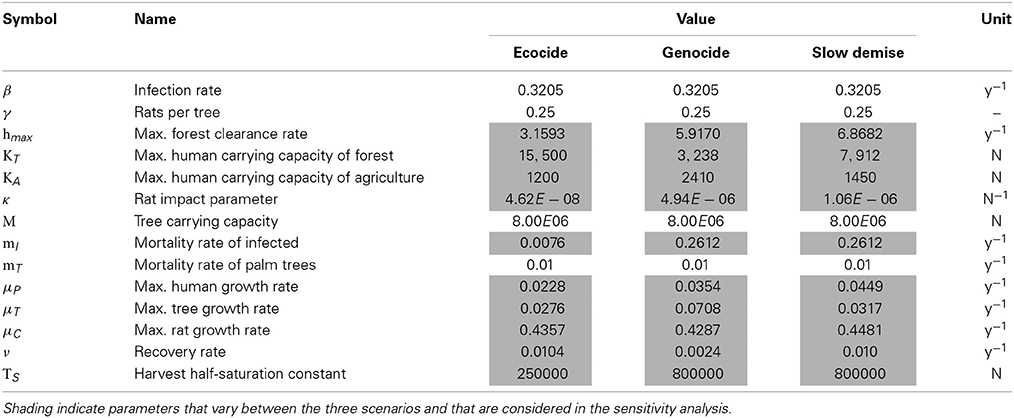
Table 1. Parameter values.
Initial conditions for humans, rats, and trees are 50, 10, and 8000000 individuals, respectively. The initial number of trees corresponds to a conservative 50% of the estimate published by Mieth and Bork (2010). While the initial number of rats does not affect their population dynamics, because of their high growth rate, the initial number of human settlers is more problematic. However, the value of 50 reflects the common opinion that the first Polynesian settlers arrived in a small group of less than 100 individuals (Martinsson-Wallin and Crockford, 2001; Hunt, 2007; Croix and Dottori, 2008).
In order to assess the consequences of parameter uncertainties on the robustness of the model results, the 10 parameters characterizing the three scenarios (cf. Table 1) were subject to a sensitivity analysis. A total of 10000 simulations were performed. The parameter set of each simulation was determined by simultaneously varying all parameters around their standard value following a Monte-Carlo approach. The perturbed values were drawn from a normal distribution with the mean given by the standard value of the respective scenario (cf. Table 1) and with three different standard deviations expressed as a percentage with respect to the mean (6.25, 12.5, and 25.0%). The upper and lower limit of the shaded areas around the time-series (Figures 1A–I, 4A–C) indicate the limits of the 90 and 10% percentiles of all perturbed simulations of the ensemble at any given time. Thus, we exclude 10% of the most extreme values at both ends of the distribution and show the intermediate 80% of all ensemble members.
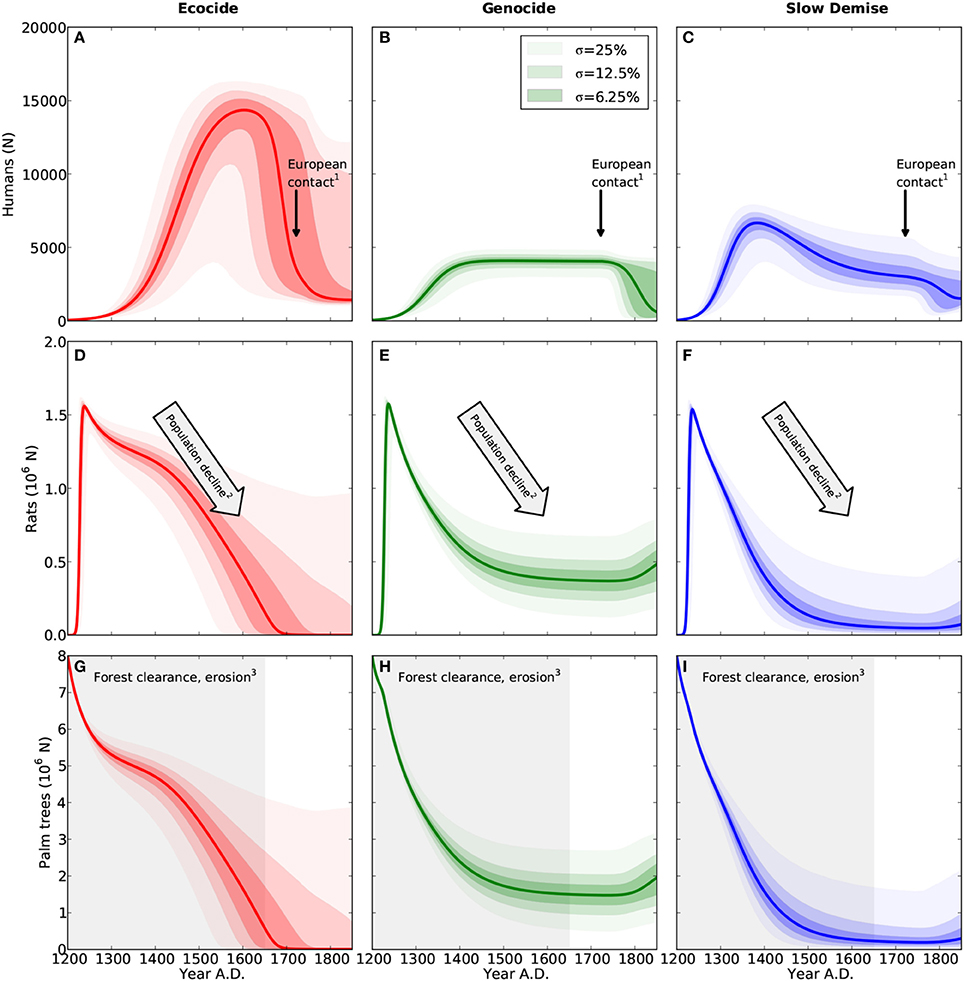
Figure 1. Population dynamics of humans (A–C), rats (D–F), and palm trees (G–I). Results are shown for the three different scenarios ecocide (red), genocide (green), and slow demise (blue). Solid lines present the standard run of the respective scenario (cf. Table 1 for parameter values) and the shaded areas indicate the 10 (lower range) and 90% (upper range) percentile of an ensemble of 10000 simulations with perturbed parameter sets. Dark, intermediate, and light shadings indicate three ensembles with different standard deviations (σ = 6.25, 12.5, and 25%, respectively) of the normal distribution from which the perturbed parameters of the ensemble were drawn. Small numbers indicate references to archaeological evidence. (1) First European contact in 1722 AD (González and Roggeveen, 1908; Heyerdahl and Ferdon, 1961), (2) Large numbers of bones of the commensal Pacific rat in early deposits, declining with time (Hunt, 2007) (and references therein), (3) Evidence for deforestation ceases after 1650 AD (Orliac, 2000; Hunt, 2007; Mann et al., 2008; Mieth and Bork, 2010).
2.3. Radiocarbon Dates
We used two sets of radiocarbon dates from multiple sites on Easter Island compiled by Mann et al. (2003); Mieth and Bork (2004); Hunt and Lipo (2006) and Mulrooney (2013) to estimate a relative frequency of deforestation over time (Table A1). For the first compilation, we use the 2σ confidence intervals reported by the original authors, derive a histogram with a bin size of 25 years, and normalize it with the total number of frequency counts (Figure 2F) so that all bins of the histogram sum up to 1. All data used here are associated with wood charcoal mostly from extinct Jubaea palm remains and/or truncated primeval soils, indicating human induced erosion (see Hunt and Lipo (2006) and their Supplementary Online Material). If not mentioned otherwise, reported results refer to these data.
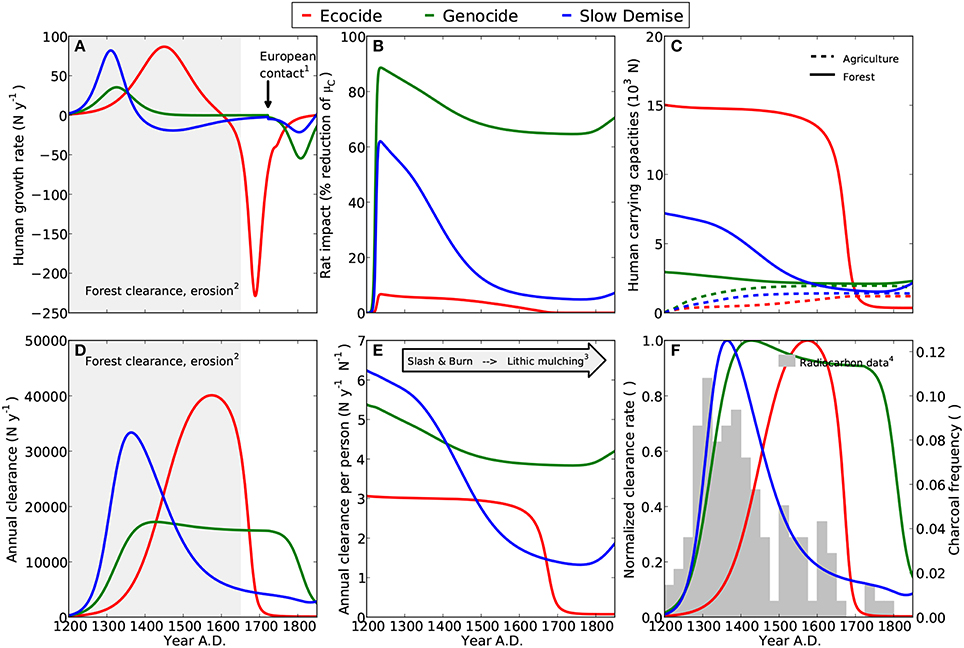
Figure 2. Diagnostics for three model scenarios ecocide (red), genocide (green), and slow demise (blue). Small numbers indicate references to archaeological evidence. (A) Annual growth rates of human population, (1) First European contact in 1722 AD (González and Roggeveen, 1908; Heyerdahl and Ferdon, 1961), (2) Evidence for deforestation completed around 1650 AD (Orliac, 2000; Hunt, 2007; Mann et al., 2008; Mieth and Bork, 2010). (B) Adverse effect of rats on the growth rate of palm trees; here expressed as a percentage reduction of the rat-free tree growth rate. (C) Carrying capacities for humans in relation to the palm forest resource (sold lines) and agriculture (dashed lines). The sum of both determines the potential maximum number of humans. (cf. Equation 4) (D) Annual forest clearance by islanders, (2) see (A). (E) Annual clearance per person, (3) Increasing importance of agriculture to compensate for declining forest (Stevenson et al., 2006; Ladefoged et al., 2013). (F) Comparison of the normalized annual clearance (lines) with the relative frequency of dated charcoal remains (bars) (4) Radiocarbon dates compiled by Hunt and Lipo (2006), see Table A1 and Materials and Methods.
As an alternative compilation, we used the summed probability distribution of calibrated Class 1 dates from the recent, island-wide radiocarbon data by Mulrooney (2013). The great majority of these dates were derived either from wood charcoal or from carbonized nutshells (see Mulrooney, 2013). Model results compared to these data are reported in the Supplementary Material, Figures S1, S2.
3. Results
3.1. Ecocide
Consistent with Flenley and Bahn (2003) and Diamond (2005), who date the demographic collapse at 1680 AD, the simulation of the ecocide produces a peak of the human population at 14600 between 1650 and 1700 AD followed by an abrupt collapse to less than 2000 individuals (Figure 1A). Correspondingly, the net human population growth rate increases steadily, reaches a maximum of about 75N y−1 at around 1450 AD, and stays positive until 1600 AD (Figure 2A). The collapse occurs suddenly and is extremely pronounced. It is caused by the rapid decline of the human carrying capacity of the forest (Figure 2C) and does not encompass intertribal warfare and cannibalism, two mechanisms invoked by the ecocide view (Heyerdahl and Ferdon, 1961; Bahn, 1993; Flenley and Bahn, 2003; Diamond, 2005), but for which evidence is considered inconclusive (Hunt, 2007; Hunt and Lipo, 2011). Nevertheless, the marked negative growth rate is a hint at the extreme conditions that the islanders could have experienced under this scenario. Since the islanders depend much more on the forest than on agriculture in the simulated ecocide, the demographic collapse occurs just when the forest has almost completely disappeared and the annual clearance per person has reached very low values (Figure 2E).
The peaks of forest clearance and of normalized clearance rate (Figures 2D,F, respectively) both occur some decades before the human population has reached its maximum, almost three centuries later than indicated by the charcoal frequency data, and approximately two centuries later than suggested by Diamond (2005). Consequently, the very low values of the normalized clearance rate (which remain below 0.2 until about 1400 AD), coincide with the highest values in the charcoal frequency data, hence revealing an inconsistency between the simulated clearance pattern and the evidence from the radiocarbon data. Assuming that the forest was a primary resource on the island, it appears unlikely that the maxima in deforestation and human population occurred more than three centuries apart. The comparison of the normalized clearance rate with the compilation of radiocarbon dates by Mulrooney (2013) confirms a clear mismatch in the timing of the peaks (see Figure S2 in Supplementary Material).
The rat population rapidly reaches a peak of about 1.6 million and, despite a slight but continuous decline following the decrease in the number of palm trees, remains well above one million during the first three centuries (Steadman et al., 1994; Barnes et al., 2006; Hunt, 2007). Rats exert a negligible impact on the growth of palm trees (Figure 2B and Mieth and Bork, 2010), but their role in the collapse remains inconclusive given the uncertainties in the growth rate parameters of palm trees and humans (Equations 6 and 7).
While the diseases introduced by Europeans spread rapidly among the islanders, the low mortality causes only less than 1000 cumulated deaths between 1722 and 1850 AD (Figure 3A). Note that a higher mortality rate would result in a much smaller human population at the arrival of the Europeans than what Diamond (2005) actually suggested in his reconstruction of the events.
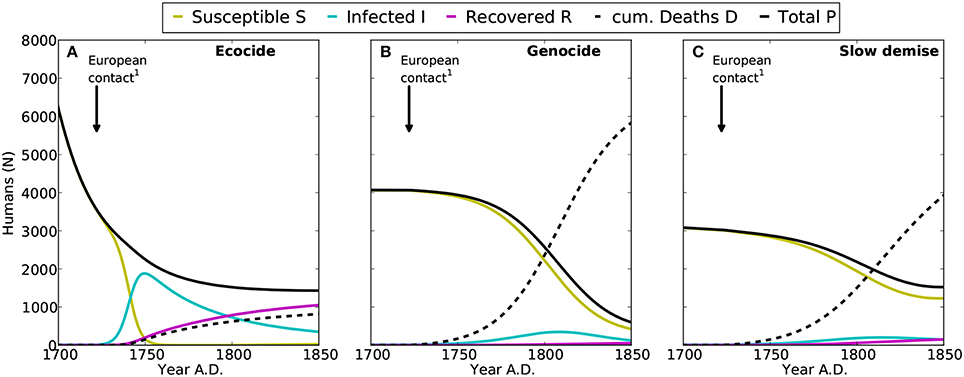
Figure 3. Epidemics of introduced diseases on Easter Island after the first European contact in 1722 AD. Shown are the time-series for susceptible (S, yellow), infected (I, cyan), and recovered (R, purple) humans, with the sum of S, I, and R representing the total population (P, black). Cumulated deaths caused by epidemics since 1722 AD are indicated by D (dashed line). (A–C) denote the results for the ecocide, genocide, and slow demise scenarios, respectively. 1: First European contact in 1722 AD (González and Roggeveen, 1908; Heyerdahl and Ferdon, 1961).
3.2. Genocide
Following Hunt (2007) and Hunt and Lipo (2011), the simulation of the genocide reveals a stable human population of about 4000 individuals before the arrival of Europeans (Figure 1B and see Figure 14 in Hunt, 2007). While humans have a considerable impact on the forest by reducing the number of palm trees from eight million to less than two million between 1200 and 1450 AD, the clearance rate declines only gradually (Figure 2E). The model, thus, suggests that the islanders have no urgent need for a complete change of their livelihood strategy under this scenario. In this model scenario, the 25% of forest that is still present when Europeans arrive reflects an extensive, but incomplete deforestation (Hunt, 2007; Hunt and Lipo, 2011). As suggested in Ladefoged et al. (2013), the exploitation of the forest and the agricultural practice complement each other and contribute equally to the total human carrying capacity of the island, which is here much lower than in the ecocide scenario (cf. Figure 2C). Stable model results between 1400 and 1722 AD (Figures 1B,E,H and Figures 2A,D) indicate an equilibrium between resource extraction and regeneration, which is consistent with the view that the islanders practiced an ecologically sustainable economy (Hunt, 2007; Hunt and Lipo, 2011).
As a result, also deforestation and the normalized clearance rate are stable over a period of almost 350 years and only decline by less than 10% between 1400 and 1722 AD (Figures 2D,F, respectively). While the steep increase in the normalized clearance rate during the first 150 years after initial settlement is in good accordance with the paleoecological evidence, the marked decline in the charcoal frequency distribution is not captured. Instead, deforestation in this scenario ceases after 1722 AD consequently to the human population collapse. The normalized clearance rate is also at odds with the alternative compilation of radiocarbon dates by Mulrooney (2013), see Figure S2 in Supplementary Material, mainly because of the pronounced decline in the summed probability distribution between 1400 and 1500 AD that is not captured by those model results.
Once the rat population has reached a peak, the growth rate of palm trees remains at least 60% lower than the maximum growth rate (Figure 2B), which is, however, at least two-fold higher than in the two other scenarios (Table 1). According to the genocide view, rats have played an important role in deforesting the island. However, this is a subject of controversy (Flenley and Bahn, 2003; Diamond, 2005; Hunt, 2007; Mieth and Bork, 2010) and so their impact is here offset with a higher tree growth rate. It is nevertheless undisputed that the island has been home to a relatively large rat population, which has declined with time (Steadman et al., 1994; Diamond, 2005; Hunt, 2007), but similar to the human population lack of reliable evidence prevents a quantitative estimate of the population size.
Under the genocide scenario, the human growth dynamics can be divided into three distinct phases: (i) an early phase of rapid growth during the first 150 years, (ii) a stable, sustainable phase lasting for the following 300 years, and (iii) a collapse triggered by the introduction of European diseases (Flenley and Bahn, 2003; Diamond, 2005; Hunt, 2007). In contrast to the ecocide, here diseases cause a substantial reduction of the human population (Figure 3B), because the mortality of infected individuals is assumed much higher under this scenario (mI = 0.2612 y−1). This additional mortality produces a rapid demographic collapse with more than 6000 deaths between 1722 and 1850 AD reducing the population size to less than 800 individuals. As mentioned above, slave raids are not represented in the model, although the high mI may compensate for this omission and other not explicitly considered loss processes related to the arrival of Europeans.
3.3. Slow Demise
In the slow demise scenario, the human population reaches an early maximum of 6670 (Figures 1C, 2A). The peak occurs in the 14th century and is followed by a gradual decline of the human population that lasts for more than three centuries. During the first centuries after settlement the islanders mainly depend on the forest resource, but agriculture on cleared land becomes more important after 1550 AD (Figure 2C). Forest clearance peaks in the 14th century and deforestation is almost completed by 1550 AD (Figure 1I, Flenley, 1996; Hunt, 2007; Mann et al., 2008; Mieth and Bork, 2010). As a consequence, the clearance per individual falls dramatically in the period from 1200 to 1600 AD. In the model, the shrinking forest frees more and more land that can be used for agriculture. This process triggers a distinct change in the islanders' livelihood and is consistent with the evidence for a labor-intensive agriculture that developed after a period of slash-and-burn forest clearance and may have covered up to 12.5% of the island's surface (Stevenson et al., 2006; Hunt, 2007; Ladefoged et al., 2010, 2013).
In this scenario, the normalized clearance rate (Figure 2F) and the annual clearance (Figure 2D) are more consistent with the distribution of charcoal remains than in the ecocide and the genocide scenarios (Figure 2F). After a steep increase in deforestation between 1200 and 1350 AD, the intensity of the slash-and-burn activities on Easter Island, indicated by the frequency distribution of charcoal remains, declines with time. By the time Europeans arrive on the island, deforestation has slowed down considerably to only 10% of the maximum rate realized in the 14th century. A similar dynamics is revealed also by comparing the model results with the radiocarbon dates compiled by Mulrooney (2013), see Figure S2 in Supplementary Material. For this comparison four parameters have been changed slightly, nevertheless the general pattern of a long and slow population decline is clearly preserved (Figure S1). Note, however, that the summed probability distribution of the radiocarbon dates is almost constant after 1500 AD, while the model results suggest a slow decline also for the normalized clearance rate.
The slow and continuous decline of the human population almost halts at around 3000 individuals by 1722 AD. The diseases introduced at this point by the Europeans trigger a further decline to 1500 individuals. The additional mortality from diseases causes a total of about 3900 deaths by the mid of the 19th century (Figure 3C). Also in this case, the dynamics of the human population reveal three clearly distinct phases: (i) a short phase of rapid growth, (ii) a long phase of slow decline from 1380 to 1722 AD, and (iii) an attenuated collapse caused by the arrival of Europeans (Figure 2A). Rats closely follow the dynamics of palm trees and go almost extinct by 1550 AD. Likewise their negative effect on tree growth shrinks from more than 60% at their population maximum to a mere 10% after 1500 AD (Figure 2B).
3.4. Robustness of Model Results
We tested the robustness of the three simulated scenarios through random variations of 10 model parameters (see Materials and Methods). The results reveal that major aspects of the narratives related to the population dynamics of humans, rats, and palm trees are preserved in all three scenarios under minor perturbations of the parameter values (Figures 1A–I). As to be expected, however, the scenarios overlap considerably for large parameter uncertainties, i.e., σ = 25%. Despite this, the frequency distribution of radiocarbon dates from charcoal remains (Figures 4A–C) as well as the summed probability distribution of radiocarbon dates (Figures S2A–C) are best explained by the slow demise scenario.
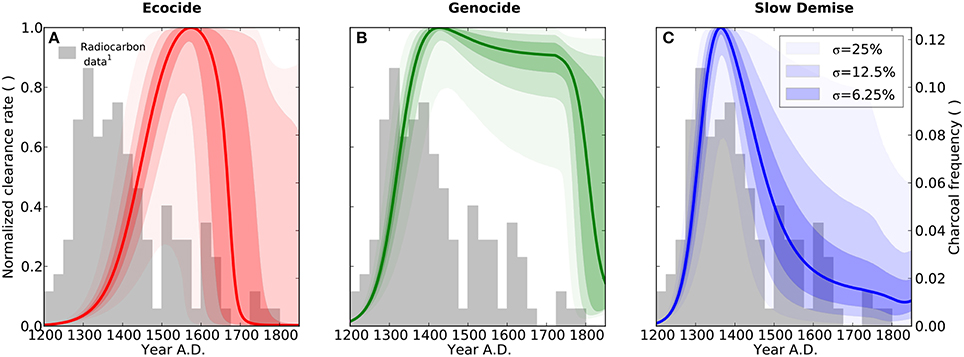
Figure 4. Forest clearance. Results are shown for the three different scenarios ecocide (red), genocide (green), and slow demise (blue). Solid lines present the standard run of the respective scenario (cf. Table 1 for parameter values) and the shaded areas indicate the 10 (lower range) and 90% (upper range) percentile of an ensemble of 10000 simulations with perturbed parameter sets. Dark, intermediate, and light shadings indicate three ensembles with different standard deviations (σ = 6.25, 12.5, and 25%, respectively) of the normal distribution from which the perturbed parameters of the ensemble were drawn. The bars show the relative frequency of dated charcoal remains used here as a semi-quantitative proxy for the intensity of slash-and-burn activities, 1: Radiocarbon dates compiled by Hunt and Lipo (2006), see Table A1 and Materials and Methods.
Absolute population levels respond very sensitively to even relatively small parameter variations. A collapse of the human population, which is supposed to occur toward the end of all three scenarios, may be delayed by several decades (Figure 1A) or prevented altogether (Figure 1B) even for σ = 6.25%. As stated above, large perturbations, i.e., σ = 25%, produce a convergence of the three scenarios, because after all they only differ by their parameter values. Note that, given the properties of the normal distribution, the large variations generated by a standard deviation σ = 25% correspond to a case in which there is a 95% probability that the perturbed parameter values lie within a ±50% range around their standard values.
In other words, while it is difficult to quantify the exact number of people or the exact timing of a potential collapse because of the sensitivity of these features to even moderate parameter changes, the relative differences, in particular the differences in the qualitative dynamics, among the three scenarios are rather robust with respect to uncertainties in the underlying model assumptions. Likewise, while the normalized annual clearance is considerably sensitive to parameter variations, the general pattern of a steep increase in clearance activity followed by a long and continuous decline, which is consistent with the distribution of the charcoal frequency (Figure 2F), is best reflected by the slow demise scenario.
4. Discussion
All three simulated scenarios are broadly consistent with the major, undisputed paleoecological evidence: (i) the human population was decimated by the diseases introduced by Europeans after 1722 AD (Diamond, 2005; Hunt, 2007) and around 1850 AD the size of the population was between 1500 and 3000 individuals (Flenley and Bahn, 2003); (i) the rat population was large and peaked right after the arrival of the Polynesian settlers when palm seeds were very abundant and rats had a negative, although non-quantifiable, effect on tree growth (Steadman et al., 1994; Diamond, 2005; Hunt, 2007; Meyer and Butaud, 2008; Mieth and Bork, 2010), (iii) people substantially reduced the number of palm trees on the island and intensified agriculture over time (Flenley et al., 1991; Stevenson et al., 2006; Mann et al., 2008; Mieth and Bork, 2010; Ladefoged et al., 2013). Despite being all compatible with the above points, the three simulated scenarios reveal clear differences from one another in terms of human, rat, and palm tree population dynamics and, consequently, also in deforestation patterns.
Generated by the same model, but with different parameterizations (cf. Table 1), the variability between the three scenarios mirrors the controversy in the scientific debate around Easter Island and indicates how uncertainties in the assumptions can lead to conflicting views on the dynamics of a well-researched paleoecological system (Diamond, 2005; McAnany and Yoffee, 2010; Hunt and Lipo, 2011). Our findings therefore confirm D'Alessandro (2007), who found multiple steady states in a model of two-resources with critical depensation and emphasized the sensitivity of sustainable resource use in such social-ecological systems to small differences in their characteristics.
The qualitative character of most archaeological data (Middleton, 2012) and in particular the inaccuracies involved with palynological and radiocarbon analyses (Wilmshurst et al., 2011) leave considerable interpretational freedom in the development of a historical narrative. Moreover, a written record of Easter Island that could help to reveal more details particularly on changes in the society is non-existent (Flenley and Bahn, 2003). Ecological models are often used with the intent of predicting the correct temporal dynamics of populations given a set of parameters and initial conditions. In this study, however, we have shown that a mathematical model can be used differently. Specifically, we used our model to explore the ecological implications of the three distinct historical narratives and to highlight the large uncertainties involved in each of them. Nevertheless, it is a useful tool for synthesizing the current state of knowledge in broad terms and for providing circumstantial evidence to foster the ongoing lively debate (e.g., Diamond, 2005 vs. Peiser, 2005; Hunt, 2007) about the social-ecological history of Easter Island.
The picture emerging from the extensive archaeological research of the past decades is very complex and has led to the development of very detailed and much debated narratives of ecocide and genocide. Being an abstraction of reality, however, our model does not (and cannot) account for all possible details of nature. We deliberately devised a parsimonious model that is nonetheless able to successfully capture the general features of the three narratives, while at the same time avoiding an overfitting of the considerable noise inherent to sparse paleoecological data (Hawkins, 2004).
Given the uncertainties in model parameters, it is evident that none of the three scenarios can be safely ruled out. However, when constrained with high-frequency data on charcoal remains compiled by Hunt and Lipo (2006) or with the summed probability distribution of radiocarbon dates reported by Mulrooney (2013), neither the ecocide nor the genocide appear very plausible. According to our model, the slow demise scenario agrees better with timing and relative strength of the inferred human activities. Nevertheless, it might be still possible to produce a scenario that agrees with the radiocarbon data and yet exhibits a different dynamics than in Slow Demise.
Although afflicted with uncertainties and prone to misinterpretation and bias (Surovell and Brantingham, 2007; Armit et al., 2013), frequency distributions of radiocarbon dates have been frequently used to derive quantitative estimates and temporal dynamics of populations (Collard et al., 2010; Mulrooney, 2013; Shennan et al., 2013), primarily because they often present the only data that consistently quantify human activity over long periods of time. Here we do not compare the relative frequency of the radiocarbon dates directly to the simulated human population, but to the clearance function, which assumes that islanders reduce forest clearance when scarcity becomes obvious, i.e., when palm trees become rare. The resource level at which the islanders halve their clearance is represented by the clearance half-saturation constant (Equation 7), which can be interpreted as a societal behavioral trait. Thus, the islanders behave ruthlessly toward their forest resource in the ecocide scenario and less so in the other two scenarios (cf. 250000 vs. 800000 palm trees, Table 1).
Estimated population densities in Polynesians Islands prior to the first contact with Europeans are relatively high with typical values between 60 and 100 individuals per km2 (Hurles et al., 2003), albeit with a high variance. New Zealand marks the low with less than one individual per km2, while highest densities exceed 200 individuals per km2 for the Marquesas (Foale et al., 2011). Depending on the assumed population sizes, the densities on Easter Island are typical for a Polynesian island and range between 25 and 100 individuals per km2. For obvious reasons, reliable population growth rates for the initial phase of colonization in Polynesia do not exist. One of the few relevant estimates of annual growth of hunter and gatherer populations was published by Birdsell (1957), who reports a rate of 3% or higher for small populations colonizing uninhabited islands. Our growth rates for the three scenarios range between 0.023 and 0.045 y−1 and are thus consistent with this estimate.
Our results are also consistent with the alternative dataset we tested here (see Supplementary Material, Figures S1, S2), the island-wide compilation of Class 1 radiocarbon dated recently published by Mulrooney (2013), who concluded that there is no convincing evidence for a punctuated collapse.
The slow demise includes elements of ecocide and genocide and is therefore a compromise between the two extreme views, which assume either ruthless deforestation until the last tree is cut down (Flenley and Bahn, 2003; Diamond, 2005) or a stable human population size despite the loss of large parts of the primary ecological resource on the island (Hunt, 2007). In summary, we endorse the idea of a resilient society that tries to adapt in the attempt to avert the looming ecological catastrophe (Butzer and Endfield, 2012; Butzer, 2012). Thus, the collapse of the human population on Easter Island might have not been so abrupt, but a rather long and slow fall. Our work contributes new objective and quantitative reasoning to the debate about the fate of Easter Island and lends weight to the emerging view that the replacement of a palm-dominated vegetation by grasslands was a long and gradual process (Mulrooney, 2013).
Author Contributions
GB and AM designed the research project, analyzed the model results, and wrote the manuscript. GB developed the model and conducted the simulations.
Conflict of Interest Statement
The authors declare that the research was conducted in the absence of any commercial or financial relationships that could be construed as a potential conflict of interest.
Supplementary Material
The Supplementary Material for this article can be found online at: http://www.frontiersin.org/journal/10.3389/fevo.2015.00013/abstract
References
Acevedo, M. A., Marcano, M., and Fletcher, R. J. (2012). A diffusive logistic growth model to describe forest recovery. Ecol. Modell. 244, 13–19. doi: 10.1016/j.ecolmodel.2012.07.012
Anderies, J. (2000). On modeling human behavior and institutions in simple ecological economic systems. Ecol. Econ. 35, 393–412. doi: 10.1016/S0921-8009(00)00221-4
Armit, I., Swindles, G. T., and Becker, K. (2013). From dates to demography in later prehistoric Ireland? Experimental approaches to the meta-analysis of large 14C data-sets. J. Archaeol. Sci. 40, 433–438. doi: 10.1016/j.jas.2012.08.039
Athens, J. S. (2009). Rattus exulans and the catastrophic disappearance of Hawai ‘i’ s native lowland forest. Biol. Invasions 11, 1489–1501. doi: 10.1007/s10530-008-9402-3
Bahn, P. (1993). “The history of human settlement on Rapanui,” in Easter Island Studies Oxbow Monograph, Vol. 32, ed S. Fisher (Oxford: The Short Run Press), 53–55.
Barnes, S., Matisoo-Smith, E., and Hunt, T. (2006). Ancient DNA of the Pacific rat (Rattus exulans) from Rapa Nui (Easter Island). J. Archaeol. Sci. 33, 1536–1540. doi: 10.1016/j.jas.2006.02.006
Barquet, N., and Domingo, P. (1997). Smallpox : the triumph over the most terrible of the ministers of death. Ann. Intern. Med. 127, 635–642. doi: 10.7326/0003-4819-127-8/Part/1-199710150-00010
Pubmed Abstract | Pubmed Full Text | CrossRef Full Text | Google Scholar
Basener, B., and Ross, D. S. (2004). Booming and crushing populations and Easter Island. SIAM J. Appl. Math. 65, 684–701. doi: 10.1137/S0036139903426952
Basener, W., Brooks, B., Radin, M., and Wiandt, T. (2008). Rat instigated human population collapse on Easter Island. Nonlinear Dynamics Psychol. Life Sci. 12, 253–270.
Birdsell, J. (1957). Some population problems involving pleistocene man. Cold Spring Harb. Symp. Quant. Biol. 22, 47–69. doi: 10.1101/SQB.1957.022.01.008
Brander, J., and Taylor, M. (1998). The simple economics of Easter Island: a ricardo-malthus model of renewable resource use. Am. Econ. Rev. 88, 119–138.
Butzer, K., and Endfield, G. (2012). Critical perspectives on historical collapse. Proc. Natl. Acad. Sci. U.S.A. 109, 3628–3631. doi: 10.1073/pnas.1114772109
Pubmed Abstract | Pubmed Full Text | CrossRef Full Text | Google Scholar
Butzer, K. (2012). Collapse, environment, and society. Proc. Natl. Acad. Sci. U.S.A. 109, 3632–3639. doi: 10.1073/pnas.1114845109
Pubmed Abstract | Pubmed Full Text | CrossRef Full Text | Google Scholar
Cañellas Boltà, N., Rull, V., Sáez, A., Margalef, O., Bao, R., Pla-Rabes, S., et al. (2013). Vegetation changes and human settlement of Easter Island during the last millennia : a multiproxy study of the Lake Raraku sediments. Q. Sci. Rev. 72, 36–48. doi: 10.1016/j.quascirev.2013.04.004
Collard, M., Edinborough, K., Shennan, S., and Thomas, M. G. (2010). Radiocarbon evidence indicates that migrants introduced farming to Britain. J. Archaeol. Sci. 37, 866–870. doi: 10.1016/j.jas.2009.11.016
Croix, D., and Dottori, D. (2008). Easter Island's collapse: a tale of a population race. J. Econ. Growth 13, 27–55. doi: 10.1007/s10887-007-9025-z
D'Alessandro, S. (2007). Non-linear dynamics of population and natural resources: the emergence of different patterns of development. Ecol. Econ. 62, 473–481. doi: 10.1016/j.ecolecon.2006.07.008
Dalton, T. R., and Coats, R. M. (2000). Could institutional reform have saved Easter Island? J. Evol. Econ. 10, 489–505. doi: 10.1007/s001910000050
Diamond, J. M. (2005). Collapse: How Societies Choose to Fail or Succeed. New York, NY: Viking Penguin.
Flenley, J., and Bahn, P. (2003). The Enigmas of Easter Island. New York, NY: Oxford University Press.
Flenley, J., and King, S. (1984). Late quaternary pollen records from Easter Island. Nature 307, 47–50. doi: 10.1038/307047a0
Flenley, J., King, A., Jackson, J., Chew, C., Teller, J., and Prentice, M. (1991). The Late Quaternary vegetational and climatic history of Easter Island. J. Q. Sci. 6, 85–115. doi: 10.1002/jqs.3390060202
Flenley, J. (1996). Further evidence of vegetational change on Easter Island. South Pac. Study 16, 135–141.
Foale, S., Cohen, P., Januchowski-Hartley, S., Wenger, A., and Macintyre, M. (2011). Tenure and taboos: origins and implications for fisheries in the Pacific. Fish Fis. 12, 357–369. doi: 10.1111/j.1467-2979.2010.00395.x
González, D., and Roggeveen, J. (1908). The Voyage of Captain Don Felipe Gonzalez in the Ship of the Line San Lorenzo, with the Frigate Santa Rosalia in Company, to Easter Island in 1770-1. Cambridge: The Hakluyt Society.
Hawkins, D. M. (2004). The problem of overfitting. J. Chem. Inf. Comput. Sci. 44, 1–12. doi: 10.1021/ci0342472
Pubmed Abstract | Pubmed Full Text | CrossRef Full Text | Google Scholar
Heyerdahl, T., and Ferdon, E. (1961). Reports of the Norwegian Archaeological Expedition to Easter Island and the East Pacific. Archaeology of Easter Island. Vol. 1. Stockholm: Forum Publishing House.
Hunt, T. L., and Lipo, C. P. (2006). Late colonization of Easter Island. Science 311, 1603–1606. doi: 10.1126/science.1121879
Pubmed Abstract | Pubmed Full Text | CrossRef Full Text | Google Scholar
Hunt, T. L. (2007). Rethinking Easter Island's ecological catastrophe. J. Archaeol. Sci. 34, 485–502. doi: 10.1016/j.jas.2006.10.003
Hurles, M. E., Matisoo-Smith, E., Gray, R. D., and Penny, D. (2003). Untangling Oceanic settlement: the edge of the knowable. Trends Ecol. Evol. 18, 531–540. doi: 10.1016/S0169-5347(03)00245-3
Kermack, W. O., and McKendrick, A. G. (1932). Contributions to the mathematical theory of epidemics. II. The problem of endemicity. Proc. R. Soc. A Math. Phys. Eng. Sci. 138, 55–83. doi: 10.1098/rspa.1932.0171
Kirch, P. V. (1997). Microcosmic histories: Island perspectives on global change. Am. Anthropol. 99, 30–42. doi: 10.1525/aa.1997.99.1.30
Ladefoged, T. N., Stevenson, C. M., Haoa, S., Mulrooney, M., Puleston, C., Vitousek, P. M., et al. (2010). Soil nutrient analysis of Rapa Nui gardening. Archaeol. Ocean. 45, 80–85. doi: 10.1002/j.1834-4453.2010.tb00082.x
Ladefoged, T. N., Flaws, A., and Stevenson, C. M. (2013). The distribution of rock gardens on Rapa Nui (Easter Island) as determined from satellite imagery. J. Archaeol. Sci. 40, 1203–1212. doi: 10.1016/j.jas.2012.09.006
Larsen, A., and Simpson, D.-F. Jr. (2014). Comment to Rull et al. (2013) - Challenging Easter Island's Collapse: the need for interdisciplinary synergies. Front. Ecol. Evol. 2:56. doi: 10.3389/fevo.2014.00056
Mann, D., Chase, J., Edwards, J., Beck, W., Reanier, R., and Mass, M. (2003). “Prehistoric destruction of the primeval soils and vegetation of Rapa Nui (Isla de Pascua, Easter Island),” in Easter Island: Scientific Exploration Into the World's Environmental Problems in Microcosm, eds J. Loret and J. Tanacredi (New York, NY: Kluwer Academic Publishers), 133–153.
Mann, D., Edwards, J., Chase, J., Beck, W., Reanier, R., Mass, M., et al. (2008). Drought, vegetation change, and human history on Rapa Nui (Isla de Pascua, Easter Island). Q. Res. 69, 16–28. doi: 10.1016/j.yqres.2007.10.009
Martinsson-Wallin, H., and Crockford, S. J. (2001). Early settlement of rapa nui (Easter Island). Asian Perspect. 40, 244–278. doi: 10.1353/asi.2001.0016
Matisoo-Smith, E., and Robins, E. (2004). Origins and dispersals of Pacific peoples: evidence from mtDNA phylogenies of the Pacific rat. Proc. Natl. Acad. Sci. U.S.A. 101, 9167–9172. doi: 10.1073/pnas.0403120101
Pubmed Abstract | Pubmed Full Text | CrossRef Full Text | Google Scholar
McAnany, P., and Yoffee, N., (eds.). (2010). Questioning Collapse: Human Resilience, Ecological Vulnerability, and the Aftermath of Empire. New York, NY: Cambridge University Press.
Meyer, J.-Y., and Butaud, J.-F. (2008). The impacts of rats on the endangered native flora of French Polynesia (Pacific Islands): drivers of plant extinction or coup de grâce species? Biol. Invasions 11, 1569–1585. doi: 10.1007/s10530-008-9407-y
Middleton, G. D. (2012). Nothing lasts forever: environmental discourses on the collapse of past societies. J. Archaeol. Res. 20, 257–307. doi: 10.1007/s10814-011-9054-1
Mieth, A., and Bork, H.-R. (2004). Easter Island-Rapa Nui. Scientific Pathways to Secrets of the Past. Kiel: Ökologie-Zentrum der Universität Kiel.
Mieth, A., and Bork, H.-R. (2005). History, origin and extent of soil erosion on Easter Island (Rapa Nui). Catena 63, 244–260. doi: 10.1016/j.catena.2005.06.011
Mieth, A., and Bork, H.-R. (2010). Humans, climate or introduced rats which is to blame for the woodland destruction on prehistoric Rapa Nui (Easter Island)? J. Archaeol. Sci. 37, 417–426. doi: 10.1016/j.jas.2009.10.006
Motesharrei, S., Rivas, J. and Kalnay, E. (2014). Human and nature dynamics (HANDY): modeling inequality and use of resources in the collapse or sustainability of societies. Ecol. Econ. 101, 90–102. doi: 10.1016/j.ecolecon.2014.02.014
Mulrooney, M. A. (2013). An island-wide assessment of the chronology of settlement and land use on Rapa Nui (Easter Island) based on radiocarbon data. J. Archaeol. Sci. 40, 4377–4399. doi: 10.1016/j.jas.2013.06.020
Orliac, C. (2000). “The woody vegetation of Easter Island between the early 14th and the mid-17th centuries A.D.,” in Easter Island Archaeology: Research on Early Rapanui Culture, eds C. Stevenson and W. Ayres (Los Osos: The Easter Island Foundation), 211–220.
Peiser, B. (2005). From genocide to ecocide: the rape of Rapa Nui. Energy Environ. 16. doi: 10.1260/0958305054672385
Rainbird, P. (2002). A message for the future? The Rapa Nui (Easter Island) ecodisaster and Pacific Island environments. World Archaeol. 33, 436–451. doi: 10.1080/00438240120107468
Reuveny, R., and Decker, C. S. (2000). Easter Island: historical anecdote or warning for the future? Ecol. Econ. 35, 271–287. doi: 10.1016/S0921-8009(00)00202-0
Rolett, B., and Diamond, J. (2004). Environmental predictors of pre-European deforestation on Pacific Islands. Nature 431, 443–446. doi: 10.1016/S0921-8009(00)00202-0
Pubmed Abstract | Pubmed Full Text | CrossRef Full Text | Google Scholar
Rull, V., Cañellas Boltà, N., Sáez, A., Margalef, O., Bao, R., Pla-Rabes, S., et al. (2013). Challenging Easter Island's collapse: the need for interdisciplinary synergies. Front. Ecol. Evol. 2:56. doi: 10.3389/fevo.2014.00056
Shennan, S., Downey, S. S., Timpson, A., Edinborough, K., Colledge, S., Kerig, T., et al. (2013). Regional population collapse followed initial agriculture booms in mid-Holocene Europe. Nat. Commun. 4:2486. doi: 10.1038/nature02801
Pubmed Abstract | Pubmed Full Text | CrossRef Full Text | Google Scholar
Sprott, J. C. (2011). Chaos in Easter Island ecology. Nonlinear Dynamics Psychol. Life Sci. 15, 445–454.
Steadman, D., Casanova, P., and Ferrando, C. (1994). Stratigraphy, chronology, and cultural context of an early faunal assemblage from Easter Island. Asian Perspect. 33, 79–96.
Stevenson, C., Jackson, T., and Mieth, A. (2006). Prehistoric and early historic agriculture at Maunga Fiorito, Easter Island (Rapa Nui), Chile. Antiquity 80, 919–936. doi: 10.1017/S0003598X00094515
Surovell, T. A., and Brantingham, P. J. (2007). A note on the use of temporal frequency distributions in studies of prehistoric demography. J. Archaeol. Sci. 34, 1868–1877. doi: 10.1016/j.jas.2007.01.003
Pubmed Abstract | Pubmed Full Text | CrossRef Full Text | Google Scholar
Wilmshurst, J. M., Hunt, T. L., Lipo, C. P., and Anderson, A. J. (2011). High-precision radiocarbon dating shows recent and rapid initial human colonization of East Polynesia. Proc. Natl. Acad. Sci. U.S.A. 108, 1815–1820. doi: 10.1073/pnas.1015876108
Pubmed Abstract | Pubmed Full Text | CrossRef Full Text | Google Scholar
Wirtz, W. (1972). Population ecology of the Polynesian rat, Rattus exulans, on Kure Atoll, Hawaii. Pac. Sci. 26, 433–464.
Appendix
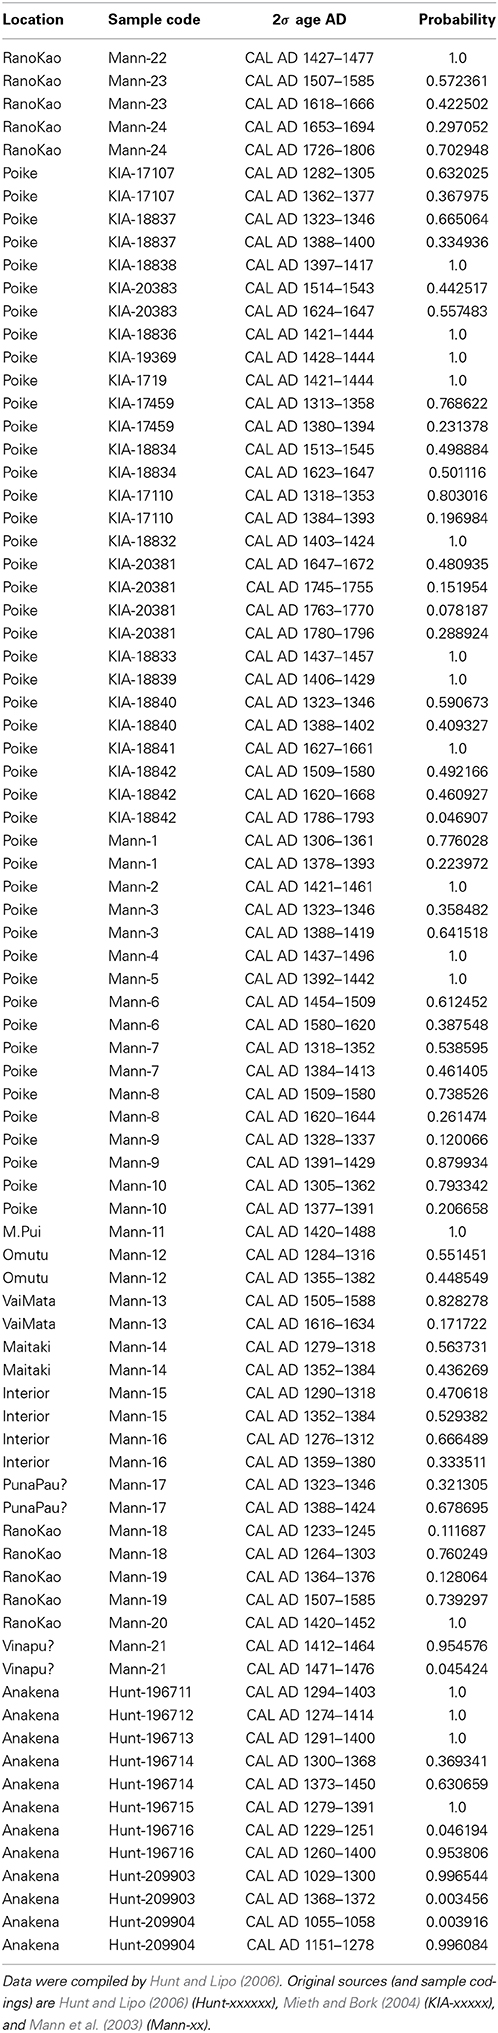
Table A1. Radiocarbon dates associated with wood charcoal, Jubaea palms, and/or truncated primeval soils.
Keywords: Easter Island, collapse, paleoecological model, sustainability, resource use
Citation: Brandt G and Merico A (2015) The slow demise of Easter Island: insights from a modeling investigation. Front. Ecol. Evol. 3:13. doi: 10.3389/fevo.2015.00013
Received: 24 October 2014; Accepted: 30 January 2015;
Published online: 27 February 2015.
Edited by:
Valentí Rull, Botanic Institute of Barcelona (Consejo Superior de Investigaciones Científicas), SpainReviewed by:
Mauricio Lima, Pontificia Universidad Catolica de Chile, ChileSafa Motesharrei, National Socio-Environmental Synthesis Center (SESYNC), USA
Copyright © 2015 Brandt and Merico. This is an open-access article distributed under the terms of the Creative Commons Attribution License (CC BY). The use, distribution or reproduction in other forums is permitted, provided the original author(s) or licensor are credited and that the original publication in this journal is cited, in accordance with accepted academic practice. No use, distribution or reproduction is permitted which does not comply with these terms.
*Correspondence: Gunnar Brandt, Systems Ecology, Leibniz Center for Tropical Marine Ecology, Fahrenheitstraße 6, 28359 Bremen, Germany e-mail:Z3VubmFyLmJyYW5kdEB6bXQtYnJlbWVuLmRl