 A. Z. Andis
 Marcel P. Huijser3
- 1Department of Environmental Studies, University of Montana, Missoula, MT, United States
- 2School of Forestry and Environmental Studies, Yale University, New Haven, CT, United States
- 3Western Transportation Institute, Montana State University, Bozeman, MT, United States
In recent decades, an increasing number of highway construction and reconstruction projects have included mitigation measures aimed at reducing wildlife-vehicle collisions and maintaining habitat connectivity for wildlife. The most effective and robust measures include wildlife fences combined with wildlife underpasses and overpasses. The 39 wildlife crossing structures included along a 90 km stretch of US Highway 93 on the Flathead Indian Reservation in western Montana represent one of the most extensive of such projects. We measured movements of large mammal species at 15 elliptical arch-style wildlife underpasses and adjacent habitat between April and November 2015. We investigated if the movements of large mammals through the underpasses were similar to large mammal movements in the adjacent habitat. Across all structures, large mammals (all species combined) were more likely to move through the structures than pass at a random location in the surrounding habitat. At the species level, white-tailed deer (Odocoileus virginianus) and mule deer (O. hemionus) used the underpasses significantly more than could be expected based on their movement through the surrounding habitat. However, carnivorous species such as, black bear (Ursus americanus) and coyote (Canis latrans) moved through the underpasses in similar numbers compared to the surrounding habitat.
Introduction
Over the past few decades, a range of negative effects of transportation infrastructure on wildlife populations have been well documented (e.g., Forman and Alexander, 1998; Spellerberg, 1998; Trombulak and Frissell, 2000; Coffin, 2007). Roads and traffic affect wildlife populations through direct mortality from vehicle collisions and indirect effects associated with habitat loss and degradation. Linear infrastructure can also be a barrier to wildlife movement as animals may avoid open habitat with an unnatural surface and the disturbance associated with roads (e.g., moving vehicles, noise, and light; D'Amico et al., 2016). Avoidance of roads decreases connectivity and can threaten population viability and genetic variability (Wang and Schreiber, 2001). At over 14 million lane-kilometers of paved roads in the United States alone (USDOT, 2017) and a forecast of an additional 25 million lane-km globally by 2050 (Dulac, 2013), road networks will continue as one of the largest, most direct impacts humans have on ecosystems.
Wildlife-vehicle collisions and the barrier effect of roads are typically mitigated through wildlife fences in combination with wildlife crossing structures (Glista et al., 2009; Grilo et al., 2010; Kociolek et al., 2015). In order to continue to justify these measures, researchers must prove that these measures are effective in both reducing wildlife-vehicle collisions and providing connectivity for wildlife, then formulate suggestions on how to improve their performance.
The size and cost of wildlife crossing structures makes experimental design and testing in controlled settings difficult. Consequently, we have a poor understanding of the relative importance of structural attributes (design) and locational attributes (placement) to crossing performance. Furthermore, most mitigation projects that involve wildlife fences and wildlife crossing structures primarily address an immediate problem (e.g., reducing wildlife vehicle collisions) and are not intended to contribute novel data (Rytwinski et al., 2015). Wildlife mitigation measures are usually considered late in the project planning process after limitations on design or placement have already been imposed (Cramer and Bissonette, 2007; Kroll, 2015). Even for large projects, the number of crossing structures that have similar dimensions is generally too low for a quantitative analysis of their performance.
Many studies have documented absolute use of crossing structures by recording the number of animals that cross through a structure. However, absolute use alone provides little information on a structure's performance, as local wildlife population density and the specific configuration of landscape elements influence wildlife use of individual structures. To date, there are only very few studies that have assessed the effectiveness of crossing structures based on a rigorous comparison to animal abundance in the surrounding habitat (Clevenger and Waltho, 2005; but see van der Ree et al., 2007; van der Grift et al., 2013).
In this study, we evaluated the effectiveness of wildlife crossing structures associated with the highway US 93 North through the Flathead Indian Reservation in western Montana, USA. We measured performance of structures by comparing large mammal movements through the structures to those in the immediate surroundings. We were interested in investigating the performance of underpasses for animals that were willing to come close to the highway as crossing structures cannot be expected to serve animals that avoid transportation corridors altogether. Therefore, we located control plots directly adjacent to the road, within the road effect zone (Forman, 2000).
We first investigated the corridor-wide performance from 15 wildlife passage structures of similar geometry and design by contrasting wildlife movement through the structure to those in the surrounding habitat. Our analysis focuses on four target species including white-tailed deer (Odocoileus virginianus), mule deer (Odocoileus hemionus), black bear (Ursus americanus), and coyote (Canis latrans), and composite groups (deer sp., carnivore sp., and large mammal sp.). Secondly, we compared the crossing performance of these species for each individual structure. Additionally, we investigated if mitigation measures were concentrating or funneling wildlife through the crossing structures. Finally, we used the observed performance to estimate the percentage of total road length that would require crossing structures of the focal design in order to allow complete permeability for wildlife.
Methods
Study Area
We collected data along US 93 in the Flathead Reservation between Evaro and Polson, Montana (Figure 1). The road runs north-south through the Flathead Valley, a heterogeneous landscape comprised of shrub, grassland, forests, wetland habitat, and agricultural lands. This section of highway received an annual average of 7,059 vehicles per day (MDT, 2014). The roadway design includes both undivided and divided, four-, three-, and two-lane highway accommodating a maximum speed limit of 70 mph (113 km/h), reducing to 25–45 mph (40–72 km/h) in towns.
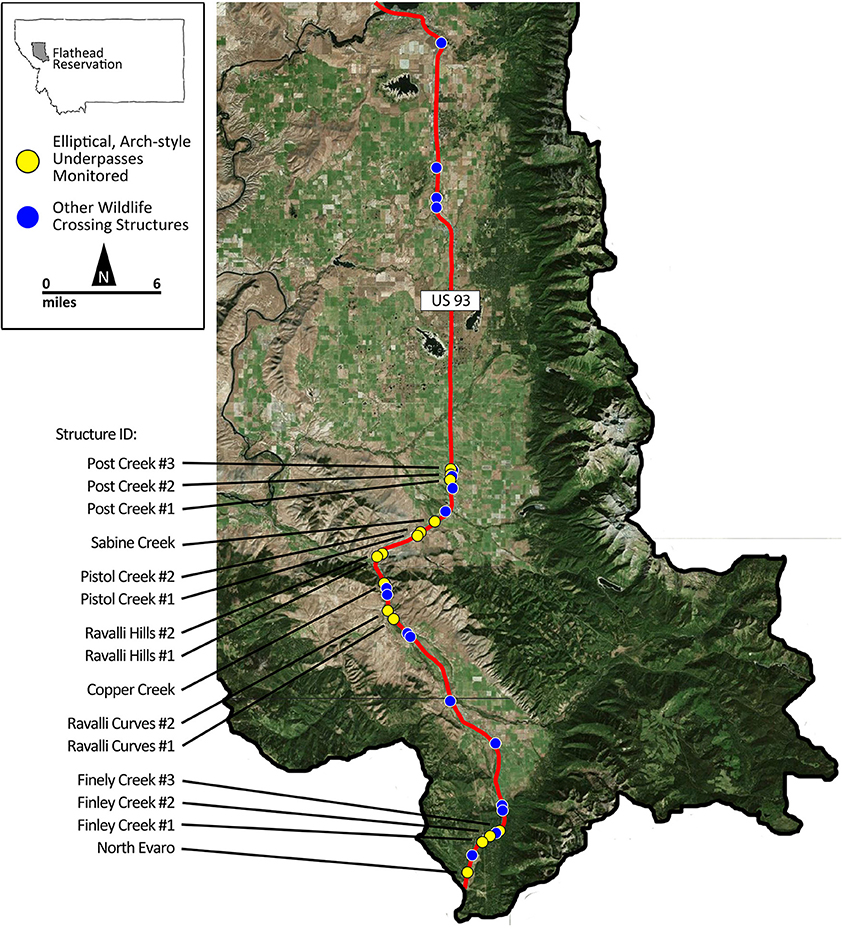
Figure 1. The location of the wildlife crossing structures along US Highway 93 on the Flathead Indian Reservation in western Montana, USA. Structures monitored as part of this study are indicated as yellow circles. Other wildlife passage structures not included in this study are indicated as blue circles. US Highway 93 is shown as a red line. Base map from Google Earth (2016). Google Earth 7.1.7.2606. (2016). Flathead Indian Reservation, Flathead County, MT, USA 47.337894°N, 114.052525°W. Retrieved: 20 November 2016. Available at: http://www.google.com/earth/index.html.
Reconstruction of the 90.6 km section of highway began in 2004 to improve traffic flow and safety. The Confederated Salish Kootenai Tribes and the Federal Highway Administration agreed that the reconstructed highway must be respectful to the communities and people, but also to the land and wildlife that are considered both natural and cultural resources for the Tribes (Marshik et al., 2001; Kroll, 2015). Wildlife fences and crossing structures were an integral part of this “context-sensitive design” (Marshik et al., 2001).
The US 93 project is unique in the diversity of structure designs employed and in the number of replicates of select designs across a variety of habitat types. To date, the project includes 39 wildlife crossing structures of various designs from small concrete box culverts to a vegetated overpass and disjointed wildlife fencing (Huijser et al., 2016a).
Experimental Design
In this study, we address two primary questions: how does wildlife movement through crossing structures compare to wildlife movement in the immediate surrounding, and what is the effect of location, independent of structure design, on promoting wildlife passage. To investigate the first question, we used a control-impact study design (van der Grift et al., 2015). By selecting only congruent structures for the control-impact assessment, we were able to hold the effect of structure design constant and investigate only the effect of the structures' locations.
Selection of Wildlife Crossing Structures
While other studies have investigated the performance of structural attributes across multiple design types (e.g., Yanes et al., 1995; Clevenger and Waltho, 2000; Ng et al., 2004), this study is unique in selecting 15 structures of nearly identical design. These structures are the most common design included in the US 93 reconstruction (18 of 39) and they are used by a wide array of medium and large mammal species (Huijser et al., 2016a).
All structures are elliptical, corrugated metal arch-style underpasses with soil substrate, primarily built for large mammal passage. The structures have an average width of 7.32 m (range = 6.86–7.95 m), height of 5.55 m (range = 3.65–5.55 m), and length of 26.5 m (range = 14.6–40.0 m; Table 1). All structures include concrete retaining walls that extend out from the structure at an ~35° angle to the road and extend to ~10 m. Wildlife exclusion fencing (height 2.4 m) is associated with some structures (Table 1).
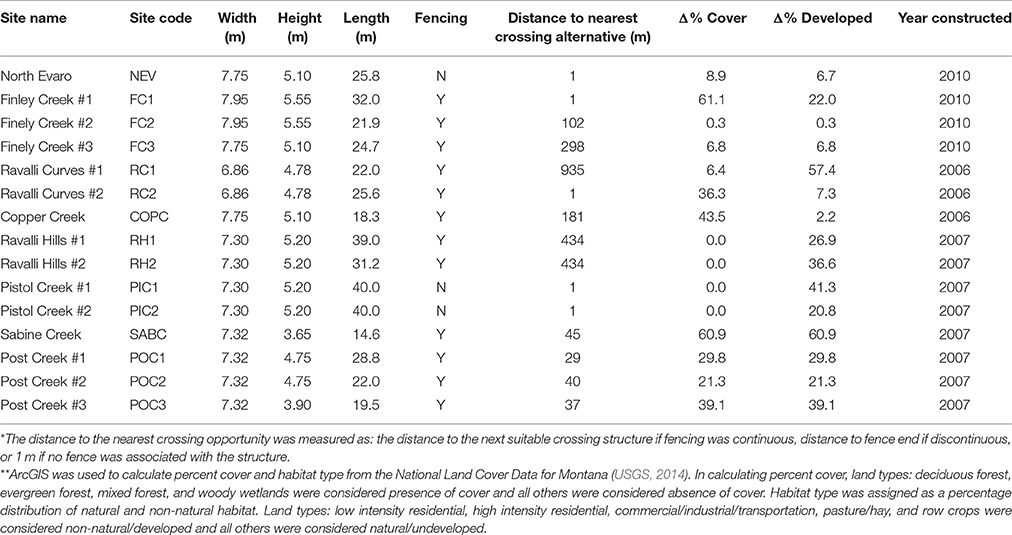
Table 1. Structural and locational attributes of the elliptical, corrugated metal wildlife crossing structures monitored in the study including dimensions, presence of associated wildlife exclusion fencing, distance to nearest crossing alternatives*, percent difference in development and cover in surrounding habitat on either side of the road**, and year of construction.
Monitoring Scheme and Sampling Methodology
We installed motion-sensing trail cameras (HyperFire PC900 ReconyxTM; Holmen, WI) with infrared illumination to record wildlife. Two cameras were installed at each structure—one at each entrance. Ten additional cameras were installed at randomly generated locations within a 300 by 300 m control plot adjacent to each side of an underpass and the highway (five cameras on each side; Figure 2). We chose a control plot size of 300 m because this is the most restricted daily active movement radius of the most common species (White-tailed deer; Dusek et al., 1989). We assumed that animals willing to approach the road at this distance were likely to interact with the structure at a daily timescale. To simplify terminology, hereinafter we refer to the crossing structure simply as “structure” and refer to the 300 by 300 m control areas on each side of the crossing structure as “surroundings.” We use the term “site” to refer to both the surroundings and structure at a given crossing structure location.
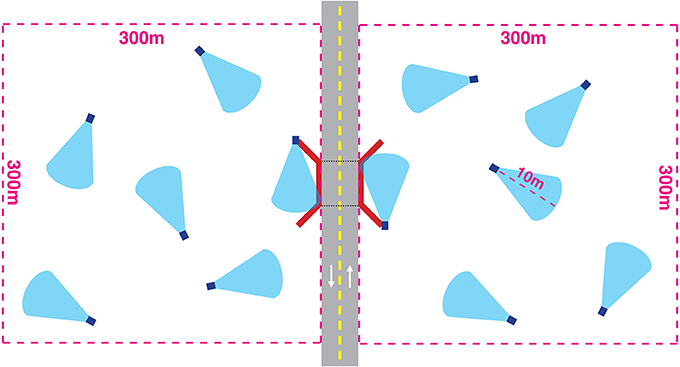
Figure 2. Camera placements in relation to a wildlife highway crossing structure (not to scale). Twelve HyperFire PC900 ReconyxTM trail cameras (dark blue squares indicate cameras, light blue cone indicates approximate 40° sampling window) were installed at each site for ~2 weeks at each site. Ten cameras were installed at randomly generated points at least 50 m apart within a 300 m by 300 m area adjacent to each side of the structure (red lines represent concrete retaining walls associated with all crossing structures). Two cameras were installed at each entrance to the structure. Cameras were installed ~3 m from the ground and a stake was placed to demarcate a 10 m viewing distance commensurate with the viewing distance of the cameras at the structure entrance.
We chose to use the same sampling method to record wildlife movements at both the structure and surroundings in order to control for species-specific detection rates that contribute bias to studies using multiple detection methods (Ford et al., 2009). All cameras were set to capture a rapid succession of 10 images per trigger event. In order to standardize the observation range, we placed a stake 10 m from the camera. Only individual animals that crossed within 10 m and associated conspecific animals in a group were considered for analysis. The infrared illumination from the trail cameras is effective up to 15 m. By restricting our observations to 10 m we reduced the possibility of false negatives. The entrances to the structures are generally slightly narrower than 10 m. To maintain consistent measurements, we moved cameras at structures out from the entrance along the angled retaining wall until a 10 m viewing distance parallel to the road was reached (usually 1–2 m from the entrance). Remote monitoring by camera traps was carried out in accordance with the approval of University of Montana Instructional Animal Care and Use Committee.
We were not able to reliably identify individual animals from camera images; therefore, we treated an observation of a unique movement as our sampling unit. A movement was defined as any animal recorded within 10 m of the camera separated by at least 5 min from the next observation. Allen (2011) found that, in the same study area, for groups of the three most common species (white-tailed deer, mule deer, and black bear), either all or none of the individuals in a group crossed through underpasses. Because underpasses are flanked by retaining walls, all animals that enter must cross within the 10 m observational distance of the camera. Therefore, in order to compare observations between the structures and surroundings, for obvious conspecific groups in the surroundings, all animals in the group were recorded as individual movements if at least one animal in the group crossed within 10 m viewing window.
The 12 cameras at a site (10 in surroundings, 2 at the structure) remained in place for ~2 weeks before we moved them to another site. The order in which sites were sampled was randomly assigned to reduce correlation between the effect of location and season. However, the order was also subject to our ability to obtain landowner permission to access the site. In cases where we could not immediately access a site, that site was skipped until permission could be obtained.
Analysis of Structure Performance
Total movements recorded in a 24 h period from cameras at a site were summed and divided by the number of cameras deployed at the structure or in the surroundings, respectively, to get observed and expected daily movement rates. Only cameras that operated for all sampling days at a site, and only full 24-h days were considered in analysis. Rates recorded in the surroundings and at the structure from the same 24 h period were compared to control for within-day temporal variability. Prior to statistical analysis, we tested daily performance measures for temporal autocorrelation between days, finding none.
In order to assess a structure's effectiveness, we calculated performance differentials for each structure, broken down into species and species groups. We also calculated an overall effectiveness of all structures collectively for each species and species group. To calculate performance differentials, expected crossing rates from the surroundings were subtracted from observed crossing rates at the structure. We treated the movement rates in the surrounding habitat as an expected crossing frequency as this is the movement rate we would expect if no road barrier existed. Therefore, a positive differential indicated that animals moved through the structure more than expected, whereas negative differentials indicated that animals avoided the crossing structures.
While useful for determining effectiveness, differentials are less useful for biological interpretation as the difference of one individual may be more or less important given the size of the population or rarity of the species. Therefore, we also calculated a percentage difference between rates at the structure and in the surrounding by dividing the differential by the expected rate from the surroundings then multiplying by 100. If the ratio was the undefined value zero over zero, we defined this as a percent difference of zero, since this case represents the same crossing rate at the structure as expected from the surrounding. The percent difference centered at zero, and positive values indicated positive performance while negative values indicated structure avoidance.
We estimated average performance measures (differential and percentage difference) for each structure from the data and used nonparametric bootstrap resampling procedures over 100,000 iterations to construct bias corrected and accelerated (BCa) 95% confidence intervals at each structure using the boot package in R (Canty and Ripley, 2016). Values were calculated for the four most common species (white-tailed deer, mule deer, black bear, and coyote) and groups of animals. Groups included a deer group (Odocoileus sp.), a carnivore group (order Carnivora), and a large mammal group (all large mammals observed; Table 2). Observation rates decreased as the large mammal group was split into subsets and then into species. We excluded subset or species with fewer than two observations per structure over the sampling period.
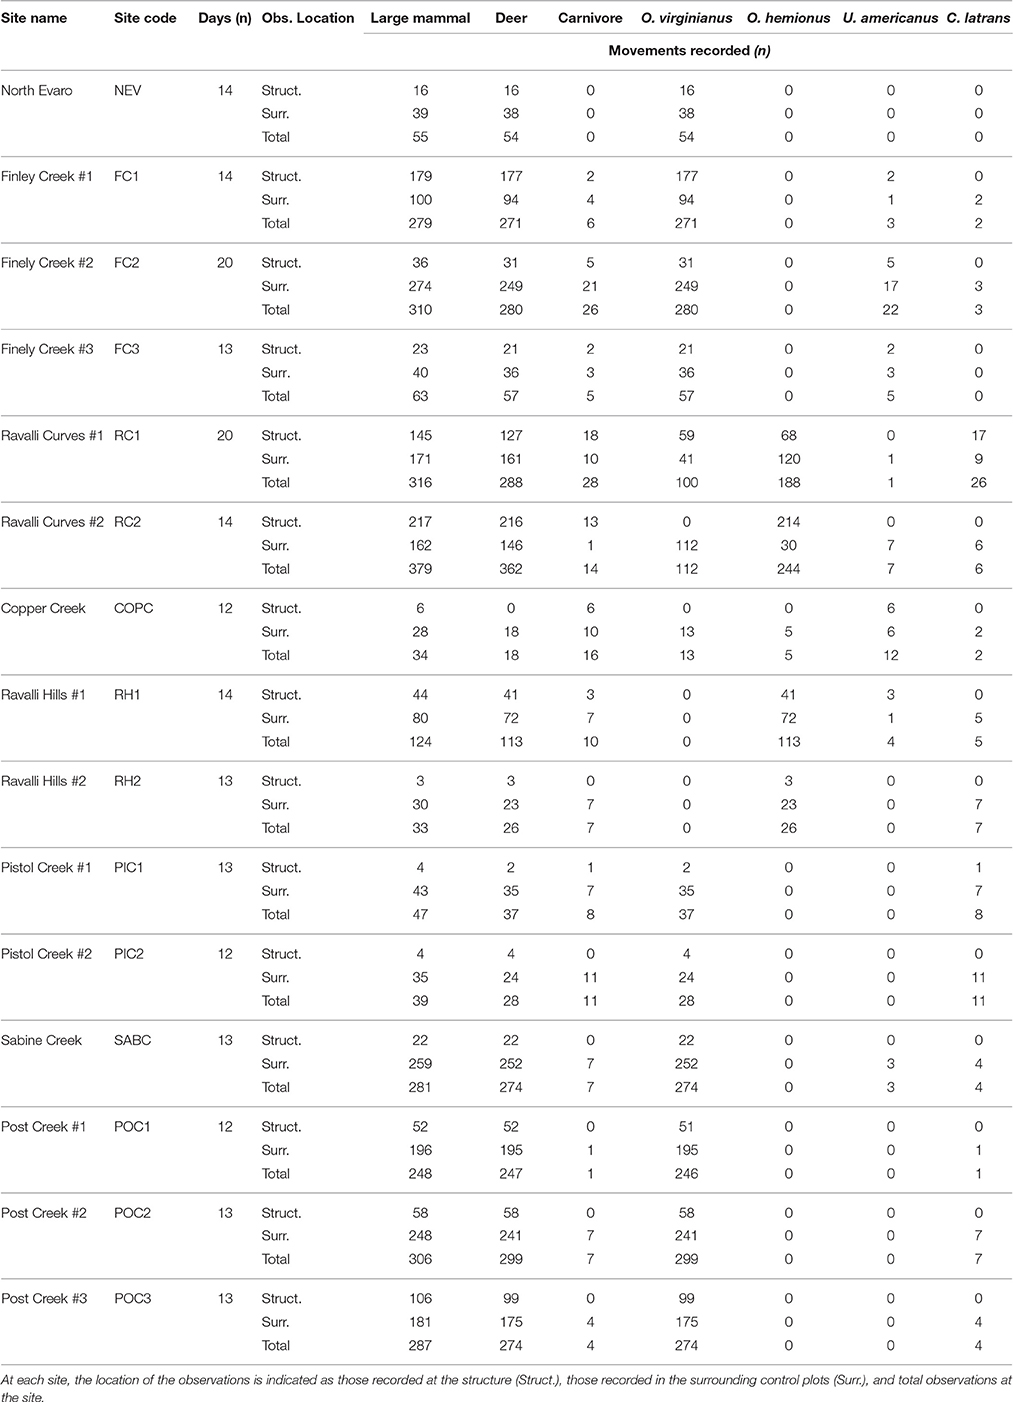
Table 2. Details on animal movements observed at underpass sites and number of full, 24-h days recorded at each site.
We calculated an overall measure of performance across all structures to determine the total effectiveness for each species and group by taking the mean performance of each structure weighted by the number of observation days at each site, then used a weighted one-sample t-test to test if the overall differential was zero, along with Bonferroni corrections. In order to construct confidence intervals for these estimates, we employed a multistage, nonparametric bootstrapping procedure, first resampling daily performance within structures with 10,000 iterations, then resampling average performance between structures with 10,000 iterations to yield an overall BCa 95% CI for each species and group. Structures that were excluded from the previous analysis by structure were also excluded from the overall analysis.
In order to assess the impact of wildlife exclusion fencing on structure performance rates, we conducted a linear regression analysis on the relationship between fencing length and structure performance, weighted by the number of full 24-h days of observation recorded at the location. For this analysis, we defined the fence length associated with a structure as the road-wise distance to the nearest alternative crossing. Alternative crossing opportunities included the next suitable crossing structure if fencing was continuous or the fence end if discontinuous. If no fence was associate with a structure, or if the fence extended only from one side of a structure, we assigned a value of 0 m as the distance to nearest alternative crossing (Table 1).
Although structures were specifically selected for their similarity, the total length of the structures varied with the road width (Table 1). We tested for a relationship between structure performance and structure length by conducting a linear regression analysis weighted by observation days similar to the above analysis of fencing distances.
Finally, we used the average percent difference in movement rates to estimate the requisite percentage of road length that must be permeable in order to allow similar movement rates through the road corridor as in the immediate surroundings (Table 3). This is the total road length that must include structures of the design considered here, in order to maintain connectivity for those animals willing to come close to the highway.
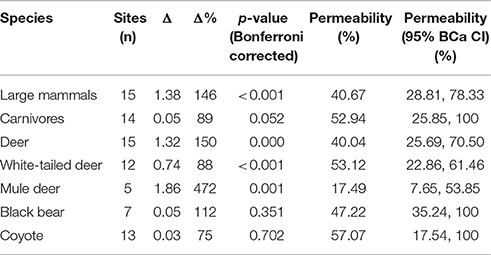
Table 3. Performance measures (average daily differential and percentage difference) for each species and species group and estimated percentage of road permeability required for 100% connectivity through the road corridor compared to movement rates in immediately surrounding habitat.
Results
Wildlife Observations
Each structure and associated control plot was monitored for a median of 14 days (range = 12–20 days) between April and November 2015 (Table 2). A total of 2,798 unique large mammal movements were recorded. Twenty-five animal species were observed (Table 4). The cameras recorded mountain lions (Puma concolor) on two occasions, however they fell on non-24 h days, and thus, were not included in the analysis.
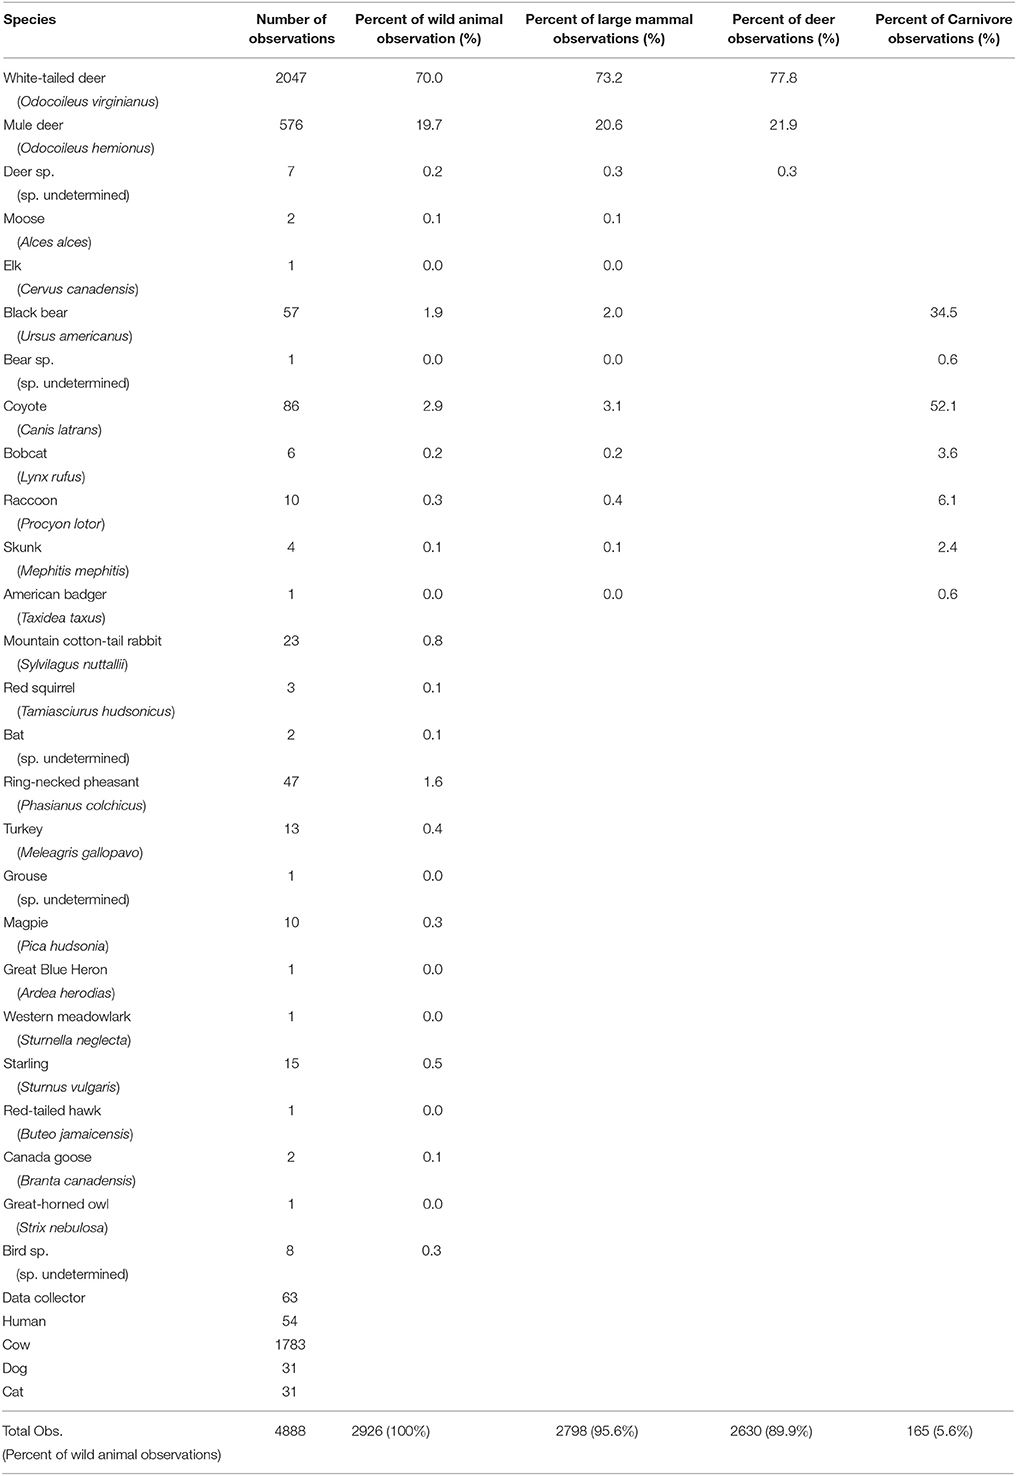
Table 4. Total observations and group percentages of animal movements at both structure and control plots (combined total) in the study along US93 within the Flathead Indiana Reservation, Montana for April through November 2015.
Of the total movements, 886 (30.3%) were recorded at structure entrances and 2,040 (69.7%) were recorded in control plots. The number of movements recorded varied among sites (mean = 193, max = 381, min = 34), as did the number of movements per day (mean = 1.22, SD = 0.84).
Structure Performance
Overall, structures exhibited significantly positive performance with all species and species groups moving through the crossing structures more often than expected based on movement rates in the surrounding habitat (Figure 3). Of the 15 total structures, 11 exhibited positive performance measures for large mammals, six of which were significant. Performance for large mammals was significantly negative at only 1 structure (SABC). On average, we observed 146% more large mammal movements per day at the structures than would have been expected based on movements in the surrounding habitat (BCa 95% CI [27.7, 254.8]) corresponding to 1.38 more movements per day (BCa 95% CI [0.26, 2.40]) (Table 3).
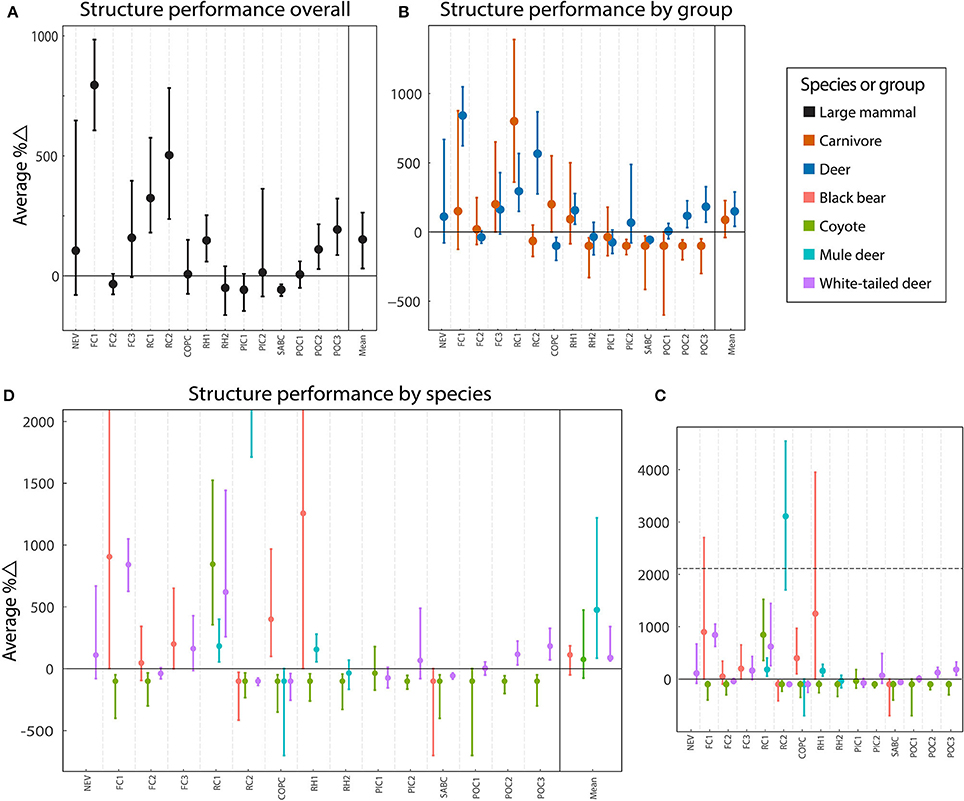
Figure 3. Average percent difference in performance between movements at wildlife crossing structures and in the surrounding habitat for each site and all averaged across sites for species and species groups. Observations are subdivided from all large mammals (A), to species groups (carnivore and deer) (B), to individual species (black bear, coyote, white-tailed deer, and mule deer) (C). To make smaller values easier to see, the y-axis in the plot displaying performance by species has been expanded and truncated (D). The horizontal, dotted line in (C) indicates the truncation point for (D). Weighted mean values across all applicable sites are included in the far right of the panels. Error bars indicate bootstrap BCa 95% confidence intervals.
As groups, performance across all structures was positive for both deer and carnivores with 149.8% (BCa 95% CI [41.8, 289.2], p < 0.001) and 88.9% (BCa 95% CI [−38.7, 227.3]) more movements than expected, respectively (Table 3). However, the relationship was not significant for the carnivore group after Bonferroni corrections (p = 0.052). For deer, performance was positive at 10 structures, and negative at five (Figure 3). Carnivores were present at 14 structures, of which 6, a minority, exhibited positive performance (Figure 3).
When considered for each species, performance was positive and of similar magnitude for white-tailed deer (Δ% = 88.2, BCa 95% CI [62.7, 337.4], p < 0.001], black bear (Δ% = 111.8, BCa 95% CI [−49.0, 183.8], p = 0.35), and coyote (Δ% = 75.2, BCa 95% CI [−73.4, 470.2], p = 0.70]; however, the differential was not significantly different from zero for either carnivore species (Table 3). Performance for mule deer showed the most highly positive difference with 471.7% more movements through the structures than expected (BCa 95% CI [85.7, 1207.8], p = 0.001; Table 3].
Performance for all species was considerably variable across structures (Figure 3). Performance for coyotes was the most consistent with negative performance at 12 of 13 structures. Performance was generally positive for white-tailed deer (seven of 13 structures), black bear (five of seven structures), and mule deer (three of five structures). Performance for mule deer showed the greatest range with 3110% more crossing than expected at RC2 and 100% fewer crossings at COPC. Only one structure, RC1 showed consistently more crossings than expected for all species. Three structures, RH2, PIC1, and SABC showed consistently less crossings than expected. At most structures, performance was split by species.
The distance to the nearest crossing alternative, due to exclusion fencing, was the one variable that we would expect to affect all species similarly as it is a physical barrier intended to funnel animals to the crossing structures (Huijser et al., 2016b). However, a regression weighted by observations days to test the association between mean performance of large mammals and the distance to the nearest crossing alternative was insignificant (β = 0.08, R2 = 0.004, p = 0.17; Figure 4). In fact, removing one site with high leverage (RC1) produces a significantly negative, although very weak, slope (β = −0.35, R2 = 0.05, p = 0.001). Similarly, the association between structure length and mean performance of large mammals was insignificant (β = 1.42, R2 = 0.002, p = 0.50; Figure 5).
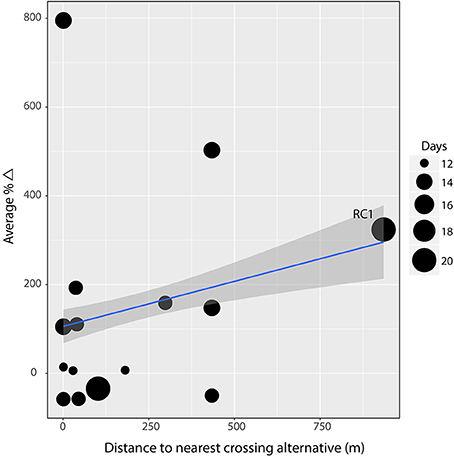
Figure 4. Linear regression on weighted average percent difference in performance against the distance an animal must travel away from the crossing structure at the site to access the nearest alternative crossing opportunity. There is no evidence (β = 0.08, R2 = 0.004, p = 0.17) that the distance (in meters) an animal must travel to find an alternative crossing associates with performance. Gray band indicates 95% confidence interval and point size indicates number of days of observation at the site. The data point for site Ravalli Curve #1 (RC1) exhibited high leverage. When removed, the slope becomes significantly negative (β = −0.35, R2 = 0.05, p = 0.001).
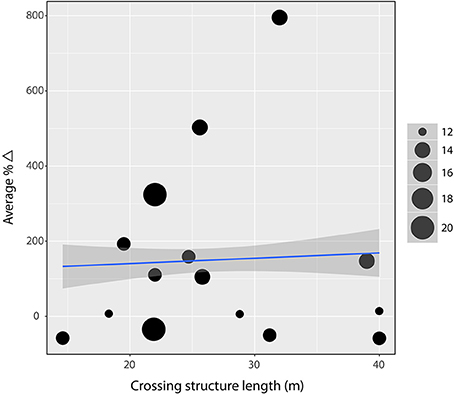
Figure 5. Linear regression on weighted average percent difference in performance against structure length. There is no evidence (β = 1.42, R2 = 0.002, p = 0.50) that the length (in meters) of a structure associates with performance. Gray band indicates 95% confidence interval and point size indicates number of days of observation at the site.
Permeability of Road Corridor
We estimate that in order to allow full connectivity for large mammals, the road corridor must include crossing structures of the design considered in this study along 40.7% of the total road length (Table 3). To illustrate this point, consider an example wherein large mammals are observed in the surroundings at a rate of 2.460 per unit time vs. 1 per unit time at the structure. This is a percent difference of 146% (corresponding to the observed Δ% in performance for large mammals found in this study). Since both the rate at the structure and in the surroundings were calculated for the same observational distance (10 m), each unit of crossing width permits the same connectivity as 2.460 units of distance in the surrounding; or, inversely, every 0.407 unit of crossing structure width allows the same movement rate as 1 unit distance in the surrounding. Thus, if the goals is to allow enough connectivity to maintain the same movement rates through the structure as in the immediate surroundings, 40.7% of the total road length must be permeable.
We estimate that including structures of this design along 28.2 to 78.6% of the total road corridor would allow full connectivity for all four of the focal species considered in this study (Table 3).
Discussion
Wildlife crossings can provide conservation value in many ways and at many scales; however, determining the success of a given project depends on the intended purpose of the crossing structure(s) (Clevenger and Waltho, 2005). In the case of the US 93 highway upgrade project, mitigation efforts had two goals: minimize wildlife-vehicle collisions and maintain or improve habitat connectivity for wildlife by providing safe crossing opportunities (Marshik et al., 2001; Hardy et al., 2007; Huijser et al., 2016a). For this study, we defined success as performance differentials greater than or equal to zero, meaning that animals were at least as likely to move through a crossing structure as adjacent habitat and did not avoid traveling through the structures.
Overall, for large mammals as a community and all individual species, structures exhibited positive performance, or at least, did not exhibit significant evidence that performance was negative. This suggests that the structures were successful in one of their intended purposes: to maintain or improve habitat connectivity for wildlife by promoting movement across the road corridor through crossing structures. It should be noted that this project-wide analysis applies only to sampled road lengths that necessarily include underpasses. This is only a fraction of the total road length in the study area. In other words, the project may be successful in reducing fragmentation where crossing structures have been installed, but not necessarily over the entire road length. For example, if no animals cross the road at-grade, one would still need to make 40.7% of the road length permeable to eliminate the barrier effect for large mammals willing to come close to the road. In the context of the 90 km US 93 project, that would translate to an installation density of 3.7 10 m wide structures per kilometer of road. Currently, the total width of all crossing structures on this section of US 93 is 573 m (Huijser, unpublished data), resulting in just 0.6% permeability. Granted, other structure designs included in the US 93 project may permit more or less large mammal connectivity. Performance data are needed for the other structure designs in order to calculate true percentage permeability permitted along the entire road corridor.
Many studies have shown the importance of crossing structure size/design on passage rates (e.g., Yanes et al., 1995; Clevenger and Waltho, 2000; Ascensão and Mira, 2007) while others have demonstrated that location is most important (Foster and Humphrey, 1995; Land and Lotz, 1996). To help illuminate this question, we investigated the effects of location when such structural design parameters are fixed. Although performance was positive for all scales analyzed from community to individual species, the performance of individual structures for species passage was highly variable. This demonstrates that even congruent structures of the same design can yield very different performance, suggesting that location may be more important than design.
Very few wildlife-focused road projects include multiple structures of similar designs to adequately compare as replicates (van der Ree et al., 2007). Given the variability demonstrated by our structure type, this highlights the need for caution in extending conclusions about performance of structure or location attributes from studies of a single structure or groups of unreplicated structure designs.
A persistent concern in wildlife crossing design is the potential for underpass structures to act as prey traps causing prey species to avoid structures utilized by predators (Little et al., 2002). If prey species had learned to avoid structures with high predator concentration we would have expected to see opposite performance between prey and predators at individual structures. We did not see this trend; in fact, at half of all structures used by both carnivores and deer, the sign of the performance measure was the same for both groups. It is possible that prey species have coordinated underpass use to time periods when predators are absent, a pattern that would not be resolved at the daily timescale recorded in this study. However, Ford and Clevenger (2010) specifically tested for this type of behavioral assortment and found no such temporal correlation of use between predator followed by prey and the converse for either <8 or <48 h intervals. Interestingly, some of the highest performance values for both black bear and white-tailed deer were observed at FC1, granted black bears are not the most significant predator for adult deer. Multiple alternative crossing, including one vegetated overpass and three elliptical, arch-style wildlife underpasses, are located within just a few hundred meters of FC1. Despite ready alternative crossings, these species did not appear to selectively assort into different crossing preferences.
Similarly, FC1 was the only structure through which livestock regularly passed, whereas the four proximal alternative crossings exclude livestock but permit deer and bear. Although more data is needed, this suggests that at certain sites, the coincident use of a structure by livestock may not be a significant deterrent to some species of large mammals as is often assumed (Ruediger and Jacobson, 2013).
When performance for large mammals overall is considered in association with only fence length (represented as distance to nearest alternative crossing), there is no evidence of an effect. If wildlife fencing is truly funneling wildlife to the structures, we would have expected to find higher crossing numbers through the structures with increasing fence length. Huijser et al. (2016b) found that wildlife fencing along US93 shorter than about 5,000 m was less effective than longer fencing at reducing wildlife vehicle collisions. The maximum fenced length to the nearest crossing alternative in our study was under 1,000 m. It should be noted that, Huijser et al. (2016b) considered total fencing length, whereas our study only considered distance to the nearest alternative crossing point. It may be that animals were selecting alternative structure designs instead of the structures in this study, or that animals have become habituated to cross the road corridor less in sections where fencing is a barrier. It is also worth noting that Huijser et al. (2016b) included only isolated structures in their analysis whereas this study includes both isolated structures and those connected by fencing to other structures, many of different design than considered here. Until a similar performance analysis has been conducted on the other structure designs connected to the focal structures, it is impossible to determine the absolute effect of fencing length on performance. For instance, site RC1 in this study has the greatest distance to an alternative crossing (935 m), almost double that of any other site. RC1 also exhibited the highest leverage in the regression analysis, and when removed, led to an opposite result. Analyzing more structure with a range of fencing lengths, or experimentally manipulating fencing length may help to isolate the effect of fencing length for structure performance.
Generally, the results from this association study should be interpreted in context. No observational study can assign causation, and correlation may be confounded because structures are not placed at random in a road. Planners use wildlife vehicle collision, carcass counts, biological surveys, and biological inference to determine the best placement of structures (Huijser et al., 2008). Political and physical limitations further refine where a structure is ultimately placed. As such, the intentional placement of structures invariably correlates structures with locational attributes.
While the use of camera traps as a method of recording animal movements afforded an understanding of general trends within the focal large mammal populations, it did not allow for tracking of individual animal behavior. As such, we were not able to conclusively determine if a particular specie's behavior, such as, a proclivity to forage in a single location, influenced our estimates. Although, we believe that the 5 min threshold between observations of conspecifics mitigated most of this potential error.
The strength of this study comes from controlling for relative abundance, spatial and temporal variability, and variability of structure design. Furthermore, replication allowed for strong statistical inference. Using identical cameras to record both observed and expected crossing frequencies negated any detection variability. Sampling immediately adjacent to the road controlled for habitat variability between the crossing structure and surroundings. This pilot study suffered from limited sampling periods at each site as a trade-off in favor of rapid assessment of many structures. This disallowed strong conclusions about more cryptic taxa like black bear, bobcat, elk, moose, and mountain lion. Longer sampling periods with replicate sampling of the same structure in different seasons would strengthen a future study.
In the absence of large-scale, manipulative experiments to test structure design and locational attributes in controlled settings, the field of road ecology must utilize rigorous observational, control-impact design. More replicates of structure variables will translate to greater power to detect associations with performance. With every new wildlife-friendly road construction project, new potential data points enter the field. In order to ensure that these new data points can be utilized as replicates in statistical analysis of the effectiveness of structure design, we suggested that subsequent crossing structure assessments utilize sampling methodology similar to this study that controls for temporal and spatial variability and variability in detection rates.
Author Contributions
AA designed, collected data, analyzed, and wrote up this study. MH designed and wrote-up this study. LB designed this study.
Funding
This research was funded in part through contributions from the Montana Department of Transportation (MDT), the Federal Highway Administration (FHWA), the U.S. Department of Transportation through its Research & Special Programs Administration (RSPA), and Western Transportation Institute at Montana State University. Support was provided by the Wyss Foundation, Leonard and Sandy Sargent Fellowship, the Byron and Bernice Dawson Award, and the Ucross High Plains Stewardship Initiative.
Conflict of Interest Statement
The authors declare that the research was conducted in the absence of any commercial or financial relationships that could be construed as a potential conflict of interest.
Acknowledgments
The authors would like to thank the Confederated Salish and Kootenai Tribes for permission to conduct research on tribal lands and the Montana Department of Transportation for permission to access the highway right of way corridor. We thank Whisper Camel-Means, Jon Graham, Dave Patterson, Liz Fairbank, Jeremiah Purdum, and Natalie Dawson for help in design, data collection, and/or analysis of the study. We would like to thank field assistants Jacob Hardy, Ian Hamilton, Katie Jacquet, and Brennan Boots for substantial help with data collection. Portions of this work were originally included in the author's Master's thesis (Andis, 2016).
References
Allen, T. D. H. (2011). The Use of Wildlife Underpasses and the Barrier Effect of Wildlife Guards for Deer and Black Bear. Master's thesis, Montana State University, Bozeman, MT.
Andis, A. Z. (2016). Performance Measures of Road Crossing Structures From Relative Movement Rates of Large Mammals. Master's thesis, University of Montana, Missoula, MT.
Ascensão, F., and Mira, A. (2007). Factors affecting culvert use by vertebrates along two stretches of road in Southern Portugal. Ecol. Res. 22, 57–66. doi: 10.1007/s11284-006-0004-1
Clevenger, A. P., and Waltho, N. (2000). Factors influencing the effectiveness of wildlife underpasses in Banff national park, Alberta, Canada. Conserv. Biol. 14, 47–56. doi: 10.1046/j.1523-1739.2000.00099-085.x
Clevenger, A. P., and Waltho, N. (2005). Performance indices to identify attributes of highway crossing structures facilitating movement of large mammals. Biol. Conserv. 121, 453–464. doi: 10.1016/j.biocon.2004.04.025
Coffin, A. W. (2007). From roadkill to road ecology: a review of the ecological effects of roads. J. Transp. Geogr. 15, 396–406. doi: 10.1016/j.jtrangeo.2006.11.006
Cramer, P. C., and Bissonette, J. (2007). “Integrating wildlife crossing into transportation plans and projects in North America,” in Proceedings of the 2007 International Conference on Ecology and Transportation, eds C. L. Irwin, D. Nelson, and K. P. McDermott (Raleigh, NC: Center for Transportation and the Environment, North Carolina State University), 328–334. Available online at: http://www.icoet.net/ICOET_2007/proceedings/Chapter6c.pdf
D'Amico, M., Périquet, S., Román, J., Revilla, E., and Hayward, M. (2016). Road avoidance responses determine the impact of heterogeneous road networks at a regional scale. J. Appl. Ecol. 53, 181–190. doi: 10.1111/1365-2664.12572
Dulac, J. (2013). “Global land transport infrastructure requirements: estimating road and railway capacity and costs to 2050,” in International Energy Agency. Available online at: https://www.iea.org/publications/freepublications/publication/TransportInfrastructureInsights_FINAL_WEB.pdf
Dusek, G. L., MacKie, R. J., Herriges, J. D. Jr., and Compton, B. B. (1989). Population ecology of white-tailed deer along the lower yellowstone. Wildlife Monogr. 104, 3–68.
Ford, A. T., and Clevenger, A. P. (2010). Validity of the prey-trap hypothesis for carnivore-ungulate interactions at wildlife-crossing structures. Conserv. Biol. 24, 1679–1685. doi: 10.1111/j.1523-1739.2010.01564.x
Ford, A. T., Clevenger, A. P., and Bennett, A. (2009). Comparison of methods of monitoring wildlife crossing-structures on highways. J. Wildl. Manage. 73, 1213–1222. doi: 10.2193/2008-387
Forman, R. T. T. (2000). Estimate of the area affected ecologically by the road system in the United States. Conserv. Biol. 14, 31–35. doi: 10.1046/j.1523-1739.2000.99299.x
Forman, R. T. T., and Alexander, L. E. (1998). Roads and their major ecological effects. Annu. Rev. Ecol. Syst. 29, 207–231.
Foster, M. L., and Humphrey, S. R. (1995). Use of highway underpasses by Florida panthers and other wildlife. Wildl. Soc. Bull. 23, 95–100.
Glista, D. J., DeVault, T. L., and DeWoody, J. A. (2009). A review of mitigation measures for reducing wildlife mortality on roadways. Landsc. Urban Plan. 91, 1–7. doi: 10.1016/j.landurbplan.2008.11.001
Grilo, C., Bissonette, J. A., and Cramer, P. C. (2010). “Mitigation measures to reduce impacts on biodiversity,” in Highways: Construction, Management, and Maintenance, ed S. R. Jones (Hauppauge, NY: Nova Science Publishers), 73–114.
Hardy, A. R., Fuller, J., Huijser, M. P., Kociolek, A., and Evans, M. (2007). Evaluation of Wildlife Crossing Structures and Fencing on US Highway 93 Evaro to Polson – Phase I: Preconstruction Data Collection and Finalization of Evaluation Plan Final Report. FHWA/MT-06-008/1744-2. Helena, MT: Montana Department of Transportation. Available online at: http://www.mdt.mt.gov/research/projects/env/wildlife_crossing.shtml
Huijser, M. P., Camel-Means, W., Fairbank, E. R., Purdum, J. P., Allen, T. D., Hardy, A. R., et al. (2016a). US 93 North Post-Construction Wildlife-Vehicle Collision and Wildlife Crossing Monitoring and Research on the Flathead Indian Reservation Between Evaro and Polson, Montana Final Report. Bozeman, MT: Western Transportation Institute, College of Engineering, Montana State University. Available online at: http://docs.wixstatic.com/ugd/9d46fb_77ebf7dec9694c0493cd94af4eff63e4.pdf
Huijser, M. P., Fairbank, E. R., Camel-Means, W., Graham, J., Watson, V., Basting, P., et al. (2016b). Effectiveness of short sections of wildlife fencing and crossing structures along highways in reducing wildlife-vehicle collisions and providing safe crossing opportunities for large mammals. Biol. Conserv. 197, 61–68. doi: 10.1016/j.biocon.2016.02.002
Huijser, M. P., McGowen, P., Fuller, J., Hardy, A., Kociolek, A., Clevenger, A. P., et al. (2008). Wildlife-Vehicle Collision Reduction Study, Report to Congress. (Washington, DC: U.S. Department of Transportation, Federal Highway Administration). Available online at http://www.fhwa.dot.gov/publications/research/safety/08034/
Kociolek, A. V., Ament, R. J., Callahan, A. R., and Clevenger, A. P. (2015). Wildlife crossings: the new norm for transportation planning. Ite J. Inst. Transp. Eng. 85, 45–47. Available online at: https://arc-solutions.org/wp-content/uploads/2015/05/ITEJApr15-Ament.pdf
Kroll, G. (2015). An environmental history of roadkill: road ecology and the making of the permeable highway. Environ. Hist. 20, 4–28. doi: 10.1093/envhis/emu129
Land, D., and Lotz, M. (1996). “Wildlife crossing designs and use by Florida panthers and other wildlife in Southwest Florida,” in Transportation and Wildlife: Reducing Wildlife Mortality and Improving Wildlife Passageways across Transportation Corridors FHWA-PD-96-041, Vol. 6, eds G. L. Evink, P. Garrett, D. Zeigler, and J. Berry (Orlando, FL; State of Florida Department of Transportation). Available online at: National Technical Information Service database (Accession No. 00745676).
Little, S. J., Harcourt, R. G., and Clevenger, A. P. (2002). Do wildlife passages act as prey-traps? Biol. Conserv. 107, 135–145. doi: 10.1016/S0006-3207(02)00059-9
Marshik, J., Renz, L., Sipes, J., Becker, D., and Paulson, D. (2001). “Preserving a spirit of place: U.S. Highway 93 on the Flathead Indian Reservation,” in Proceedings of the 2007 International Conference on Ecology and Transportation, eds C. L. Irwin, D. Nelson, and K. P. McDermott (Raleigh, NC: Center for Transportation and the Environment, North Carolina State University), 244–256. Available online at: http://www.icoet.net/ICOET_2007/proceedings/Chapter6c.pdf
Montana Department of Transportation, MDT. (2014). Traffic Data Collection and Analysis Section. Montana's Automatic Traffic Recorders. Available online at: http://www.mdt.mt.gov/publications/docs/datastats/atr/atrbook14.pdf
Ng, S. J., Dole, J. W., Sauvajot, R. M., Riley, S. P. D., and Valone, T. J. (2004). Use of highway undercrossings by wildlife in Southern California. Biol. Conserv. 115, 499–507. doi: 10.1016/S0006-3207(03)00166-6
Ruediger, W. C., and Jacobson, S. L. (2013). “Multiple-use crossing structures for providing wildlife habitat connectivity,” in Proceedings of the 2013 International Conferences on Ecology and Transportation (Scottsdale, AZ). Available online at: http://www.icoet.net/ICOET_2013/proceedings.asp
Rytwinski, T., van der Ree, R., Cunnington, G. M., Fahrig, L., Findlay, C. S., Houlahan, J., et al. (2015). Experimental study designs to improve the evaluation of road mitigation measures for wildlife. J. Environ. Manage. 154, 48–64. doi: 10.1016/j.jenvman.2015.01.048
Spellerberg, I. F. (1998). Ecological effects of roads and traffic: a literature review. Global Ecol. Biogeogr. Lett. 7, 317–333. doi: 10.2307/2997681
Trombulak, S. C., and Frissell, C. A. (2000). Review of ecological effects of roads on terrestrial and aquatic communities. Conserv. Biol. 14, 18–30. doi: 10.1046/j.1523-1739.2000.99084.x
U.S. Department of Transportation (USDOT). (2017). Bureau of Transportation Statistics. National Transportation Statistics 2017. Available online at: https://www.rita.dot.gov/bts/sites/rita.dot.gov.bts/files/NTS_Entire_2017Q2.pdf
van der Grift, E. A., van der Ree, R., Fahrig, L., Findlay, S., Houlahan, J., Jaeger, J. A. G., et al. (2013). Evaluating the effectiveness of road mitigation measures. Biodivers. Conserv. 22, 425–448. doi: 10.1007/s10531-012-0421-0
van der Grift, E. A., van der Ree, R., and Jaeger, J. A. G. (2015). “Guidelines for evaluating the effectiveness of road mitigation measures,” in Handbook of Road Ecology, eds R. van der Ree, D. J. Smith, and C. Grilo (Chichester: John Wiley & Sons, Ltd.), 129–137. doi: 10.1002/9781118568170.ch16
van der Ree, R., van der Grift, Gulle, N., Holland, K., and Mata, C., Suarez, F. (2007). “Overcoming the barrier effect of roads – how effective are mitigation strategies?: an international review of the use and effectiveness of underpasses and overpasses designed to increase the permeability of roads for wildlife,” in Proceedings of the 2007 International Conference on Ecology and Transportation, eds C. L. Irwin, D. Nelson, and K. P. McDermott (Raleigh, NC: Center for Transportation and the Environment; North Carolina State University), 423–431. Available online at: http://www.icoet.net/ICOET_2007/proceedings/Chapter6c.pdf
Wang, M., and Schreiber, A. (2001). The impact of habitat fragmentation and social structure on the population genetics of roe deer (Capreolus capreolus L.) in Central Europe. Heredity 86, 703–715. doi: 10.1046/j.1365-2540.2001.00889.x
Keywords: road ecology, fragmentation, connectivity, mammal, highway, underpass, mitigation
Citation: Andis AZ, Huijser MP and Broberg L (2017) Performance of Arch-Style Road Crossing Structures from Relative Movement Rates of Large Mammals. Front. Ecol. Evol. 5:122. doi: 10.3389/fevo.2017.00122
Received: 31 May 2017; Accepted: 22 September 2017;
Published: 26 October 2017.
Edited by:
Rodney Van Der Ree, University of Melbourne, AustraliaReviewed by:
Jeff Gagnon, Arizona Game and Fish Department, United StatesDaniel J. Smith, University of Central Florida, United States
Copyright © 2017 Andis, Huijser and Broberg. This is an open-access article distributed under the terms of the Creative Commons Attribution License (CC BY). The use, distribution or reproduction in other forums is permitted, provided the original author(s) or licensor are credited and that the original publication in this journal is cited, in accordance with accepted academic practice. No use, distribution or reproduction is permitted which does not comply with these terms.
*Correspondence: A. Z. Andis, YS5hbmRpc0B5YWxlLmVkdQ==