 Jan Jansen
 Nicole A. Hill
 Piers K. Dunstan
 Marc P. Eléaume4
- 1Institute for Marine and Antarctic Studies, University of Tasmania, Hobart, TAS, Australia
- 2Australian Antarctic Division, Kingston, VIC, Australia
- 3CSIRO Oceans and Atmosphere, Hobart, TAS, Australia
- 4Muséum National d'Histoire Naturelle, UMR 7205-ISYEB, Centre National de la Recherche Scientifique-UPMC-EPHE, Paris, France
Benthic marine biodiversity on the Antarctic continental shelf is high and unique, yet its distributional patterns are still relatively poorly understood. Some of the main issues are that biological data are sparse, and that many species are rare and seem only weakly related to environmental conditions. Grouping species by taxonomic or functional similarity has historically been used to compensate for missing species identification, to generate a more widespread distribution of data-points, and this practice can help to gain a better understanding of the distribution of biodiversity. However, there are few guidelines on how to group species, the implicit assumptions about species associations in the groups are difficult to validate, and the information loss associated with grouping species is unknown. Here, we analyse whether grouping benthic macrofaunal species by taxonomic or functional similarity preserves distributional patterns seen in species distributions, using a model-based approach called “species archetype model” that groups species or other units based on the similarity in their responses to environmental factors. Using presence-absence data, the species archetype models identify twice as many assemblages when used on the highest taxonomic resolution data, than when applied to taxonomic data at lower resolution (e.g., class) or functional groups based on mobility, feeding type, and body shape. Further, confidence in the predictions of either taxonomic or functional groups is far less than for predictions based on the highest taxonomic resolution data. Although using functional groups is often thought to accumulate species with similar environmental responses, our analysis shows that functional groups may insufficiently resolve assemblage structure for presence-absence data. Model-based approaches provide key information to understanding the regional distribution of Antarctic marine biodiversity, and care needs to be taken when using a-priori groupings of species to make statements about the distribution of biodiversity.
Introduction
The ocean surrounding the Antarctic continent supports unique assemblages of highly diverse benthic marine species (Griffiths et al., 2009; De Broyer et al., 2014; Chown et al., 2015). However, the remoteness which has protected this pristine environment for a long time also means that biological data for the region are sparse (De Broyer et al., 2014). Sparse biological data, the rarity of many Antarctic species, limited environmental predictor variables (Jansen et al., 2018b) and inconsistent relationships between biological data and environmental conditions across the regions and taxa studied (Cummings et al., 2010; Convey et al., 2014) are all reasons that the distributional patterns of seafloor biodiversity around Antarctica are still relatively poorly understood (Brandt et al., 2007; Chown et al., 2015). This is an issue because lack of knowledge about the distribution of biodiversity hinders (1) informed marine spatial planning in Antarctica, including the implementation of conservation measures, (2) policy development underpinning regulation of human activity in Antarctica, and (3) predicting the response of Antarctic marine ecosystems to environmental change.
Statistical models that link the occurrence of biota with relevant environmental factors are one way of making the most of sparse biological data to understand and map the distribution of benthic communities and their biodiversity. To date efforts to map seafloor communities have either focused on a few common species of echinoids (Gutt et al., 2012; Pierrat et al., 2012), or have been based on dissimilarity metrics (Koubbi et al., 2011), expert opinion (Gutt et al., 2013), or aggregating species with functional similarity (Jansen et al., 2018a). However, while these efforts provide useful insight into the distribution of biodiversity, they either analyse only a single component of the benthic community, they lack reproducibility, or individual species responses are difficult to identify (in the case of multivariate distance based approaches).
Aggregating species by taxonomic or functional similarity is a common approach to overcome difficulties in analysis of data with many rare species (e.g., Cunningham and Lindenmayer, 2005; Rooper et al., 2014; Jansen et al., 2018a), that comprise a substantial number of the species in any community. Traditionally, species are often grouped by their taxonomy, further motivated by constraints in time, expertise, or funding. More recently, species have been aggregated or classified according to functional traits. Functional traits define a species in terms of their ecological role and can include body size, other morphological characteristics and life history traits. Further, these traits are thought to be related to the performance of a species, and therefore its occurrence and abundance, under particular environmental conditions (Webb et al., 2010). In grouping species based on functional traits, it is assumed that different species with common functional traits respond to environmental gradients in a similar way. Because this approach provides a more mechanistic understanding of the structure and function of assemblages and their response to change (Sunday et al., 2015), it has attracted much interest (Petchey and Gaston, 2006; Cadotte et al., 2015). In Antarctica, functional traits such as mobility and feeding-strategy have been described as important factors influencing species distributions, with species commonly classified into mobile deposit feeders and sessile suspension feeders (e.g., Barry et al., 2003; Jansen et al., 2018b). While sessile suspension feeders, such as Bryozoans, Corals and Sponges are often associated with steep slope habitats and rocky substrate, mobile deposit feeders such as Holothurians and a range of burying fauna inhabit softer sediments in areas with low current speeds (Barry et al., 2003). Functional approaches can result in spatial patterns that are distinctly different to those based on traditional taxonomy and inform us about how communities are structured (Stuart-Smith et al., 2013). However, there are few guidelines on how and at which level to group species, yielding a wide variety of approaches that are dependent on individual researchers. Further, the assumptions about species associations in the groups are difficult to validate and it is unknown how much information about biodiversity patterns is lost when species are grouped.
In contrast to a-priori groupings, model-based approaches, such as Species Archetype Models (SAMs; Dunstan et al., 2011), allow grouping species or other units based solely on the similarity of their response to a suite of environmental covariates. SAMs are based on generalized linear models, are defined for a range of different types of data, and importantly for our context are able to model rarer species. Also, because SAMs are purely based on environmental responses, the resulting archetypes are not a result of any a-priori assumptions about species associations. Model-based approaches are a relatively new statistical tool, but have already shown promising results for mapping species and habitat distributions (e.g., Woolley et al., 2013; Hill et al., 2017; Ovaskainen et al., 2017).
In this study, we use SAMs to map the benthic invertebrate community on the George V shelf in East Antarctica. We use presence-absence data from underwater camera images in which taxa have been identified to the highest taxonomic resolution possible, and use two additional versions of the same dataset in which species were grouped a-priori by taxonomic or functional similarity. We hypothesize that species with similar functional traits in mobility, feeding-type, and body-shape respond in a similar way to environmental conditions, and that grouping species before analysis only marginally affects predicted biodiversity patterns. Further, we hypothesize taxonomic groupings of species aggregate different functional traits, and therefore expect predicted biodiversity patterns to differ from both the analysis of functional group and of the species-data, unless niche-conservatisms is high in which case an analysis of taxonomic groups would differ only little from patterns observed in the species-data.
Methods
Study Area
The study area is the George V continental shelf and slope in East Antarctica, spanning latitudes 139°E−147°E from the Antarctic coastline to the shelf break at around 65.5°S. Water depth on the shelf is typically 500–700 m, punctuated by bathymetric features including the Mertz and Adélie Banks (200–250 m depth) and the George V and Adélie Basins (depths up to 1,300 m; Figure 1). The oceanography in this area is mainly influenced by the Mertz Glacier Tongue and the adjacent Mertz Polynya (Cougnon et al., 2013), an area of ice free water that drives water circulation (Massom et al., 2001) and supports a relatively long growing season of phytoplankton (Sambrotto et al., 2003; Beans et al., 2008). Abundant and diverse benthic communities have been found primarily on the shallower section of the shelf between 200 and 600 m and on the shelf break (Post et al., 2011), and modeling work suggests widespread cover of suspension feeders on the banks (Jansen et al., 2018a).
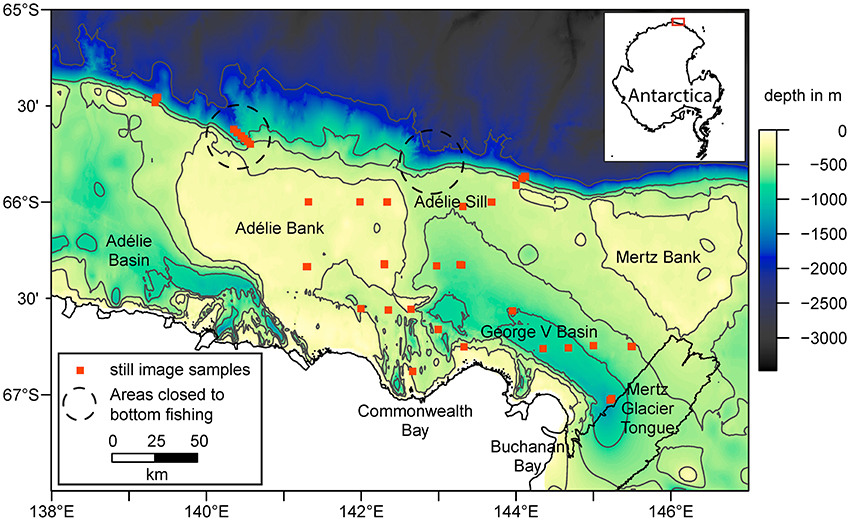
Figure 1. Overview of the George V shelf, East Antarctica. Shown are the bathymetry (Beaman et al., 2011) with selected contour lines (in gray), coastline, sample locations, and approximate location of areas closed to bottom fishing due to the presence of vulnerable marine ecosystems (Jones, 2017). The inset map in the top right corner shows the location of the study area as highlighted by the red box.
Biological Data
Data Collection and Scoring
Biological data were collected during the Collaborative East Antarctic Marine Census (CEAMARC) for the Census of Antarctic Marine Life in December 2007–February 2008 (Hosie et al., 2011).
Detailed underwater still images were obtained from a forward facing 8 megapixel Canon EOS 20D SLR with two speedlight strobes mounted on a beam trawl. Transects at 32 sites were mostly 4–6 km long (with some exceptions ranging between 3 and 16 km) and the water depth at the sample sites was between 200 and 1,550 m. The trawl was controlled using a deck winch and pictures were taken every 10 s. Fauna were identified to the lowest taxonomic resolution possible. Where species identification was not possible, specimens with similar overall appearance were grouped into morphotypes (operational taxonomic units, or OTU). The bottom third of each image was scored. For each image, the abundance of each OTU was estimated within 5% bins from 0 to 50%, and 10% bins from 50 to 100%. Although abundance was recorded from the images, the statistical method we used required reducing the data to presence-absence for analysis (see section Statistical Analysis). The image-derived data from each transect was then split at the boundaries of the environmental grid cells to ensure pictures used in the analysis all lay within the same value for the environmental covariates. A total number of 2,685 images, distributed across 41 grid cells, were used in the analysis.
Functional and Taxonomic Groupings
From the raw dataset comprising of 172 OTUs (Supplementary Table 1), we generated two aggregated datasets using expert knowledge. One dataset comprised OTUs grouped purely by taxonomy, and the other with OTUs grouped by functional traits. Each OTU was identified to the highest taxonomic resolution possible, and for each OTU we defined its mobility (mobile or sessile), its feeding-type (deposit feeders, opportunists, predators, active and passive suspension feeders), and body shape (12 categories). We chose these three categories of functional traits because they can be identified from images and expert knowledge, and because Antarctic benthic communities have been categorized in a similar way in the past, although not in such detail (Gutt et al., 2013). By aggregating OTUs with the same combination of these three functional traits, we identified 30 different functional groups (the full range of functional groups is listed in Supplementary Table 2).
Taxonomic grouping was done mostly at the class and phylum level. As a general rule, we aimed at creating a number of taxonomic groups similar to the number of functional groups to aid comparison. On average five OTUs were grouped together to form a taxonomic group, although in seven instances only a single OTU represented an isolated taxonomic group. In total, we identified 27 taxonomic groups (Supplementary Table 3).
Environmental Data
The environmental covariates used for model predictions were those that are commonly considered important for describing the habitat of benthic invertebrates. They were depth, slope of the seafloor and topographic position index derived from Beaman et al. (2011), ocean current speed, tidal current speed and temperature at the seafloor derived from an oceanographic model (Cougnon et al., 2013), and three measures for the availability of food at the seafloor from Jansen et al. (2018b) (i.e., food-particles arriving near the seafloor after sinking from the surface, horizontal flux of food along the seafloor, and food-particles settling onto the seafloor). We did not include other environmental covariates because of their high correlation with variables already selected, namely surface productivity (highly correlated with the number of sinking particles arriving near the seafloor; Pearson's r = 0.971), and roughness of the seafloor (highly correlated with slope; Pearson's r = 0.992). In the map of the settling particles, 35 out of 2,515 grid-cells contained exceptionally high values, ranging from 1,035 to 5,122. These values are likely an artifact of the modeling process rather than a pattern likely to be observed, and we therefore arbitrarily adjusted the values those cells to 1,000 particles.
Statistical Analysis
Data were analyzed using species archetype models (SAMs) (Dunstan et al., 2011), which are based on generalized linear models and define groups of taxa based on their similar responses to environmental covariates. These groups are termed “species archetypes.” Currently, SAMs are developed only for presence-absence data and count-data, and we therefore reduced our raw-dataset from percent-cover estimates to presence-absence for the SAM-analysis. For the boxplots presented in Figures 2, 5, we used the percentage-cover estimates for individual OTUs in the respective species archetypes to aid interpretation of the results. For the SAM-analysis, we considered all of the environmental covariates in section Environmental Data and included a polynomial term for depth and the logarithm for slope. We used Bayesian information criteria (BIC) for selecting the optimal number of species archetypes in each of the three datasets (OTUs, taxonomic groups and functional groups), running 50-iterations of the same model with random starts and extracting the BIC in each of these models to ensure that inference was based on the global maximum of the likelihood-surface. The model with the optimal number of species archetypes as determined by BIC (see Supplementary Figure 1 for the OTU-analysis) was then used to predict the occurrence of the species archetypes across the study area. This prediction uses the relationship identified between species archetypes and the environmental covariates, and then predict species archetype occurrence in areas where only environmental data are available. We restricted the prediction area to the continental shelf down to ~1,500 m depth, the maximum depth that the camera was deployed.
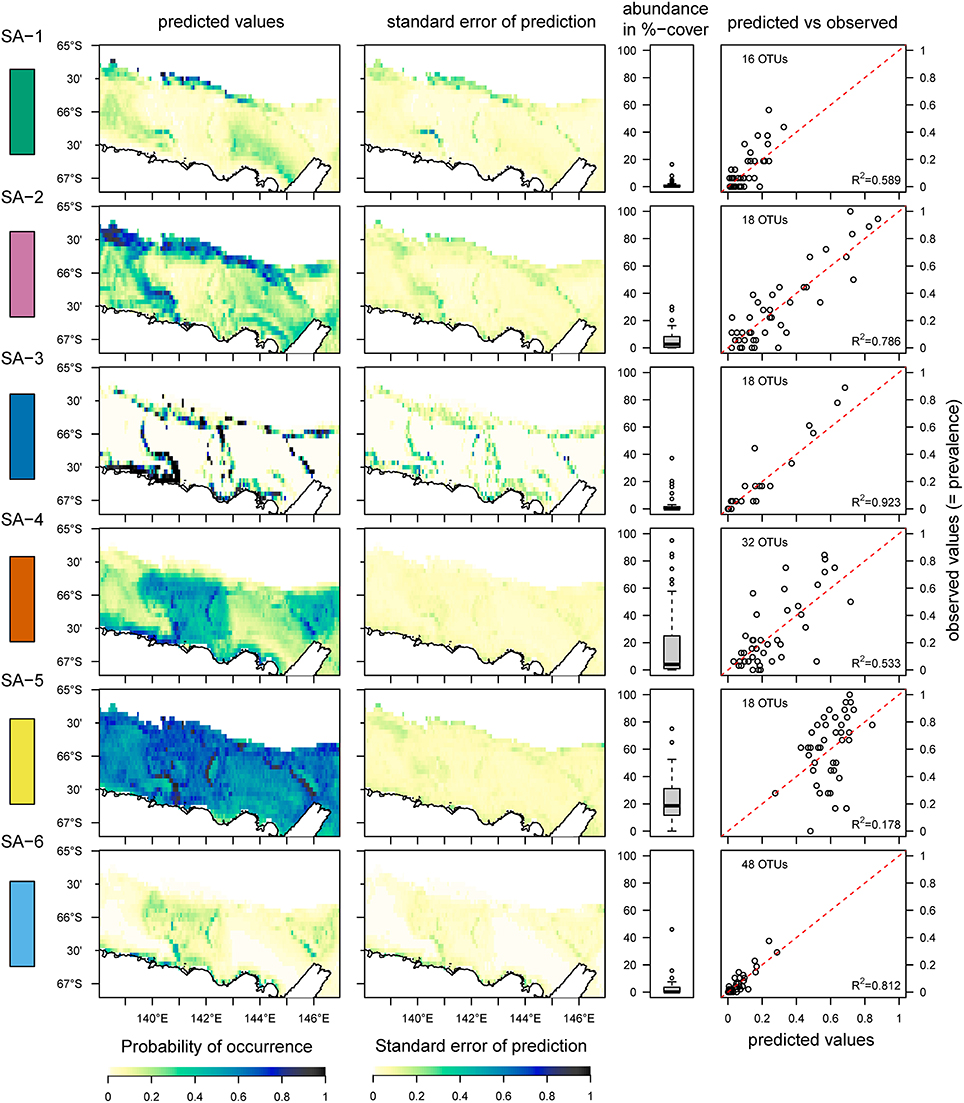
Figure 2. Distribution of six species archetypes (SA 1–6) identified from the OTU-dataset using the species archetype analysis, the standard error of the prediction, the total abundance of all OTUs combined within each SA and the relationship between predicted and observed values. A color-code is added on the left side of the graphs for helping to compare this figure with Figures 3, 4. The red dotted line indicates the 1:1 line between predicted and observed values; the R2-value is for a linear regression between observed and predicted values. The predictions are based on data from 41 sites, and the area under the Mertz Glacier Tongue is excluded from the predictions.
For the statistical analysis, we used R version 3.3.1 (R Core Team, 2016), and the SAMs were developed using the R package “SpeciesMix” (Dunstan et al., 2011).
Data Availability
The full biological dataset is published in Robineau et al. (2018) and is publically available through the Australian Antarctic Division doi: 10.4225/15/5ae7cf565cebb.
Results
Classifying benthic fauna to the highest taxonomic resolution possible, we identified a total of 172 operational taxonomic units (OTUs) from 11 different phyla (Supplementary Table 1), belonging to 27 taxonomic and 30 functional groups. Many OTUs were rare, with 26 OTUs observed only once at the 41 sites, and half of all OTUs found at five sites or less. Only 17 OTUs were found at more than 20 sites, and six of these common OTUs represent unidentified taxa where individuals could not be distinguished further than to broad categories of Bryozoans, Sponges, Seastars, Ophiuroids, Holothurians, and Actinaria. The most dominant phyla were echinoderms (38 OTUs), sponges (35 OTUs), and cnidarians (34 OTUs). In total, we found 54 mobile OTUs compared to 118 sessile OTUs. Most sponges (= active suspension feeders) were of a simple erect form or had a stalked base lifting them off the ground (Supplementary Tables 2, 3). In contrast, most passive suspension feeders were branching in three dimensions.
OTU-Level Archetypes
The statistical analysis using species archetype models identified six distinct species archetypes (SAs, Figure 2 and Supplementary Figure 1) from the full dataset which contains benthic fauna classified to the highest possible taxonomic resolution (operational taxonomic units, or OTUs). All Species Archetypes (SAs) contain OTUs with a mix of functional traits and belonging to different taxonomic groups (Supplementary Tables 2–5). Predictions for OTU occurrences from the SAs match well with the observed values (R2 between 0.533 and 0.923), with the exception of SA-5 (R2 = 0.178). The strongest (steepest) overall response from SAs is in relation to depth of the seafloor (Figure 3 and Supplementary Table 6), but all environmental variables used in the analysis influence SA-distributions.
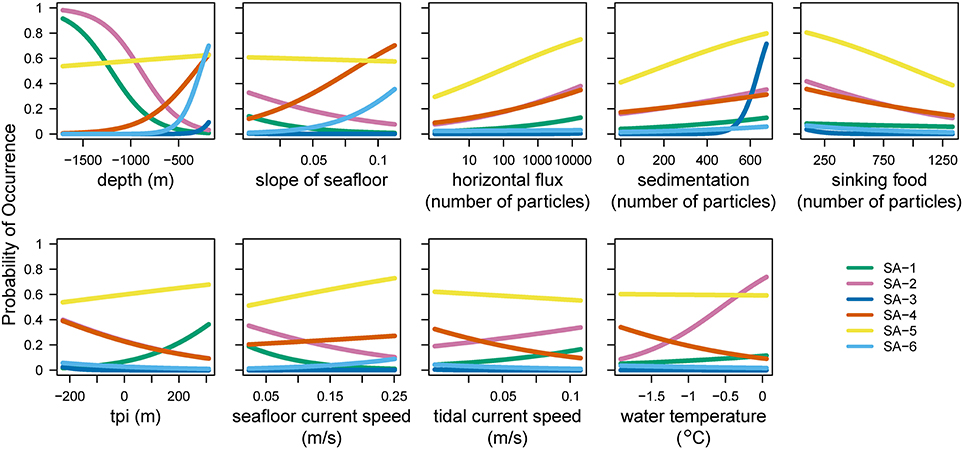
Figure 3. Probability of occurrence for the six species archetypes in relation to each of the environmental variables used in the analysis. A steep slope of a line means that the archetype changes strongly along this environmental gradient, indicating which environmental predictor variables are important in determining the presence or absence of species archetypes. tpi, topographic position index.
OTUs in SA-1 are mostly mobile with a few sessile taxa of simple body-shape, living in the deeper part of the continental shelf, where unconsolidated sediments prevail (Figure 2 and Supplementary Table 4). This assemblage is predicted with high probability on the slope near the Adelie Bank and Sill, but just outside of areas sampled in our study, meaning we cannot confirm these high values with our observations (see sampling sites in Figure 1 and predicted vs. observed for SA-1 in Figure 2). SA-2 is an assemblage representative of the slope areas, and is dominated by sessile taxa. Generally, SA-1 and SA-2 share a similar environmental response apart from SA-1 occurring with a higher probability on higher topographic positions and SA-2 occurring in warmer waters (Figure 3).
SA-3 is an assemblage containing species with a diversity of body-shapes and similar to SA-2, is dominated by passive suspension feeders (Supplementary Table 2). This archetype inhabits the edges of the banks and also occurs along the continental slope, typically in steep slope regions. SA-2 and SA-3 contain many taxa that classify as vulnerable marine ecosystems, meaning they are vulnerable to some fishing practices and deserve special protection due to their importance for ecosystem functioning (www.fao.org/in-action/vulnerable-marine-ecosystems).
SA-4 contains common taxa, similarly to SA-5, but is restricted to the banks. This is a typical Antarctic assemblage with many suspension feeders and a diverse range of body-shapes. SA-5 dominates the benthic assemblage on most of the George V shelf (Figure 4), and represents a diverse range of a few (18) very abundant and common OTUs with a broad distribution (see also Supplementary Table 4). Although the standard error of the prediction is low (Figure 2) across the study region, comparing predicted and observed values reveals poor predictive power of this group (Figure 2, last column, R2 = 0.18). Thus, the OTUs comprising this group are relatively abundant and ubiquitous independent of environmental variation. The response curve of SA-5 to environmental variables is shallow (Figure 3), indicating that even strong environmental differences only lead to weak changes in this group. SA-5 contains four OTUs that represent unidentified taxa where individuals could not be distinguished further than the broad categories of Bryozoans, Sponges, Seastars, and Ophiuroids.
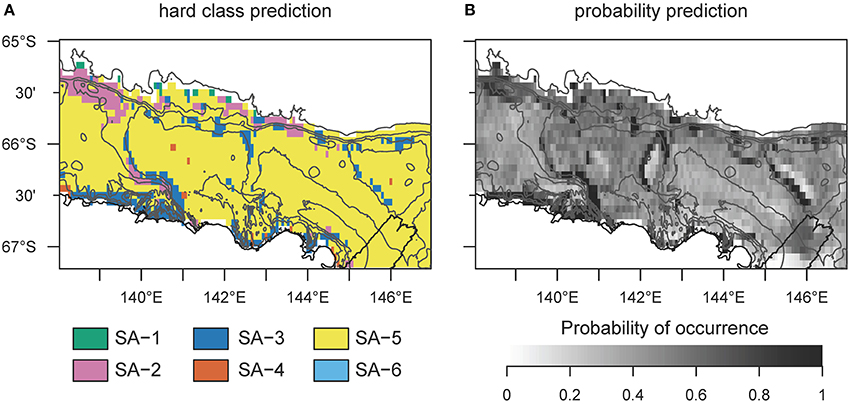
Figure 4. Hard classed distribution of six archetype predictions across the George V shelf, East Antarctica. Map (A) identifies which group of species is most likely to be encountered at any specific prediction point across the study area. (B) shows the probability of occurrence for the most likely archetype. These maps do not provide any indication of similarity or difference between sites for which a different analysis, such as regions of common profile (Foster et al., 2013), is needed. SA−6 never dominates the assemblage.
SA-6 represents an assemblage with low abundance, and limited to shallow and steep sections on the shelf close to the coast and in locations characterized by muddy substrate, dropstones, and relatively protected from icebergs (Marc Eléaume, unpublished data). This group largely responds to depth and slope but not to other environmental variables examined, and contains a mix of mobile and sessile taxa with many different body shapes (Supplementary Table 4). SA-6 is the only archetype that never dominates the benthic community on the George V shelf (Figure 4).
All six SAs contain mobile and sessile species, but not every SA contains all categories of feeding type and body-shape (Supplementary Table 2). For example, only suspension feeders and predators can be found in SA-2, but there are no deposit feeders or opportunists present. Similarly, not every SA contains every body-shape. Flat body-shapes are absent from SA-2, erect stalked forms are absent from SA-3, barrel and tube-like sponges are absent from SA-1, SA-3, and SA-5, 2D-structured suspension feeders are absent from SA-1 and SA-5, no Anemones are found in SA-5 while tubeworms are found only in SA-3, SA-4, and SA-5. Ball-shaped forms are absent in SA-1 and SA-6 and massive sponges only occur in SA-6 (although only 3 OTUs fall into this category).
Taxonomic- and Functional-Group Archetypes
In contrast to the analysis of the OTU-dataset, which reveals six species archetypes, the aggregated datasets of taxonomic groups (TG) and functional groups (FG) reveal three species archetypes respectively (Figure 5). Both TG and FG archetypes show similar distributions, but all species archetypes show weak predictive power for the probability of occurrence (R2 from 0.17 to 0.37, Figure 5, predicted vs. observed). Another similarity between TG- and FG-analyses is that each results in one archetype with abundant and very common OTUs (TG SA-1, FG SA-1), a second archetype with also abundant OTUs but not as common (TG SA-2, FG SA-2), and a third archetype of rare OTUs (TG SA-2, FG SA-2). Interestingly, despite these similarities, the OTU composition varies considerably between the TG- and FG-archetypes (Supplementary Figure 2).
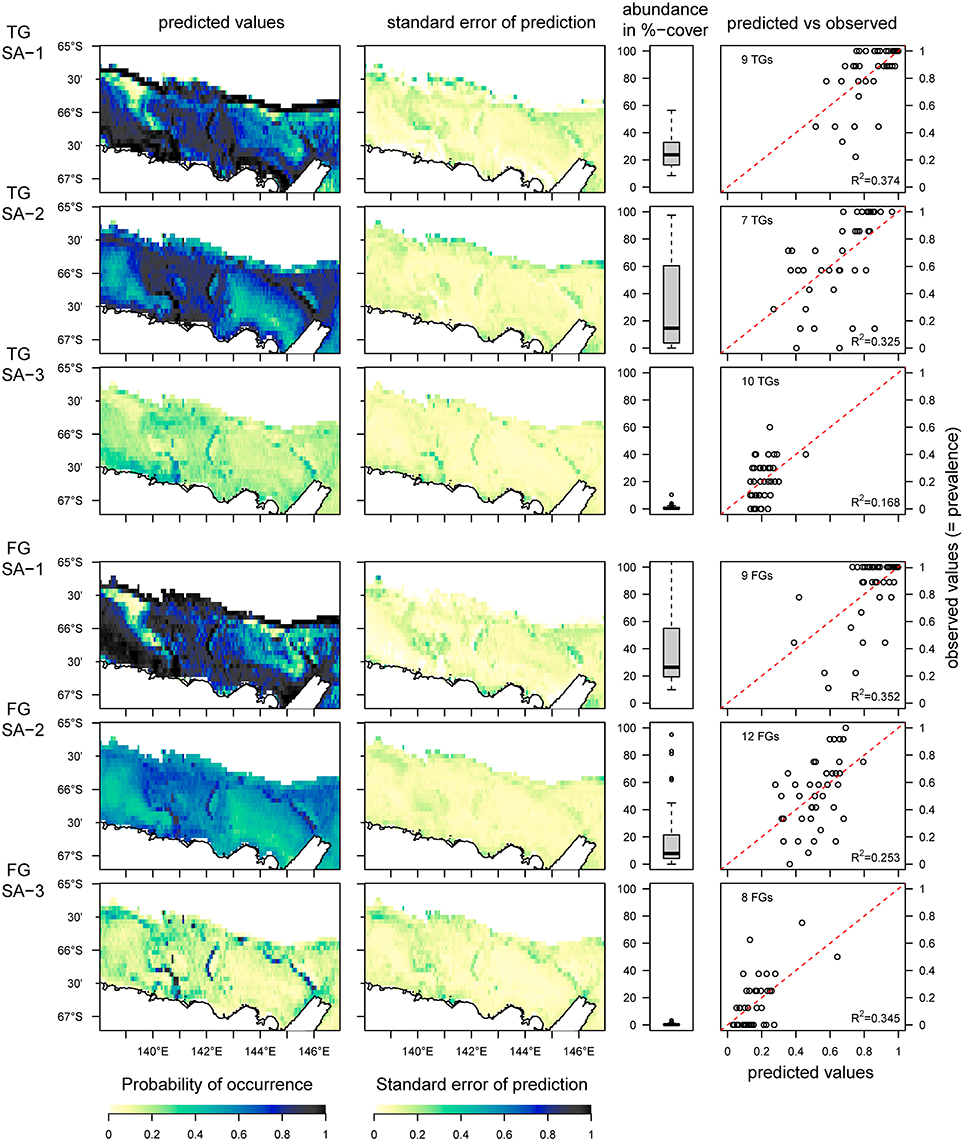
Figure 5. Predicted distribution of species archetypes (SA) identified from the taxonomic (TG) and functional group (FG) datasets, the standard error of the prediction, the total abundance of all OTUs combined within each SA and the relationship between predicted and observed values. The red dotted line indicates the 1:1 line between predicted and observed values; the R2-value is for a linear regression between observed and predicted values. The predictions are based on data from 41 sites, and the area under the Mertz Glacier Tongue is excluded from the predictions.
Discussion
Our results show distinct assemblages of benthic macrofauna can be identified with much greater confidence when using data comprising presence/absence of operational taxonomic units (OTUs) than when data describe a-priori determined taxonomic or functional groups. Although we expected the expert-grouped taxa not to perform as well as when using the more highly resolved data, the magnitude of differences was surprising to us, especially in regard to grouping by functional traits. In theory, if the functional traits selected truly correspond to species with similar responses to environmental conditions, we should (1) expect predicted values from the analysis of functional groups to fit similarly well to observed values as predicted values from the OTU-analysis, and (2) expect OTUs in each species archetype to be from mostly the same functional groups. However, our results show this is not the case, and a-priori grouping of OTUs by functional or taxonomic similarity merges OTUs that do not respond to environmental conditions in the same way.
A possible explanation why the functional grouping poorly predicts the distribution of biodiversity is that the functional traits selected are not important in determining the presence or absence of these taxa, or are not important at all. Our results show most combinations of the three functional traits feeding-type, mobility and body-shape can be found in at least half of all species archetypes, in a wide range of environmental conditions across the study region, and are therefore not good surrogates for predicting the presence and absence of species. However, this result does not mean the functional traits selected are not important at all, because they could act on different levels of community structure, such as on the abundance of different species. Interestingly, a very broad grouping of taxa based solely on their feeding type, produces promising results for mapping patterns in the abundance of key components of the benthic community (Jansen et al., 2018a). More research is needed to resolve whether other functional traits not used here might be more suitable for predicting patterns in the presence and absence of species.
Another factor that influences the results is the taxonomic level at which to group species. In our study, we grouped species mostly at the class and phylum level. Classifying organisms into lower level taxonomic groups such as families is difficult when using image-data, because many family-specific features might not be distinguishable. Previous studies have also found that an aggregation at class or phylum level changes observed patterns in assemblage structure (Smale et al., 2010) and species distributions (Wodarska-Kowalczuk and Kedra, 2007). However, although there are examples where family-level aggregations may be used as effective surrogates for diversity patterns (e.g., in molluscs: Terlizzi et al., 2009), any taxonomic rank higher than species can behave as a random group of species not providing ecologically meaningful information (Bevilacqua et al., 2012) and the outcomes of taxonomic groupings may vary between habitats and trophic levels (Sutcliffe et al., 2012). Our results suggest that presence-absence data should be classified to the highest taxonomic resolution where possible, and not amalgamated into either taxonomic of functional groupings when studying responses of Antarctic benthic communities to environmental conditions.
Our mapped predictions of the benthic communities on the George V shelf show similarities to previously detailed descriptions and maps of the region (Post et al., 2010, 2011; Jansen et al., 2018a). We can confirm that areas of particular interest (i.e., areas with rare assemblages, and a turnover of species archetypes) are shallow, steep habitats close to the coast or on the edges of the banks, and on the continental shelf break and slope. Vulnerable marine ecosystem (VME) taxa, which are of particular interest for management, have previously been detected and then protected from bottom fishing practices in two separate areas in this region (see Figure 1). SA-2 and SA-3 are likely representative for the distribution of VMEs, and the mapped predictions can help finding further assemblages in need of protection. SA-4 and SA-5 are most similar to the distribution of seafloor suspension feeders mapped in an earlier effort in this region (Jansen et al., 2018a). Some small-scale features in SA-4 and SA-5, particularly on the Adélie bank, stand out, but should be treated with care, as they could be artifacts from the ocean model and the food-availability-maps that have translated into the predictive maps. More sampling in these interesting areas would help to clarify if such patterns exist. A proportion of the benthic community (i.e., SA-5) is difficult to predict, even with the cutting-edge statistical methods used here, which at least partially explains why the biogeography of Antarctic benthos has been found to be hardly predictable in other regions around the continent (Gutt et al., 2013). Nonetheless, the overwhelmingly high correlations between observed and predicted values from the species archetype models are encouraging, and we suggest model-based approaches should be a first choice when mapping Antarctic benthic communities.
Taxonomic resolution matters, and the level to which taxa in a dataset are identified influences the spatial patterns in biodiversity that are—and can be—observed. If resources such as time, money or expertise are limited, and taxa can only be identified at a broad taxonomic level, a more simplified and less accurate picture of the patterns of biodiversity has to be expected. Our study shows that—for the most part- the distribution of benthic fauna on the Antarctic continental shelf can be well explained by environmental conditions. This is a promising step toward mapping the distribution of Antarctic benthic fauna on a continental scale as a base for an informing management of this unique environment.
Author Contributions
JJ, NH, PD, and CJ conceived and designed the study; JJ, NH, PD, ME, and CJ analyzed the data; JJ created the figures and tables; JJ wrote the paper with contributions from all authors.
Conflict of Interest Statement
The authors declare that the research was conducted in the absence of any commercial or financial relationships that could be construed as a potential conflict of interest.
Acknowledgments
We would like to thank Rachel Downey for classifying the sponges, Tina Molodtsova for helping to classify the cnidarians and the reviewers for their comments. Biological samples were collected during the CEAMARC program as part of the IPY #53 Census of Antarctic Marine Life program. Coastline and glacial features for the figures are taken from the Antarctic Digital Database version 5. JJ is supported by a Tasmanian Graduate Research Scholarship and a QAS Top-Up scholarship. This work was completed as part of Australian Antarctic Science project 4124.
Supplementary Material
The Supplementary Material for this article can be found online at: https://www.frontiersin.org/articles/10.3389/fevo.2018.00081/full#supplementary-material
References
Barry, J. P., Grebmeier, J. M., Smith, J., and Dunbar, R. B. (2003). “Oceanographic versus seafloor-habitat control of benthic megafaunal communities in the S.W. Ross Sea, Antarctica,” in Biogeochemistry of the Ross Sea, eds G. R. Ditullio and R. B. Dunbar (Washington, DC: American Geophysical Union), 327–353.
Beaman, R. J., O'brien, P. E., Post, A. L., and De Santis, L. (2011). A new high-resolution bathymetry model for the Terre Adelie and George V continental margin, East Antarctica. Antarc. Sci. 23, 95–103. doi: 10.1017/S095410201000074X
Beans, C., Hecq, J. H., Koubbi, P., Vallet, C., Wright, S., and Goffart, A. (2008). A study of the diatom-dominated microplankton summer assemblages in coastal waters from Terre Adélie to the Mertz Glacier, East Antarctica (139°E−145°E). Polar Biol. 31, 1101–1117. doi: 10.1007/s00300-008-0452-x
Bevilacqua, S., Terlizzi, A., Claudet, J., Fraschetti, S., and Boero, F. (2012). Taxonomic relatedness does not matter for species surrogacy in the assessment of community responses to environmental drivers. J. Appl. Ecol. 49, 357–366. doi: 10.1111/j.1365-2664.2011.02096.x
Brandt, A., De Broyer, C., De Mesel, I., Ellingsen, K. E., Gooday, A. J., Hilbig, B., et al. (2007). The biodiversity of the deep Southern Ocean benthos. Philos. Trans. R. Soc. B Biol. Sci. 362, 39–66. doi: 10.1098/rstb.2006.1952
Cadotte, M. W., Arnillas, C. A., Livingstone, S. W., and Yasui, S. L. (2015). Predicting communities from functional traits. Trends Ecol. Evol. 30, 510–511. doi: 10.1016/j.tree.2015.07.001
Chown, S. L., Clarke, A., Fraser, C. I., Cary, S. C., Moon, K. L., and McGeoch, M. A. (2015). The changing form of Antarctic biodiversity. Nature 522, 431–438. doi: 10.1038/nature14505
Convey, P., Chown, S. L., Clarke, A., Barnes, D. K. A., Bokhorst, S., Cummings, V., et al. (2014). The spatial structure of Antarctic biodiversity. Ecol. Monogr. 84, 203–244. doi: 10.1890/12-2216.1
Cougnon, E. A., Galton-Fenzi, B. K., Meijers, A. J. S., and Legresy, B. (2013). Modeling interannual dense shelf water export in the region of the Mertz Glacier Tongue (1992-2007). J. Geophys. Res. 118, 5858–5872. doi: 10.1002/2013JC008790
Cummings, V. J., Thrush, S. F., Chiantore, M., Hewitt, J. E., and Cattaneo-Vietti, R. (2010). Macrobenthic communities of the north-western Ross Sea shelf: links to depth, sediment characteristics and latitude. Antarc. Sci. 22, 793–804. doi: 10.1017/S0954102010000489
Cunningham, R. B., and Lindenmayer, D. B. (2005). Modeling count data of rare species: some statistical issues. Ecology 86, 1135–1142. doi: 10.1890/04-0589
De Broyer, C., Koubbi, P., Griffiths, H. J., Raymond, B., Udekem D'acoz, C. D., Van De Putte, A. P., et al. (2014). Biogeographic Atlas of the Southern Ocean. Cambridge: Scientific Committee on Antarctic Research.
Dunstan, P. K., Foster, S. D., and Darnell, R. (2011). Model based grouping of species across environmental gradients. Ecol. Modell. 222, 955–963. doi: 10.1016/j.ecolmodel.2010.11.030
Foster, S. D., Givens, G. H., Dornan, G. J., Dunstan, P. K., and Darnell, R. (2013). Modelling biological regions from multi-species and environmental data. Environmetrics 24, 489–499. doi: 10.1002/env.2245
Griffiths, H. J., Barnes, D. K. A., and Linse, K. (2009). Towards a generalized biogeography of the Southern Ocean benthos. J. Biogeogr. 36, 162–177. doi: 10.1111/j.1365-2699.2008.01979.x
Gutt, J., Griffiths, H. J., and Jones, C. D. (2013). Circumpolar overview and spatial heterogeneity of Antarctic macrobenthic communities. Mar. Biodivers. 43, 481–487. doi: 10.1007/s12526-013-0152-9
Gutt, J., Zurell, D., Bracegridle, T., Cheung, W., Clark, M., Convey, P., et al. (2012). Correlative and dynamic species distribution modelling for ecological predictions in the Antarctic: a cross-disciplinary concept. Polar Res. 31:11091. doi: 10.3402/polar.v31i0.11091
Hill, N. A., Foster, S. D., Duhamel, G., Welsford, D., Koubbi, P., Johnson, C. R., et al. (2017). Model-based mapping of assemblages for ecology and conservation management: A case study of demersal fish on the Kerguelen Plateau. Divers. Distrib. 23, 1216–1230. doi: 10.1111/ddi.12613
Hosie, G., Koubbi, P., Riddle, M., Ozouf-Costaz, C., Moteki, M., Fukuchi, M., et al. (2011). CEAMARC, the collaborative East Antarctic Marine Census for the Census of Antarctic Marine Life (IPY # 53): an overview. Polar Sci. 5, 75–87. doi: 10.1016/j.polar.2011.04.009
Jansen, J., Hill, N. A., Dunstan, P. K., Cougnon, E. A., Galton-Fenzi, B., and Johnson, C. R. (2018a). Mapping Antarctic suspension feeder abundances and seafloor-food availability, and modelling their change after a major glacier calving. bioRxiv [Preprint]. doi: 10.1101/333955
Jansen, J., Hill, N. A., Dunstan, P. K., Mckinlay, J., Sumner, M. D., Post, A. L., et al. (2018b). Abundance and richness of key Antarctic seafloor fauna correlates with modelled food availability. Nat. Ecol. Evol. 2, 71–80. doi: 10.1038/s41559-017-0392-3
Jones, T. (2017). Commission for the Conservation of Antarctic Marine Living Resources: Vulnerable Marine Ecosystems Registry. Available online at: https://www.ccamlr.org/en/document/data/ccamlr-vme-registry (Accessed May 28, 2018).
Koubbi, P., Hosie, G., Constable, A., Raymond, B., Moteki, M., Améziane, N., et al. (2011). Estimating the biodiversity of the shelf and oceanic zone of the d'Urville Sea (East Antarctica) for ecoregionalisation using the CEAMARC (Collaborative East Antarctic Marine Census) CAML surveys. Polar Sci. 4, 115–133. doi: 10.1016/j.polar.2010.04.012
Massom, R., Hill, K., Lytle, V., Worby, A., Paget, M., and Allison, I. (2001). Effects of regional fast-ice and iceberg distributions on the behaviour of the Mertz Glacier polynya, East Antarctica. Ann. Glaciol. 33, 391–398. doi: 10.3189/172756401781818518
Ovaskainen, O., Tikhonov, G., Norberg, A., Guillaume Blanchet, F., Duan, L., Dunson, D., et al. (2017). How to make more out of community data? A conceptual framework and its implementation as models and software. Ecol. Lett. 20, 561–576. doi: 10.1111/ele.12757
Petchey, O. L., and Gaston, K. J. (2006). Functional diversity: back to basics and looking forward. Ecol. Lett. 9, 741–758. doi: 10.1111/j.1461-0248.2006.00924.x
Pierrat, B., Saucède, T., Laffont, R., De Ridder, C., Festeau, A., and David, B. (2012). Large-scale distribution analysis of Antarctic echinoids using ecological niche modelling. Mar. Ecol. Prog. Ser. 463, 215–230. doi: 10.3354/meps09842
Post, A. L., Beaman, R. J., O'brien, P. E., Eleaume, M., and Riddle, M. J. (2011). Community structure and benthic habitats across the George V Shelf, East Antarctica: trends through space and time. Deep-Sea Res. Part II Top. Stud. Oceanogr. 58, 105–118. doi: 10.1016/j.dsr2.2010.05.020
Post, A. L., O'brien, P. E., Beaman, R. J., Riddle, M. J., and De Santis, L. (2010). Physical controls on deep water coral communities on the George V Land slope, East Antarctica. Antarc. Sci. 22, 371–378. doi: 10.1017/S0954102010000180
R Core Team (2016). R: A Language and Environment for Statistical Computing. Vienna: R Foundation for Statistical Computing.
Robineau, C., Delaplanque-Lasserre, J., Jansen, J., and Eleaume, M. (2018). Abundances of Benthic Invertebrate Species in the CEAMARC Region 2007/08. Australian Antarctic Data Centre - CAASM Metadata, Available online at: https://data.aad.gov.au/metadata/records/AAS_4124_CEAMARC200708_BenthicStills_InvertebrateAbundances
Rooper, C. N., Zimmermann, M., Prescott, M. M., and Hermann, A. J. (2014). Predictive models of coral and sponge distribution, abundance and diversity in bottom trawl surveys of the Aleutian Islands, Alaska. Mar. Ecol. Prog. Ser. 503, 157–176. doi: 10.3354/meps10710
Sambrotto, R. N., Matsuda, A., Vaillancourt, R., Brown, M., Langdon, C., Jacobs, S. S., et al. (2003). Summer plankton production and nutrient consumption patterns in the Mertz Glacier Region of East Antarctica. Deep-Sea Res. Part II Top. Stud. Oceanogr. 50, 1393–1414. doi: 10.1016/S0967-0645(03)00076-6
Smale, D. A., Kendrick, G. A., and Wernberg, T. (2010). Assemblage turnover and taxonomic sufficiency of subtidal macroalgae at multiple spatial scales. J. Exp. Mar. Biol. Ecol. 384, 76–86. doi: 10.1016/j.jembe.2009.11.013
Stuart-Smith, R. D., Bates, A. E., Lefcheck, J. S., Duffy, J. E., Baker, S. C., Thomson, R. J., et al. (2013). Integrating abundance and functional traits reveals new global hotspots of fish diversity. Nature 501, 539–544. doi: 10.1038/nature12529
Sunday, J. M., Pecl, G. T., Frusher, S., Hobday, A. J., Hill, N., Holbrook, N. J., et al. (2015). Species traits and climate velocity explain geographic range shifts in an ocean-warming hotspot. Ecol. Lett. 18, 944–953. doi: 10.1111/ele.12474
Sutcliffe, P. R., Pitcher, C. R., Caley, M. J., and Possingham, H. P. (2012). Biological surrogacy in tropical seabed assemblages fails. Ecol. Appl. 22, 1762–1771. doi: 10.1890/11-0990.1
Terlizzi, A., Anderson, M. J., Bevilacqua, S., Fraschetti, S., Włodarska-Kowalczuk, M., and Ellingsen, K. E. (2009). Beta diversity and taxonomic sufficiency: do higher-level taxa reflect heterogeneity in species composition? Divers. Distrib. 15, 450–458. doi: 10.1111/j.1472-4642.2008.00551.x
Webb, C. T., Hoeting, J. A., Ames, G. M., Pyne, M. I., and LeRoy Poff, N. (2010). A structured and dynamic framework to advance traits-based theory and prediction in ecology. Ecol. Lett. 13, 267–283. doi: 10.1111/j.1461-0248.2010.01444.x
Wodarska-Kowalczuk, M., and Kedra, M. (2007). Surrogacy in natural patterns of benthic distribution and diversity: selected taxa versus lower taxonomic resolution. Mar. Ecol. Prog. Ser. 351, 53–63. doi: 10.3354/meps07127
Keywords: marine biodiversity, Southern Ocean, functional trait, taxonomic resolution, species archetype model, species distribution, Antarctica, benthic assemblages
Citation: Jansen J, Hill NA, Dunstan PK, Eléaume MP and Johnson CR (2018) Taxonomic Resolution, Functional Traits, and the Influence of Species Groupings on Mapping Antarctic Seafloor Biodiversity. Front. Ecol. Evol. 6:81. doi: 10.3389/fevo.2018.00081
Received: 18 March 2018; Accepted: 29 May 2018;
Published: 19 June 2018.
Edited by:
Huw James Griffiths, British Antarctic Survey (BAS), United KingdomReviewed by:
Juan Ernesto Guevara Andino, Field Museum of Natural History, United StatesRakesh Bhutiani, Gurukul Kangri Vishwavidyalaya, India
Copyright © 2018 Jansen, Hill, Dunstan, Eléaume and Johnson. This is an open-access article distributed under the terms of the Creative Commons Attribution License (CC BY). The use, distribution or reproduction in other forums is permitted, provided the original author(s) and the copyright owner are credited and that the original publication in this journal is cited, in accordance with accepted academic practice. No use, distribution or reproduction is permitted which does not comply with these terms.
*Correspondence: Jan Jansen, amFuLmphbnNlbkB1dGFzLmVkdS5hdQ==