 Eugenia Lo1*
 Mariangela Bonizzoni2
 Elizabeth Hemming-Schroeder3
 Anthony Ford4Daniel A. Janies4Anthony A. James5Yaw Afrane6Harrisone Etemesi7
 Guofa Zhou3Andrew Githeko7Guiyun Yan3*
- 1Department of Biological Sciences, University of North Carolina at Charlotte, Charlotte, NC, United States
- 2Department of Biology and Biotechnology, University of Pavia, Pavia, Italy
- 3Program in Public Health, College of Health Sciences, University of California, Irvine, Irvine, CA, United States
- 4Department of Bioinformatics and Genomics, University of North Carolina at Charlotte, Charlotte, NC, United States
- 5Departments of Microbiology and Molecular Genetics and Molecular Biology and Biochemistry, University of California, Irvine, Irvine, CA, United States
- 6Department of Medical Microbiology, College of Health Sciences, University of Ghana, Accra, Ghana
- 7Centre for Vector Biology and Control Research, Kenya Medical Research Institute, Kisumu, Kenya
Single nucleotide polymorphisms (SNPs) have been shown to be useful in revealing population structure with continental-and regional-scale samples. In epidemiological study, a careful selection of SNPs to track disease spread in local communities would provide an important addition to traditional disease surveillance. This study used SNPs and microsatellites to examine population structure of Plasmodium falciparum at fine- scale in malaria-endemic areas of Western Kenya. A set of high performance (HP) SNPs were selected from a large SNP panel based on BELS ranking, FST values and minor allele frequency criteria. The discriminative power and assignment accuracy of different SNP panels including nonsynonymous SNPs, silent SNPs, previously published barcode SNPs, and the HP SNPs were evaluated together with microsatellites. Among all SNP panels, HP SNPs showed the highest level of differentiation and self-assignment accuracy on average among sites. Clear distinction was observed between the northern and southern P. falciparum samples, whereas samples from the south were least diverged from one another. These results were comparable to those by microsatellites. Nonsynonymous, silent, and barcode SNPs all showed similar levels of genetic variability to one another and weaker structure than the HP SNPs. We described here the procedure of selecting a set of HP SNPs from a large panel of SNPs that resolve population structure of P. falciparum between the northern and southern regions of Western Kenya. Future work is needed to determine if this procedure can result in SNPs panels capable of tracing Plasmodium spread at finer geographical scales.
Introduction
Single nucleotide polymorphisms (SNPs) are increasingly popular in population genetic studies due to their high number, low cost and ease of scoring, in addition to their rapid discovery rate by the advent of technology and analytical algorithm. In recent years, different techniques and platforms have been developed to advance detection and application of SNP data (Supplementary Table 1). The application of SNPs as a genetic marker provides an opportunity to identify genome-wide signatures of demographic history in a wide spectrum of model (Xing et al., 2009; Platt et al., 2010; Amambua-Ngwa et al., 2012; Durham et al., 2014) and non-model organisms (Helyar et al., 2011; Albaina et al., 2013; Riahi et al., 2013; Milano et al., 2014). Systematic interpretations are dependent on the amount and quality of data generated.
SNP markers are potentially useful for tracking movement of infectious pathogens such as malaria parasites. In 2016, the World Health Organization estimated that 3.4 billion people were at risk of malaria with approximately 80% of malaria cases and 90% of deaths occurring in sub-Saharan Africa (World Health Organization, 2016). The parasite Plasmodium falciparum is responsible for hundreds of millions of cases of malaria, and kills more than one million children annually. Knowledge of P. falciparum malaria dispersion patterns at both global and local scales is important to targeting control efforts at epidemic hotspots. This in part relies on the application of powerful and effective molecular markers and analytical tools to track pathogen spread and origin. High throughput analytical platforms have been used successfully to assess and discover SNPs in P. falciparum (Mu et al., 2007; Volkman et al., 2007; Neafsey et al., 2008). These studies provided remarkable biological insights on the global genetic structure of the pathogen, the recombination rates and arrangements of the genome (Mu et al., 2005), as well as genome-wide search for association with antimalarial drug resistance (Anderson et al., 2005; Mu et al., 2007; Amambua-Ngwa et al., 2012). More importantly, the growing amount of SNP data deposited in databases such as PlasmoDB (Bahl et al., 2003) and dbSNP at the National Center for Biotechnology Information (NCBI) are powerful resources for selecting and applying SNPs in population studies.
Tens of thousands of SNPs were identified through next generation sequencing of worldwide isolates based on the P. falciparum genome annotation (Volkman et al., 2007; Samarakoon et al., 2011). On average, one SNP can be found every 780 DNA bases with a pairwise nucleotide diversity of 1.29 × 10⁻³ per bp, and one microsatellite every 1,500 bases (Volkman et al., 2007). Approximately 27,000 SNPs and 37,039 indels of at least three bases were uncovered genome-wide by comparing just three parasite strains (HB3 from Honduras, Dd2 from Indochina, and 3D7 in The Netherlands). SNP to indel ratio was about 2:1 in the coding regions with an average nucleotide diversity of 5 × 10⁻⁴ per bp, but indels were three times more abundant than SNPs in the noncoding regions among the crossed parasite strains (Miles et al., 2016). Given the wealth of SNP data and the advent and accessibility of genotyping platforms, SNPs can be very valuable for population studies. Establishing a set of genetic loci that can track species source-sink dynamics and/or assess selection pressure would shed light on the evolution of malaria parasites. For examples, a panel of 24 barcode SNPs has been shown to provide a concise and unique signature for P. falciparum at the global scale and was useful in identifying the continental origin of infections (Daniels et al., 2008). As few as 9 SNPs were sufficient to differentiate parasite isolates between continents (Southeast Asia and Africa), 4-6 SNPs within continents (East and West Africa), and 13 SNPs among regions (Mali and Burkina Faso in West Africa) (Campino et al., 2011). Nonetheless, it remains uncertain whether a small SNP panel is useful in tracking parasites at a microgeographical scale i.e., among communities, villages, and towns of close vicinity where local epidemics occur.
A stringent selection of the most informative microsatellite and/or SNP markers can provide great discriminative and assignment power across broad and fine-scale population samples (Narum et al., 2008; Morin et al., 2009; Queirós et al., 2015; Cao et al., 2016). Microsatellites evolve at very high rates (Li et al., 2002). They display large allelic diversity per locus and offer high discriminative power to population samples (Haasl et al., 2014; Queirós et al., 2015). By contrast, SNPs can vary widely in mutation rates and mode of evolution. For examples, SNPs locate at the telomeric and subtelomeric regions may evolve faster than those in the core genome (Bopp et al., 2013). Nonsynonymous or coding SNPs have often been subjected to purifying and/or balancing selection. They generally display lower diversity or mutation rate than silent SNPs such as intergenic and synonymous mutations (Schlotterer, 2004; Neafsey et al., 2008). Nevertheless, some non-neutral SNPs can segregate strongly among populations by local selection/adaptation and result in distinct population signatures. They may offer better assignment accuracy and discriminative power than neutral markers (Freamo et al., 2011; Karlsson et al., 2011). While recent studies have illustrated how sample size and number of SNP loci impact resolving power to population structure (Benestan et al., 2015; Benestan, 2016; Sylvester et al., 2018), it is still an open question whether different types of SNPs such as nonsynonymous and silent mutations (including synonymous sites in the coding region and mutations in the intergenic and intronic regions) would give similar genetic clustering patterns.
This study aimed to examine the population structure of P. falciparum at a fine geographical scale (< 100 km between sampling sites) and evaluate the performance of different types of SNPs. Specifically, we asked whether a small panel of SNPs through stringent selection are sufficiently variable to depict fine-scale population structure as compared to a larger SNP panel and microsatellites, and if there are differences in discriminative power and assignment accuracy among the different types of SNP loci.
Materials and Methods
Ethics Statement
Scientific and ethical clearance was given by the institutional scientific and ethical review boards of the Kenya Medical Research Institute, Kenya and the University of California, Irvine, USA. Written informed consent/assent (for minors under age of 18) for study participation was obtained from all consenting heads of households and each individual who was willing to participate in the study. All methods were reviewed and approved by the institutional review board (IRB) and performed in accordance with the relevant guidelines and regulations stated in the IRB protocols.
Sample Collection
A total of 314 P. falciparum isolates were obtained from schoolchildren aged 5–10 years-old in five studied sites, Chwele (CW; N = 67), Kanyawegi (KW; N = 67), Mayanja (MY; N = 65), Ngiya (NG; N = 70), and Rwambua (RW; N = 45) of Western Kenya in 2012–201329. The sites are separated by less than 100 km, but vary in their elevation and proximity to Lake Victoria (Figure 1). These individuals showed no fever or malaria-related symptoms at the time of sampling, but were detected with P. falciparum infection by microscopic examination and PCR assays (Lo et al., 2015). A total of 30–50 μl of blood from each donor was blotted individually on Whatman 3MM filter paper. Filter papers were air-dried and stored in zip-sealed plastic bags with a silica gel absorbent at room temperature until DNA extraction. Parasite DNA was extracted from dried blood spots by the Saponin/Chelex method (Bereczky et al., 2005).
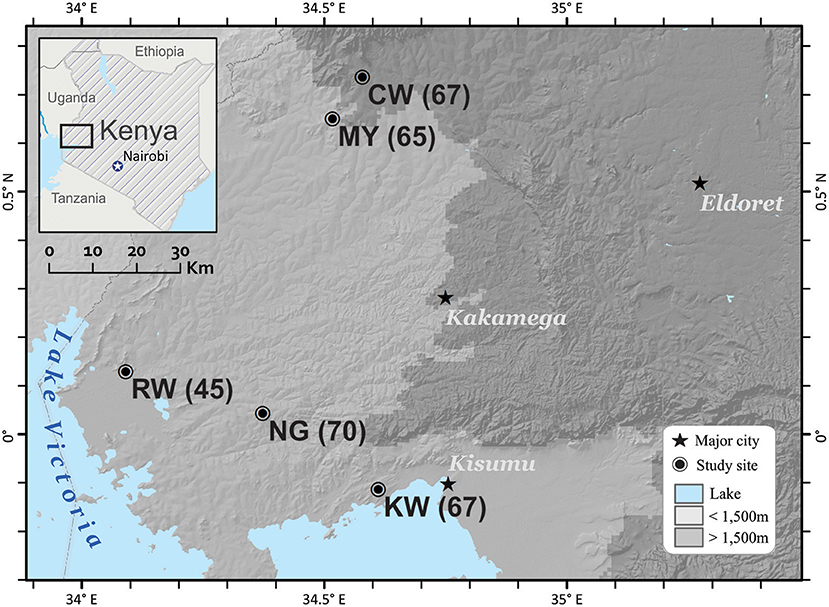
Figure 1. Location of the five field sites in western Kenya. Three of the sites, Kanyawegi (KW), Ngiya (NG), and Rwambua (RW) are below 1,500 m elevation and are located within 30 km of Lake Victoria. The remaining two sites, Chwele (CW), and Mayanja (MY), are more distant from the lake and above 1,500 m in elevation in Western Kenya. Number in parentheses indicates samples size. This figure was generated with ArcGIS Desktop 10.4 (www.esri.com).
SNP Selection, Genotyping and Validation
Over 400 published SNPs were shown to be polymorphic among P. falciparum isolates from different African countries including Senegal, Sierra Leone, Ghana, Malawi, and Kenya (Neafsey et al., 2008). Among them, 126 SNPs were selected based on the following criteria: (1) the size of the amplicon generated from optimum primer design less than 120-bp; (2) a minimum of 30% heterozygosity (0.28 minor allele frequency) in at least one country and a minimum of 20% heterozygosity (0.17 minor allele frequency) across countries to maximize polymorphism (Sanchez et al., 2006); (3) a minimum distance of 100-kb between candidate SNPs and neighboring genes to avoid linkage; (4) reliable flanking DNA sequences that are free of polymorphism in primer binding sites and; (5) represent all the 14 chromosomes and a similar proportion of nonsynonymous and silent mutations. In addition, the 24 molecular barcode SNPs were included (Daniels et al., 2008). The gene regions that contain these SNPs were amplified and sequenced on a subset of five individuals from each of our study sites to check for reproducibility and variability. SNPs that were either amplified poorly or monomorphic were excluded. Triallelic SNPs and/or SNPs flanked by high AT bases were not suitable for Fluidigm assay synthesis and this resulted in a set of 96 SNPs for genotype assays (Table 2).
The 96.96 Dynamic Array was used to analyze 96 samples with 96 SNP loci simultaneously on the BioMark platform (Fluidigm). The P. falciparum strain, MRA-7G8 (positive control), and one non-template sample (negative control) were included in each array run in addition to the samples. For each assay, 5 μL of a 10 × assay reaction was prepared by mixing 2.5 μL 2 × Dynamic Array™ assay loading reagent (Fluidigm), 1.25 μL 40 × SNP genotyping assay mix (Applied Biosystems), 0.25 μL 50 × ROX (Invitrogen) and 1 μL 1 × TE0.1. For each sample, 4 μL of sample solution was prepared by mixing 1.1 μL genomic DNA solution and 2.9 μL pre-sample mix containing 2.5 μL 2 × TaqMan® genotyping mastermix (Applied Biosystems), 0.25 μL 20 × GT sample loading reagent (Fluidigm), 0.05 μL of AmpliTaq Gold® DNA polymerase (Applied Biosystems) and 0.1 μL 1 × TE0.1. The array was run on the BioMark™ instrument using the following thermal cycling: 2 min at 50°C, 10 min at 95°C followed by 30 cycles of a 2-step amplification profile of 15 s at 95°C and 1 min at 60°C.
The data were analyzed using the Fluidigm genotyping analysis software v3.0, which produces a genotype call for each sample/assay combination. The relative fluorescence intensities of FAM and VIC (relative to ROX background) were calculated before automatically classified samples into different genotypes and negative template controls using the k-means clustering algorithm. The default confidence threshold value of 65 was used to identify the call error and the spread of data points for a particular SNP assay. When a call confidence was less than the threshold, the resulting call was assigned as “No Call.” Genotypes with < 95% call rate in cases or controls were excluded or treated as missing data.
Sanger sequencing were performed using a subset of five individuals from each of the sites to confirm the genotyping results obtained from the 96.96 Dynamic Array. The targeted SNPs were amplified from DNA samples and sequenced using the BigDye Terminator Cycle Sequencing Kits (Applied Biosystems) on a 3130xl DNA analyzer (Applied Biosystems) according to manufacturers instructions.
Microsatellite Genotyping
Nine single-copy microsatellites were genotyped using previously-published primer sets (Anderson et al., 1999; Su et al., 1999). These loci were selected because they were shown to be most variable among P. falciparum samples in Western Kenya from previous studies (Zhong et al., 2007; Bonizzoni et al., 2009). Amplification mixtures (15 μL) contained 3 μL of DNA template, one unit of Taq polymerase, 1.5 μL 10 × buffer, 2 mM MgCl2, 0.1 mM of each dNTP, and 2 μM of each primer (both labeled with fluorescent dyes and unlabeled supplied by Applied Biosystems; Foster City, CA). Cycling conditions were as follows: 94°C for 2 min; 40 cycles of 94°C for 30 s, 42°C for 30 s, 40°C for 30 s, and 65°C for 30 s); 65°C for 5 min. After PCR amplification, products were pooled as follows: POLY2 + TAA42 + TAA81, TAA87 + TA1 + TAA109, PE87a + PFPK2 + PfG377 according to their sizes (i.e., amplicons of different size were pooled for optimum resolution) and fluorescent labels (Table 3). All alleles were determined and visualized in Peak Scanner.
Data Analyses
To identify individuals of the same clones that shared the exact same set of alleles across all SNP loci, GenoDive (Meirmans and Van Tienderen, 2004) was used to examine genetic identity among individuals. The Smouse and Peakall distance, i.e., a squared Euclidean distance based on the number of times a certain allele found in two individuals (Smouse and Peakall, 1999), was calculated for each pair of individuals. The minimal distance class was set as threshold to define clones. A total of 294 clones were detected from 314 samples. For clones with multiple individuals, only one individual was included in the subsequent analyses.
Linkage Disequilibrium
GenePop version 4.2 was used to examine linkage disequilibrium (LD) by Fisher's exact test for each pair of loci (a total of 4,560 possible pairwise combinations) using the Markov chain method with 100 batches and 10,000 iterations per batch (Rousset, 2008). Sequential Bonferroni correction was used to adjust for multiple comparisons (Rice, 1989). Nucleotide diversity was estimated to compare the level of variability among SNP datasets using DNASP version 5.10.1 (Rozas et al., 2003).
Detection of Outlier Loci
Three independent methods that are based on different assumptions and statistical models were used to identify putative loci under selection. The first neutrality test that employs a Bayesian approach implemented in BayesScan v2.0 was used to detect whether a locus is under selection based on the co-ancestry coefficient FST estimates (Foll and Gaggiotti, 2008). Analyses were conducted with a setting of 5,000 iterations, 20 pilot runs, burn-in length of 50,000 iterations, and a thinning interval of 10 to identify loci that favor the model assuming selection with posterior probability of 97–100%. Loci with a significantly high or low FST values were considered as outliers that could have been subjected to diversifying selection (high FST values) or balancing/purifying selection (low FST values). Log10 values of the posterior odds (PO) >0.5 and 2.0 were taken as “substantial” and “decisive” evidence for selection. This test yielded the lowest type I (false positive) and II (false negative) errors compared to the other neutrality tests (Pyhäjärvi et al., 2013). However, correcting for type I error is problematic for Bayesian methods and therefore a more stringent Bayes Factor >2.0 (equivalent to a posterior P value ≥ 0.99) was used for detecting selective loci (Hansen et al., 2010).
The second neutrality test LOSITAN that incorporates heterozygosity and simulates a distribution for neutrally-distributed markers was used (Beaumont and Nichols, 1996; Antao et al., 2008). The allele frequencies for each locus were used to compute FST values conditional on heterozygosity and to calculate P-values. All loci in the first run were included to estimate the mean neutral FST. Any loci outside the 99% confidence intervals were removed and the mean neutral FSTwas computed again using only putative neutral loci. Ten-thousand loci were generated and a simulated distribution of FST was compared to the observed FST values for individual loci and conditional on heterozygosity to estimate P-values. Population datasets were generated using 100,000 simulations on the actual data using the coalescent model. Sample size was set to 50 samples per population to control the simulations. Upper and lower confidence limits of 99% quintiles were assumed for conditional joint distribution of FST vs. mean heterozygosity. Any locus that had an observed FST >99th percentile for the simulated distribution of FST was considered as a potential outlier.
The third neutrality test Arlequin v3.5 that takes into account the hierarchical structure of populations (hierarchical island model) was used. A series of coalescent simulations was performed to generate a null distribution of F-statistics, with P-values conditioned on the observed levels of heterozygosity across loci (Excoffier et al., 2009; Excoffier and Lischer, 2010). The recommended parameter values of 10,000 simulations, 100 demes per group, and 10 groups were used in the analyses. Taking a more stringent criterion, loci that fell outside the 99th percentile were considered as candidates for selection.
Locus Assessment and Selection of High-Performance (HP) SNPs
With the goal to obtain a minimum panel and a robust set of SNP markers that can provide maximum discriminative and assignment power to our population samples, three parameters were used to assess the informativeness of the 96 SNP markers. The first parameter was “performance score” based on BELS (backward elimination locus selection) ranking (Bromaghin, 2008). Each locus was assigned with two values by BELS: a rank value based on the accuracy of individual assignment and a loss value when the locus was removed from the panel assessed through a leave-one-out cross-validation, also known as jackknifing method. Loci that result in the greatest loss in individual assignment performance when removed were received with the highest score. Analyses were performed with resampling for a simulated population size of 100 individuals and with 250 iterations. No critical population was defined. The performance measure was designated to maximize mean individual assignment accuracy for 100% correct assignment. Loci were ordered by random in the analyses given that input orders do not have any impact on the rank of the locus (Storer et al., 2012). Loci with high BELS score were further assessed with FST value and minor allele frequency (MAF).
For each locus, the distribution of genetic variation among and within populations was estimated by AMOVA-based global and pairwise F-statistics with SPAGeDi version 1.4 (Hardy and Vekemans, 2002). The level of significance was calculated with two-sided tests after 1,000 random permutations of loci, individuals, and populations. Fixation index varies widely among different groups of organisms and there is no consensus in defining high or low FST values. In P. falciparum, FST values typically ranged from < 0.01 to 0.05 within malaria-endemic countries (Mobegi et al., 2012; Duffy et al., 2017) and < 0.03–0.05 between countries within a continent (Tanabe et al., 2010; Samad et al., 2015). Loci of FST values ≥ 0.03 were expected to provide moderate discriminative power for populations (Antao et al., 2008; Narum and Hess, 2011) and this was used as the threshold for selecting high performance (HP) loci.
It has been suggested that loci of a high minor allele frequency (MAF) have significantly greater power to detect a genetic effect in genome-wide association studies (Tabangin et al., 2009). All loci were ranked from the lowest to highest MAF and extrapolated with BELS rank and FST values. Loci with MAF >20% were expected to exhibit high heterozygosity and discriminative power among population samples (Sanchez et al., 2006; Yousefi et al., 2018). On the other hand, inclusion of rare genotypes likely results in spurious findings and thus loci of low MAF (< 10%) were removed (Ardlie et al., 2002; Tabangin et al., 2009).
Assignment Rate
Loci were classified and examined according to the following groupings: (1) all SNP loci with outlier loci removed (N = 80); (2) nonsynonymous SNPs only (N = 44); (3) silent SNPs only (N = 36); (4) barcode SNPs (N = 18; six of the 24 loci were excluded due to technical constraints in assay design; Daniels et al., 2008); (5) “high-performance” SNPs (N = 18; loci of global FST values ≥0.03, ranked in the top 20 by BELS performance score, and MAF >20%) and (6) microsatellite loci (N = 9).
Assignment power of each dataset was assessed by an exclusion test in GENECLASS 2.0 (Piry et al., 2004). The probability of an individual assigned to the same sampled locality or misassigned to a different locality was estimated. Simulations were performed with the Bayesian-based method that used a Dirichlet distribution as a prior distribution for allele frequency at a given locus to test statistically whether one or more of the sampled localities can be ruled out as the area of origin (Rannala and Montain, 1997). A Monte Carlo resampling method of Paetkau et al. (2004) that preserves linkage disequilibrium derived from recent generations of immigrants and reflects the sampling variance inherent in the limited size of reference datasets was used to generate population samples of the same size as the reference population. The assignment criterion was then computed for each individual of the newly simulated population. The probability of individual genotypes from each locality was calculated by comparing individual genotypes to 10,000 simulated individuals per locality. A probability threshold of alpha = 0.05, above which any individual was considered as misassigned was employed. The log-likelihood scores were plotted for each pair of populations and the mean likelihood ratios (DLR: the mean distance of individuals from the diagonal center line) were used to assess the power for detecting migrants with our dataset (Paetkau et al., 2004). A DLR value of >5 was considered to be associated with near maximum power to distinguish immigrants and residents, whereas a DLR of < 3 was associated with power of < 0.5 (Paetkau et al., 2004).
Concerning the potential of high-grading bias i.e., over-estimations of assignment power when the exact same individuals were used for both selecting a panel and assessing assignment accuracy; Anderson, 2010), gsi_sim (Anderson et al., 2008) implemented in Cygwin, a Unix-environment for Windows (Gosselin, 2016) that controls for high-grading bias was used to evaluate self-assignment accuracy for the different SNP panels and microsatellite data. A Training, Holdout, Leave-one-out (THL) cross-validation method was applied by creating simulations of individual genotypes through bootstrap sampling and assigning these individuals to a population based on the baseline calculated across all individuals (Anderson, 2010). Self-assignment accuracy was evaluated using gsi_sim self-assign procedure.
To test the effect of sample size and determine the minimum number of individuals per population for the identification of HP SNPs, a subset of 5, 10, 20, 30, 40, and 50 individuals were randomly selected from each site by bootstrap sampling method to generate different subsets of samples. To offset potential sampling error associated with subsampling, 10 iterations were performed for each sampling procedure. BELS, FST and MAF analyses as outlined above were conducted to identify HP SNPs across samples. The SNPs identified with high-performance were compared across iterations for consistency. In addition, self-assignment rate was evaluated for the different subset of samples and compared among the SNP panels and microsatellite data.
Genetic Clustering
Pairwise FST values (Nei, 1972; Weir and Cockerham, 1984) were estimated to indicate level of genetic differentiation among populations and were compared among datasets. Multivariate principal components analyses (PCA) were performed based on the square Euclidean distances to infer and display clustering pattern of individuals (Smouse and Peakall, 1999). Biplots of the first two components that showed the greatest proportion of variance were generated in R. In addition, a model-based Bayesian method implemented in STRUCTURE version 2.3.4 was performed to examine partitioning of individuals to genetic clusters (Pritchard et al., 2000). The number of clusters (K) was determined by simulating a range of K values from 1 (no genetic differentiation among all localities) to 5 (all localities were differentiated genetically from one another). The posterior probability of each value then was used to detect the modal value of ΔK, a quantity related to the second order rate of change with respect to K of the likelihood function (Evanno et al., 2005). Posterior probability values were estimated using a Markov Chain Monte Carlo (MCMC) method, and a burn-in period of 500,000 iterations followed by 106 iterations of each chain were performed to ensure convergence of the MCMC. Each MCMC chain for each value of K was run eight times with the “independent allele frequency” option that allows individuals with ancestries in more than one group to be assigned into one cluster. Individuals were assigned into K clusters according to membership coefficient values (Q) ranged from 0 (lowest affinity to a cluster) to 1 (highest affinity to a cluster).
Results
SNP Characteristics
A total of 314 samples from five populations located in moderate-high transmission area of Western Kenya were included in this study (Figure 1). These samples were shown to produce a single peak (allele) in fragment analyses of the microsatellite loci and represented single clone infections (Supplementary File 1). Eighty-two of the 96 genotyped SNP loci produced a call rate of >95% and were highly concordant among duplicated samples in independent runs. Genotypes of these 82 SNPs were scored with confidence across samples, and they exhibited a wide distribution of minor allele frequencies (MAF) from rare (MAF < 10%) to common (MAF > 40%) with an average of 30.7% (Table 1, Supplementary File 2). No significant linkage disequilibrium was detected for the 1081 possible pairwise combinations of loci (Bonferroni corrected P < 0.05 or smaller). Likewise, no significant linkage disequilibrium was detected among the nine tested microsatellite loci.
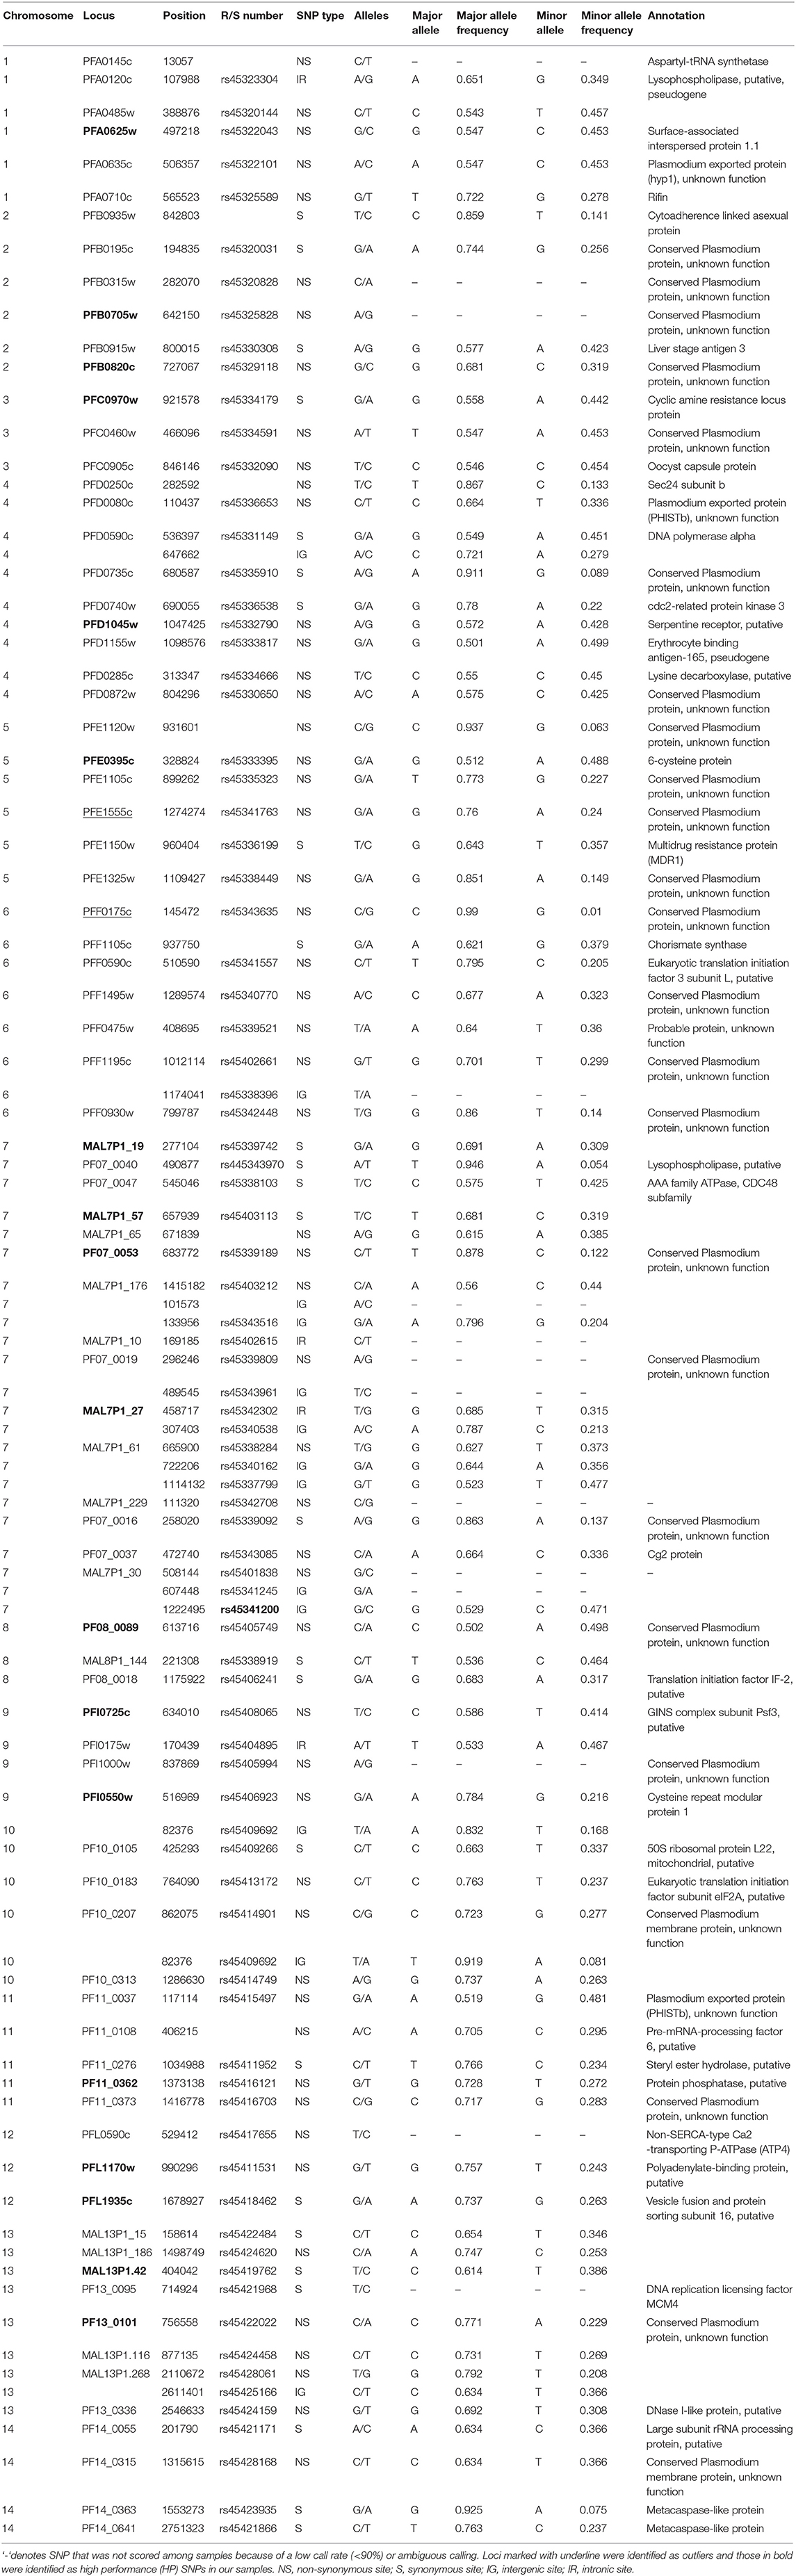
Table 1. Detailed information of the SNPs examined in the present study.
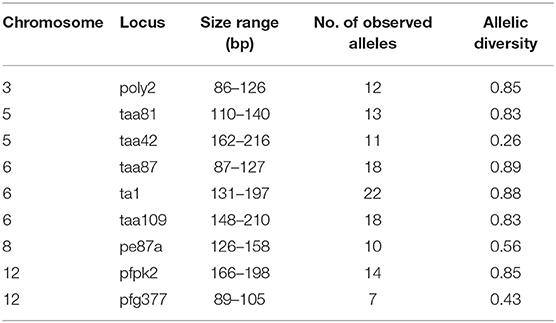
Table 2. Information of microsatellite loci used in the present study.
Of the 82 SNP loci, BAYESCAN identified two candidate SNPs, PFE1555c on chromosome 5 and PF07-0053 on chromosome 7, for diversifying selection at the 99% posterior probability threshold (Supplementary Figure 1A). These two loci and PFD0735c located on chromosome 4 were found to lie outside the 99% confidence zone of the conditional joint distribution of FST and mean heterozygosity by LOSITAN (P < 0.05; Supplementary Figure 1B). Arlequin 3.5 identified five SNPs (PFE1555c, PF07-0053, PFD0735c, PF07-0040, and PF08-0018) as outliers under selection at the upper 99% confidence interval. Because PFE1555c and PF07-0053 were consistently indicated as outlier by BAYESCAN, LOSITAN, and Arlequin, these loci were removed in subsequent analyses.
Identification of High-Performance SNPs
For the remaining 80 SNPs, we assessed discriminative power to our population samples based on FST (SNPs of higher FST were expected to provide greater differentiate power for populations), minor allele frequency (SNPs of high MAF were more polymorphic among populations), and BELS performance (SNPs of high score had high individual assignment power). Nineteen of the 80 examined SNPs showed FST values of ≥ 0.03, 29 had FST values ranging from 0.01 to 0.03, and 34 had values < 0.01. The FST values were significantly correlated with the BELS performance score (R2 = 0.83 and P < 0.01; Figure 2A). SNPs of FST ≥ 0.03 all had a relatively high performance score and were ranked in the top 20. Among them, 11 were nonsynonymous and 8 were silent SNPs. The top 20 SNPs that had the highest BELS rank also exhibited MAF values greater than 20%, indicating a relatively high prevalence of minor alleles (Figure 2B). Although no significant correlation was found between FST values and MAF (R2 = 0.0076 and P > 0.05; Figure 2C), 18 of the top 20 BELS ranked SNPs showed both FST value ≥ 0.03 and MAF >20%. These SNPs included 11 nonsynonymous and 7 silent mutations. They were distributed on all chromosomes of the P. falciparum genome except chromosomes 6, 10, and 14 (Table 1). Five of them (MAL7P1_19, MAL7P1_57, PF07_0053, PF08_0089, and PFI0725c) were the proposed barcode SNPs located on chromosomes 7, 8 and 9. They potentially provided the greatest discriminative power to our population samples. They were named as high performance (HP) SNPs hereafter.
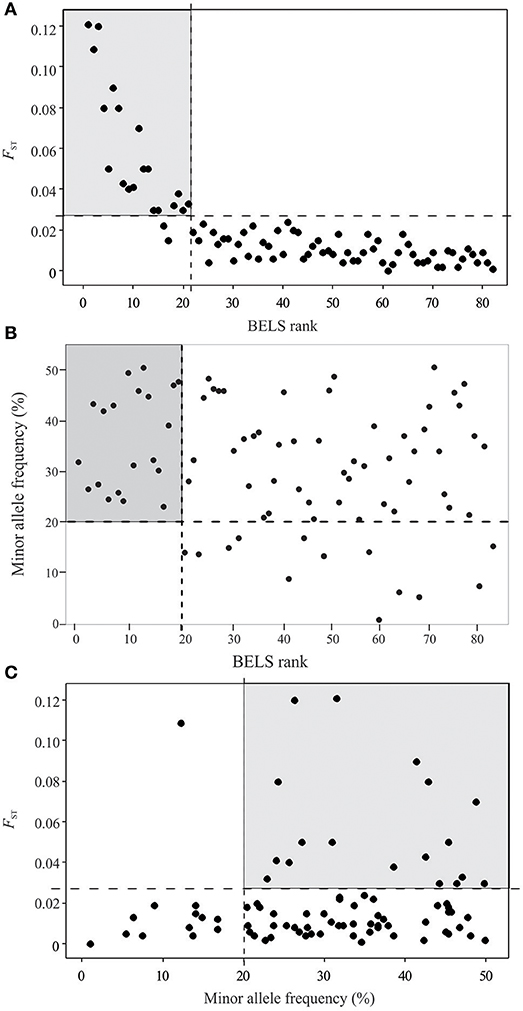
Figure 2. Loci assessment and selection of high performance SNPs based on BELS ranking, FST value and minor allele frequency (MAF). (A) Scatter plot of BELS ranking (X-axis) against FST value (Y-axis). SNP loci are indicated as close circles. The gray-shaded area contains SNP loci that are ranked as the top 20 based on BELS performance score and have FST ≥ 0.03 and. (B) Scatter plot of BELS ranking (X-axis) against minor allele frequency (Y-axis). The gray-shaded area contains SNP loci that are ranked as the top 20 based on BELS performance score and MAF >20%. (C) Scatter plot of minor allele frequency (X-axis) against FST value (Y-axis). The gray-shaded area contains SNP loci that have FST ≥ 0.03 and MAF >20%.
Assignment Power of SNPs
The SNP and microsatellite markers showed an overall low self-assignment rate with < 70% of the individuals assigned to their site of collection (Figure 3). Among all SNP panels, HP SNPs had the highest self-assignment rate on average (mean = 35.88% ± 16.35; Figure 3) followed by the barcode SNPs (32.83% ± 10.07). This range was comparable to that in microsatellites (mean = 30.17% ± 10.07). The greatest variation was observed in the silent SNP panel where the self-assignment rate ranged from 66.67% in site CW to 1.89% in site MY. Such a large range of variation was also found when all (mean = 29.84% ± 24.77) and nonsynonymous SNPs (mean = 31.16% ± 23.76; Figure 3) were used.
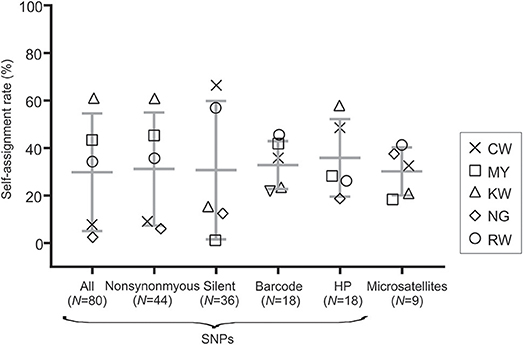
Figure 3. Box plot showing self-assignment rate (%) using the Training, Holdout, Leave-one-out (THL) double cross-validation method in gsi_sim for the different SNP panels and microsatellite markers. Values of mean and standard deviation for each marker set were indicated.
The relatively low self-assignment rate could be in part attributed to misassignment of individuals to the other sites. For instance, individuals from site RW (from the south) had the lowest self-assignment rate among the other sites (Figure 4). About 20–30% of these individuals were assigned to site CW (north) based on nonsynonymous, barcode, and microsatellites (Figures 4B,D,F); and 30–45% were assigned to site NG (south) based on all, silent, and HP SNPs (Figures 4A,C,E). Likewise, 20–40% of individuals from KW (south) were assigned to its neighboring site NG based on nonsynonymous, silent, and barcode SNPs (Figures 4B–D). The consistent patterns in misassignment between geographically proximal sites (Figure 1) may explain the low self-assignment rate revealed by different SNP panels.
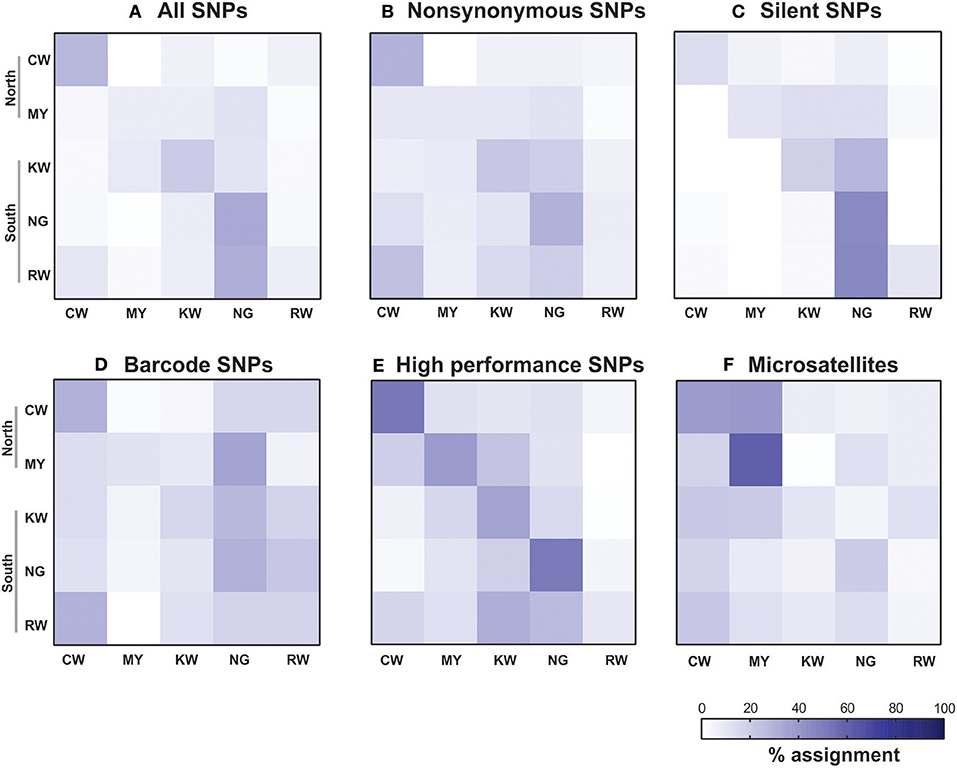
Figure 4. Assignment matrix heatmaps of the SNP datasets (A-E) and microsatellites (F) indicating percentage assignment. Color intensity reflects the probability of an individual from a reference population (rows) being assigned to a given population (columns). The darkest shade indicates the highest probability and the lightest shade indicates the lowest. CW, Chwele; MY, Mayanja; KW, Kanyawegi; NG, Ngiya and RW, Rwambua.
The analysis of likelihood ratios indicated an overall low DLR values for all the datasets (all SNPs = 1.24–3.87; nonsynonymous SNPs = 1.23–3.69; synonymous SNPs = 1.12–2.02; barcode SNPs = 0.85–2.33; HP SNPs = 1.02–2.42). Most points were distributed along the central diagonal line and displayed DLR values < 3, regardless of whether samples were from the same (Supplementary Figure 2) or different regions (Supplementary Figure 3). These results suggested low detection power in identifying migrants by both the SNP and microsatellite markers at a fine-spatial scale.
The number of SNPs that showed FST value ≥0.03 and MAF >20% was found to decrease with increasing sample size (Figure 5A). With smaller samples, SNPs identified as high-performance based on the FST and MAF criteria were different among runs. The BELS rank of these SNPs varied widely from 1 to 65. No consistent panel was detected. Nonetheless, when sample size reached 30 or higher, a similar set of SNPs were shown consistently among runs (Figure 5A). These high-performance SNPs revealed high differentiate power (FST ranged from 0.005 to 0.047 and P < 0.05; MAF ≥ 20%) and higher self-assignment rate on average compared to other SNP panels (Figure 5B). Simulation analyses based on our dataset showed that self-assignment rate increased with increasing sample size. At a sample size of 30, self-assignment rate leveled at 37–40%. These results support the conclusion that a minimum of 30 individuals per population is needed to identify HP SNPs from a large panel of SNPs that described population structure among our samples.
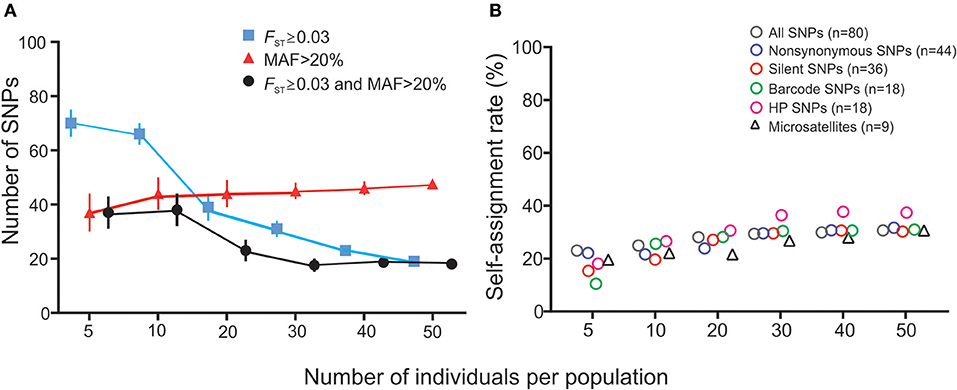
Figure 5. Results of simulation analyses showing the effect of sample size on (A) the numbers of SNPs identified as high-performance and (B) self-assignment rate. (A) The number of SNPs (y-axis) that has FST ≥ 0.03 (blue line), MAF >20% (red line), and fits both FST ≥ 0.03 and MAF >20% criteria (black line) against sample size (x-axis). Each data point represents the average number of SNPs detected among 10 independent runs and the variance is indicated by error bar. (B) Self-assignment rate (y-axis) against sample size (x-axis) for the different SNP panels and microsatellite markers. Values of mean and standard deviation for each marker set were indicated.
Clustering Patterns
Mantel tests indicated that FST matrices of all the SNP panels were significantly correlated with one another (P < 0.05; Supplementary Table 3), despite differences in the level of differentiation (Table 3). Among the SNP matrices, HP SNPs showed the greatest level of differentiation with FST values ranged from 0.017 (NG-RW; the southern sites) to 0.082 (CW-KW and CW-NG; between north and south; Table 3). These values were comparable to that observed in microsatellites (FST ranged from 0.008 to 0.074). The genetic relatedness revealed by the SNP markers mirrored the geographical proximity of the sites (Figure 1). The deepest divergence was consistently shown between the northern site CW and the southern sites KW and NG (Table 3). On the other hand, sites NG and RW from the south were found to be least diverged from one another. The FST matrix of HP SNPs was significantly correlated with that of the microsatellites (P < 0.05; Supplementary Table 3), indicating similar patterns of genetic divergence between sites.
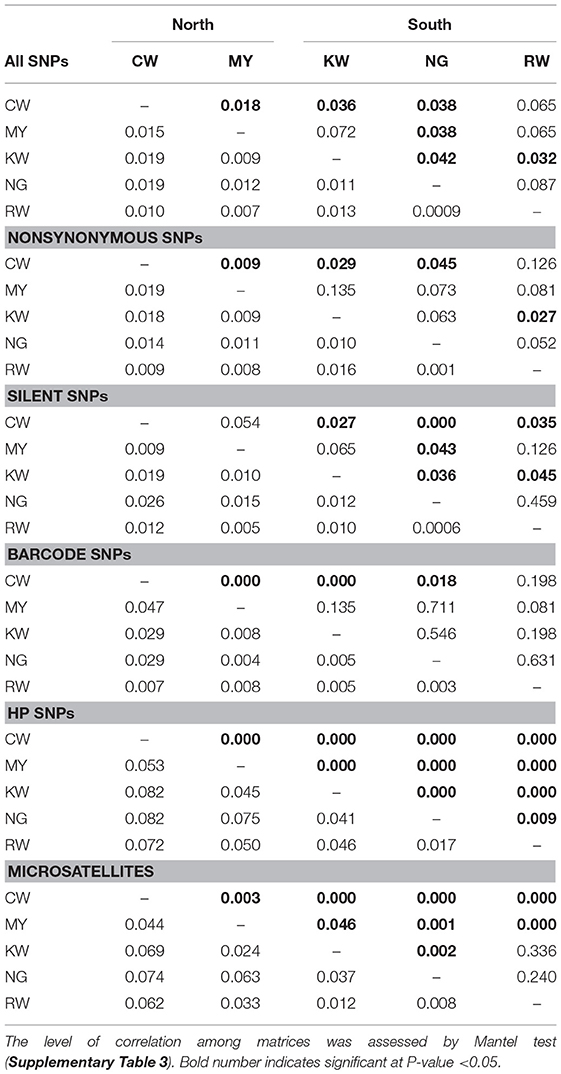
Table 3. Pairwise FST value (lower diagonal) and p-value (upper diagonal) of SNP and microsatellite datasets.
Among all the SNP panels, HP SNPs revealed the clearest clustering pattern for samples from the five studied sites (Figure 6). By contrast, samples of different sites were mixed without clear separation based on nonsynonymous, silent, and barcode SNPs. Compared to HP SNPs, microsatellites also showed respective clustering of the CW and MY samples from the north. These were separated from those of sites KW, NG, and RW from the south, consistent with the levels of differentiation observed at the population level (Table 3).
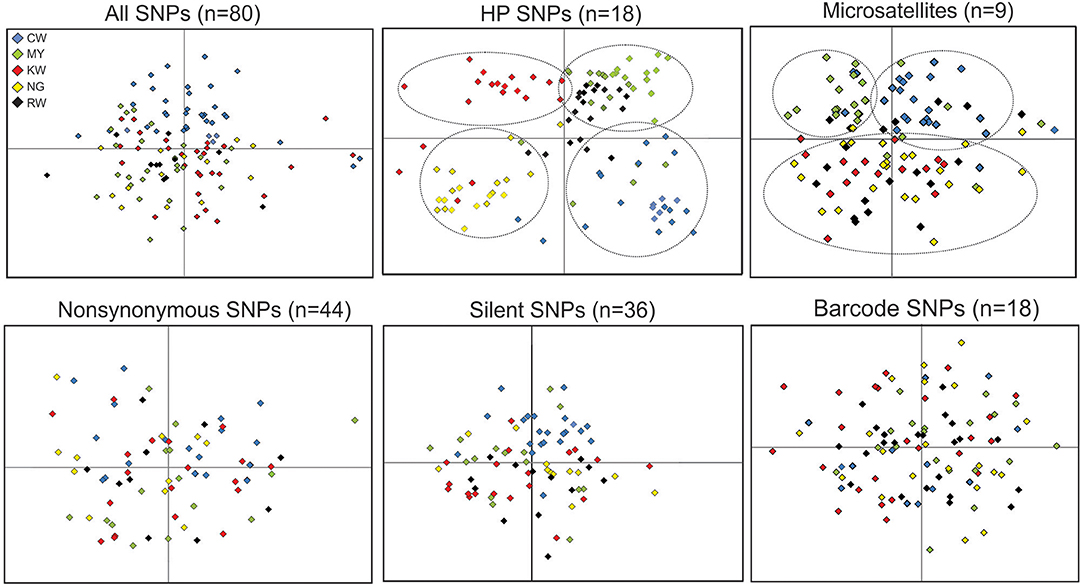
Figure 6. Clustering patterns among locality samples based on the different types of SNPs and microsatellites. The first two axes that together represented over 80% of the total variation from principle component analyses are shown. The five studied sites are presented by different color (CW, blue; MY, green; KW, red; NG, yellow; RW, black). Clusters with respect to locality are indicated by dotted lines.
For all datasets except nonsynonymous SNPs and microsatellites, STRUCTURE analyses indicated two most probable genetic clusters among the samples (Figure 7). However, the pattern of how samples were clustered was different. For example, over 80% of the samples from CW shared the same cluster with samples from MY based on the HP SNP (Q-values > 0.9 for the yellow cluster; Figure 7E) and microsatellite data (Q-values >0.9 for the purple cluster; Figure 7F); whereas samples from KW, NG, and RW were found to have mixed composition of the different clusters. This clustering pattern was concordant with the FST values showing clear divergence between the northern and southern sites (Table 3). Furthermore, samples from the north appeared to have more homogeneous gene pool compared to those in the south (KW, NG, and RW) that showed greater diversity. Although two clusters were defined based on all, silent and barcode SNP panels (Figures 7A,C,D), samples from the five sites shared similar genetic composition. For the nonsynonymous SNPs (Figure 7B), almost all samples had a mixed gene pool (Q < 0.5 in the three respective clusters) and could not be confidently assigned to any of the defined clusters.
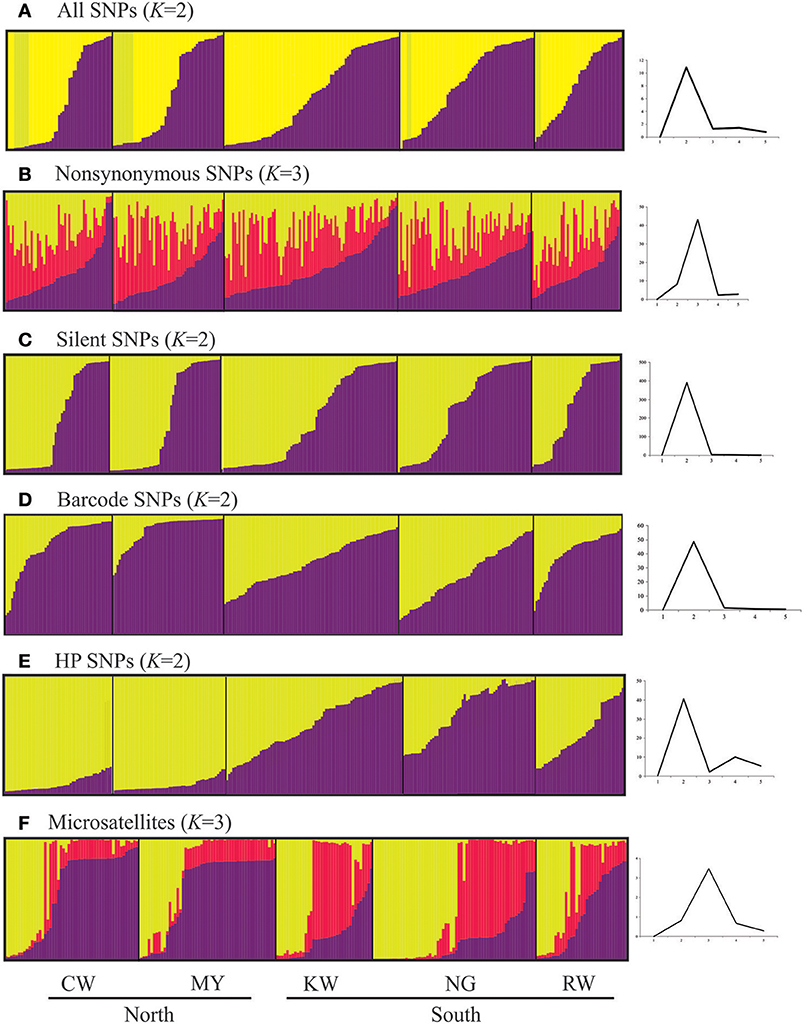
Figure 7. Histograms based on Structure analyses showing partitioning of samples to the defined genetic clusters based on the different types and SNPs and microsatellites. Each defined cluster is represented by a different color. The number of K clusters (plots on the right) was determined by the posterior probability of likelihood values obtained in the Bayesian run, which were used to detect the modal value of ΔK, a quantity related to the second-order rate of change with respect to K of the likelihood function.
Discussion
SNPs have been shown to be useful in fast evolving organisms such as Plasmodium for inferring population structure at regional and continental levels (Campino et al., 2011; Yalcindaga et al., 2012). Careful assessment and selection of SNP markers is key to capturing and revealing population-level signals because differences in mutation rates among SNP loci may contribute to variation in assignment power and clustering patterns of individuals (Lercher and Hurst, 2002; Morin et al., 2004; Cao et al., 2016). Although microsatellites offer great differentiation power to populations, SNP markers display a number of advantages including high assignment accuracy (Narum et al., 2008; Trong et al., 2013; Sellars et al., 2014), fewer null alleles (Van-Der Merwe et al., 2013), and easy multiplexing with several loci on a moderate to high throughput platform (Chen et al., 2007). The unlimited number of SNP loci, in principle, should help uncover hidden variation and further split seemingly homogeneous groups. Additionally, SNPs are useful in the discovery of quantitative trait loci (QTL) (Reilly Ayala et al., 2010; Ranford-Cartwright and Mwangi, 2012; Gutierrez et al., 2014; Avia et al., 2017), the association of mutations with important functions (Su et al., 2007; Van-Der Merwe et al., 2013; Duarte et al., 2014), and elucidation of source-sink dynamics (Yalcindaga et al., 2012; Bletz et al., 2013; Cure et al., 2017). Thus, besides being powerful in reflecting genome-wide diversity patterns within and among populations, SNPs can also provide information on local adaption or selection process.
The most widely used methods for SNP selection rely on measures of population differentiation where SNPs are ranked by fixation index (Karlsson et al., 2011; Larson et al., 2014; Lemay and Russello, 2015; André et al., 2016). Although FST -based method only considers loci through a single, univariate rank for importance (Brieuc et al., 2015), this method coupled with MAF that reflects polymorphism can identify loci with high discriminative power. BELS provides additional stringency to loci selection by considering assignment success (Bromaghin, 2008; Storer et al., 2012). However, screening a large number of candidate loci with a small set of sample especially between closely related populations (FST ≤ 0.01) can lead to over-estimation of predictive power (high-gradingbias; Anderson et al., 2008). The THL double cross-validation method allows correction for high-grading bias when assessing assignment accuracy of the locus panel using a separate holdout set of samples that was not used to choose the set of loci for the marker panel (Anderson, 2010). Our analyses indicated that the loci selected by BELS, FST and MAF criteria showed a slightly higher self-assignment rate than the other SNP panels. With smaller samples, no consistent loci panel was detected with high discriminative power. Self-assignment rate was also relatively low. However, when sample size reached 30 or higher, a similar set of SNPs were shown with relatively higher discriminative power and self-assignment accuracy. This discrepancy could be due to a greater impact of ascertainment bias when selecting SNP panel with a relatively small subset of samples (Storer et al., 2012; Lachance and Tishkoff, 2013). A minimum of 30 individuals per population enabled identification of a robust set of HP SNPs among the samples in our dataset.
In this study, both the HP SNPs and microsatellites reflected differentiation between the north and the south, but no clear structure among samples within the same region. These findings suggest that parasite populations around the lakeshore area in the south were more closely related than those in the north possibly through frequent gene exchange among communities of close proximity, and reduced gene flow between the lakeshore area and the north. It is noteworthy that the HP SNPs described here showed relatively better discriminative power and modest self-assignment compared to the other SNP panels in our population samples. This is not a universal set of SNPs that provides the best resolving power and self-assignment rate to all populations of P. falciparum. It is possible that the ability to track disease spread at the local level particularly between communities within the same area can be improved by increasing the number of HP loci using the selection procedure described here. However, the chances for improvement will depend on the population structure and level of differentiation at the local level. Self-assignment accuracy did not significantly increase with a larger panel size, particularly if less-informative SNPs were included in the panel (Sylvester et al., 2018). The correlation between the size of SNP panel and assignment accuracy also depends on population structure. For instance, as few as 24 SNPs can provide high assignment accuracy (≥81%) in well-differentiated populations (FST ≥0.2; Narum et al., 2008; Picq et al., 2017). However, assignment accuracy was shown to plateau at 31% for populations with minimal genetic differentiation (FST = 0.002) even using as many as 10,516 SNPs (Benestan, 2016).
Apart from SNP number and population structure, sample size could also have an effect on the assignment accuracy. Benestan et al. (2015) demonstrated that at sample size of 30 individuals per population, assignment accuracy was 25–30%. In situations of weak genetic differentiation (FST < 0.01), it could be challenging to achieve high assignment accuracy unless large samples are used (e.g., when ≥100 individuals were used in each population, assignment accuracy reached >80%; Benestan, 2016). The observation of low self-assignment rate (~30%) with SNPs and microsatellite markers in our P. falciparum samples likely relates to high levels of contemporary gene flow between populations. It is possible to achieve a higher assignment rate by increasing number of individuals and/or polymorphic loci (André et al., 2011). Ongoing study uses the high-performance SNPs reported in this study on broader population samples across Kenya to further assess their performance.
When selecting HP SNPs, identification of outliers is important because such loci could bias estimates of population genetic parameters such as gene flow, population size and structure. In addition, they are potentially under selection and could be a sign of adaptive variation (Hess et al., 2012; Pyhäjärvi et al., 2013). In the present study, PFE1555c and PF07-0053 were confidently identified as outliers. They were nonsynonymous substitutions located in the exonic region of protein-encoding genes in Plasmodium but of unknown function. Inclusion of these two SNPs in our population genetic analyses did not change the relationships and clustering patterns of samples but provide a slightly stronger differentiation between the northern and southern populations. These mutations may represent genes under local selection or indicators of nearby non-neutral mutations by hitchhiking effect in the P. falciparum genome (Andolfatto, 2001; Cai et al., 2009). Despite the concern that loci influenced by selection could bias the inference of neutral evolutionary processes such as gene flow and genetic drift, non-neutral loci may serve as powerful markers for detecting population structure in high gene-flow species and for increasing assignment power for individuals (Nielsen et al., 2009; Matala et al., 2014), given that selection pressure is temporally stable on ecological time-scales (Waples and Gaggiotti, 2006; André et al., 2011). Future investigations should explore the frequency of these mutations in natural populations and their functional significance in the context of antimalarial drug resistance or host compatibility and vector competency for the parasite.
Three additional SNPs, PFD0735c, PF07-0040, and PF08-0018, were detected as outlier by Arlequin but not by BayeScan and LOSITAN at the 95% Bayes factor threshold or confidence region. These SNPs were synonymous substitutions and thus were not expected to be under selection. One possible explanation for this discrepancy is that these outlier detection methods could be different in the level of sensitivity (false negatives) and specificity (false positives). For instance, BayesScan may not be sufficiently sensitive to detect loci under weak selection pressure that usually yield low global FST values. However, compared to Arlequin, BayesScan has been shown to have the least type I (false positive) error, and both BayesScan and LOSITAN have the least type II error (Narum and Hess, 2011), indicating that they give more reliable results than Arlequin. Although a recently introduced logistic regression approach named Spatial Analysis Method (SAM) may outperform the existing methods and offer a greater power in detecting outliers (Joost et al., 2008), this approach requires characterization of environmental and habitat data that are currently not available in our study.
The success of finding a set of SNP loci that can identify and track genotypes from continental, regional to local community scale in part depends on knowledge of SNP loci and testing on many population samples. A panel of 24 barcode SNP loci was proposed to provide geographical identity of P. falciparum and allow tracking the geographical origin of field or clinical infections around the world (Daniels et al., 2008). These barcode SNPs were designed on the basis of parasite cultures from broad geographical regions. Therefore, they were expected to discriminate parasite samples among regions but show high genetic integrity of samples within the same region. Although these SNPs were not 100% identical among our samples from Western Kenya, they were relatively homogeneous compared to other SNP and microsatellite loci. Nearly 90% of the samples from different localities were assigned to one genetic cluster. Campino et al. (2011) suggested as few as 13 SNPs were sufficient to differentiate P. falciparum at a regional level. Owing to short generation time and fast mutation rate of P. falciparum, it is not surprising that a small number of SNPs can differentiate genotypes of this species at a fine-spatial scale.
The nonsynonymous SNPs revealed similar levels of discriminative power and assignment rate as the synonymous SNPs. We did not detect convincing signals of selection for the remaining nonsynonymous SNPs supporting a conclusion that they are likely under neutral selection. Nonsynonymous SNPs in coding regions are generally expected to result in functional changes in the gene product leading to an alteration of phenotype. This type of SNP is usually is subjected to the effects of natural selection as compared to silent SNPs. Thus, it is plausible that while a mutation at these sites can alter amino acid sequence of the encoded protein, the protein structure may remain similar and have little or no impact on fitness (Sunyaev et al., 2001).
To conclude, the applications of SNPs on fine-scale population study rely on a careful assessment and selection of SNP markers in order to capture and reveal meaningful population signals. This process entails knowledge of SNP loci and testing many population samples. In this study, we described the procedure of selecting a set of HP SNPs from a large panel of SNPs that resolve population structure of P. falciparum between the northern and southern regions of Western Kenya. Future work is needed to determine if this procedure can result in SNPs panels capable of tracing Plasmodium spread at finer geographical scales.
Author Contributions
EL, AJ, AG, and GY conceived and designed the study. EL, YA, HE, and GZ collected the samples. EL, EH-S, AF, and DJ collected and analyzed the data. EL, MB, and AF designed the simulations. EL and MB wrote the paper.
Funding
The work was supported by grants from the National Institutes of Health (R01 AI050243, U19 AI129326 and D43 TW001505).
Conflict of Interest Statement
The authors declare that the research was conducted in the absence of any commercial or financial relationships that could be construed as a potential conflict of interest.
Acknowledgments
The authors are greatly indebted to technicians and staff from Kenya Medical Research Institute (KEMRI) for sample collection, undergraduate research students who participated in molecular data collection and Alex Lee for producing the map used in this manuscript.
Supplementary Material
The Supplementary Material for this article can be found online at: https://www.frontiersin.org/articles/10.3389/fevo.2018.00145/full#supplementary-material
Supplementary Figure 1. BayeScan and LOSITAN scatter plots identify gene outliers. (A) BayeScan plot identifies two SNPs in genes, PFE1555c, and PF07-0053, with Bayes factor >2 implying strong selection. SNP loci are denoted by vertical lines and microsatellite loci by open circles. X-axis is the FST value and the Y-axis is log10 posterior odds value. (B) LOSITAN analysis identifies three loci, PFE1555c, PF07_0053 and PFD0735c, under apparent selection. SNP loci are denoted by close circles and microsatellite loci by open circles. The gray-shaded area represents the 99% confidence zone. X-axis is same as A and Y-axis is a direct measure of heterozygosity.
Supplementary Figure 2. Log-likelihood plots for assignment for first generation migrants between populations from the south. Green dots denote individuals from site NG (south) and blue dots denote individuals from site KW (south). Most points were close to the center diagonal line and quantitatively, DLR values were < 3 in all comparisons with SNPs and microsatellites, indicating low assignment power of migrants.
Supplementary Figure 3. Log-likelihood plots for assignment for first generation migrants between populations from the north and south. Red dots denote individuals from site CW (north) and blue dots denote individuals from site KW (south). Most points were close to the center diagonal line and quantitatively, DLR values were < 3 in all comparisons with SNPs and microsatellites, indicating low assignment power of migrants.
Supplementary Table 1. Characteristics of different SNP multiplexing platforms and their applications based on previous studies across biological organisms (literature from 2011-present) as compared to microsatellites. Asterisk indicates the platform used in the present.
Supplementary Table 2. Comparison of nucleotide diversity among the different types of SNPs. Groups with the same index letters were not significantly different at p = 0.05.
Supplementary Table 3. Correlation of FST matrices among SNP and microsatellite datasets by Mantel test. Correlation coefficient (r, lower diagonal) and p-value (upper diagonal) were indicated. At alpha = 0.05, we reject the null hypothesis that the two matrices were unrelated, i.e., a significant correlation was observed when p-value ≤ 0.05 (number in bolded). HP, High performance.
Supplementary File 1. Microsatellite data of P. falciparum samples from the five study sites in Western Kenya.
Supplementary File 2. SNP data of P. falciparum samples from the five study sites in Western Kenya.
References
Albaina, A., Iriondo, M., Velado, I., Laconcha, U., Zarraonaindia, I., Arrizabalaga, H., et al. (2013). Single nucleotide polymorphism discovery in albacore and Atlantic bluefin tuna provides insights into worldwide population structure. Anim. Genet. 44, 678–692. doi: 10.1111/age.12051
Amambua-Ngwa, A., Park, D. J., Volkman, S. K., Barnes, K. G., Bei, A. K., Lukens, A. K., et al. (2012). SNP Genotyping identifies new signatures of selection in a deep sample of West African Plasmodium falciparum malaria parasites. Mol. Biol. Evol. 29, 3249–3253. doi: 10.1093/molbev/mss151
Anderson, E. C. (2010). Assessing the power of informative subsets of loci for population assignments: standard methods are upwardly biased. Mol. Ecol. Res. 10, 701–710. doi: 10.1111/j.1755-0998.2010.02846.x
Anderson, E. C., Waples, R. S., and Kalinowsko, S. T. (2008). An improved method for predicting the accuracy of genetic stock identification. Can. J. Fish. Aqua. Sci. 65, 1475–1486. doi: 10.1139/F08-049
Anderson, T. J., Nair, S., Sudimack, D., Williams, J. T., Mayxay, M., Newton, P. N., et al. (2005). Geographical distribution of selected and putatively neutral SNPs in Southeast Asian malaria parasites. Mol. Biol. Evol. 22, 2362–2374. doi: 10.1093/molbev/msi235
Anderson, T. J., Su, X. Z., Bockarie, M., Lagog, M., and Day, K. P. (1999). Twelve microsatellite markers for characterization of Plasmodium falciparum from finger-prick blood samples. Parasitol 119, 113–125. doi: 10.1017/S0031182099004552
Andolfatto, P. (2001). Adaptive hitchhiking effects on genome variability. Curr. Opin. Genet. Dev. 11, 635–641. doi: 10.1016/S0959-437X(00)00246-X
André, C., Larsson, L. C., Laikre, L., Bekkevold, D., Brigham, J., Carvalho, G. R., et al. (2011). Detecting population structure in a high gene-flow species, Atlantic herring (Clupea harengus): direct, simultaneous evaluation of neutral vs putatively selected loci. Heredity 106, 270–280. doi: 10.1038/hdy.2010.71
André, C., Svedäng, H., Knutsen, H., Dahle, G., Jonsson, P., Ring, A. K., et al. (2016). Population structure in Atlantic cod in the eastern North Sea-Skagerrak-Kattegat: early life stage dispersal and adult migration. BMC Res. Notes 9:1. doi: 10.1186/s13104-016-1878-9
Antao, T., Lopes, A., Lopes, R. J., Beja-Pereira, A., and Luikart, G. (2008). LOSITAN: a workbench to detect molecular adaptation based on a Fst-outlier method. BMC Bioinformatics 9:323. doi: 10.1186/1471-2105-9-323
Ardlie, K. G., Lunetta, K. L., and Seielstad, M. (2002). Testing for population subdivision and association in four case-control studies. Am. J. Hum. Genet. 71, 304–311. doi: 10.1086/341719
Avia, K., Coelho, S. M., Montecinos, G. J., Cormier, A., Lerck, F., Mauger, S., et al. (2017). High-density genetic map and identification of QTLs for responses to temperature and salinity stresses in the model brown alga Ectocarpus. Sci. Rep. 7:43241. doi: 10.1038/srep43241
Bahl, A., Brunk, B., Crabtree, J., Fraunholz, M. J., Gajria, B., Grant, G. R., et al. (2003). PlasmoDB: the Plasmodium genome resource. a database integrating experimental and computational data. Nucleic Acids Res. 31, 212–215. doi: 10.1093/nar/gkg081
Beaumont, M. A., and Nichols, R. A. (1996). Evaluating loci for use in the genetic analysis of population structure. Proc. R. Soc. Lond. Biol. 263, 1619–1626. doi: 10.1098/rspb.1996.0237
Benestan, L. (2016). Erratum – Benestan et al. 2015. Mol. Ecol. 25, 1626–1629. doi: 10.1111/mec.13600
Benestan, L., Gosselin, T., Perrier, C., Sainte-Marie, B., Rochette, R., and Bernatchez, L. (2015). RAD genotyping reveals fine-scale genetic structuring and provides powerful population assignment in a widely distributed marine species, the American lobster (Homarus americanus). Mol. Ecol. 24, 3299–3315. doi: 10.1111/mec.13245
Bereczky, S., Mårtensson, A., and Gil, J. P. Färnert, A. (2005). Short report: rapid DNA extraction from archive blood spots on filter paper for genotyping of Plasmodium falciparum. Am. J. Trop. Med. Hyg. 72, 249–251. doi: 10.4269/ajtmh.2005.72.249
Bletz, S., Bielaszewska, M., Leopold, S. R., Kock, R., Whitten, A., Schuldes, J., et al. (2013). Evolution of enterohemorrhagic Escherichia coli O25 based on single-nucleotide polymorphisms. Genome Biol. Evol. 5, 1807–1816. doi: 10.1093/gbe/evt136
Bonizzoni, M., Afrane, Y., Baliraine, F. N., Amenya, D. A., Githeko, A. K., and Yan, G (2009). Genetic structure of Plasmodium falciparum populations between lowland and highland sites and antimalarial drug resistance in Western Kenya. Infect. Genet. Evol. 9, 806–812. doi: 10.1016/j.meegid.2009.04.015
Bopp, S. E., Manary, M. J., Bright, A. T., Johnston, G. L., Dharia, N. V., Luna, F. L., et al. (2013). Mitotic evolution of Plasmodium falciparum shows a stable core genome but recombination in antigen families. PLoS Genet. 9:e1003293. doi: 10.1371/journal.pgen.1003293
Brieuc, M. S., Ono, K., Drinan, D. P., and Naish, K. A. (2015). Integration of random forest with population-based outlier analyses provides insight o the genomic basis and evolution of run timing in Chinook salmon (Oncorhychus tshawytscha). Mol. Ecol. 24, 2729–2746. doi: 10.1111/mec.13211
Bromaghin, J. F. (2008). BELS: backward elimination locus selection for studies of mixture composition or individual assignment. Mol. Ecol.Res. 8, 568–571. doi: 10.1111/j.1471-8286.2007.02010.x
Cai, J. J., Macpherson, J. M., Sella, G., and Petrov, D. A. (2009). Pervasive hitchhiking at coding and regulatory sites in humans. PLoS Genet. 5:e1000336. doi: 10.1371/journal.pgen.1000336
Campino, S., Auburn, S., Kivinen, K., Zongo, I., Ouedraogo, J. B., Mangano, V., et al. (2011). Population genetic analysis of Plasmodium falciparum parasites using a customized Illumina GoldenGate genotyping assay. PLoS ONE 6:e20251. doi: 10.1371/journal.pone.0020251
Cao, L. J., Li, Z. M., Wang, Z. H., Zhu, L., Gong, Y. J., Chen, M., et al. (2016). Bulk development and stringent selection of microsatellite markers in the western flower thrips Frankliniella occidenalis. Sci. Rep. 6:26512. doi: 10.1038/srep26512
Chen, K., McLellan, M. D., Ding, L., Wendl, M. C., Kasai, Y., Wilson, R. K., et al. (2007). PolyScan: an automatic indel and SNP detection approach to the analysis of human resequencing data. Genome Res. 17, 659–666. doi: 10.1101/gr.6151507
Cure, K., Thomas, L., Hobbs, J. P. A., Fairclough, D. V., and Kennington, W. J. (2017). Genomic signatures of local adaptation reveal source-sink dynamics in a high gene flow fish species. Sci. Rep. 7:8618. doi: 10.1038/s41598-017-09224-y
Daniels, R., Volkman, S. K., Milner, D. A., Mamesh, N., Neafsey, D. E., Park, D., et al. (2008). A general SNP-based molecular barcode for Plasmodium falciparum identification and tracking. Malar. J. 7:223. doi: 10.1186/1475-2875-7-223
Duarte, J., Rivière, N., Baranger, A., Aubert, G., Burstin, J., Cornet, L., et al. (2014). Transcriptome sequencing for high throughput SNP development and genetic mapping in Pea. BMC Genomics 15:126. doi: 10.1186/1471-2164-15-126
Duffy, C. W., Ba, H., Assefa, S., Ahouidi, A. D., Deh, Y. B., Tandia, A., et al. (2017). Population genetic structure and adaptation of malaria parasites on the edge of endemic distribution. Mol. Ecol. 26, 2880–2894. doi: 10.1111/mec.14066
Durham, M. F., Magwire, M. M., Stone, E. A., and Leips, J. (2014). Genome-wide analysis in Drosophila reveals age-specific effects of SNPs on fitness traits. Nat. Comm. 5:4338. doi: 10.1038/ncomms5338
Evanno, G., Regnaut, S., and Goudet, J. (2005). Detecting the number of clusters of individuals using the software structure: a simulation study. Mol. Ecol. 14, 2611–2620. doi: 10.1111/j.1365-294X.2005.02553.x
Excoffier, L., Hofer, T., and Foll, M. (2009). Detecting loci under selection in a hierarchically structured population. Heredity 103, 285–298. doi: 10.1038/hdy.2009.74
Excoffier, L., and Lischer, H. E. (2010). Arlequin suite ver 3.5: a new series of programs to perform population genetics analyses under Linux and Windows. Mol. Ecol. Res. 10, 564–567. doi: 10.1111/j.1755-0998.2010.02847.x
Foll, M., and Gaggiotti, O. (2008). A genome scan method to identify selected loci appropriate for both dominant and codominant markers: a bayesian perspective. Genetics 180, 977–993. doi: 10.1534/genetics.108.092221
Freamo, H., O'Reilly, P., Berg, P. R., Lien, S., and Boulding, E. G. (2011). Outlier SNPs show more genetic structure between two Bay of Fundy metapopulations of Atlantic salmon than do neutral SNPs. Mol. Ecol. Res. 11, 254–267. doi: 10.1111/j.1755-0998.2010.02952.x
Gosselin, T. (2016). Assigner: Assignment Analysis with GBS/RAD Data Using R. R Package Version 0.1.9. Available online at: https://github.com/thierrygosselin/assigner
Gutierrez, A. P., Lubieniecki, K. P., Fukui, S., Withler, R. E., Swift, B., and Davidson, W. S. (2014). Detection of Quantitative Trait Loci (QTL) related to grilsing and late sexual maturation in Atlantic Salmon (Salmo salar). Mar. Biotech. 16, 103–110. doi: 10.1007/s10126-013-9530-3
Haasl, R. J., Johnson, R. C., and Payseur, B. A. (2014). The effects of microsatlite selection on linked sequence diversity. Genome Biol. Evol. 6, 1843–1861. doi: 10.1093/gbe/evu134
Hansen, M. M., Meier, K., and Mensberg, K. L. (2010). Identifying footprints of selection in stocked brown trout populations: a spatio-temporal approach. Mol. Ecol. 19, 1787–1800. doi: 10.1111/j.1365-294X.2010.04615.x
Hardy, O. J., and Vekemans, X. (2002). SPAGeDi: a versatile computer program to analyse spatial genetic structure at the individual or population levels. Mol. Ecol. Notes 2:618. doi: 10.1046/j.1471-8286.2002.00305.x
Helyar, S. J., Hemmer-Hansen, J., Bekkevold, D., Tayor, M. I., Ogden, R., Limborg, M. T., et al. (2011). Application of SNPs for population genetics of nonmodel organisms: new opportunities and challenges. Mol. Ecol. Notes 11 (Suppl. 1), 123–136. doi: 10.1111/j.1755-0998.2010.02943.x
Hess, J. E., Campbell, N. R., Close, D. A., Docker, M. F., and Narum, S. R. (2012). Population genomics of Pacific lamprey: adaptive variation in a highly dispersive species. Mol. Ecol. 22, 2898–2916. doi: 10.1111/mec.12150
Joost, S., Kalbermatten, M., and Bonin, A. (2008). Spatial analysis method (SAM): a software tool combining molecular and environmental data to identify candidate loci for selection. Mol. Ecol. Res. 8, 957–960. doi: 10.1111/j.1755-0998.2008.02162.x
Karlsson, S., Moen, T., Lien, S., Glover, K. A., and Hindar, K. (2011). Generic genetic differences between farmed and wild Atlantic salmon identified from a 7K SNP-chip. Mol. Ecol. Res. 11, 247–253. doi: 10.1111/j.1755-0998.2010.02959.x
Lachance, J., and Tishkoff, S. A. (2013). SNP ascertainment bias in population genetic analyses: why it is important, and how to correct it. Bioassays 35, 780–786. doi: 10.1002/bies.201300014
Larson, W. A., Seeb, J. E., Pascal, C. E., Templin, W. D., and Seeb, L. W. (2014). Single-nucleotide polymorphisms (SNPs) identified through genotyping-by-sequencing improve genetic stock identification of Chinook salmon (Oncorhynchus tshawytscha) from western Alaska. Can. J. Fish. Aquat. Sci. 71, 698–708. doi: 10.1139/cjfas-2013-0502
Lemay, M. A., and Russello, M. A. (2015). Genetic evidence for ecological divergence in kokanee salmon. Mol. Ecol. 24, 798–811. doi: 10.1111/mec.13066
Lercher, M. J., and Hurst, L. D. (2002). Human SNP variability and mutation rate are higher in regions of high recombination. Trends Genet. 18, 337–340. doi: 10.1016/S0168-9525(02)02669-0
Li, Y. C., Korol, A. B., Fahima, T., Beiles, A., and Nevo, E. (2002). Microsatellites: genomic distribution, putative functions and mutational mechanisms: a review. Mol. Ecol. 11, 245–2465. doi: 10.1046/j.1365-294X.2002.01643.x
Lo, E., Zhou, G., Oo, W., Afrane, Y., Githeko, A., and Yan, G. (2015). Low parasitemia in submicroscopic Infections significantly impacts malaria diagnostic sensitivity in the highlands of Western Kenya. PLoS ONE 10:e0121763. doi: 10.1371/journal.pone.0121763
Matala, A. P., Ackerman, M. W., Campbell, M. R., and Narum, S. R. (2014). Relative contributions of neutral and non-netural genetics differentiation to inform conservation of steelhead trout across highly variable landscapes. Evol. Appl. 7, 682–701. doi: 10.1111/eva.12174
Meirmans, P., and Van Tienderen, P. H. (2004). Genotype and Genodive: two programs for the analysis of genetic diversity of asexual organisms. Mol. Ecol. Notes 4, 792–794. doi: 10.1111/j.1471-8286.2004.00770.x
Milano, I., Babbucci, M., Cariani, A., Bekkevod, D., Carvalho, G. R., Espineira, M., et al. (2014). Outlier SNP markers reveal fine-scale genetic structuring across European hake populations (Merluccius merluccius). Mol. Ecol. 23, 118–135. doi: 10.1111/mec.12568
Miles, A., Igbal, Z., Vauterin, P., Pearson, R., Campino, S., Theron, M., et al. (2016). Indels, structural variation, and recombination drive genomic diversity in Plasmodium falciparum. Genome Res. 26, 1–12. doi: 10.1101/gr.203711.115
Mobegi, V. A., Loua, K. M., Ahouidi, A. D., Satoguina, J., Nwakanma, D. C., Amambua-Ngwa, A., et al. (2012). Population genetic structure of Plasmodium falciparum across a region of diverse endemicity in West Africa. Malaria J. 11:223. doi: 10.1186/1475-2875-11-223
Morin, P. A., Luikart, G., Wayne, R. K., and the SNP workshop group (2004). SNPs in ecology, evolution and conservation. Trends Ecol. Evol. 19, 208–216. doi: 10.1016/j.tree.2004.01.009
Morin, P. A., Martien, K. K., and Taylor, B. L. (2009). Assessing statistical power of SNPs for population structure and conservation studies. Mol. Ecol. Res. 9, 66–73. doi: 10.1111/j.1755-0998.2008.02392.x
Mu, J., Awadalla, P., Duan, J., McGee, K. M., Joy, D. A., McVean, G. A., et al. (2005). Recombination hotspots and population structure in Plasmodium falciparum. PLoS Biol. 3:e335. doi: 10.1371/journal.pbio.0030335
Mu, J., Awadalla, P., Duan, J., McGee, K. M., Keebler, J., Seydel, K., et al. (2007). Genome-wide variation and identification of vaccine targets in the Plasmodium falciparum genome. Nat. Genet. 39, 126–131. doi: 10.1038/ng1924
Narum, S. R., Banks, M., Beacham, T. D., Bellinger, M. R., Campbell, M. R., Dekoning, J., et al. (2008). Differentiating salmon populations at broad and fine geographical scales with microsatellites and single nucleotide polymorphisms. Mol. Ecol. 17, 3464–3677. doi: 10.1111/j.1365-294X.2008.03851.x
Narum, S. R., and Hess, J. E. (2011). Comparison of Fst outlier tests for SNP loci under selection. Mol. Ecol. Res. 11, 184–194. doi: 10.1111/j.1755-0998.2011.02987.x
Neafsey, D. E., Schaffner, S. F., Volkman, S. K., Park, D., Montgomery, P., Milner, D. A. Jr., et al. (2008). Genome-wide SNP genotyping highlights the role of natural selection in Plasmodium falciparum population divergence. Genome Biol. 9:R171. doi: 10.1186/gb-2008-9-12-r171
Nielsen, J. L., Byrne, A., Graziano, S. L., and Kozfkay, C. C. (2009). Steelhead genetic diversity at multiple spatial scales in a managed basin: snake river, Idaho. N. Am. J. Fish. Manag. 29, 680–701. doi: 10.1577/M08-105.1
Paetkau, D., Slade, R., Burden, M., and Estoup, A. (2004). Genetic assignment methods for the direct, real-time estimation of migration rate: a simulation-based exploration of accuracy and power. Mol. Ecol. 13, 55–65. doi: 10.1046/j.1365-294X.2004.02008.x
Picq, S., Keena, M., Havill, N., Stewart, D., Pouliot, E., Boyle, B., et al. (2017). Assessing the potential of genotyping-by-sequencing-derived single nucleotide polymorphisms to identify the geographic origins of intercepted gypsy moth (Lymantria dispar) specimens: a proof-of-concept. Evol. Appl. 11, 325–339. doi: 10.1111/eva.12559
Piry, S., Alapetite, A., Cornuet, J. M., Paetkau, D., Baudouin, L., and Estoup, A. (2004). GENECLASS2: a software for genetic assignment and first-generation migrant detection. J. Hered. 95, 536–539. doi: 10.1093/jhered/esh074
Platt, A., Horton, M., Huang, Y. S., Li, Y., Anastasio, A. E., Mulyati, N. W., et al. (2010). The scale of population structure in Arabidopsis thaliana. PLoS Genet. 6:e1000843. doi: 10.1371/journal.pgen.1000843
Pritchard, J. K., Stephens, M., and Donnelly, P. (2000). Inference of population structure using multilocus genotype data. Genetics 155, 945–959.
Pyhäjärvi, T., Hufford, M. B., Mezmouk, S., and Ross-Ibarra, J. (2013). Complex patterns of local adaptation in Teosinte. Genome Biol. Evol. 5, 1594–1609. doi: 10.1093/gbe/evt109
Queirós, J., Godinho, R., Lopes, S., Gotazar, C., de la Fuente, J., and Alves, P. C. (2015). Effect of microsatellite selection on individual and population genetic inferences: an empirical study using cross-specific and species-specific amplifications. Mol. Ecol. Resour. 15, 747–760. doi: 10.1111/1755-0998.12349
Ranford-Cartwright, L. C., and Mwangi, J. M. (2012). Analysis of malaria parasite phenotypes using experimental genetic crosses of Plasmodium falciparum. Int. J. Parasitol. 42, 529–534. doi: 10.1016/j.ijpara.2012.03.004
Rannala, B., and Montain, J. L. (1997). Detecting immigration by using multilocus genotypes. Proc. Natl. Acad. Sci. U S A. 94, 9197–9201. doi: 10.1073/pnas.94.17.9197
Reilly Ayala, H. B., Wacker, M. A., Siwo, G., and Ferdig, M. T. (2010). Quantitative trait loci mapping reveals candidate pathways regulating cell cycle duration in Plasmodium falciparum. BMC Genomics 11:577. doi: 10.1186/1471-2164-11-577
Riahi, L., Zoghlami, N., Fournier-Level, A., Dereeper, A., Cunff, L. L., Laucou, V., et al. (2013). Characterization of single nucleotide polymorphism in Tunisian grapevine genome and their potential for population genetics and evolutionary studies. Genet. Resour. Crop Evol. 60, 1139–1151. doi: 10.1007/s10722-012-9910-y
Rice, W. R. (1989). Analyzing tables of statistical tests. Evolution 43, 223–225. doi: 10.1111/j.1558-5646.1989.tb04220.x
Rousset, F. (2008). Genepop'007: a complete re-implementation of the genepop software for Windows and Linux. Mol. Ecol. Res. 8, 103–106. doi: 10.1111/j.1471-8286.2007.01931.x
Rozas, J., Sánchez-DelBarrio, J. C., Messeguer, X., and Rozas, R. (2003). DNA polymorphism analyses by the coalescent and other methods. Bioinformatics 19:2496. doi: 10.1093/bioinformatics/btg359
Samad, H., Coli, F., Preston, M., Ocholla, H., Fairhurst, R. M., and Clark, T. G. (2015). Imputation-based population genetics analysis of Plasmodium falciparum malaria parasites. PLoS Genet. 11:e1005131. doi: 10.1371/journal.pgen.1005131
Samarakoon, U., Regier, A., Tan, A., Desany, B. A., Collins, B., Tan, J. C., et al. (2011). High-throughput 454 resequencing for allele discovery and recombination mapping in Plasmodium falciparum. BMC Genomics 12:116. doi: 10.1186/1471-2164-12-116
Sanchez, J. J., Philips, C., Borsting, C., Balogh, M., Bogus, M., Fondevila, M., et al. (2006). A multiplex assay with 52 single nucleotide polymorphisms for human identification. Electrophoresis 27, 1713–1724. doi: 10.1002/elps.200500671
Schlotterer, C. (2004). The evolution of molecular markers–just a matter of fashion? Nat Rev Genet. 5, 63–69. doi: 10.1038/nrg1249
Sellars, M. J., Dierens, L., McWilliam, S., Little, B., Murphy, B., Coman, G. J., et al. (2014). Comparison of microsatellite and SNP DNA markers for pedigree assignment in Black Tiger shrimp, Penaeus monodon. Aqua. Res. 45, 417–5426. doi: 10.1111/j.1365-2109.2012.03243.x
Smouse, P. E., and Peakall, R. (1999). Spatial autocorrelation analysis of multi-allele and multi-locus genetic microstructure. Heredity 82, 561–573. doi: 10.1038/sj.hdy.6885180
Storer, C. G., Pascal, C. E., Roberts, S. B., Templin, W. D., Seeb, L. W., and Seeb, J. E. (2012). Rank and order: evaluating the performance of SNPs for individual assignment in a non-model organism. PLoS ONE 7:e49018. doi: 10.1371/journal.pone.0049018
Su, X., Ferdig, M. T., Huang, Y., Huynh, C. Q., Liu, A., You, J., et al. (1999). A genetic map and recombination parameters of the human malaria parasite Plasmodium falciparum. Science 286, 1351–1353. doi: 10.1126/science.286.5443.1351
Su, X., Hayton, K., and Wellems, T. E. (2007). Genetic linkage and association analyses for trait mapping in Plasmodium falciparum. Nat. Rev. Genet. 8, 497–506. doi: 10.1038/nrg2126
Sunyaev, S., Ramensky, V., and Bork, P. (2001). Towards a structural basis of human non-synonymous single nucleotide polymorphisms. Trends Genet. 16, 198–201. doi: 10.1016/S0168-9525(00)01988-0
Sylvester, E. V. A., Bentzen, P., Bradbury, I. R., Clément, M., Pearce, J., Horne, J., et al. (2018). Applications of random forest feature selection for fine-scale genetic population assignment. Evol. Appl. 11, 153–165. doi: 10.1111/eva.12524
Tabangin, M., Woo, J. G., and Martin, L. J. (2009). The effect of minor allele frequency on the likelihood of obtaining false positives. BMC Proc. 3:S41. doi: 10.1186/1753-6561-3-S7-S41
Tanabe, K., Mita, T., Jombart, T., Eriksson, A., Horibe, S., Palacpac, N., et al. (2010). Plasmodium falciparum accompanied the human expansion out of Africa. Curr. Biol. 20, 1283–1289. doi: 10.1016/j.cub.2010.05.053
Trong, Q. T., van Bers, N., Crooijmans, R., Dibbits, B., and Komen, H. (2013). A comparison of microsatellites and SNPs in parental assignment in the GIFT strain of Nile tilapia (Oreochromis niloticus): the power. Aquaculture 388, 14–23. doi: 10.1016/j.aquaculture.2013.01.004
Van-Der Merwe, A. B., Blaauw, S., Plessis, J. D., and Roodt-Wilding, R. (2013). Transciptome-wide single nucleotide polymorphisms (SNPs) for Abalone (Haliotis midae): validation and application using golden-gate medium-throughput genotyping assays. Int. J. Mol. Sci. 14, 19431–19360. doi: 10.3390/ijms140919341
Volkman, S. K., Sabeti, P. C., DeCaprio, D., Neasfey, D. E., Schaffner, S. F., Milner, D. A. Jr., et al. (2007). A genome-wide map of diversity in Plasmodium falciparum. Nat. Genet. 39, 113–120. doi: 10.1038/ng1930
Waples, R. S., and Gaggiotti, O. (2006). What is a population? An empirical evaluation of some genetic methods for identifying the number of gene pools and their degree of connectivity. Mol. Ecol. 15, 1419–1439. doi: 10.1111/j.1365-294X.2006.02890.x
Weir, B. S., and Cockerham, C. (1984). Estimating F-statistics for the analysis of population structure. Evolution 38, 1358–1370. doi: 10.1111/j.1558-5646.1984.tb05657.x
Xing, J., Watkins, W. S., Witherspoon, D. J., Zhang, Y., Guthery, S. L., Thara, R., et al. (2009). Fine-scaled human genetic structure revealed by SNP microarrays. Genome Res. 19, 815–825. doi: 10.1101/gr.085589.108
Yalcindaga, E., Elgueroa, E., Arnathaua, C., Durand, P., Akiana, J., Anderson, T. J., et al. (2012). Multiple independent introductions of Plasmodium falciparum in South America. Proc. Natl. Acad. Sci. U S A. 109, 511–516. doi: 10.1073/pnas.1119058109
Yousefi, S., Addassi-Daloii, T., Kraaijenbrink, T., Vermaat, M., Mei, H., van't Hoi, P., et al. (2018). A SNP panel for identification of DNA and RNA specimens. BMC Genomics. 19:90. doi: 10.1186/s12864-018-4482-7
Keywords: assignment rate, high performance SNPs, human malaria parasite, microsatellites, population clustering
Citation: Lo E, Bonizzoni M, Hemming-Schroeder E, Ford A, Janies DA, James AA, Afrane Y, Etemesi H, Zhou G, Githeko A and Yan G (2018) Selection and Utility of Single Nucleotide Polymorphism Markers to Reveal Fine-Scale Population Structure in Human Malaria Parasite Plasmodium falciparum. Front. Ecol. Evol. 6:145. doi: 10.3389/fevo.2018.00145
Received: 18 January 2018; Accepted: 04 September 2018;
Published: 26 September 2018.
Edited by:
Nikolaos Papadopoulos, University of Thessaly, GreeceReviewed by:
Shu-Jun Wei, Beijing Academy of Agricultural and Forestry Sciences, ChinaJaime Ashander, University of California, Los Angeles, United States
Copyright © 2018 Lo, Bonizzoni, Hemming-Schroeder, Ford, Janies, James, Afrane, Etemesi, Zhou, Githeko and Yan. This is an open-access article distributed under the terms of the Creative Commons Attribution License (CC BY). The use, distribution or reproduction in other forums is permitted, provided the original author(s) and the copyright owner(s) are credited and that the original publication in this journal is cited, in accordance with accepted academic practice. No use, distribution or reproduction is permitted which does not comply with these terms.
*Correspondence: Eugenia Lo, ZXVnZW5pYS5sb0B1bmNjLmVkdQ==
Guiyun Yan, Z3VpeXVueUB1Y2kuZWR1